Embed Size (px)
Citation preview

ELSEVIER Electroencephalography and clinical Neurophysiology 95 (1995) 277-292
o
ERP signs of early selective attention effects to check size
A. Zani a,*, A.M. Proverbio b
lstituto di Psicologia, Consiglio Nazionale delle Ricerche, Viale Marx 15, O0137 Rome, Italy b Dipartimento di Psicologia Generale, Unit,ersith di Padova, Padua, Italy
Accepted for publication: 3 April 1995
Abstract
In ERP literature on visual selective attention evidence has been provided that selectively directing attention to a spatial frequency affects the visual processing of the attended frequency, and of unattended frequencies within the same channel bandwidth, starting at a relatively late level of post-stimulus processing, i.e., after about 150 msec. Nevertheless, little knowledge is available about the topographic distribution of these attention effects. This study investigated attentional selection of stimulus relative size at occipital and latero-occipital sites, as well as at fronto-lateral sites.
ERPs from posterior scalp electrode sites showed that attention to check sizes enhanced the early sensory components, thus indicating that feature-based attention may result in a modulation of sensory processing. Comparisons of the ERPs to relevant and irrelevant patterns showed an enhanced latero-occipital Pgo positivity as well as an occipital Nll 5 negativity to relevant patterns, thus also suggesting possible differential mechanisms of early attentional selectivity at these locations. Later effects of attention consisted of a selection negativity to relevant patterns at posterior electrodes, and a selection positivity at latero-frontal sites. A larger late positivity to irrelevant patterns at anterior sites also suggested an active suppression of attentional response to irrelevant information.
Moreover, right-and left-sided asymmetries were found to be respectively consistent for the Pgo and N115 with left hemispheric specialization for high, and right hemispheric specialization for low spatial frequencies. A stronger left-sided attentional selectivity has also been found.
Keywords: Early selective attention; Event-related potentials; Spatial frequency channels; Hemispheric asymmetries; Arousal
I. Introduction
It is generally acknowledged that object recognition is accomplished through the decomposition of the visual image into its spatial frequency components (Kulikowski et al., 1982; Ginsburg, 1986). Strong neurophysiological support for this spatial frequency filter model of vision has come from the demonstration of: (1) the spatial frequency selectivity of single cells in mammalian visual cortex (Maffei and Fiorentini, 1973; De Valois et al., 1978), and (2) the organization of cells with a similar spatial fre- quency selectivity (e.g., a similar receptive field organiza- tion) in columns forming a neuro-anatomical substrate for the independent size-specific sensitive channels proposed
* Corresponding author. Tel.: + 39 6 86090224; Fax: + 39 6 824737; E-mail: [email protected].
at the very outset by Blakemore and Campbell (1969) and Campbell and Maffei (1970). Thus, the analysis of visual information into its spatial frequency components has gained popularity as a tool for understanding the function- ing of the visual system. However, with few exceptions, most of the research adopting this model of spatial vision based on a multiple size-tuned channel approach has pro- gressed with the implicit bottom-up assumption that these channels unselectively take in all aspects of the stimulus presented to them. Conversely, relatively few attempts have been made to relate these size-specific channels to stimulus selection mechanisms.
Harter and Previc (1978) first attempted to assess the effects of selective attention on the activity of cortical size channels, or how selectively a relevant size-specific pattern could be attended. They found an increase in amplitude of the selection negativity (SN) to check sizes attended and responded to, which generalized to adjacent check sizes.
0013-4694/95/$09.50 © 1995 Elsevier Science Ireland Ltd. All rights reserved SSDI 0 0 1 3 - 4 6 9 4 ( 9 5 ) 0 0 0 7 8 - X EEG 93718
278 A. Zani, A.M. Proverbio / Electroencephalography and clinical Neurophysiology 95 (1995) 277-292
The greater the discrepancy in size between the attended check and the one actually presented, the smaller the SN. Interestingly enough, the bandwidth of such attention size tuning, as determined by ERP component amplitude, was larger for its earlier onset phase (about 160 msec) than for its later phase (about 260 msec), thus suggesting a progres- sive narrowing in the course of processing. Harter and Guido (1980) investigated attention to pattern orientation using 3 different stimuli: a diffuse flash, a grating with horizontal bars, and a grating with vertical bars. Pattern attention effects (i.e., diffuse flash vs. gratings, regardless of stimulus orientation) consisted of an occipital negativity starting at 150 msec (150-250 msec). A later negativity (180-300 msec) was found for grating orientation selec- tion. Similarly, Rugg et al. (1987) found an attention effect to bar orientation consisting of a late 200-400 msec latency fronto-central negativity. Previc and Harter (1982) investigated the effects of conjunction of orientation and spatial frequency. Attention effect resulted in an increase of ERP negativity in the range of 175-250 msec. The effects of attention to spatial frequency appeared slightly earlier in onset latency than the effects of attention to orientation. Interestingly, the effects of conjunction of both stimulus features were found to occur later in time than the single feature-specific effects. In a similar study on selec- tive attention to conjunction of spatial frequency and orien- tation, Kenemans et al. (1993) found a selection negativity starting after 200 msec at occipital locations, together with a frontal (Fz) selection positivity in the 150-200 msec post-stimulus range, and a vertex N2b in the 200-250 msec range.
Overall, the studies reviewed above indicate that spatial frequency channels actively mediate attentional selectivity of sensory information within the visual system. This selectivity can start as early as 150-180 msec post-stimu- lus latency. Unfortunately, so far little knowledge has been available on the topographical distribution of these size- specific attention effects. In fact, with the sole exception of the study of Kenemans et al. (1993), these effects have been investigated only at the midline brain electrode loca- tions. In relation to this, the purpose of the present study was 3-fold. First, we sought to gain some knowledge of the scalp distribution of these attention effects in response to check size at occipital and lateral frontal areas. Second, the differential activation of these areas as a function of spatial frequency was investigated directly. In fact, evi- dence has been provided of differences in the location and orientation of the best-fitting equivalent current dipole (ECD) as a function of spatial frequency of the evoking stimulus (Aine et al., 1990). Lastly, a possible asymmetric distribution of attention size-specific effects in left vs. right hemisphere was investigated from the angle of the current model of hemispheric asymmetries in spatial frequency processing (e.g., Sergent and Hellige, 1986) suggesting a RH specialization for low spatial frequencies and LH specialization for high spatial frequencies.
2. Methods
2.1. Subjects"
Ten healthy subjects (6 males and 4 females; age range 23-36 years) served as paid volunteers in the present experiment. Since 1 subject had to be rejected for too many eye movement contaminated trials, the data of only 9 subjects will be discussed. All subjects were right-handed as attested by a self-report questionnaire, and had normal vision or a mild myopia corrected-to-normal.
2.2. Stimuli
Random series of 6 isoluminant black-and-white checkerboard patterns with check sizes of 5, 6 and 40", 10, 20, 40 and 60 min of arc, respectively, were presented. At a viewing distance of 114 cm these patterns produced stimulation at spatial frequencies of 6, 4.5, 3, 1.5, 0.75 and 0.5 cycles/degree of visual angle (cpd) respectively. This range of check sizes was chosen to investigate the effects of selective attention on a reasonably large span of high- to-low spatial frequency channels. Checkerboards had EGA graphic resolution and were sequentially presented in pat- tern onset mode centered on the high-resolution screen of a 386SX IBM-compatible microcomputer (Stimulator) under the remote control of a 386 IBM-compatible microcom- puter (Master). Owing to the superimposition of a black mask with a central rectangular patch over the stimulator screen, stimulus display subtended 8°(w)× 6°(h) at the eye. Thus, both foveal and parafoveal retinal fields were stimulated. Checkerboard pattern contrast was 50% and presentation duration 100 msec. The patterns were re- placed for an interval randomly varied between 1 and 1.5 sec (ISI) by an isoluminant grey screen (on-off). Stimulus and background had an equal average luminance to avoid flash stimulation. The mean luminance at the observer location was about 0.2 /,/,W/cm 2.
2.3. Procedure
Following electrode application subjects sat inside a sound-attenuated, electrically shielded cubicle from which they were instructed to binocularly fixate through a win- dow on a small red dot in the center of the stimulator visual display. The experiment was run under near-dark viewing conditions. Different experimental conditions were administered in randomized order for each subject: a pas- sive stimulus gazing condition, and an active size-specific selective attention condition for each of the 6 check size patterns. In the passive condition subjects simply had to fixate the center of the screen and look at the stimuli without paying attention to any of them. Prior to each selective attention condition run, subjects were instructed to selectively attend a specific check size and to ignore the others. Thus, although attention was shifted, the physical

A. ZanL A.M. Prouerbio / Electroencephalography and clinical Neurophysiology 95 (1995) 277-292 279
stimuli remained unchanged. Subjects indicated size- specific pattern detection by pressing a button, also allow- ing their reaction time (RT) to be recorded. Experimental instructions emphasized both speed and accuracy of re- sponse. In order to assure a high level discrimination performance, prior to the beginning of experimental recording each subject was put through a training session. He/she was repeatedly shown sequences of the 6 checker- board patterns arranged in order of size, and the experi- ment started only when he/she signalled that they could discriminate between them. During the training subjects received feedback about their accuracy and speed of re- sponse. Given that the task was moderately difficult, sub- jects were discouraged from responding too quickly to the detriment of accuracy.
For each of the attention conditions, 4 blocks of 150 trials were replicated. During a block of trials, the 6 stimulus patterns were randomly interleaved and repeated 25 times. Trial order changed randomly from block to block. In 2 of the 4 blocks, subjects pushed the detection- RT button with the forefinger of the right hand, whereas in the other 2 blocks they used the forefinger of the left hand. The order of the hands was counterbalanced across sub- jects. Unlike the attention runs, 6 blocks of trials were
replicated for the passive gazing condition, each with a different trial random order. For both the passive gazing condition and the attention condition, each block was initiated by the experimenter after subject's fixation of the screen was assured.
2.4. ERP recording
EEGs were recorded from standard occipital O 1 and 0 2 and non-standard latero-occipital O L and O R sites (O~ and 0 2 + 10% of the distance between inion and nasion on the left and right side respectively). In addition, EEGs were also recorded from F 7 and F 8 fronto-lateral locations. Linked earlobes were used as a reference and the forehead as ground. Two additional electrodes were placed just below and above the right eye to monitor EOG artefacts. Both EEG and EOG were amplified with a bandpass of 0.16-50 Hz, starting 100 msec pre stimulus and continuing for 500 msec thereafter. Amplifier gain for the EOG was 0.5 times that for EEG. Both signals were digitized on-line by the Master microcomputer at a rate of 426 samples/sec, and stored on hard disk. Data were then transferred to back-up tape for permanent storage. Stored data were computer averaged off-line. Computerized artefact rejec-
10' 60'
N 115f 165 N270
01 O R
Tf,,', , , ! / L , ',,'
-1 ,'", ,'
T,,, 200 400 msec Pgo
REL P4oo IRREL
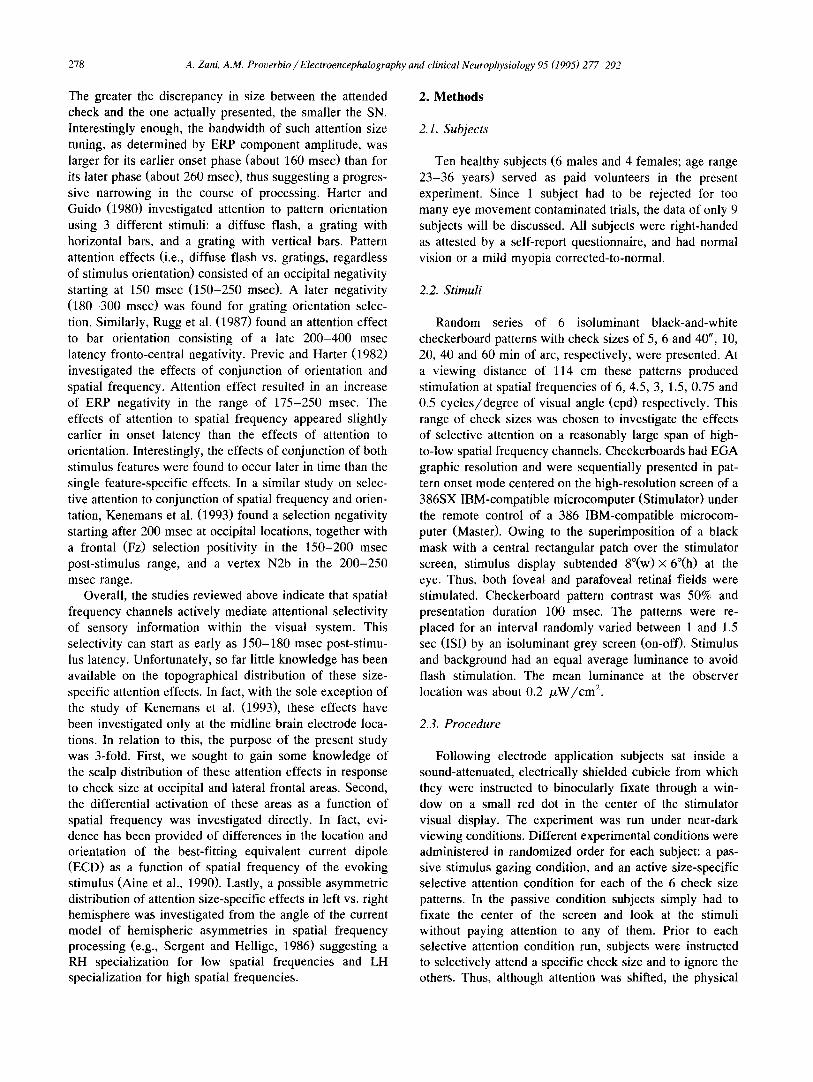
Fig. 1. Examples of ERP components prominent at left medio-and right latero-occipital locations. Here are shown ERPs to 10' and 60' check sizes. Continuous lines represent responses to these patterns when relevant (REL). Dashed lines represent responses to the same stimuli when irrelevant (IRREL), the 40' and 10' being now relevant.

280 A. Zani, A.M. Proverbio / Electroencephalography and clinical Neurophysiology 95 (1995) 277-292
tion was performed during averaging to discard epochs in which eye movements, blinks, excessive muscle potentials or amplifier blocking occurred. Artefact rejection criteria were: peak-to-peak amplitude exceeding 80 /xV for EOG, and 100/xV for EEG. The artefact rejection rate was about 5%. In addition, ERP trials associated with an incorrect behavioral reaction time response (miss or false alarm) were also rejected. Hence, ERPs to attended patterns re- sponded to 100% of the time and ERPs to unattended patterns responded to 0% of the time were obtained. This enabled a more direct comparison between attended and unattended ERPs obtained from different conditions avoid- ing the confusing effects of frequency of behavioral re- sponses. A count of these incorrect responses in each selective attention condition was kept for the purpose of analyzing subjects' target selective discrimination perfor- mance. For each subject, separate average ERPs to pattern onset were obtained for the 6 checkerboard patterns when relevant and irrelevant in the 6 attention conditions, and when neutral in the passive gazing condition. For each check size, separate ERPs grand-averaged across all 5 of the attention tasks in which it was irrelevant were also obtained.
2.5. Data analysis
ERP component peak amplitude was automatically quantified by computer with reference to the baseline
voltage averaged over the 100 msec interval preceding stimulus onset. Overall, at posterior electrodes peak ampli- tudes were measured according to the following criteria: the most positive deflection between 70 and 110 msec (Pg0), between 180 and 260 msec (P225), and between 300 and 480 msec (P400), and the most negative deflection between 80 and 130 msec (Nil5), between 135 and 210 m s e c (N165) , and between 215 and 310 m s e c (N270) (see Fig. 1). At frontal electrode sites a N240 component was measured between 180 and 280 msec, together with a P225 between 180 and 260 msec, and a P400 between 300 and 480 msec. The measurement latency windows for all com- ponents were centered on their peak latency in the grand average wave forms. The same windows were used for all subjects.
Repeated-measures analyses of variance (ANOVAs) were performed on each component for each attention condition and separately for posterior and anterior elec- trodes. For posterior electrodes, attention condition (rele- vant, irrelevant, and neutral), check size (6 levels), hemi- sphere (left vs. right), and electrode laterality (medial vs. lateral) were considered as factors. For anterior electrodes, factors were attention condition (3 levels), check size (6 levels) and hemisphere (left vs. right). Reported P values are corrected on the basis of the Greenhouse-Geisser ep- silon adjustment for repeated measures designs whenever the latter was less than 0.85 (Jennings and Wood, 1976). Tukey tests were carried out for multiple comparisons.
s i z e OL 01 02
6'40" --- - ' - -
I I I I ', I I I I I I I I I I I I I 2 U_.5FV 75msec
Fig. 2. Grand-average ERPs as a function of check size (min of arc) at medial and lateral occipital locations for the passive gazing condition. Note the size-specific polarity reversal occurring in the 70-120 msec latency range at O 1 and 0 2 electrode sites in response to large vs. small check sizes.

A. Zani, A.M. ProL~erbio / Electroencephalography and clinical Neurophysiology 95 (1995) 2 77-292 281
Table l F values and significance levels in the ANOVAs
ERP com- Main
ponents C ~ E b H b
Interactions
C X E a C x H a
P*~o (8"28)0025
1,11
Ntl:, (3.63) . . . . .
1,11
N1~,5 P225 (3.63)0o5
2,19
N27 o P400 (8.41)ll.ol).~
2. 19
(6.20) 003 _ (15.63)°.°°5(8.79) °In
1,8 1,9 2 ,13 (22.04)°1)°1(5.54) T M (7.83) 0.0o5 _
1,8 1,8 2 ,14
m
m
F values and significance levels for check size (C), electrode locations (E), and hemisphere (H) factors. Greenhouse-Geisser adjusted degrees of freedom (dfs) are listed below the F values. Dfs before adjustment were: a = 5, 40; b = 1, 8. Note that significance levels reported are relative to adjusted dfs.
3. Results
3.1. Posterior electrodes
Check size effects In Fig. 2 are displayed the across-subjects grand-aver-
aged ERPs to the 6 check sizes recorded during the passive
gazing condition. As can be clearly seen, the wave forms are characterized by sequences of peaks that vary in morphology as a function of scalp location and check size. At O 1 and 0 2 electrodes, in fact, larger check sizes, i.e., 60', 40' and 20', elicited a prominent positive deflection which showed an early onset latency and peaked on aver- age at 90 msec, i.e., P90 or P~. This early positivity was followed by a small somewhat later negative deflection which increased in amplitude as check size decreased. This component reached its maximum amplitude with smaller check sizes, and peaked on average at 115 msec, i.e., N~I 5, notwithstanding its early onset after the stimulus. This resulted in a polarity reversal in the P1 latency range, i.e., P9o-N115. Thus, the electrophysiological response of the visual system to pattern onset of large vs. small check sizes seems to be characterized by a clear-cut feature- specific polarity reversal at the earliest sensory levels. Such a polarity reversal could not be appreciated at lateral O L and O R locations, thus suggesting a neuro-topographic specificity. At the latter locations, all check sizes elicited a P90, although it was drastically reduced in amplitude with smaller check sizes, especially at OL location. A small deflection was also observable in the latency range of Nl15, probably due to the volume conduction of this component, prominent at contiguous medial locations. Overall, this spatial frequency-dependent change in polar- ity exhibited by medial occipital locations lends further
size
60'
40'
20'
10'
6'40"
1
0 L 01 0 2 OR,
Att. 60'
---Att. 10'
..... Att. 5'
75msec Fig. 3. Grand-average ERPs as a function of check size (min of arc) at medio-and latero-occipital locations when attention had to be paid to 60', 10', and 5' checks. Of note is the appearance of prominent long latency endogenous N270 and P400 components related to attention selection of relevant and adjacent check sizes.

282 A. Zani, A.M. Proverbio / Electroencephalography and clinical Neurophysiology 95 (1995) 277-292
support to the view that the posit ive-negative-posit ive (P- N-P) sequence generally seen in conventional VEPs to patterned stimuli (Jeffreys and Axford, 1972) is not a unitary complex but depends on pattern spatial frequency. This view was first suggested by Bodis-Wollner et al. (1989) and later further supported by Aine et al. (1990) by means of magnetic field data.
Statistical analyses confirmed these eyeball impres- sions. Table 1 summarizes the results for check size, electrode, and hemisphere factors in the ANOVAs.
Poo component. Simple comparisons for the main effect of check size factor showed that, on the whole, the P9o was significantly greater with the 3 larger than with the 3 smaller check sizes. The main effect of electrode indicated that this posit ivity was larger at lateral than at medial occipital locations. Post hoc analyses for the significant check size × electrode interaction testified that this was due to the fact that, unlike lateral occipital locations, medial locations were characterized by a polarity reversal as a function of check size, resulting in a considerable decrease in amplitude of this positivity. In fact, at O 1 and
0 2 locations P90 was maximal with larger check sizes, decreased substantially in amplitude with 10' checks, and inverted polarity with the smaller 6'40" and 5' check sizes.
Nll 5 component. Post hoc analyses of the check size × electrode interaction for this component confirmed that, while almost lacking at lateral occipital locations, it in- creased in amplitude as a function of the decrease in check size at medial locations. At these locations, in fact, NH5 amplitude was largest with 10', 6'40" and 5', decreased with 20' and 40', and was almost negligible with 60' checks, as can be seen in Fig. 2. Overall, this resulted in the N~t 5 being significantly larger at medial than at lateral locations.
P225 component. The check size main factor signifi- cantly affected the amplitude of this component. Single comparisons for this main effect showed that 10' and 20'
elicited a larger P225 than both larger and smaller check sizes, in agreement with what was reported by earlier studies on check size processing (Rietveld et al., 1967; Harter and White, 1970). This was true both in passive gazing (see Fig. 2) and in active selection conditions (see Fig. 3).
Check size-related hemispheric asymmetries 1"9o component. A differential hemispheric asymmetry
as a function of check size was evident in this latency range as suggested by the interaction of check size hemisphere. Post hoc analyses revealed that a considerable decrease in this early positivity going from larger to smaller check sizes was evident at the LH only ( P < 0.01). A simple effects analysis also indicated that, independent of attention condition and check size, this early positivity was larger at the right than at the left latero-occipital site ( P < 0.03).
Nll 5 component. As can be seen in Table 1, the A N O V A yielded a hemispheric asymmetry, as this component was larger in the LH than in the RH, whatever the attention condition. The main effect of the hemisphere was further confirmed by a separate A N O V A in which the LH versus RH amplitudes were compared only for the smaller check sizes (F1, ~ = 4.92, P < 0.05; • = 1).
Attention effects Unlike the passive gazing or neutral condition, the
active selection conditions elicited ERP wave forms char- acterized by a more complex morphology. This was due mainly to the appearance of both a prominent late latency
endogenous N270 negativity, identified as the selection negativity of Harter and Previc (1978), and a large P400 or P3b component to relevant and adjacent check sizes that the subjects had been instructed to ignore. As a whole, these components indexed a size-specific selective attention
Table 2 F values and significance levels for the attention comparisons in the ANOVAs
ERP components Main Interactions
m a Rel vs. irrel Rel vs. neu Irrel vs. neu A × E a A × C h A × H a m × C × H × E b
Pgo (3.95) .... - - - (7.85) o.0o5 - - - 1, 10 2, 16
NIl 5 (7.78) 0.044 0.01 0.01 0 . 0 5 . . . . 2, 16
N165 (34.17) 0.0000 n.s. 0.01 0.01 (7.74) 0.025 - - (2.37) 0.05 1, 11 l, 10 2, 60
P225 (15.74) 0.0002 n.s. 0.01 0.01 (3.63) 0.05 - - 2, 13 2, 16
Sel. neg. (22.25) °'°°°° 0.01 0.01 0 . 0 1 . . . . 2, 14
P4oo (6.96) 0.025 0.05 0.01 0.05 - (4.31) °'°1 (4.76) 0.025 - 1, 11 4, 30 2, 16
Greenhouse-Geisser adjusted degrees of freedom (dfs) are listed below the F values. Dfs before adjustment were: a = 2, 16; b = 10, 80. Factors were: A = attention condition, E = electrode location, C = check size. Specific pairwise comparisons with 1 df are presented for the cases in which the main effect of attention was significant: Rel = relevant; Irrel = irrelevant; Neu = neutral. Note that significance levels reported are relative to adjusted dfs.

A. Zani, A.M. Proverbio / Electroencephalography and clinical Neurophysiology 95 (1995) 277-292 283
Table 3 Peak amplitude values of the first sensory component (P9o for large check sizes at all electrode sites and for small check sizes -10', 6'40", and 5' -at OL and OR, Nu5 for small check sizes at 01 and 02) in the different attention conditions (R = relevant; I = irrelevant; N = neutral). Note that the amplitude values for the irrelevant (I) condition are grand-average values over all 5 attention tasks in which the check size was irrelevant
Check size (min) Electrode locations
OL O 1 02 OR
R I N R I N R I N R I N
60' 3.98 3.86 2.95 3.18 3.52 2.84 3.64 3.64 2.84 3.(t7 2.90 2.61 40' 3.86 3.70 3.07 2.50 2.73 2.50 2.95 3.41 2.73 3.41 3.18 2.73 20' 3.86 3.86 2.84 1.36 1.70 1.02 2.5 2.95 2.16 3.75 3.29 2.81 10' 2.61 1.82 1.93 -5 .0 -4 .54 -2 .5 -4 .77 -4 .40 -3 .07 3.41 2.95 3.29 6'40" 1.93 1.7(1 1.59 - 5.0 - 4.66 - 3.52 - 4.77 - 4.32 - 3.18 3.18 3.07 2.95 5' 1.59 1.48 0.8 -3 .75 - 3 . 4 l -3 .29 -3 .52 -2.95 -3 .07 3.29 3.29 2.95
modulation of visual cortex processing activity. Examples of these attention effects for 60', 10' and 5' attended conditions are depicted in Fig. 3. It can be clearly seen that, independent of the attention condition, the bandwidth of the selective attention effect narrowed during the pro- cessing time course, with stimuli having check sizes quite different from the target size eliciting less SN and P3b than closer check sizes. These findings are in full agreement with those of Harter and Previc (1978). However, as scrutiny of Fig. 3 makes clear, some attentional selectivity was evident as early as the sensory level of post-stimulus
processing, thus suggesting an attention modulation of size-specific P90 and Nu5 sensory components. These general impressions were supported by statistical analyses. Table 2 summarizes the ANOVA results for attention, both as a main factor and in interaction with other factors.
1"9o component. Post hoc analyses of the attention condition × electrode site interaction indicated that this early positivity was differentially affected by selective attention at medio-and latero-occipital locations. Overall, the P90 was significantly larger to both relevant and irrele- vant than to neutral patterns at all posterior electrodes, as
--REL i",, ---IRR-Att.IO'
. . . . .
6 0 ' " " ^ ' " ::
-I~V " ..... ,t; i .+ . ,,,,, : , - -
it I I I ":
300ms. Fig. 4. Top: across-subjects grand-averaged ERPs to 60' checks when relevant (REL), irrelevant (IRR) because 10' checks were now relevant, and passively viewed (NEU). As can be seen, in the Pg0 latency range attention effects for large check sizes consisted in an enhanced negativity to relevant patterns at the medio-occipital locations, and an enhanced positivity at the latero-occipital electrodes. Bottom: across-subjects grand-averaged ERPs to 6'40" checks when relevant (REL), irrelevant (IRR) because 20' checks were now relevant, and passively viewed (NEU). Note that with smaller check sizes attention enhanced the N u s component to relevant stimuli at the medio-occipital locations.

284 A. Zani, A.M. Proverbio / Electroencephalography and clinical Neurophysiology 95 (1995) 277-292
a
60'
401 ,~ _.. .T_ , ; " ,
- - _ ~ k / '
2 o ,
01 ., 02
' " '
J
- ~ 1 I -
- - R E ~ 200ms ---IRREL
b
614o" ~
_ L v I i ~1
; \ I
- ' - __E \ , ' ' - '
r ~
r v / w I I !
._1._
___.T~, / , v , __ ~ "',,"" - L V ' ---_L ' ' - _ L v ' '
I I
,
- - - I V ,
,2 Fig. 5. Grand-average ERPs to relevant (REL) and irrelevant (IRREL) patterns for (a) larger and (b) smaller check sizes (min of arc) at posterior locations. ERPs to irrelevant patterns are collapsed across the attention tasks. Note that the ERPs to irrelevant stimuli consist of grand-averaged ERPs to stimuli which fall both inside and outside the bandwidth of the relevant size, thus causing a reduction of the early attention effects.

A. Zani, A.M. Proverbio / Electroencephalography and clinical Neurophysiology 95 (1995) 277-292 285
Table 4 Averaged amplitude values for the first sensory component collapsed over the largest and smallest check sizes (P90 for the largest check sizes at all electrode sites and for the smallest check sizes - 10', 6'40", and 5' - at OL and OR, Nil 5 for the smallest check sizes at 01 and 02) in the different attention conditions (R = relevant; I = irrelevant; N = neutral). Note that for each check size in the 2 sub-groups the amplitude values for the irrelevant condition (I) were grand-averaged over all 5 attention tasks in which it was irrelevant.
Electrode locations
OL 0 i 02 OR
R I N R I N R I N R I N
Largest check sizes (60', 40', 20') 3.90 3.80 2.95 2.35 2.65 2.12 3.03 3.33 2.59 3.41 3.12 2.72 Smallest check sizes (10', 6'40", 5') 2.03 1.66 1.46 - 4.85 - 4.20 - 3.10 - 4.35 - 3.89 - 3.10 3.29 3.10 3.06
can be seen in Table 3. Nevertheless, further single com- parisons showed that at lateral locations stimulus selection also yielded a larger positivity to relevant than to irrelevant patterns ( P < 0.001). Conversely, at medial locations the comparisons showed a larger negativity to relevant than to irrelevant stimuli ( P < 0.01). Overall, these results were independent of check size. As can be observed in Table 3, when attention was allocated to large check sizes, at
medial locations relevant large checks elicited on average a more negative P9o than irrelevant ones. An example of these effects for 60' checks is displayed on a larger scale in the top portion of Fig. 4. To further confirm the reliability of P9o early attention effects, a separate ANOVA was performed comparing relevant vs. irrelevant P9o ampli- tude values obtained for the 3 largest check sizes at latero-occipital sites, where Pg0 was most prominent. A
size F7
60'
40'
20'
I0'
6'40"
5'
2.5 VF
.,,,, " : : ,
_
I I I I I I I I I I I I
L. .L ~,
. , , . , -
',**~ i ' , , ° .°°
Air. 60' ---Art. 10' ...... Art. 5'
75msec Fig. 6. Grand-average ERPs as a function of check size (min of arc) at latero-frontal locations when attention had to be paid to 60', 10', and 5' checks. The main effects of attention are an enhanced frontal positivity to relevant patterns peaking on average at 225 msec, followed by a greater later P3b to irrelevant patterns, probably reflecting an active suppression of the response to these stimuli.

286 A. Zani, A.M. Proverbio / Electroencephalography and clinical Neurophysiology 95 (1995) 277-292
main effect of attention (F1, 8 ---- 13.90, P < 0.006; E = 1) indicated that relevant patterns elicited a significantly larger P90 than irrelevant ones at these sites (see Fig. 5a). Pg0 amplitude values averaged over the 3 largest check sizes are reported in Table 4.
Nll 5 component. A s can be seen in Table 2, there was a main effect of attention, in that, independent of check size, relevant checkerboards elicited a larger Nu5 negativity than irrelevant or neutral ones. The negative attention effect, peculiar to medial occipital locations, was more pronounced with smaller check sizes, as can be seen for 6'40" checks in the bottom portion of Fig. 4. This effect was confirmed by a main effect of attention (F1, 8 = 6.36, P < 0.030; • = 1) in a separate A N O V A comparing rele- vant vs. irrelevant Nu5 mean amplitude values measured at medial locations for the 3 smallest check sizes (see Fig. 5b). N~ 5 mean amplitude values collapsed over the latter check sizes are reported in Table 4.
Attention effects initially observable at early sensory levels progressively increased up to 400 msec, as is clearly seen in Fig. 3. Overall, this proved true when attending to
either check size. These findings are consistent with the size-tuning function, centered about the check size of the relevant stimulus, found by Harter and Previc (1978). Besides the evidence of this attention size-tuning effect, however, statistical analyses have also yielded evidence of a clear-cut topographical segregation of the attention selec- tivity progressing over the course of stimulus processing.
N165 component. Both relevant and irrelevant patterns showed a larger NI65 than neutral patterns at all posterior locations. However, post hoc analyses of the attention electrode interaction also indicated some specific attention effects, although they were differentially distributed be- tween the medio- and latero-occipital scalp locations. In fact, relevant patterns elicited a larger N165 than irrelevant ones ( P < 0.01) only at medial locations, thus indicating a more specific role for these locations in mediating further attention selectivity.
P225 component. In the latency range of P225 there was a main effect of attention relevance and an interaction of attention relevance X electrode location. Single compar- isons for the main effect of attention relevance showed that
size F7
4o'
6'4o"
!
m
2.5juv r I ; ; I I I
," . : .
"~ ' ;~ '~ "~'~ . . . 4
A
I I I I I I I
75msec
REL
---IRRE ....... NEU
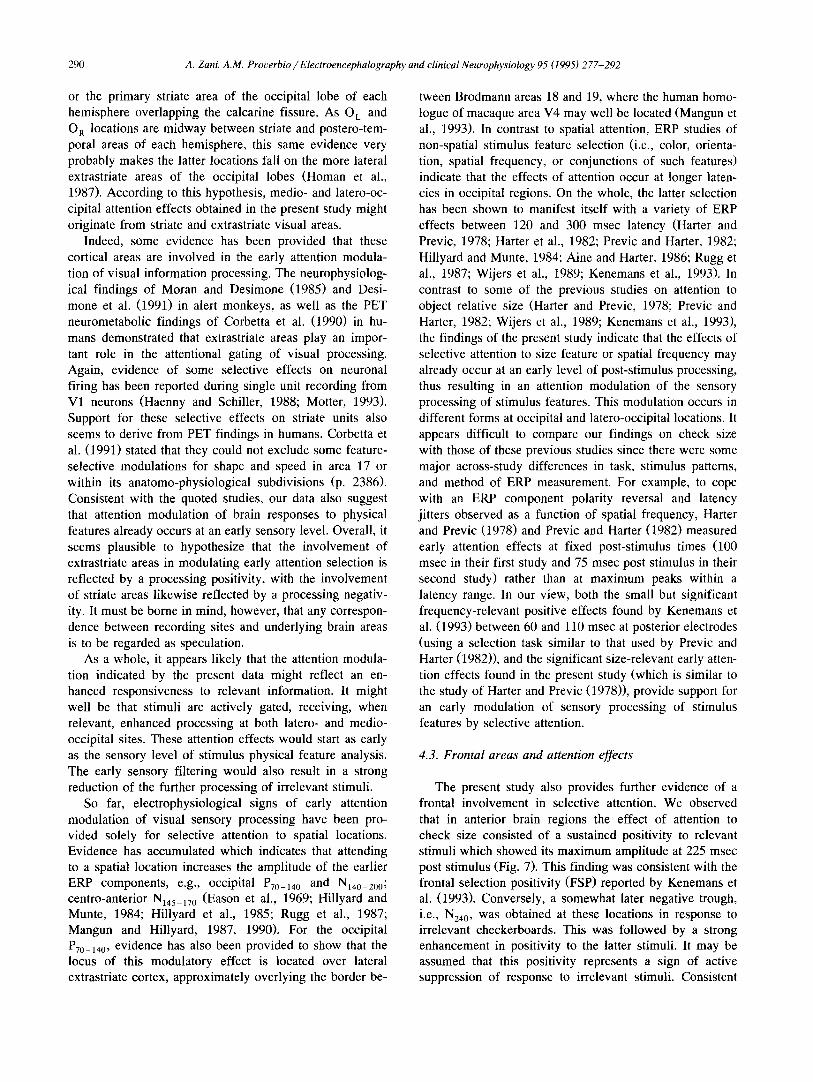
Fig. 7. Grand-average ERPs to relevant (REL), irrelevant (IRRE), and neutral (NEU) patterns as a function of check size (min of arc) at latero-frontal electrode sites. Note that ERPs to irrelevant patterns are collapsed across attention conditions.

A. Zani, A.M. Prouerbio / Electroencephalography and clinical Neurophysiology 95 (1995) 277-292 287
it simply reflected neutral patterns eliciting more positivity than both relevant and irrelevant ones, as can be seen in Table 2. The analysis of the interaction demonstrated that this was due to differences in pattern relevance effects at medial and lateral locations. In fact, irrelevant patterns significantly elicited more positivity than relevant ones ( P < 0.01) specifically at medial locations, as can be observed in Fig. 3 and Fig. 5. Bearing in mind these results, and the relevance effects found at these locations for the earlier Nt6 5 negativity (reflecting relevant patterns eliciting more negativity than irrelevant and neutral ones), it seems plausible to think of a decrease in the P225 as due to the overlapping of the latter attention negativity.
Selection negatit, ity. In the latency range of selection negativity (Nz?0), only a main effect of attention was obtained. At all electrode locations relevant patterns elicited more negativity than both irrelevant and neutral ones, with irrelevant patterns eliciting more negativity than neutral ones ( - 5.93, - 3.39 and - 0.96 /zV respectively).
P4oo component. A significant main effect of attention was reflected in the P3b enlargement to relevant patterns
compared to irrelevant and neutral patterns (4.71, 3.05, and 2.48 /zV respectively). Furthermore, an attention × check size interaction indicated that both the largest, i.e., 60' and 40', and smallest, i.e., 5', relevant check sizes in the range used in the present study elicited a larger late latency positivity than the intermediate ones (see Fig. 3). In our view, this effect was most probably related to subjects' certainty in discriminating target from non-target patterns rather than to check size feature specificity. Thus, the greater the certainty, the larger the P3b positivity. This view seems to be supported by subjects' behavioral dis- crimination performance levels in the various attention tasks.
Attention-related hemispheric asymmetries NI6 s component. Starting with the 4-way interaction,
separate ANOVAs for medial and lateral locations showed that at medial locations attention, check size, and hemi- sphere interacted significantly (Ft0 ' so = 2.68, P < 0.01; • = 0.94). Post hoc tests revealed that both relevant-related and irrelevant-related N]65s were larger in LH than in RH
(a)
% of e m i t t e d
r e s p o n s e s
/ 1 0 0 -
90- 80- 70- 60- 50- 40- 30- 70- lO- O- ~
60' 4,
A t t e n t i o n a l cond i t ion
5' 40"
iO"
Check size (min of arc)
(b)
48or"J , ~ 4701' ~ ~ ~ 4 6 o p ' ~ + + + ~ i + 45°(~1 I~;i i i
R e a c t i o n 440 ~"~ l ~ + i + ++
t i m e ( m s e c ) 430 ++++ He++++++ ++++ 410 ++++ 400
60' 40' 20' 10' 6'40"
Check size (min of arc)
iiiiiii~i ~!iii|iiii!iEEiiiliiilE
'lliii+iii!iii!!!i!~ 5'
Fig. 8. a: percentages of responses (hits + false alarms) emitted during each attention condition to each check size. When attention had to be paid to intermediate check sizes, a comparatively high percentage of responses were emitted also to the patterns closer in size to the relevant one. Note that although the d' value was comparable for all check sizes, being in the same size bandwidth produced confusion between closer check sizes, leading to false alarms to irrelevant stimuli, b: reaction times to each target as a function of check size.

288 A. Zani, A.M. Proverbio / Electroencephalography and clinical Neurophysiology 95 (1995) 277-292
( P < 0.01 for both comparisons). This asymmetry was more prominent for the smaller check sizes as can be seen in Fig. 5.
P4oo component. The interaction of attention condition × hemisphere reflected a larger positivity in LH than in RH for both relevant ( P < 0.001) and irrelevant ( P < 0.01) patterns but not for neutral ones.
3.2. Anterior fronto-lateral electrodes
Attention effects At frontal electrode locations the first reliable attention
effect was evident at a relatively long latency. In fact, ERP wave forms during active conditions were characterized by a marked negativity to irrelevant stimuli starting at the N140 level but peaking on average at a 240 msec latency (N240). This negativity was in contrast to a prominent positivity to relevant patterns peaking at 225 msec latency, i.e., P225- This pattern of results is clearly visible in Fig. 6 which shows ERP wave forms to relevant and irrelevant check sizes for 3 different selection conditions. P225 and N240 components were followed by a prominent late posi- tivity (LP) peaking at about 400 msec post-stimulus la- tency. On the whole, the single comparisons for a main effect of attention (F2, 16 = 26.21, P < 0.0000; • = 0.85) showed that P225 was enhanced to relevant patterns com- pared to irrelevant ( P < 0.05) and neutral ones ( P < 0.05) (see Fig. 7). Conversely, the main effect of attention for N240 (F2, 16 = 13.21, P < 0.0004; • = 0.96) reflected a greater negativity to irrelevant ( P < 0.05) and neutral pat- terns ( P < 0.05) compared to relevant ones. This effect was followed by a significant main effect of attention on the long latency positivity (F2, 16 = 3.70, P < 0.01; • = 0.89) consisting in a strong enhancement of positivity to irrelevant patterns. In fact, simple comparisons showed that the amplitude of the LP to irrelevant patterns was significantly larger than to relevant and neutral ones.
Attention-related hemispheric asymmetries Frontal late positivity (LP). A significant interaction of
attention x hemisphere (F2, 16 = 3.85, P < 0.043; • = 0.87) revealed that this component was significantly larger in the left (X = 7.48) than in the right (X = 6.21) fronto-lateral area for irrelevant patterns ( P < 0.05).
Behavioral results As is evident in Fig. 8a, and consistent with the electro-
physiological results, the bandwidth of subjects' pattern discrimination performance was significantly narrower for the extreme target check sizes in the continuum than for the intermediate ones. In fact, when actively selecting the intermediate patterns, the subjects produced a much higher number of false alarms (FAs). The closer in size the relevant and irrelevant patterns were, the greater the num- ber of FAs. Furthermore, the false positive responses were spread more evenly over the continuum of adjacent check
sizes, thus indicating a greater difficulty of target discrimi- nation.
In order to evaluate subjects' performance, 2 further 1-way ANOVAs were performed on their mean RTs, one with responding hand and the other with check size as factors. The left hand was significantly faster than the right one in the speed of behavioral response (447 vs. 465 msec; P < 0.03). A difference in latency of motor response to the different check sizes was also found ( P < 0.0068). Simple comparisons showed that RTs to larger check sizes were faster than RTs to the medium and small check sizes, e.g., 10' and 6'40" (see Fig. 8b).
4. Discussion
4.1. ERP sensory components: feature and topographic specificity
The results of the present study suggest that check size processing in the neural cortex is a dynamic process which is accomplished by the activity of separated but coordi- nated areas of the brain. Lateral occipital areas appear to parallel the processing activity performed by medio-oc- cipital areas. Both visual regions appear to span partially overlapping but essentially different ranges of the check size spectrum while having comparable check size band- widths. Nevertheless, our results also suggest that there are some strong differences in the response properties of these regions to spatial-periodic patterns. Despite the inherent limitations of scalp-recorded ERPs for response source localization, the data indicate a remarkably clear-cut differ- ential neurotopographical distribution for the early sensory components. Whereas within the 70-110 msec latency range the periodic patterns elicited an early positive re- sponse (Pg0) which was more prominent at latero-occipital locations, they also elicited a somewhat later peaking negative response within the 80-130 msec latency range (Nlls). This component was almost absent at lateral loca- tions and more prominent at medial locations closer to the scalp occipital midline. Furthermore, the data also indicate that these components possess a remarkable check size feature specificity, although somewhat different in nature. The more laterally distributed P90 was found to be more prominent with larger check sizes, and to progressively lessen in amplitude as check size decreased. The Nll5, almost absent with larger checks, increased at medial locations, and proved to be prominent with the smallest check sizes. The finding of a negative component at about 100 msec, which was larger for relatively smaller check sizes that subtend higher spatial frequencies, is quite con- sistent with previous findings obtained with both checker- boards (Rietveld et al., 1967; Harter and White, 1970; Les~vre and R6mond, 1972) and sinusoidal gratings (Plant et al., 1983; Reed et al., 1984; Kenemans et al., 1993).
In our view, the polarity reversal observed here at

A. Zani, A.M. Pro~'erbio / Electroencephalography and clinical Neurophysiology 95 (1995) 277-292 289
medial locations should not be thought of as an analogue of the dipolar mechanism reflecting the anatomical ar- rangement of the striate cortex across the calcarine fissure reported in previous studies (Jeffreys and Axford, 1972; Butler et al., 1987; Mangun et al., 1993). This mechanism, in fact, implies that the deflections of opposite polarity recorded in response to a particular stimulus presented in upper vs. lower quadrants of the visual field reflect the same ERP component reversed in polarity because of the opposite localization of the ERP source across the cal- carine fissure, with respect to the same surface electrode. Conversely, the present study clearly showed a difference in the topographical distribution of the P90 and NHs, thus suggesting the possibility that these peaks represent 2 distinct components. In fact, the N 115 was more prominent at medio-occipital locations, especially in response to smaller check sizes, whereas the P90 was largest at latero- occipital locations, especially in response to larger check sizes. More importantly, both these components appeared to be affected by selective attention, in that they were independently enhanced in response to relevant patterns. This evidence further supports our view that these compo- nents might reflect mechanisms differing from the PNso dipole described in spatial selective attention studies (Mangun et al., 1993), since in the latter studies this dipole was unaffected by attentional selection.
In all, the topographical segregation and check size specificity of Pg0 and N 1~5 suggest the intriguing possibil- ity that these components might respectively reflect the neural activity of the parallel and anatomically segregated magnocellular and parvocellular streams of the visual sys- tem (Lennie, 1980; Merigan and Maunsell, 1993). This correspondence might be supported by the fact that while M units have been shown to have a faster conductivity speed than P units, in the present study the Pg0 occurred on average 25 msec earlier than the high-frequency-related NHs. More importantly, neurometabolic selective lesions of cells in the M pathway have been shown to determine a dramatic decrease in contrast sensitivity for stimuli of lower spatial frequencies and higher temporal frequencies, whereas lesions of the P pathway determine a reduction of contrast sensitivity for patterns of higher spatial frequen- cies and lower temporal frequencies (Merigan et al., 1991). Lastly, a segregation would be maintained for these path- ways also at a cortical level, although incomplete. Striate areas (area 17) would be activated by both M- and P-type afferents, whereas extrastriate areas (area 18) would be activated essentially by M-type afferents (Lennie, 1980; Mitzdorf, 1986). This seems consistent with the recent suggestion of Merigan and Maunsell (1993) of a predomi- nance of the M pathway in the occipito-parietal projec- tions, and a segregation of the M and P pathways in the extrastriate cortex consisting mainly of a partial exclusion of P contributions from the parietal pathway. These lines of evidence notwithstanding, given the lack of direct knowledge of the intracerebral sources of the Pgo and NI~ ~
components, for the time being the hypothesis advanced above must only be regarded as tentative.
4.2. Attention modulation of sensory processing in occipi-
tal areas
As discussed above, the data indicate that stimulus pattern onset evokes early latency sensory components changing in amplitude as a function of check size and recording site. However, they also indicate that the re- sponses elicited depend not only on the nature of the visual stimulus itself, but also on the relevance of this stimulus to the observer. When relevant in a selection task, patterned stimuli "evoke" an enhanced neural response of spatial frequency channels, thus uncovering not only stimulus specificity, but also an attention modulation of the earliest cortical components and all components thereafter. This early modulation is manifest in different forms at the different scalp occipital sites. At latero-occipital recording sites selection modulated the earliest positive Pgo response to the checkerboard patterns. Overall, the results proved that these areas were largely activated across attention conditions. In fact, when a specific check size effective in driving the response of a size-specific channel was selec- tively relevant, e.g., 10' in the 10' relevant condition, these areas showed an enhancement of response to that check size compared to when attention was directed to other ineffective check sizes on that channel, e.g., 10' when 60' or 5' were relevant. This finding agrees quite well with the finding of Kenemans et al. (1993) of a small but signifi- cant enhancement of a positive shift for spatial frequency- relevant gratings at posterior midline and temporo-lateral electrodes between 70 and 110 msec post-stimulus latency.
In parallel with latero-occipital sites, medial sites show an early attention selection of relevant visual stimuli mani- fest as a modulation of the Nll 5 and P~0 components. At these sites, in fact, frequency-relevant patterns attained an attention-related negativity compared with frequency-irrel- evant ones. Again, attention effects were found at these locations for the somewhat later N165 and P225 compo- nents.
Besides selective attention effects, the present data indi- cate a difference in ERP component amplitudes between active and passive conditions. In fact, both relevant and irrelevant stimuli elicited enhanced responses at all latency ranges compared with passively viewed stimuli. The fact that evoked responses to irrelevant stimuli were larger than to passively viewed ones indicates a difference in the overall arousal between the active and passive conditions. This indicates that the difference between these 2 condi- tions is more than a difference in attention allocation.
It may be hypothesized that latero- and medio-occipital scalp locations reflect the activity of different areas of the visual cortex. Neuroimaging CT scanning evidence in healthy adults is forthcoming to suggest that O 1 and O 2 locations fall, with some variability, in Brodmann area 17
290 A. Zani, A.M. Prot~erbio / Electroencephalography and clinical Neurophysiology 95 (1995) 277-292
or the primary striate area of the occipital lobe of each hemisphere overlapping the calcarine fissure. As O L and O R locations are midway between striate and postero-tem- poral areas of each hemisphere, this same evidence very probably makes the latter locations fall on the more lateral extrastriate areas of the occipital lobes (Homan et al., 1987). According to this hypothesis, medio- and latero-oc- cipital attention effects obtained in the present study might originate from striate and extrastriate visual areas.
Indeed, some evidence has been provided that these cortical areas are involved in the early attention modula- tion of visual information processing. The neurophysiolog- ical findings of Moran and Desimone (1985) and Desi- mone et al. (1991) in alert monkeys, as well as the PET neurometabolic findings of Corbetta et al. (1990) in hu- mans demonstrated that extrastriate areas play an impor- tant role in the attentional gating of visual processing. Again, evidence of some selective effects on neuronal firing has been reported during single unit recording from V1 neurons (Haenny and Schiller, 1988; Motter, 1993). Support for these selective effects on striate units also seems to derive from PET findings in humans. Corbetta et al. (1991) stated that they could not exclude some feature- selective modulations for shape and speed in area 17 or within its anatomo-physiological subdivisions (p. 2386). Consistent with the quoted studies, our data also suggest that attention modulation of brain responses to physical features already occurs at an early sensory level. Overall, it seems plausible to hypothesize that the involvement of extrastriate areas in modulating early attention selection is reflected by a processing positivity, with the involvement of striate areas likewise reflected by a processing negativ- ity. It must be borne in mind, however, that any correspon- dence between recording sites and underlying brain areas is to be regarded as speculation.
As a whole, it appears likely that the attention modula- tion indicated by the present data might reflect an en- hanced responsiveness to relevant information. It might well be that stimuli are actively gated, receiving, when relevant, enhanced processing at both latero- and medio- occipital sites. These attention effects would start as early as the sensory level of stimulus physical feature analysis. The early sensory filtering would also result in a strong reduction of the further processing of irrelevant stimuli.
So far, electrophysiological signs of early attention modulation of visual sensory processing have been pro- vided solely for selective attention to spatial locations. Evidence has accumulated which indicates that attending to a spatial location increases the amplitude of the earlier ERP components, e.g., occipital P70-140 and N140_200; centro-anterior N145_170 (Eason et al., 1969; Hillyard and Munte, 1984; Hillyard et al., 1985; Rugg et al., 1987; Mangun and Hillyard, 1987, 1990). For the occipital P7o-140, evidence has also been provided to show that the locus of this modulatory effect is located over lateral extrastriate cortex, approximately overlying the border be-
tween Brodmann areas 18 and 19, where the human homo- logue of macaque area V4 may well be located (Mangun et al., 1993). In contrast to spatial attention, ERP studies of non-spatial stimulus feature selection (i.e., color, orienta- tion, spatial frequency, or conjunctions of such features) indicate that the effects of attention occur at longer laten- cies in occipital regions. On the whole, the latter selection has been shown to manifest itself with a variety of ERP effects between 120 and 300 msec latency (Harter and Previc, 1978; Harter et al., 1982; Previc and Harter, 1982; Hillyard and Munte, 1984; Aine and Harter, 1986; Rugg et al., 1987; Wijers et al., 1989; Kenemans et al., 1993). In contrast to some of the previous studies on attention to object relative size (Harter and Previc, 1978; Previc and Harter, 1982; Wijers et al., 1989; Kenemans et al., 1993), the findings of the present study indicate that the effects of selective attention to size feature or spatial frequency may already occur at an early level of post-stimulus processing, thus resulting in an attention modulation of the sensory processing of stimulus features. This modulation occurs in different forms at occipital and latero-occipital locations. It appears difficult to compare our findings on check size with those of these previous studies since there were some major across-study differences in task, stimulus patterns, and method of ERP measurement. For example, to cope with an ERP component polarity reversal and latency jitters observed as a function of spatial frequency, Harter and Previc (1978) and Previc and Harter (1982) measured early attention effects at fixed post-stimulus times (100 msec in their first study and 75 msec post stimulus in their second study) rather than at maximum peaks within a latency range. In our view, both the small but significant frequency-relevant positive effects found by Kenemans et al. (1993) between 60 and 110 msec at posterior electrodes (using a selection task similar to that used by Previc and Harter (1982)), and the significant size-relevant early atten- tion effects found in the present study (which is similar to the study of Harter and Previc (1978)), provide support for an early modulation of sensory processing of stimulus features by selective attention.
4.3. Frontal areas and attention effects"
The present study also provides further evidence of a frontal involvement in selective attention. We observed that in anterior brain regions the effect of attention to check size consisted of a sustained positivity to relevant stimuli which showed its maximum amplitude at 225 msec post stimulus (Fig. 7). This finding was consistent with the frontal selection positivity (FSP) reported by Kenemans et al. (1993). Conversely, a somewhat later negative trough, i.e., N240, was obtained at these locations in response to irrelevant checkerboards. This was followed by a strong enhancement in positivity to the latter stimuli. It may be assumed that this positivity represents a sign of active suppression of response to irrelevant stimuli. Consistent
A. Zani, A.M. Proverbio / Electroencephalography and clinical Neurophysiology 95 (1995) 277-292 291
with this view, ERP evidence has been provided to show that the dorso-lateral prefrontal cortex plays an active role in the suppression of neural processing of irrelevant stim- uli (Woods, 1990; Knight, 1991). It is worth noting that, together with the results at the posterior regions, these findings also further support the view proposed by various authors that visual selective attention implies an indepen- dent, parallel activation of occipital and frontal brain struc- tures (Aine and Harter, 1986; Rugg et al., 1987). In fact, while the SN and late positivity found at occipital areas would reflect the enhancement of responses to relevant stimuli, the late positivity found at the prefrontal electrode sites would probably reflect the suppression of responses to the irrelevant ones. On the whole, the present findings agree substantially with recent PET findings of parallel activation of posterior brain areas, and antero-lateral or- bito-frontal cortex and a set of related brain regions, in visual selective attention tasks (Corbetta et al., 1991).
4.4. Hemispheric asymmetries
The present data also indicate a large hemispheric asymmetry in the amplitude of sensory components for low versus high spatial frequencies independent of atten- tion condition and stimulus relevance. In particular, the N i l 5 w a s prominent on the LH to smaller check sizes. It might be speculated that this response specificity of LH to the smaller check sizes might depend on this hemisphere having narrower unit receptive fields. These findings strongly support the model of Sergent and Hellige (1986) of hemispheric asymmetries in spatial frequency process- ing suggesting a RH specialization for low spatial frequen- cies, and LH specialization for high spatial frequencies.
Furthermore, our results also showed specific attention-related hemispheric asymmetries. In fact, in oc- cipital areas attention effects (relevant vs. irrelevant stim- uli) for both N165 and P3b components were only evident on the LH. In parallel, at anterior brain areas a long latency positivity (LP) indicated that the LH was also involved in the active suppression of the response to irrelevant information. On the whole, these data clearly support the view of a stronger attention selectivity of the LH (Reuter-Lorentz et al., 1990; Proverbio, 1993). Fur- thermore, they also lend support to the current model of the LH having a narrower attention focus and a more analytic attention strategy (Robertson et al., 1988; Palmer and Tzeng, 1990). It seems very likely that this functional asymmetry may be related to the LH structural specializa- tion for higher spatial frequencies, which could result in a greater selection capability for stimulus details in narrow space regions.
5. Conclusions
In summary, the present data confirm the view of Harter and Previc (1978) that selective attention to check
size is primarily mediated by size-specific sensory chan- nels. Further, these data also indicate an early attention modulation of the processing activity of these channels already at a sensory level. Importantly, such a modulation is evident at both occipital and latero-occipital scalp sites.
Acknowledgements
This study was supported by a grant from the Biological and Medical Sciences Board of Consiglio Nazionale delle Ricerche to A.Z. and a McDonnell-Pew Post-Doctoral Fellowship to A.M.P. The authors gratefully acknowledge the helpful comments of Dr. David Woods, Dr. Kenneth Campbell, and 3 anonymous reviewers. They also wish to thank Elio Pasquali and Renzo Roveri for technical sup- port in experimental equipment set up, and Evan Fletcher and Todd Handy for assistance with the manuscript.
A short version of this study was presented in prelimi- nary form in the Poster Session of the 1993 25th Annual Meeting of the European Brain and Behaviour Society.
References
Aine, C.J. and Hatter, M.R. (1986) Visual event-related potentials to colored patterns and color names: attention to features and dimension. Electroenceph. clin. Neurophysiol., 64: 228-245.
Aine, C.J., Bodis-Wollner, I. and George, J.S. (1990) Spatial-frequency segregation and evidence for multiple sources. In: S. Sato (Ed.), Advances in Neurology. Vol. 54. Magnetoencephalography. Raven Press, New York, pp. 141-155.
Blakemore, C. and Campbell, F.W. (1969) On the existence of neurons in the human visual system selectively sensitive to the orientation and size of retinal images. J. Physiol. (Lond.), 203: 237-260.
Bodis-Wollner, I., Mylin, L. and Frkovic, S. (1989) The topography of the N70 component of the visual evoked potentials in humans. In: K. Maurer (Ed.), Topographic Brain Mapping of EEG and Evoked Potentials. Springer, Berlin, pp. 543-546.
Butler, S.R., Georgiou, G.A., Glass, A., Hancox, R.J., Hopper, J.M. and Smith, K.R.H. (1987) Cortical generators of the CI component of the pattern-onset visual evoked potential. Electroenceph. clin. Neurophys- iol., 68: 256-267.
Campbell, F.W. and Maffei, L. (1970) Electrophysiological evidence for the existence of orientation and size detectors in the human visual system. J. Physiol. (Lond.), 207: 635-652.
Corbetta, M., Miezin, F.M., Dobmeyer, S., Shulman, G. and Petersen, S.E. (1990) Attentional modulation of neural processing of shape, color, and velocity in humans. Science, 248: 1556-1559.
Corbetta, M., Miezin, F.M., Dobmeyer, S., Shulman, G. and Petersen, S.E. (1991) Selective and divided attention during visual discrimina- tions of shape, color, and speed: functional anatomy by positron emission tomography. J. Neurosci., 11: 2383-2402.
Desimone, R., Wessinger, M., Thomas, L. and Schneider, W. (1991) Attentional control of visual perception: cortical and subcortical mechanisms. Cold Spring Harbor Symp. Quant. Biol., 55: 963-971.
De Valois, R.L., Albrecht, D.G. and Thorell, L.G. (1978) Cortical cells: bar detectors or spatial frequency filters? In: S.J. Cool and E.L. Smith (Eds.), Frontiers in Visual Science. Springer, Berlin, pp. 220-239.
Eason, R.G., Harter, M.R. and White, C.T. (1969) Effects of attention

292 A. Zani, A.M. Proverbio / Electroencephalography and clinical Neurophysiology 95 (1995) 277-292
and arousal on visually evoked cortical potentials and reaction time in man. Physiol. Behav., 4: 283-289.
Ginsburg, A.P. (1986) Spatial filtering and visual form perception. In: K.R. Boff, L. Kaufman and J.P. Thomas (Eds.), Handbook of Percep- tion and Human Performance. Vol. 2. Cognitive Processes and Perfor- mance. John Wiley, New York, pp. 3 4 / 1 - 3 4 / 4 1 .
Haenny, P.E. and Schiller, P.H. (1988) State dependent activity in visual cortex. I. Single cell activity in V1 and V4 on visual tasks. Exp. Brain Res., 69: 225-244.
Harter, M.R. and Guido, W. (1980) Attention to pattern orientation: negative cortical potentials, reaction time, and the selection process. Electroenceph. clin. Neurophysiol., 49: 461-475.
Harter, M.R. and Previc, F.H. (1978) Size-specific information channels and selective attention: visual evoked potentials and behavioural measures. Electroenceph. clin. Neurophysiol., 45: 628-640.
Harter, M.R. and White, C.T. (1970) Evoked cortical response to checkerboard patterns: effect of check-size as a function of visual acuity. Electroenceph. clin. Neurophysiol., 28: 48-54.
Harter, M.R., Alne, C.J. and Schroeder, C. (1982) Hemispheric differ- ences in the neural processing of stimulus location and type: effects of selective attention on visual evoked potentials. Neuropsychologia, 20: 421-438.
Hillyard, S.A. and Munte, T.F. (1984) Selective attention to color and location: an analysis with event related brain potentials. Percept. Psychophys., 36: 185-198.
Hillyard, S.A., Munte, T.F. and Neville, H. (1985) Visual-spatial atten- tion, orienting, and brain physiology. In: M.I. Posner and O.S.M. Marin (Eds.), Attention and Performance XI. Lawrence Erlbaum, Hillsdale, NJ, pp. 63-84.
Homan, R.W., Herman, J. and Purdy, P. (1987) Cerebral location of international 10-20 system electrode placement. Electroenceph. clin. Neurophysiol., 66: 376-382.
Jeffreys, D.A. and Axford, J.G. (1972) Source locations of pattern specific components of human visual evoked potentials. I. Compo- nents of striate cortical origin. Exp. Brain Res., 16: 1-21.
Jennings, J.R. and Wood, C.C. (1976) The e-adjustment procedure for repeated-measures analyses of variance. Psychophysiology, 76: 277- 278.
Kenemans, J.L., Kok, A. and Smulders, F.T.Y. (1993) Event-related potentials to conjunctions of spatial frequency and orientation as a function of stimulus parameters and response requirements. Electroen- ceph. clin. Neurophysiol., 88: 51-63.
Knight, R.T. (1991) Evoked potential studies of attention capacity in human frontal lobe lesions. In: H.S. Levin, M.E. Howard and A.L. Benton (Eds.), Frontal Lobe Function and Dysfunction. Oxford Uni- versity Press, New York, pp. 139-156.
Kulikowski, J.J., Marcelja, S. and Bishop, P.O. (1982) Theory of spatial position and spatial frequency relations in the receptive fields of simple cells in the visual cortex. Biol. Cybernet., 43: 187-198.
Lennie, P. (1980) Parallel visual pathways: a review. Vision Res., 20: 561-594.
Les~vre, N. and R6mond, A. (1972) Potentiels 6voqu6s par l'apparition de patterns: effets de la dimension du pattern et la densit6 des contrastes. Electroenceph. clin. Neurophysiol., 32: 593-604.
Maffei, L. and Fiorentini, A. (1973) The visual cortex as a spatial frequency analyser. Vision Res., 13: 1255-1267.
Mangun, R.G. and Hillyard, S.A. (1987) The spatial allocation of visual attention as indexed by event-related brain potentials. Hum. Factors, 29: 195-211.
Mangun, R.G. and Hillyard, S.A. (1990) Allocation of visual attention to spatial location: event-related brain potentials and detection perfor- mance. Percept. Psychophys., 47: 532-550.
Mangun, R.G., Hillyard, S.A. and Luck, S.J. (1993) Electrocortical substrates of visual selective attention. In: D. Meyer and S. Kornblum (Eds.), Attention and Performance. Vol. XIV. Synergies in Experi- mental Psychology, Artificial Intelligence, and Cognitive Neuro- science. MIT Press, Cambridge, MA, pp. 219-243.
Merigan, W.H. and Maunsell, J.H.R. (1993) How parallel are the primate visual pathways? Annu. Rev. Neurosci., 16: 396-402.
Merigan, W.H., Byme, C. and Maunsell, J.H.R. (1991) Does primate motion perception depend on the magnocellular pathway? J. Neurosci., 11: 3422-3429.
Mitzdorf, U. (1986) The physiological causes of VEP: current source density analysis of electrically and visually evoked potentials. In: R.Q. Cracco and I. Bodis-Wollner (Eds.), Evoked Potentials. Alan R. Liss, New York, pp. 141-154.
Moran, J. and Desimone, R. (1985) Selective attention gates visual processing in the extrastriate cortex. Science, 229: 782-784.
Motter, B.C. (1993) Focal attention produces spatially selective process- ing in visual cortical areas V1, V2, and V4 in the presence of competing stimuli. J. Neurophysiol., 70: 909-919.
Palmer, T. and Tzeng, O.J. (1990) Cerebral asymmetry in visual atten- tion. Brain Cogn., 13: 46-58.
Plant, G.T., Zimmern, R.L. and Durden, K. (1983) Transient visually evoked potentials to the pattern reversal and onset of sinusoidal gratings. Electroenceph. clin. Neurophysiol., 56: 147-158.
Previc, F.H. and Hatter, M.F. (1982) Electrophysiological and behavioral indicants of selective attention to multi-feature gratings. Percept. Psychophys., 32: 465-472.
Proverbio, A.M. (1993) Left and Right Hemisphere Role for Selective and Sustained Attention: an Electrophysiological Approach. Doctoral Thesis, University of Padua, Padua. (In Italian.)
Reed, J.L., Marx, M.S. and May, J.G. (1984) Spatial frequency tuning in the visual evoked potential elicited by sine-wave gratings. Vision Res., 24: 1057-1062.
Reuter-Lorentz, P.A., Kinsbourne, M. and Moscovitch, M. (1990) Hemi- spheric control of spatial attention. Brain Cogn., 12: 240-266.
Rietveld, W.J., Tardoir, W.E.M., Hagenouw, J.R.B., Lubbers, J.A. and Spoor, Th.A.C. (1967) Visual evoked responses to blank and checker- board patterned flashes. Acta Psychol. Pharmacol. Need., 14: 259- 285.
Robertson, L.C., Lamb, M.R. and Knight, R.T. (1988) Effects of lesions of temporal-parietal junction on perceptual and attentional processing in humans. J. Neurosci., 10: 3757-3789.
Rugg, M.D., Milner, A.D., Lines, C.R. and Phalp, R. (1987) Modulation of visual event-related potentials by spatial and non-spatial visual selective attention. Nenropsychologia, 25: 85-96.
Sergent, J. and Hellige, J.B. (1986) Role of input factors in visual field asymmetries. Brain Cogn., 5: 174-199.
Wijers, A.A., Mulder, G., Okita, T. and Mulder, LJ.M. (1989) Event-re- lated potentials during memory search and selective attention to letter size and conjunction of letter size and color. Psychophysiology, 26: 529-547.
Woods, D.L. (1990) The physiological basis of selective attention: impli- cations of event-related potential studies. In: J. Rohrbaugh, R. John- son, Jr. and R. Parasuraman (Eds.), Event-Related Brain Potentials. Oxford University Press, New York, pp. 178-210.


![Analysis of selective attention processing on experienced ... · languagewhichinvolved selective attention processing [Cowan,N,2000 +]-Multilingual Control, [Morels, J.,+,2015]-Executive](https://img.dokumen.tips/doc/110x75/5f916b29e7f9cc049811ee26/analysis-of-selective-attention-processing-on-experienced-languagewhichinvolved.jpg)