Embed Size (px)
Citation preview

8/10/2019 Erosion Corrosion of Carbon Steels in a Laboratory Three Phase Flow
http://slidepdf.com/reader/full/erosion-corrosion-of-carbon-steels-in-a-laboratory-three-phase-flow 1/28
Erosion Corrosion of Carbon Steels in a Laboratory Three Phase Flow
Jürgen Feyerl1, Gregor Mori2,3, Stefan Holzleitner 1, Joachim Haberl2,3,
Markus Oberndorfer 4, Wolfgang Havlik 4, Christian Monetti5
1 Materials Center Leoben Forschung GmbH, Franz-Josef-Str. 13, A-8700 Leoben,
Austria
2 Department of General, Analytical and Physical Chemistry, University of Leoben,
Franz-Josef-Str. 18, A-8700 Leoben, Austria
3 Christian Doppler Laboratory of Localized Corrosion, Franz-Josef-Str. 18, A-8700
Leoben, Austria
4 OMV Exploration & Production GmbH, Laboratory, Materials & Corrosion,
Gerasdorfer Straße 151, A-1210 Vienna, Austria
5 AC2T research GmbH, Viktor Kaplan–Straße 2, A-2700 Wr. Neustadt, Austria
ABSTRACT
A new testing facility for a high velocity three phase flow consisting of a gas flow loop and a
jet impingement rig is described. Flow velocities between nozzle and specimen have been
determined by CFD simulations and by particle image velocimetry. Tests were conducted ontypical carbon steels (J55 and C95) which are used in tubings for the gas and oil industry.
Flow conditions of a sweet gas condensate well have been applied. Mass loss rates have been
determined after testing times between 4 and 168 h by use of optical profilometry. Damaged
surfaces were investigated by optical and by scanning electron microscopy.
The effects of material and flow velocity on mass loss rate have been investigated.
Mass loss of specimens under given conditions is determined by siderite formation and

8/10/2019 Erosion Corrosion of Carbon Steels in a Laboratory Three Phase Flow
http://slidepdf.com/reader/full/erosion-corrosion-of-carbon-steels-in-a-laboratory-three-phase-flow 2/28
increasing degradation of siderite layer by impacts of sand and fuid droplets. Degradation
happens by erosion enhanced corrosion. Normalized steel J55 behaves like a ductile material
resulting in a maximum degradation rate under small impact angles outside the focal spot.
Compared to J55 the quenched and tempered material C95 shows a generally lower depth of
attack with its maximum degradadtion under large impact angles indicating a brittle
behaviour. Cementite of pearlite may additionally act as cathode and accelerate corrosive
attack.
KEY WORDS: erosion corrosion, multiphase flow, flow loop, jet impingement, carbon steel,
erosion enhanced corrosion, CO2 corrosion, flow induced localized corrosion
INTRODUCTION
Erosion corrosion in oil and gas production systems is predominately caused by particle
impingement on tubing materials. The usual corrosive reagents are carbon dioxide, salt water
and if present hydrogen sulfide1.
Up to 15% of failures in oil and gas production are caused by erosion corrosion
mainly at gravel packs, nozzles and Christmas trees before hydrocarbons reach a first
separator 2. Corrosion of carbon steels in CO2 containing, oxygen free aqueous solutions is
connected with the formation of layers of more or less protective corrosion products. In many
cases the surface layer consists of siderite (FeCO3) and cementite (Fe3C). These deposits are
neither compact nor dense3,4. Their protective effect depends on the salt content of the
aqueous solution, the pH value, temperature, CO2 partial pressure, flow velocity and chemical
composition and microstructure of material5,6.
There are only few studies which investigate degradation phenomena in a multiphase
flow at high flow velocities comparable to practice. Determination of true flow velocities in a

8/10/2019 Erosion Corrosion of Carbon Steels in a Laboratory Three Phase Flow
http://slidepdf.com/reader/full/erosion-corrosion-of-carbon-steels-in-a-laboratory-three-phase-flow 3/28
multiphase flow is also rather uncommon. Most authors use theoretical flow velocities7-11
instead of determination of true practical velocities.
Many authors use flow loops for investigating erosion corrosion phenomena12-18. The
main disadvantages of such setups are that only low flow velocities can be reached and
conditions during oil and gas production can not be investigated. The gas oil ratio occurring
in those flow loop setups is not representative for practice. Other erosion corrosion test
equipments such as rotating cylinders and rotating discs used by several researchers20-23 are
also poorly comparable to practical field conditions. There always happens a segregation
between solid and liquid phase. Thus, application of those rotating test rigs testing a three
phase flow is not possible. Other authors use a jet impingement apparatus23-26 but do not
apply a multiphase flow with a solid phase. If they add sand they only reach low flow
velocities.
Another major disadvantage of many published papers in this field is a lack of
knowledge of real flow velocity distribution at and near the specimen’s surface. In many
cases, not the real flow velocities at the specimens are taken into consideration. Instead of
real flow velocities, the nozzle flow velocity or a superficial flow velocity or flow rates in a
flow loop or rotation velocities are used for evaluation11,27-33. In the present paper the flow
velocity distribution between nozzle and specimen is determined by two different and fully
independent methods. To avoid erosion corrosion in practice one has to know exact flow
velocities of the fluid and the erosive particles at the specific point of failure at the metal
surface. When knowing limiting fluid velocities and degradation mechanisms of different
materials one can improve well performance by a proper material selection.
The corrosion layer of carbon steels consists in CO2 containing atmosphere of siderite
and undissolved cementite. Cementite is an electronic conductor with a noble electrochemical
behaviour. It favours the cathodic corrosion reaction leading to the possibility of galvanic

8/10/2019 Erosion Corrosion of Carbon Steels in a Laboratory Three Phase Flow
http://slidepdf.com/reader/full/erosion-corrosion-of-carbon-steels-in-a-laboratory-three-phase-flow 4/28
coupling between the ferritic phase as anode and cementite as cathode34. Distribution of
cementite in carbon steels determines the structure of cementite in the siderite/cementite
scale. A plate-like carbide structure of pearlite gives a good framework for the build up of a
protective layer, when within plates of cementite siderite due to oversaturation of Fe2+
precipitates. Quenched and tempered steels and ferritic steels with low carbon content have a
finely distributed or even no carbide structure that does not give an integrated framework to
anchor and enhance the formation of a protective carbonate layer 6,35-38.
A higher corrosion rate of ferritic-pearlitic steels compared to the quenched and
tempered qualities could also arise from a different density and size of flaws in the
siderite/cementite layer. Schmitt et al.39 claim higher concentrations of flaws and
inhomogeneities in the scale of ferritic-pearlitic steels, being distributed over the entire
thickness of the scale. On the opposite flaws in scales in martensitic steels tend to be located
at the interface between the base metal and the scale.
Most papers are discussing these effects on CO2 corrosion of steels without applying
high flow velocities. The goal of the present work is to investigate material loss of carbon
steels as a function of microstructure under such highly turbulent erosion corrosion
conditions in a multiphase flow.
EXPERIMENTAL
Materials
Samples were prepared from regular casings and tubings. Qualities investigated were J55 and
C95 according to API 5 CT40. Steel J55 is normalized and C95 shows a tempered martensitic
microstructure. Chemical composition of investigated steels is given in Table 1. Mechanical
properties are shown in Table 2.

8/10/2019 Erosion Corrosion of Carbon Steels in a Laboratory Three Phase Flow
http://slidepdf.com/reader/full/erosion-corrosion-of-carbon-steels-in-a-laboratory-three-phase-flow 5/28
Specimens were cut out in longitudinal direction. Samples had a size of 20 x 15 x 5 mm. All
samples were ground to 120 grit finish, cleaned in alcohol and dried at 105 °C. After that,
specimens were electropolished to maintain a smooth surface and to remove a cold worked
surface layer after grinding. A small area at the surface as well as flat sides and back side of
specimens were covered with an acrylic lacquer to prevent attack there.
Erosion corrosion test equipment
Experiments were performed using a high velocity jet impingement test rig. Experimental
setup is a combination of a gas flow loop and a jet impingement rig. A general schematic of
the jet impingement rig is shown in Figure 1. It consists of a high pressure gas pump and a
batching cylinder (volumetric dosing) for the artificial brine-sand mixture. Sand suspension
in the batching cylinder is provided by a magnetic stirrer. The batching cylinder is powered
by a conventional slow strain rate testing machine enabling a distinct addition of the brine-
sand mixture to the gas flow. The gas pump allows continuous gas circulation within the flow
loop, whereas the brine-sand mixture has to be added separately in the injection zone. The
three phase mixture is accelerated by a nozzle and hits the specimen’s surface in the so called
focal point. Specimen, specimen holder and nozzle are located in the impingement cell which
is shown in Figure 2. The cell has two glas windows on its side under an angle of 90 ° to
enable PIV measurements. The impingement cell itself is situated in a heating chamber which
provides a constant temperature of 80°C. Due to acrylic lacquer the samples are electrically
isolated from the specimen holder. After passing the impingement cell, liquid and solid phase
are separated from the circulating gas in a cascade of separator vessels. The brine-sand
mixture is only used once and is not recirculated whereas the gas is pumped in a circle. The
multiphase flow was accelerated in the 1 mm diameter nozzle up to 150 m/s resulting in an
impingement gas velocity of 19 m/s. Variation of flow velocity was done by applying

8/10/2019 Erosion Corrosion of Carbon Steels in a Laboratory Three Phase Flow
http://slidepdf.com/reader/full/erosion-corrosion-of-carbon-steels-in-a-laboratory-three-phase-flow 6/28
different nozzle diameters (1, 1.5, 3, 8.3 mm). Flow velocities were calculated by CFD and
measured by particle image velocimetry. After experiments acrylic lacquer was removed and
specimens were cleaned in diluted and inhibited hydrochloric acid, followed by rinsing with
alcohol and drying at 105 °C for 10 minutes.
Test conditions are shown in Table 3. As circulating gas oxygen free CO2 at a
partial pressure of 15 bar was used. As liquid phase a synthetic CO2 saturated brine with 27
g/l NaCl and a pH of 3.8 was added. Quartz sand with a grain size below 150 µm was used as
solid phase. Gas-oil ratio (GOR) was 3000 representing conditions of an Austrian gas
condensate well. In contradiction to practice no liquid hydrocarbons and no inhibitors were
used resulting in a more corrosive environment and therefore more critical conditions when
compared to practice. Erosive component is corresponding to practice since amount of added
salt water is equal to the sum of oil and brine in the well. Flow rate of gas was 250 l/h at a
total pressure of 15 bar. Flow of brine was 110 ml/h. Sand content was ten times higher than
field conditions, at a value of 0.9 g/l of liquid. The impact angle between jet stream and
specimen surface was 60°, temperature was 80 °C and testing time was in most cases 72 h.
Depth of attack was determined with an optical confocal microscope NanoFocus
µSurf ® with a vertical resolution of 50 nm in the center of the focal spot. Further sample
analysis was done by use of stereomicroscopy, optical microscopy, scanning electron
microscopy (SEM) and X-ray diffraction (XRD).
An example of a profilometric evaluation of a tested specimen is shown in Figure 3.
There is a 3D profilometry from the specimen on the left hand side. It shows the topography
of the specimen. On the right hand side and below of the stereomicroscopic view there are 2D
profiles which are measured with the NanoFocus µSurf ® system. The position of this 2D
profiles are marked with red lines in the stereomicroscopic view. In the following all erosion
rates were determined by such profilometric analysis in the center of the focal spot.

8/10/2019 Erosion Corrosion of Carbon Steels in a Laboratory Three Phase Flow
http://slidepdf.com/reader/full/erosion-corrosion-of-carbon-steels-in-a-laboratory-three-phase-flow 7/28
Characterization of flow velocity
Particle Image Velocimetry (PIV) was used for measuring flow velocities. A general
schematic of the PIV-measurement arrangement is illustrated in Figure 4. A pulsed laser
beam is formed into a light sheet and is fired twice with a short time delay. Both
illuminations are recorded by a double-frame high resolution CCD-camera. Image distortion
due to optical path or oblique viewing is corrected automatically.
The recorded image is divided into small interrogation windows typically 64 x 64
down to 8 x 8 pixels in size. During the time interval dt between the laser shots the particles
of each interrogation window have moved by a displacement ds. The velocity is then simply
given by the ratio ds/dt. The calculation of the particle displacement ds is done by cross-
correlating the two corresponding interrogation windows. For these high-speed calculations
this was done via Fast Fourier Transformation using the Wiener-Kinchin theorem. The
position of the highest peak in the correlation plane indicated the mean displacement ds of the
particles in a particular interrogation window. The displacement vectors of all interrogation
windows were finally transformed into a complete instantaneous velocity map.
CFD simulation of flow was done with the software FLUENT. The gas phase (CO2) is
considered to behave like an ideal gas. The fluid (salt water droplets) and the solid (sand)
phases both are treated as inert particles. The simulations are run stationary using the
standard k-ε turbulence model. The total grid of the 3D calculation consisted of 500000 cells
with a finer grid near the specimen’s surface and in the nozzle cell with a height of 0.1 mm.
By calculating the impact velocity one has to consider that the velocity becomes zero, at least
perpendicular to the specimen’s surface. Thus, calculations were performed with and without
specimen and specimen holder respectively. By conducting calculations without specimen
and specimen holder, both components were shifted to the right in the impingement cell to

8/10/2019 Erosion Corrosion of Carbon Steels in a Laboratory Three Phase Flow
http://slidepdf.com/reader/full/erosion-corrosion-of-carbon-steels-in-a-laboratory-three-phase-flow 8/28
avoid pressure and volume changes. Velocities obtained from calculations without specimen
and specimen holder at location of the focal spot of the specimen are applied as measure for
flow velocity at the specimen.
EXPERIMENTAL RESULTS
Characterization of Flow
The velocity distribution of droplets measured with PIV obtained with a nozzle diameter of
1.5 mm is shown in Figure 5. The outflow of the jet has a sharply decreasing velocity with
increasing distance from the nozzle. In Figure 6, three pictures are showing the inside of the
impingement cell during testing. The pictures are demonstrating the mode of operation of
three different nozzle diameters, accelerating the brine droplets and sand particles to different
velocities. Decreasing nozzle diameters (from left to right: 3; 1.5; 1 mm) yield to a more
focused jet stream and higher impact velocities. Vector plot of the CO2 gas velocity
distribution for the 1.5 mm nozzle with specimen and specimen holder is drawn in Figure 7a.
The corresponding vector plot without specimen and specimen holder is shown in Figure 7b.
Figure 8 shows a good agreement between calculated gas velocities with and without
specimen and the measured fluid droplet velocities (PIV). Position 0 mm at the x-axis is the
lower edge of the nozzle holder, and Position 9.2 mm at the x-axis the specimen’s surface. At
a distance of 3.2 mm from the specimen’s surface (position 6 mm in Figure 8), there is a
sharp decrease of flow velocity when the specimen is present due to back pressure from
specimen and specimen holder. CFD calculations with and without specimen show this
retardation effect of the specimen. As already shortly mentioned one major difficulty is
determination of flow velocity at the specimen and which velocity in which distance from the
specimen should be taken. By definition flow velocity perpendicular to the surface at the
surface of the specimen is zero, however there is a significant amount of damage by this

8/10/2019 Erosion Corrosion of Carbon Steels in a Laboratory Three Phase Flow
http://slidepdf.com/reader/full/erosion-corrosion-of-carbon-steels-in-a-laboratory-three-phase-flow 9/28
velocity component. For the used experimental setup there is due to spreading of the jet
stream a decrease of flow velocity. Due to retardation of flow by the specimen there is an
additional reduction of flow velocity. To separate both it is necessary to calculate flow
velocities with and without specimen to quantify this retardation effect. CFD calculation with
specimen is used for comparison with PIV measurements of flow velocities. CFD calculation
without specimen is used as measure of flow velocity at the specimen. There is a good
agreement between CFD and PIV results with an uncertainty in the range of 20 % (vPIV,6 mm =
17 m/s, vCFD,6 mm = 14 m/s).
From Figure 8 one can conclude that flow velocity at the specimen’s surface is 14 m/s for a
nozzle diameter of 1.5 mm when no specimen is present.
CFD simulations of used nozzle diameters with and without target are shown in
Figure 9. Calculated gas flow velocities without specimen are 11, 14 and 19 m/s being used
in figures below.
Erosion corrosion of carbon steels
After testing the focal spot had always a hill-like shape for normalized J55 and a crater-like
shape for quenched and tempered quality C95 (Figure 10). However depth of attack, also in
the focal spot was larger for normalized steel J55. Regarding the high local damage of the
specimens, the level of the focal point related to the zero level was always used for
calculating mass loss rates. Although there were deeper points of attack on the specimens,
those were not considered because the focal point itself was the area of interest. Outside the
focal spot impingement of fluid droplets and sand particles produced radial flutes. Figure 11
shows appearance of materials J55 and C95 as function of flow velocity after 72 h of testing.
The impact angle between jet stream and focal point was 60°. Consequently the topography
of damaged specimens is not symmetrical. The upper position of specimens in the
8/10/2019 Erosion Corrosion of Carbon Steels in a Laboratory Three Phase Flow
http://slidepdf.com/reader/full/erosion-corrosion-of-carbon-steels-in-a-laboratory-three-phase-flow 10/28
impingement cell (closest position to nozzle) corresponds with the upper position of sample
pictures in Figure 11. Uncleaned specimens are still showing the red acrylic lacquer, covering
the area serving as zero level and indicating the upper position. A flow velocity of 0.1 m/s
was adjusted by dropping salt water with sand particles from a height of 9.2 mm onto the
specimen. An increase of flow velocity yields to increasing erosion corrosion rates of the
samples. At low velocities (up to 11 m/s) the samples mainly suffer Mesa type corrosion and
are locally attacked. At high flow velocities (14 m/s and higher) attack is more
homogeneously distributed because of increasing erosive effect. The erosion corrosion rates
of steel J55 are higher than of steel C95. Differences between these two materials are
microstructure and hardness (see Table 2). Figure 12 is showing a XRD scan conducted on a
surface of material J55. The figure is showing intensity as function of diffraction angle in the
range from 2.5 to 85°. Due to the length of the XRD-scan, it was split at a diffraction angle of
33° and the figures positioned one below the other. All specimens were partially covered with
a carbonate layer (siderite) indicating that the mechanism of attack even at high flow
velocities is erosion of this layer, therefore erosion enhanced corrosion (EEC). The iron peak
represents areas of bare metal, where the siderite layer spalled off.
A difference between specimens’ appearance directly after testing (not cleaned) and
after ultrasonic cleaning in alcohol and distilled water is that after cleaning the sharp edges of
Mesa type attack are more pronounced than before cleaning (see J55 and C95 tested at 2, 11
m/s). Furthermore, after cleaning there are more small holes. Optical microscopy confirmed
preferable attack of specimens directly underneath the siderite layer.
Figure 13 shows the effect of testing time on erosion corrosion rate of steel J55. Till
48 h of testing there is a rather constant erosion corrosion rate, due to an incubation period of
approximately 48 hours. At the beginning of the experiments the electrolytically polished
surface is inactive yielding to lower mass loss rates. It follows an increase of surface
8/10/2019 Erosion Corrosion of Carbon Steels in a Laboratory Three Phase Flow
http://slidepdf.com/reader/full/erosion-corrosion-of-carbon-steels-in-a-laboratory-three-phase-flow 11/28
roughness during experiments, resulting in a higher specific surface and therefore a higher
corrosion rate. Moreover carbide particles in the carbon steels play an important role with
respect to corrosion rate. They work as cathodes and stabilisation of cathodes and anodes
(ferritic phase) might take some time. Constant erosion corrosion rate for steel J55 under
given conditions is near 70 mm/a.
A longitudinal cross section of steel J55 through the focal spot is shown in Figure 14.
Figure 14 a) is a low magnification indicating the location of the focal spot (double arrow)
and the zone with smaller material loss. This area is far away from the focal spot at the
plateau on the left side in Figure 14 a) (rectangular area). The latter is magnified in the Figure
14 b). The right side of Figure 14 a) shows the unaffected zone, which was covered with an
acrylic lacquer during testing. Thickness of corrosion layer at the focal point is below 10 µm.
Outside the focal point layer thickness of corrosion products is increasing, reaching up to 100
µm in the area that was hardly affected by flow (Figure 14 b). There lines of cementite
skeleton filled with siderite and small amounts of unaffected pearlite are present (Figure 14
c). Even manganese sulphides have maintained their size and can be identified at higher
magnifications (arrow in Figure 14 c).
The surface of specimen J55 directly after testing in CO2 atmosphere is shown in
Figure 15. There is a rough surface at the focal point showing some grains of pearlite
uncovered with a siderite layer (Figure 15 a). The right upper edge of the image shows a zone
with a siderite layer not being spalled. The plateau at the edge of the specimen showing
hardly any siderite spalling is shown in Figure 15 b). There are several cracks in the layer as
well as smaller impacts of sand grains.
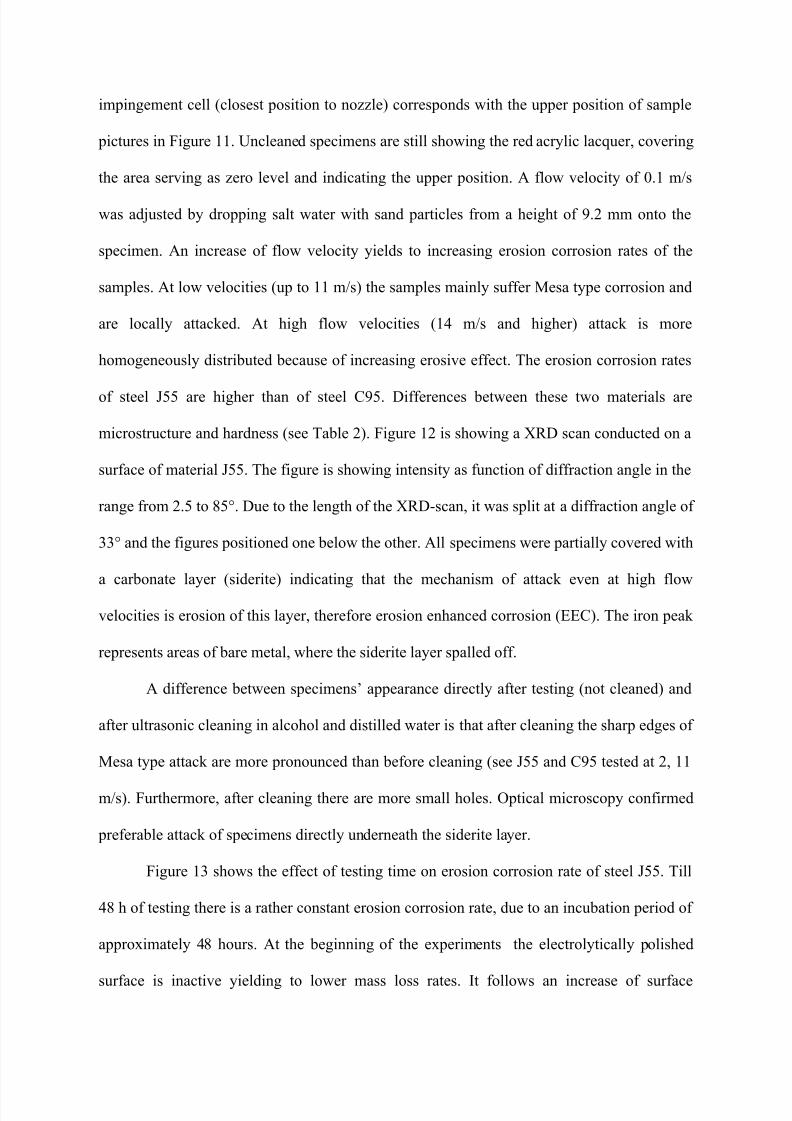
Figure 16 shows the surface of steel C95 in the focal spot after testing. In
contradiction to material J55 there is a smoother surface with more rounded structures and
small holes on material C95.

8/10/2019 Erosion Corrosion of Carbon Steels in a Laboratory Three Phase Flow
http://slidepdf.com/reader/full/erosion-corrosion-of-carbon-steels-in-a-laboratory-three-phase-flow 12/28
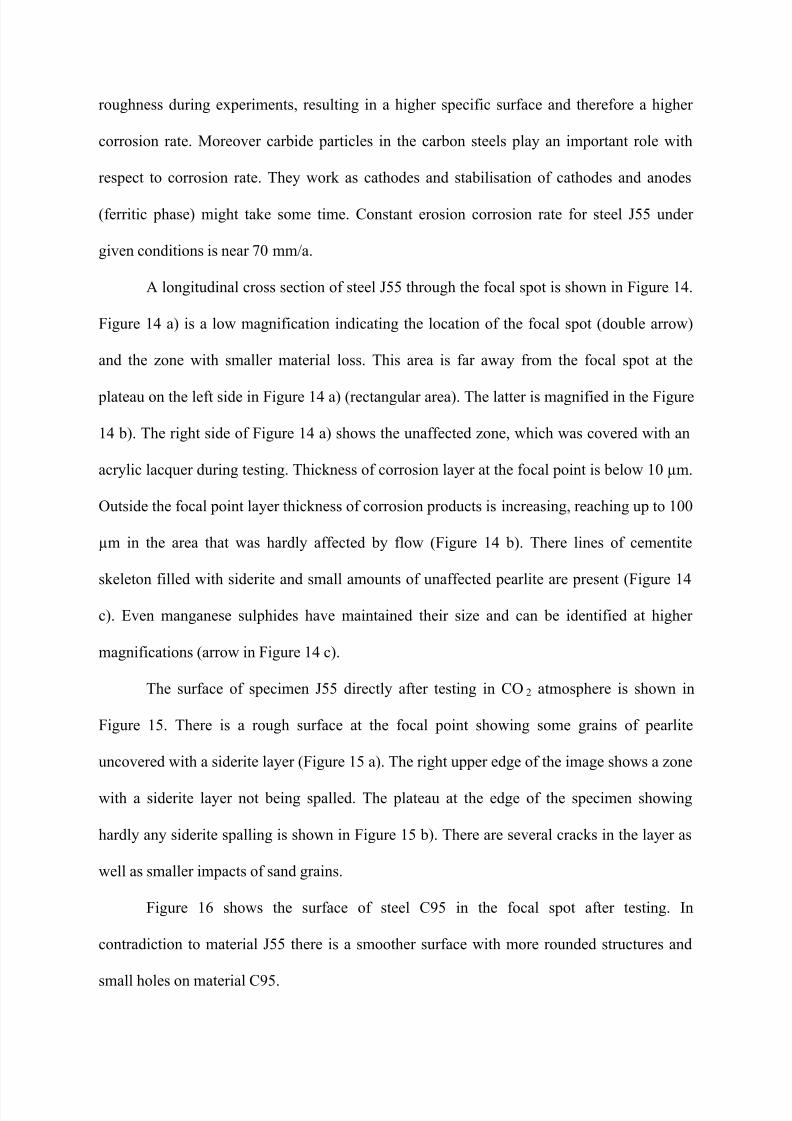
The erosion corrosion rate as function of calculated gas velocity is shown in Figure
17. The mass loss rate increased steadily when increasing flow velocity. There is always a
certain difference between ferritic-pearlitic J55 and quenched and tempered C95 with respect
to erosion corrosion rate under same test conditions. Mass loss rate of J55 was slightly higher
than of C95. There is still a rather big scatter of results although conducting 72 h
experiments. An increase of testing period would improve repeatability.
It is obvious that even when the brine - sand mixture only drops through a wide
nozzle, mass loss rate is in the order of 20 to 30 mm/a. Limit for corrosive attack in oil and
gas production for pipelines is clearly below 0.1 mm/a.
Discrepancy between present results and practice is obtained by using no liquid
hydrocarbons and no inhibitor in laboratory resulting in highly corrosive conditions. This was
done mainly for fundamental reasons, not to contaminate a new experimental setup during a
first 3 year period.
DISCUSSION
In the focal point normalized steel J55 shows a higher erosion corrosion rate than martensitic
grade C95. Difference is between 10 and 40 %. Under given conditions a mixed
siderite/cementite layer covers at least partly the steel surface. At high flow velocities the
impact energy of sand particles and also of fluid droplets is high enough to cause destruction
of the soft siderite layer by partial spalling and breakouts. Due to CO2 atmosphere siderite is
reformed to protect the specimen’s surface. At or near a layer thickness of 10 µm due to
triaxial and impact stresses in the layer during droplet and particle impacts strain is hindered
and localized spalling of the layer might happen. Outside of the focal point for material J55
material loss is increased although impact energy of fluid droplets and sand grains is smaller
than inside the focal spot. According to Turenne41
erosion conditions widely change with

8/10/2019 Erosion Corrosion of Carbon Steels in a Laboratory Three Phase Flow
http://slidepdf.com/reader/full/erosion-corrosion-of-carbon-steels-in-a-laboratory-three-phase-flow 13/28
increasing distance from the focal spot. With an increase of distance impact angles of
particles become smaller and shear stresses increase. This would mean that normalized
material J55 behaves ductile and quenched and tempered C95 is brittle. Higher strength and
lower ductility of steel C95 when compared to J55 say for this argument. On the other side
the different behaviour of the two materials at and beside the focal spot may also be
explained by the galvanic effect between the remaining morphology of carbides and the
ferritic bulk phase of the steels. At the focal spot normalized J55 shows a very thin siderite
layer if there is any present. Consequently there is only a very limited free surface of
cementite in this thin siderite layer that can act as a cathode. Outside the spot a thicker
carbonate layer was found, containing a larger amount of cementite that might cause
acceleration of corrosion. Far away from the focal point there is almost no material loss due
to a very thick (100 µm) and a protective siderite scaling. Note, the thickness of the scaling in
the flow affected zone close to the focal spot is up to one grain diameter of the ferrite-pearlite
enabling galvanic coupling between the cementite lamellas and the corrosion front at the
ferrite phase. Far away from the focal spot several layers of siderite and siderite/cementite
from the former elongated grain structure of the alloy are present. There is no sufficient
electrical contact from the outer surface of this thick siderite to the siderite/cementite -
ferrite/pearlite interface. Consequently maximum rate of material loss closely outside the
focal spot of the normalized material could also be explained by the cathodic effect of
cementite lamellas.
Tempered martensitic steel C95 shows generally a lower material loss when
compared to normalized steels. However the focal spot is attacked deeper than its
surrounding. If the martensite behaves brittle, maximum depth of attack has to be expected in
the center of the focal spot which has been found. Again the cathodic effect of spherical
carbides is able to explain the experimental results. Carbides in tempered martensite are small
8/10/2019 Erosion Corrosion of Carbon Steels in a Laboratory Three Phase Flow
http://slidepdf.com/reader/full/erosion-corrosion-of-carbon-steels-in-a-laboratory-three-phase-flow 14/28
and spherical and have no plate-like shape as cementite in pearlite. Therefore their cathodic
effect is much smaller (almost zero) and corrosion rate is lower (Figure 10). Since erosion
intensity decreases with an increasing distance from the focal point, layer thickness increases
yielding to a more protective scale. The latter results again in a lower corrosion rate outside
the focal spot.
Simulation compared with the results of PIV measurement shows that the general
flow field is very similar for the simulations and the practical measurements. Note, that the
PIV velocities represent fluid droplet velocities and the CFD simulation shows CO2 gas
velocities. One major problem in erosion corrosion research is characterisation of flow and
impact velocities. At the specimen’s surface the gas has a velocity of zero perpendicular to
the surface. Particles transported with the fluid (in the present case water droplets and sand
particles) have a certain impact velocity due to inertia forces. In the nozzle particles and
droplets are speeding up due to acceleration of flow. Outside the nozzle particles and droplets
slow down firstly due to spreading of flow and secondly due to back pressure of specimens
surface. Therefore a free flow scenario without specimen was calculated and particle velocity
at a distance of 9.2 mm from the nozzle (location of specimen) was used as a measure for
flow velocity. For all velocity calculations of fluid droplets a spherical droplet diameter of
100 µm was considered as an average value for all nozzles. This diameter was obtained from
PIV measurements.
CONCLUSIONS
Investigated carbon steels suffer erosion enhanced corrosion under tested conditions.
The steel surface is attacked by the artificial brine resulting in siderite formation. Siderite is
eroded mainly by impact of particles (sand and water droplets). With an increase of distance

8/10/2019 Erosion Corrosion of Carbon Steels in a Laboratory Three Phase Flow
http://slidepdf.com/reader/full/erosion-corrosion-of-carbon-steels-in-a-laboratory-three-phase-flow 15/28
from the center of the focal spot the thickness of the siderite layer increases. Material loss is
steadily increased with an increase of flow velocity.
Normalized steels show a certain deeper attack than quenched and tempered steels in
the focal spot. Close to the focal spot the depth of attack of normalized steels is much larger
than that of tempered martensite. Whereas ferritic-pearlitic materials show a hill-like surface
topography after testing the tempered martensites show a crater-like shape of the surface.
Reasons for this can be a general difference in degradation behavior of the two types of
materials (ductile for normalized materials, brittle for tempered martensite). These findings
however can also be supported by a galvanic effect between carbide phase in the siderite
layer and the ferritic phase of the steels. Martensitic steels generally show lower degradation
rates when compared to ferritic-pearlitic steels either due to higher hardness or due to weaker
cathodes because of spherical carbides.
ACKNOWLEDGMENTS
Financial support by the Österreichische Forschungsförderungsgesellschaft mbH, the
Province of Styria, the Steirische Wirtschaftsförderungsgesellschaft mbH and the
Municipality of Leoben within research activities of the Materials Center Leoben under the
frame of the Austrian Kplus Competence Center Programme is gratefully acknowledged.
REFERENCES
1. A. Neville, C. Wang, S. Ramachandran, V. Jovancicevic, “Erosion-Corrosion
Mitigation Using Chemicals,” CORROSION/03, paper no. 03319 (San Diego, CA:
NACE, 2003)
2. M. Oberndorfer, private communication, OMV AG, Wien, 30.01.2003

8/10/2019 Erosion Corrosion of Carbon Steels in a Laboratory Three Phase Flow
http://slidepdf.com/reader/full/erosion-corrosion-of-carbon-steels-in-a-laboratory-three-phase-flow 16/28
3. API RP 14E, Recommended Practice for Design and Installation of Offshore
Production Platform Piping Systems, American Petroleum Institute (1991),
Washington, p. 1-59
4. M.B. Kermani, A. Morshed, Corrosion 59, 8 (2003): p. 659-683
5. J.L. Dawson, C.C. Shih, P.K.N. Bartlett, Predicting of CO2 Corrosion in the Oil and
Gas Industry, Models of CO2 Corrosion and Erosion-Corrosion Under Flowing
Conditions, The European Federation of Corrosion Publications Number 13, The
Institute of Materials (1994), p. 151-170
6. H.-R. Christen, Grundlagen der Allgemeinen und Anorganischen Chemie
(Saarbrücken, Germany: Otte Salle Verlag, 1988), p. 554
7. J. Serrano, J. Penalver, SPE 23651, (1992), p. 197-206
8. M.M. Stack, L. Bray, Wear 186-187 (1995), p. 273-283
9. J.R. Shadley, S.A. Shirazi, E. Dayalan, E.F. Rybicki, “Prediction of Erosion-
Corrosion Penetration Rate in a CO2 Environment with Sand,” CORROSION/98,
paper no. 59, (Houston, TX: NACE, 1998)
10. P. Andrews, T.F. Illson, S.J. Matthews, Wear 233-235 (1999), p. 568-574
11. M. Ramakrishna, S. Nesic, D. Gulino, “Erosion Corrosion and Synergistic Effects in
Disturbed Liquid-Particle Flow,” 16th International Corrosion Congress/05, paper no.
12-16 (Beijing, China: ICC, 2005)
12. A.J. Buchan, A.J.S. Spearing, Journal of the South African Institut of Mining and
Metallurgy (1994), p. 37-46
13. T.J. Lockett, B. McLoughlin, P. Wharton, “Sand Erosion Management in HPHT
Service,” CORROSION/00, paper no. 78 (Houston, TX: NACE, 2000)
14. F. Ferrer, T. Faure, J. Goudiakas, E. Andres, Corrosion Science 44 (2002), p. 1529-
1540

8/10/2019 Erosion Corrosion of Carbon Steels in a Laboratory Three Phase Flow
http://slidepdf.com/reader/full/erosion-corrosion-of-carbon-steels-in-a-laboratory-three-phase-flow 17/28
15. T. Hara, H. Asahi, H. Kaneta, “Effect of Flow Velocity on CO2 Corrosion and
Galvanic Corrosion Behavior in Oil and Gas Environments,” CORROSION/98, paper
no. 118 (Houston, TX: NACE, 1998)
16. M. Gopal, D. Vedapuri, J. Laws, “Multiphase Flow and its Effects on Localized
Corrosion in Regions with Abrupt Inclination Changes,” CORROSION/00, paper no.
65 (Houston, TX: NACE, 2000)
17. J. Chen, J.R. Shadley, H. Rincon, E.F. Rybicki, “Effects of Temperature on Erosion-
Corrosion of 13Cr,” CORROSION/03, paper no. 3320 (Houston, TX: NACE, 2003)
18. B. Labus, Einfluss grenzflächenaktiver Stoffe auf das Wirkverhalten von Inhibitoren
bei der Süßgaskorrosion, PhD thesis, University of Aachen, Germany (1991), p. 1-180
19. K. Heil, J. Weber, Materialprüfung 23 (1981), p. 166-170
20. A. Karimi, R.K. Schmid, Wear 156 (1992), p. 33-47
21. V. Sehadri, R. Gupta, S.N. Singh, Wear 184 (1995), p. 169-178
22. G. Schmitt, C. Bosch, U. Pankoke, W. Bruckhoff, G. Siegmund, “Evaluation of
Critical Flow Intensities for FILC in Sour Gas Production,” CORROSION/98, paper
no. 46 (Houston, TX: NACE, 1998)
23. Y. Puget, K.R. Trethewey, R.J.K. Wood, “The Performance of Cost-Effective
Coatings in Aggressive Saline Environments, CORROSION/98, paper no. 688
(Houston, TX: NACE, 1998)
24. P. Andrews, T.F. Illson, S.J. Matthews, Wear 233-235 (1999), p. 568-575
25. S.A. Shirazi, B.S. McLaury, J.R. Shadley, E.F. Rybicki, ASME PVP Vol. 259, Codes
and Standards in a Global Environment, 1993, p. 159-167
26. K Jordan, “Erosion in Multiphase Production of Oil & Gas,” CORROSION/98, paper
no. 58 (Houston, TX: NACE, 1998)

8/10/2019 Erosion Corrosion of Carbon Steels in a Laboratory Three Phase Flow
http://slidepdf.com/reader/full/erosion-corrosion-of-carbon-steels-in-a-laboratory-three-phase-flow 18/28
27. L. van Bodegom, U. Lotz, Flow Effects on Corrosion of Carbon Steel, Corrosion
Prevention in the Process Industries, Amsterdam (1988), p. 123-138
28. J. Weisman, S.Y. Kang, Int. J. Multiphase Flow 7, 3 (1981), p. 271-291
29. M.C. Vincent, H.B. Miller, D. Milton-Tayler, B. Kaufman, SPE 90604 (2004), p. 1-17
30. G. Ogundele, A. Lloyd, S. Pagan, F. Camacho, “Simulation of Erosion Corrosion
Mechanism Using Rotating Cylinder Electrode Assembly,” 16th International
Corrosion Congress/05, paper 12-03 (Beijing, China: ICC, 2005)
31. X. Hu, A. Neville, “Characterisation of the Corrosion Behavior of Stainless Steels in
Erosion-Corrosion by Multiple-Impact and Single Particle Impact Measurements,”
16th International Corrosion Congress/05, paper 12-10 (Beijing, China: ICC, 2005)
32. C. Wang, A. Neville, SPE 87551 (2004), p. 1-9
33. K.C. Chen, J.L. He, W.H. Huang, T.T. Yell, Wear 252 (2002), p. 580-585
34. N. Birks, F.S. Pettit, D.M. Rishel, Journal de physique IV (1993), p. 667-678
35. D.M. Rishel, F.S. Pettit, N. Birks, Materials Science and Engineering A 143 (1991),
p. 197-211
36. D.M. Rishel, F.S. Pettit, N. Birks, Some Fundamental Aspects of the Attack of Metals
Simultaneously by Erosion and Corrosion at Elevated Temperatures-Proc. Int’l. Sym.
on Corrosion Science and Engineering, held March 12-15, 1989 (Brussels, Belgium:
2005), p. 129-147
37. P.J. Blau, Friction, Lubrication, and Wear Technology, ASM Handbook, ASM
International, Ohio, 1994, p. 199-213
38. S. Van der Zwaag, J.E. Field, Philosophical Magazine A 46 (1982), p. 133-150
39. M.M. Stack, S. Lekatos, F.H. Stott, Tribology International 7 (1995), p. 445-451
40. API 5 CT, Specification for Casing and Tubing, API, Washington, 2001, 7th Edition
41. S. Turenne, Wear 149 (1991), p. 187-197

8/10/2019 Erosion Corrosion of Carbon Steels in a Laboratory Three Phase Flow
http://slidepdf.com/reader/full/erosion-corrosion-of-carbon-steels-in-a-laboratory-three-phase-flow 19/28
TABLE 1
Chemical composition of investigated materials [%]
Material C Si Mn P S Cr Mo Ni Al Cu N
J55 0.30 0.20 1.38 0.012 0.012 0.41 0.02 0.04 0.03 0.06 0.007
C95 0.29 0.20 1.33 0.013 0.007 0.25 0.007 0.018 0.023 0.019 0.006
TABLE 2
Mechanical properties of investigated materials
Material Yield strength [N/mm²] Tensile strength [N/mm²] Elongation [%]
J55 415 – 465 650 - 750 22 - 34
C95 670 – 710 790 - 820 19 - 23
TABLE 3
Testing conditions and conditions in an Austrian gas condensate well
Gas condensate well in Austria Test conditions
GOR ~3000 3000
Gas [m 3] 10 6 10 6
Liquid HC [m 3] 350 -
Water [m 3] 30 380
Cl- [g/l] 15 15
Sand [kg] 34.2 342
Grain size [µm] ≤ 150 ≤ 150
Velocity max [m/s] 5-10 -70
Impact angle [°] 0-90 60
Temperature [°C] 80 80
Pressure [bar] 70-100 15 (CO 2)
Depth [m] 3000 -

8/10/2019 Erosion Corrosion of Carbon Steels in a Laboratory Three Phase Flow
http://slidepdf.com/reader/full/erosion-corrosion-of-carbon-steels-in-a-laboratory-three-phase-flow 20/28
FIGURE 1. Schematic of erosion-corrosion test rig
FIGURE 2. Impingement cell with specimen, specimen holder and nozzle

8/10/2019 Erosion Corrosion of Carbon Steels in a Laboratory Three Phase Flow
http://slidepdf.com/reader/full/erosion-corrosion-of-carbon-steels-in-a-laboratory-three-phase-flow 21/28
FIGURE 3. 3D and 2D profilometric erosion rate analysis by erosion corrosion
testing samples
FIGURE 4. Schematic of PIV – measurement arrangement

8/10/2019 Erosion Corrosion of Carbon Steels in a Laboratory Three Phase Flow
http://slidepdf.com/reader/full/erosion-corrosion-of-carbon-steels-in-a-laboratory-three-phase-flow 22/28
FIGURE 5. Fluid droplet velocity measured by particle image velocimetry for the 1.5
mm nozzle
FIGURE 6. Pictures of the inside of the impingement cell during testing, taken by ahigh velocity CCD-Camera, nozzle diameters from left to right: 3; 1.5; 1 mm

8/10/2019 Erosion Corrosion of Carbon Steels in a Laboratory Three Phase Flow
http://slidepdf.com/reader/full/erosion-corrosion-of-carbon-steels-in-a-laboratory-three-phase-flow 23/28
FIGURE 7. Vector plot of the CO 2 gas velocity for 1.5 mm nozzle calculated with
CFD with specimen (FIGURE 7a.) and without specimen (FIGURE 7b.)
0
5
10
15
20
25
30
35
40
45
0 2 4 6 8 10 12 14distance from nozzle holder [mm]
f l o w
v e
l o c
i t y [ m / s
]
CFD with specimen
CFD without specimen
PIV with specimen
FIGURE 8. Calculated (CFD) and measured (PIV) flow velocities for 1.5 mm nozzle
diameter (with and without (NT) target) as function of distance from nozzle holder in
the centre of the jet stream Note: CFD calculations refer to gas velocity, PIV
measurements to fluid droplets velocity

8/10/2019 Erosion Corrosion of Carbon Steels in a Laboratory Three Phase Flow
http://slidepdf.com/reader/full/erosion-corrosion-of-carbon-steels-in-a-laboratory-three-phase-flow 24/28
0
10
20
30
40
50
60
0 2 4 6 8 10 12 14distance from nozzle holder [mm]
f l o w
v e
l o c
i t y [ m / s
]
1mm with specimen
1.5mm with spec.
3mm with specimen
1mm without spec.
1.5mm without
s p e c
i m e n s u r f a c e
n o z z
l e h o
l d e r
FIGURE 9. Gas velocities with and without specimen for different nozzle diameters
calculated with CFD
FIGURE 10. Line profile across the focal point for J55 and C95 qualities
J55
C95
h
e i g h t
distance on specimen
zero level

8/10/2019 Erosion Corrosion of Carbon Steels in a Laboratory Three Phase Flow
http://slidepdf.com/reader/full/erosion-corrosion-of-carbon-steels-in-a-laboratory-three-phase-flow 25/28
CO 2 gas velocity J55 C95not cleaned cleaned not cleaned cleaned
0.1 m/s
mass loss rate 21 mm/a 33 mm/a
2 m/s
mass loss rate 40 mm/a 29 mm/a
11 m/s
mass loss rate 35 mm/a 33 mm/a
14 m/s
mass loss rate 66 mm/a 44 mm/a
19 m/s
mass loss rate 66 mm/a 44 mm/a
FIGURE 11. J55 and C95 samples exposed to jet impingement for 72 h, 80°C,impingement angle 60°, 0.9 g/l sand

8/10/2019 Erosion Corrosion of Carbon Steels in a Laboratory Three Phase Flow
http://slidepdf.com/reader/full/erosion-corrosion-of-carbon-steels-in-a-laboratory-three-phase-flow 26/28
FIGURE 12. XRD-Scan of the surface of material J55, 72 h exposure time, 80°C,
impingement angle 60°, 0.9 g/l sand, v gas =19 m/s, siderite (FeCO 3), iron (Fe)
0102030405060708090
100
0 24 48 72 96 120 144 168
testing time [h]
e r o s
i o n c o r r o s
i o n r a
t e [ m m
/ a ]
scatter band
incubation time
chosentestingtime
FIGURE 13. Erosion rate after erosion-corrosion testing by different testing times of
J55, 80°C, impingement angle 60°, 0.9 g/l sand, v gas =19 m/s

8/10/2019 Erosion Corrosion of Carbon Steels in a Laboratory Three Phase Flow
http://slidepdf.com/reader/full/erosion-corrosion-of-carbon-steels-in-a-laboratory-three-phase-flow 27/28
FIGURE 14. Metallographic cross section of steel J55
a) focal point b) plateau unaffected from flow
FIGURE 15. Surface of J55 at focal point and at plateau unaffected from flow, 72 h
exposure time, 80°C, impingement angle 60°, 0.9 g/l sand, v gas =19 m/s
a
cb
8/10/2019 Erosion Corrosion of Carbon Steels in a Laboratory Three Phase Flow
http://slidepdf.com/reader/full/erosion-corrosion-of-carbon-steels-in-a-laboratory-three-phase-flow 28/28
FIGURE 16. Surface of C95 at focal point, 72 h exposure time, 80°C, impingement
angle 60°, 0.9 g/l sand, v gas =19 m/s
FIGURE 17. Erosion rate as a function of calculated gas velocity of J55 and C95,
72 h exposure time, 80°C, impingement angle 60°, 0.9 g/l sand
Corrosion
Erosion enhanced corrosion
0
10
20
30
40
50
60
70
80
0 2 4 6 8 10 12 14 16 18 20flow velocity [m/s]
e r o s
i o n c o r r o s
i o n r a t e
[ m m
/ a ] J55 C95