Embed Size (px)
Citation preview
This article was downloaded by: [Tulane University]On: 30 August 2014, At: 20:26Publisher: RoutledgeInforma Ltd Registered in England and Wales Registered Number: 1072954Registered office: Mortimer House, 37-41 Mortimer Street, London W1T 3JH,UK
Bilingual Research Journal:The Journal of the NationalAssociation for BilingualEducationPublication details, including instructions forauthors and subscription information:http://www.tandfonline.com/loi/ubrj20
Equity of Literacy-Based MathPerformance Assessments forEnglish Language LearnersClara Lee Brown aa The University of Tennessee , KnoxvillePublished online: 22 Nov 2010.
To cite this article: Clara Lee Brown (2005) Equity of Literacy-Based MathPerformance Assessments for English Language Learners, Bilingual Research Journal:The Journal of the National Association for Bilingual Education, 29:2, 337-363, DOI:10.1080/15235882.2005.10162839
To link to this article: http://dx.doi.org/10.1080/15235882.2005.10162839
PLEASE SCROLL DOWN FOR ARTICLE
Taylor & Francis makes every effort to ensure the accuracy of all theinformation (the “Content”) contained in the publications on our platform.However, Taylor & Francis, our agents, and our licensors make norepresentations or warranties whatsoever as to the accuracy, completeness,or suitability for any purpose of the Content. Any opinions and viewsexpressed in this publication are the opinions and views of the authors, andare not the views of or endorsed by Taylor & Francis. The accuracy of theContent should not be relied upon and should be independently verified withprimary sources of information. Taylor and Francis shall not be liable for anylosses, actions, claims, proceedings, demands, costs, expenses, damages,and other liabilities whatsoever or howsoever caused arising directly or

indirectly in connection with, in relation to or arising out of the use of theContent.
This article may be used for research, teaching, and private study purposes.Any substantial or systematic reproduction, redistribution, reselling, loan,sub-licensing, systematic supply, or distribution in any form to anyone isexpressly forbidden. Terms & Conditions of access and use can be found athttp://www.tandfonline.com/page/terms-and-conditions
Dow
nloa
ded
by [
Tul
ane
Uni
vers
ity]
at 2
0:26
30
Aug
ust 2
014
337Equity of Literacy-Based Math Assessments
Equity of Literacy-Based MathPerformance Assessments forEnglish Language Learners
Clara Lee BrownThe University of Tennessee, Knoxville
Abstract
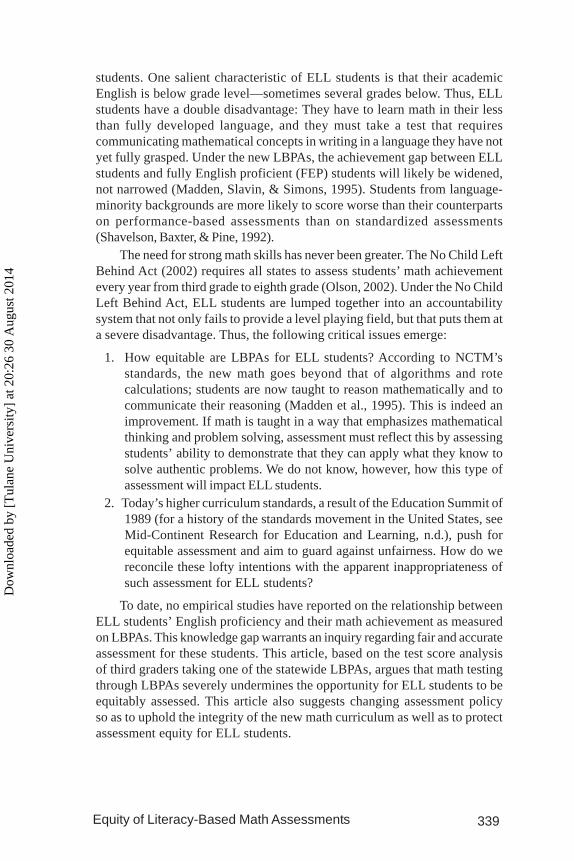
This article reports findings from a study that investigated mathachievement differences between English language learners (ELLs)and fully English proficient (FEP) students on a literacy-basedperformance assessment (LBPA). It has been assumed that LBPAsare superior to standardized multiple-choice assessments, but ithas not been determined if LBPAs are appropriate for measuringthe math achievement of ELLs. The most salient characteristic ofLBPAs is that students read multi-level questions and explain howthey solve math problems in writing. Thus, LBPAs place greatliteracy demands upon students. Because most ELLs haveunderdeveloped literacy skills in English, these demands put ELLsat a great disadvantage. Analysis revealed that socioeconomicstatus (SES) had a significant impact on all students, but the impactwas larger on FEP students than on ELLs; high-SES FEP studentsoutperformed high-SES ELLs, but there was no significant differencebetween low-SES ELLs and low-SES FEP students. High SESgenerally means more cognitive academic language proficiency,because of the influence of non-school factors such as the presenceof a print-rich environment. High-SES ELLs did not do as well ashigh-SES FEP students because of a lack of academic English. Thenature of the examination masked their true abilities. The findingof no difference between low-SES ELLs and low-SES FEP students,however, could be a result of the fact that neither group had theadvantage of high cognitive academic language proficiency; the FEPstudents’ only “advantage” was superior conversational English,of little use for performing academic tasks. This article concludesthat LBPAs, together with the current assessment-drivenaccountability system, seriously undermine equal treatment forELLs.
Dow
nloa
ded
by [
Tul
ane
Uni
vers
ity]
at 2
0:26
30
Aug
ust 2
014

338 Bilingual Research Journal, 29: 2 Summer 2005
Introduction
It has long been recognized that a substantial achievement gap existsbetween language-minority students and native speakers of English (August& Hakuta, 1997; Silver, Smith, & Nelson, 1995). A significant gap in mathscores, in particular, has caused widespread concern among educators (Khisty,1997; Secada, Fennema, & Adajian, 1995). Moreover, language-minoritystudents are less likely to be represented in math-related majors in highereducation, which affects their career opportunities and lifetime earnings(Bernardo, 2002; Cuevas, 1984; Torres & Zeidler, 2001). Apparently, mathachievement plays a significant role in the academic and social stratificationof minorities (Khisty, 1995; Secada, 1992). Thus, English language learner(ELL) students’ math achievement—or lack thereof—should be explored inlight of new ways ELL students are being assessed.
Under the standards-based reform movement initiated in the late 1980s,the National Council of Teachers of Mathematics (NCTM) publishedCurriculum and Evaluation Standards for School Mathematics (1989),specifying what students should know and be able to do. NCTM declaredthat a more problem-solving and higher order thinking–based curriculum shouldreplace the arithmetic- and isolated facts–based traditional approach. These1989 NCTM standards also conveyed the importance of mathematical literacy,especially students’ ability to communicate mathematically, so that they canread, write, and discuss mathematics.
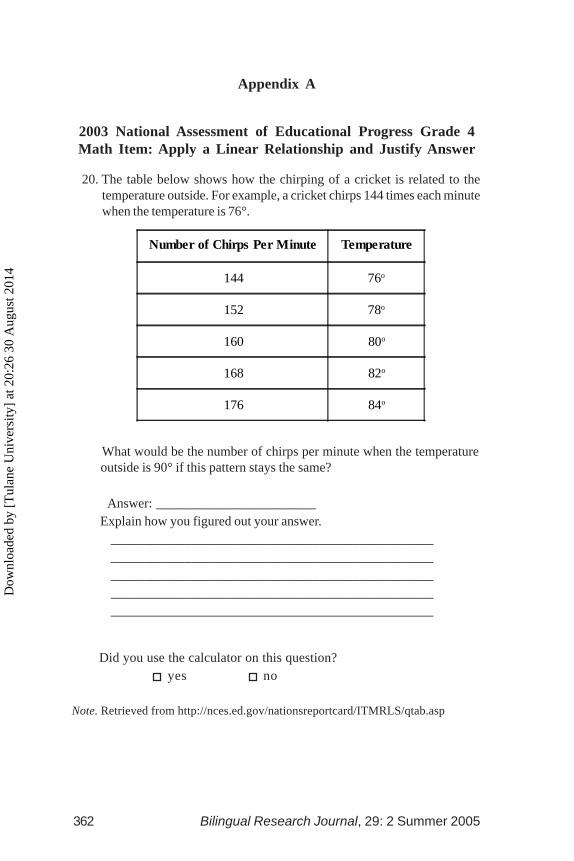
While this curriculum movement was taking place, various states creatednew assessment programs that reflected the tenets of NCTM’s new mathcurriculum: understanding concepts rather than algorithms, critical thinking,problem solving, and communicating mathematically. As a result, states suchas Connecticut, Kentucky, Maryland, Vermont, and Wisconsin created literacy-based performance assessments (LBPAs) in content areas such as math(National Council of Teachers of Mathematics, 1995). The strength of LBPAslies in asking students to solve real-life problems by applying higher orderand critical thinking skills based on conceptual understanding and then toexplain, in writing, how they solved the problems. LBPAs go beyond thetraditional multiple-choice standardized testing procedures: In LBPAs, suchas National Assessment of Educational Progress testing, math questions areopen ended. However, the percentage of open-ended questions differs fromstate to state. In Maryland, all math questions are open ended and highlyliteracy based. They require students to read rather lengthy, multiple-partquestions and provide a written response describing the problem-solvingprocess, and how they solved the problems (see sample questions inAppendixes A and B).
Although they are timely and appropriate for preparing all students forthe 21st century’s era of information and high technology, the new assessmentshave their drawbacks, especially in evaluating the math achievement of ELL
Dow
nloa
ded
by [
Tul
ane
Uni
vers
ity]
at 2
0:26
30
Aug
ust 2
014
339Equity of Literacy-Based Math Assessments
students. One salient characteristic of ELL students is that their academicEnglish is below grade level—sometimes several grades below. Thus, ELLstudents have a double disadvantage: They have to learn math in their lessthan fully developed language, and they must take a test that requirescommunicating mathematical concepts in writing in a language they have notyet fully grasped. Under the new LBPAs, the achievement gap between ELLstudents and fully English proficient (FEP) students will likely be widened,not narrowed (Madden, Slavin, & Simons, 1995). Students from language-minority backgrounds are more likely to score worse than their counterpartson performance-based assessments than on standardized assessments(Shavelson, Baxter, & Pine, 1992).
The need for strong math skills has never been greater. The No Child LeftBehind Act (2002) requires all states to assess students’ math achievementevery year from third grade to eighth grade (Olson, 2002). Under the No ChildLeft Behind Act, ELL students are lumped together into an accountabilitysystem that not only fails to provide a level playing field, but that puts them ata severe disadvantage. Thus, the following critical issues emerge:
1. How equitable are LBPAs for ELL students? According to NCTM’sstandards, the new math goes beyond that of algorithms and rotecalculations; students are now taught to reason mathematically and tocommunicate their reasoning (Madden et al., 1995). This is indeed animprovement. If math is taught in a way that emphasizes mathematicalthinking and problem solving, assessment must reflect this by assessingstudents’ ability to demonstrate that they can apply what they know tosolve authentic problems. We do not know, however, how this type ofassessment will impact ELL students.
2. Today’s higher curriculum standards, a result of the Education Summit of1989 (for a history of the standards movement in the United States, seeMid-Continent Research for Education and Learning, n.d.), push forequitable assessment and aim to guard against unfairness. How do wereconcile these lofty intentions with the apparent inappropriateness ofsuch assessment for ELL students?
To date, no empirical studies have reported on the relationship betweenELL students’ English proficiency and their math achievement as measuredon LBPAs. This knowledge gap warrants an inquiry regarding fair and accurateassessment for these students. This article, based on the test score analysisof third graders taking one of the statewide LBPAs, argues that math testingthrough LBPAs severely undermines the opportunity for ELL students to beequitably assessed. This article also suggests changing assessment policyso as to uphold the integrity of the new math curriculum as well as to protectassessment equity for ELL students.
Dow
nloa
ded
by [
Tul
ane
Uni
vers
ity]
at 2
0:26
30
Aug
ust 2
014

340 Bilingual Research Journal, 29: 2 Summer 2005
Review of Related Literature
Second-Language Proficiency and Academic Achievement
Cummins (1980, 1981) has provided a much-needed framework in the fieldof bilingual and English as a Second Language (ESL) education. His criticalwork reveals why ELL students’ academic achievement cannot be assessed inthe same manner as that of their FEP counterparts. He asserts that oral fluencycannot be regarded as academic competence in academic settings.
Cummins theorizes that there are two distinctively different proficiencies.Basic conversational language ability is acquired rapidly. ELL students takeonly a year or 2 to become proficient in conversational English (see alsoHakuta, Butler, & Witt, 1999). In contrast, attaining grade level of academicEnglish can take far longer, as long as 5 to 7 years. Academic English isnecessary for tasks that are context reduced, such as reading chapters in atextbook that describes different math functions.
Second-Language Proficiency and Math Achievement
What makes math such a difficult subject for ELL students? First, ELLstudents must filter their math knowledge—a language all its own—througha second language, English. So, in this case, math becomes the “third” language.Students face an extra challenge, then, as they attempt to learn cognitivelydemanding, highly abstract mathematical concepts while they are still learningEnglish (Chamot & O’Malley, 1994).
Second, math learning must be accrued. For example, students must knowhow to add and subtract before they can learn how to multiply and divide, andmust learn multiplication and division before learning ratios. In addition, asstudents progress in math, content and textbooks become more difficult. Thus,as ELL students proceed to higher grades, they face increasingly greaterchallenges in keeping up or catching up with their counterparts. As a result,the achievement gap widens.
Third, math vocabulary is not commonly used in daily settings, is technicalin nature, and is narrowly defined (Cuevas, 1984). Krussel (1998) views languageas an essential part of the math construct because language is an indispensabletool in math. It comes as no surprise that ELL students are not successful atsolving word problems loaded with difficult and unfamiliar vocabulary (Abedi& Lord, 2001; Solano-Flores & Trumbull, 2003). For ELL students who are justlearning English, words such as least common denominator, ratio, or quotienthave little meaning. In most cases, the concept is new, and in addition, wordsmay be used in ways that are quite different from uses in ordinary language.
Fourth, syntax—language structure—used in math is highly complexand very specific. Math uses syntactic features that many students findcumbersome, and that can be especially confusing for ELL students. For
Dow
nloa
ded
by [
Tul
ane
Uni
vers
ity]
at 2
0:26
30
Aug
ust 2
014

341Equity of Literacy-Based Math Assessments
example, the use of comparatives (e.g., higher than, greater than, as much as),passive voice (e.g., X is added to Y), reversed ways of stating the known andunknown variables (e.g., X is 2 less than Y; the correct equation is X = Y – 2,not X – 2 = Y) can exacerbate confusion (Chamot & O’Malley, 1994. p. 230).Cuevas (1984) and Carey, Fennema, Carpenter, and Franks (1995) point outthat, unlike the language of literary narratives, reduced redundancy inmathematical expressions makes it extremely hard for ELL students tocomprehend what they read in math textbooks, which lack the built-in contextualcues found in language arts.
The following example illustrates how the structure of word problems canlead ELL students to misunderstand the question. A bilingual student in ninth-grade Algebra I wrote “X3 > N” as an answer to “The number of nickels in mypocket is three times more than the number of dimes” (Mestre, 1988 p. 205).Mestre attributed the incorrect response to the missing word equal in theword problem. Thus, the student misinterpreted “more than” as a statement ofinequality. Abedi and Lord (2001) reported that ELL students achieved slightlyhigher scores on a modified math test written using simpler language and lesscomplex language structure. They concluded that ELL students’ mathperformance was confounded by their language skills.
Fifth, ELL students’ reading skills affect their math performance. Previousstudies also show high correlations between math and reading scores. McGhan(1995) reported a correlation of .84 between fourth graders’ readingcomprehension and math test scores for 139 school districts in Michigan. Inaddition to difficulties related to math vocabulary and style of expression,ELL students process information more slowly than do their counterpartsbecause ELL students are slower readers (Abedi, 2004; Bernhardt, 1991; Oller& Perkins, 1978).
Sixth, according to Chamot and O’Malley (1994), mathematical proceduresare culturally bound; different cultures use different approaches to solveproblems, or they use symbols differently. Midobuche (2001) shows the waythe same division problem is solved differently in two different countries(p. 501).
495 495 3)1485 3)1485
-12 28 28 15 -27 0 15
-15 0
(Long division solved in the United States) (Short division solved in Mexico)
Dow
nloa
ded
by [
Tul
ane
Uni
vers
ity]
at 2
0:26
30
Aug
ust 2
014

342 Bilingual Research Journal, 29: 2 Summer 2005
Even the ways numbers are read differ across cultures. In Korea, 200,000(“two hundred thousand”) will be read as “twenty ten thousand.” It is read as“twenty man”; man (pronounced as m-ah-n) means ten thousands in Korean.
Seventh, not only is the way the math problems are solved culturallyspecific, but the way the math questions are interpreted can also besocioculturally bound (Solano-Flores & Trumbull, 2003; Stanley & Spafford,2002). Solano-Flores and Trumbull (2003) reported that for the sentence“[Sam’s] mother has only $1.00 bills” ELL students misunderstood the word“only,” interpreting the sentence as meaning that Sam’s mother only had adollar (p. 4). Solano-Flores and Trumbull argued that this misinterpretationmight be related to socioeconomic status (SES): Students from low-SESbackgrounds may have a more “survival-oriented” perspective and may projecttheir concerns onto the way they interpret the problem; having limited fundswould not be unusual (p. 5).
Eighth, in addition to the way problem solving is approached differentlybased on cultural differences, math word problems cannot be solved if thestudents are not familiar with the cultural context of the mainstream society orthe cultural knowledge that is taken for granted. For instance, ELL studentsmight not understand a word problem that makes a reference to a Mardi Grasparade. ELL students may thus be handicapped both with respect to languageand context.
Based on the foregoing discussion, one can easily understand why ELLstudents find math challenging. To complicate matters, many teachers wronglybelieve math is not about language, but only about symbols and numbers(Bransford, 2000). Thus, they feel that ELL students can perform competitivelyin math (Collier, 1987; Tsang, 1988). This is indeed a myth: Abedi (2004) reportsgaps between ELL students and FEP students on several types of math test;the gap is, however, smallest in computational math. In fact, many studieshave demonstrated that ELL students lag far behind in word problems, andthe cause of their struggle in the problem-solving aspects of math has beenattributed to their less developed academic English proficiency (Abedi, 2004;Abedi, Hofstetter, & Lord, 2004; Abedi & Lord, 2001; Brenner, 1998; Khisty,1997; Kopriva & Saez, 1997; Myers & Milne, 1988; Olivares, 1996; Solano-Flores & Trumbull, 2003).
Abedi (2004; Abedi, Leon, & Mirocha, 2003) reports that the performancedifference between ELL students and FEP students was greater for tests ofanalytical math that contained linguistically complex items than forcomputational math. ELL students performed as well as native speakers onlyon some tests of math calculation. In a recent study of Filipino bilingualstudents whose first language was either Filipino or English, higher scoreswere reported when students had the mathematical word problems written intheir native language (Bernardo, 2002). These findings indicated that second-language proficiency is strongly correlated to mathematical problem-solving
Dow
nloa
ded
by [
Tul
ane
Uni
vers
ity]
at 2
0:26
30
Aug
ust 2
014

343Equity of Literacy-Based Math Assessments
skills. Clearly, ELL students’ poor performance at math problem-solving taskscan be a result of their level of English proficiency, which can mask theirmathematical knowledge. Although ELL students can keep up with low-levelmechanical aspects of math, on many tests they must go beyond merearithmetic. On LBPAs, ELL students face increasingly tougher challenges(Abedi, 2004; Romberg, 1992).
Literacy-Based Performance Assessments
LBPAs require students to use writing to demonstrate what they knowand can do. LBPAs come in various forms across all content areas. For example,essay assessments in language arts are considered LBPAs, because studentsmust demonstrate their competence in particular writing genres. Portfolios,which showcase selective samples from students’ written work during a certaintime frame, are classified as LBPAs, as are open-ended, literacy-basedmathematics assessments that ask students to explain in writing how theysolved problems (Kopriva & Saez, 1997). By definition, then, all math problemsthat ask students to justify their answers are considered LBPAs. This includessome of the word problems in the National Assessment of Educational Progressmathematics test (see Appendix A for an example).
The degree of difficulty and complexity in word problems differs starklybetween multiple-choice tests and LBPAs. Although word problems inmultiple-choice tests may require one answer, word problems in LBPAs ask aset of related questions requiring multiple steps to find solutions. For example,students may first have to perform algebraic calculations to gather data. Second,they might have to use the data to construct a graph. Third, they may have toanalyze the graph to find a trend. Fourth, they could be required to predict areal-life situation based on the trend they discovered. Fifth, they might beasked to discuss the final result in writing. As a result, word problems inLBPAs require higher level reading skills than multiple-choice tests do, inaddition to writing. Thus, LBPAs demand higher literacy skills.
LBPAs offer some important advantages over multiple-choice tests.LBPAs (a) can present a better picture of students’ progress over a period oftime; (b) can be used to show comprehensively what students know and cando; (c) require students to apply what they have learned to solve problems inauthentic situations; and (d) cause students to participate actively in theassessment process by setting their own goals and being self-reflective(Lachat, 1999; Moya & O’Malley, 1994).
Although LBPAs may appear superior to multiple-choice tests, their usein large-scale, statewide assessments raises several critical issues for thenation’s fastest growing student body: those whose native language is notEnglish. As previously mentioned, the high language demands of LBPAs putELL students at a great disadvantage as they try to express what they know,using their weaker language (LaCelle-Peterson & Rivera, 1997; McKay, 2000;Short, 1993).
Dow
nloa
ded
by [
Tul
ane
Uni
vers
ity]
at 2
0:26
30
Aug
ust 2
014

344 Bilingual Research Journal, 29: 2 Summer 2005
Fairness becomes an issue when LBPAs fail to measure ELL students’academic achievement accurately: Do their low scores come from a lack ofcontent knowledge, or do they result from insufficient English skills? Further,little research has been conducted on LBPAs to show whether performancedifference exists between ELL students and their FEP peers, or to assess theirassumed superiority over multiple-choice tests for ELL students.
The Study
This study focused on the achievement gap in math between ELL studentsand FEP students on the Maryland School Performance Assessment Program(MSPAP) using test scores from the year 2000.1 The MSPAP was chosenbecause the Maryland State Department of Education (MSDE) created a uniqueLBPA. The MSPAP differed from assessments used in other states in thefollowing ways:
1. One of the MSPAP content areas (the math communication subskill)specifically measures students’ ability to communicate mathematicalknowledge in writing, thus challenging students to go well beyond meremathematical calculation;
2. This open-ended test asks students to construct written responsesthroughout the entire testing program;
3. The entire math portion of the MSPAP consists exclusively of higher levelword problems (see sample test items in Appendix B);
4. Multi-procedure questions in math word problems require a high level ofreading comprehension; and
5. Connections between reading and writing across the curriculum reflectthe most salient characteristics of the LBPAs (see http://www.mdk12.org/mspp/mspap/what-is-mspap for a detailed description of the MSPAP).
The MSPAP is given in Grades 3, 5, and 8. Third graders were chosen forthis study because there are a higher number of ELL students in Grade 3:Young ELL students tend to exit ESL programs rather quickly. (Note that ELLstudents, once exited from ESL programs, are not coded as ELL students.They are reclassified and become part of the FEP population. Thus, there is ahigh probability that reclassified ELL students were part of the FEP pool whensampled.)
This study posed three research questions in relation to achievementdifferences in math between ELL students and FEP students within the sameSES as measured by Free and Reduced Meals (FARMs) status. The SESvariable is held constant within each group to minimize its influence on thetest scores, since the SES is known to be the most influential determinant ofstudent achievement (Fernández & Nielsen, 1986). The research questionswere:
Dow
nloa
ded
by [
Tul
ane
Uni
vers
ity]
at 2
0:26
30
Aug
ust 2
014

345Equity of Literacy-Based Math Assessments
1. Is there a significant difference between the mean scores of third-gradeELL students and FEP students within the same FARMs status in math?
2. Is there a significant difference between the mean scores of third-gradeELL students and FEP students within the same FARMs status on themath communication subskill?
3. Which predictor variables—reading, writing, language usage, FARMs,gender, and ethnicity—account for the most variance in third-grade ELLstudents’ and FEP students’ math scores?
Research Questions 1 and 2 hypothesized no achievement differencebetween ELL students and FEP students in math and the math communicationsubskill within the same SES variable. The third research question comparedthe roles of language-related predictors with SES for the two groups. Genderand ethnicity were chosen as additional predictor variables to further explainELL students’ math achievement status.
Instrumentation
MSPAP, a criterion-referenced test, assesses students’ achievement levelsin six content areas: reading, writing, language usage, math, science, andsocial studies. It is constructed so that the scores from multiple content areascan be cross-sectionally compared within a grade. The scaled scores, rangingfrom 350 to 700, are designed to have a mean score of 500 and a standarddeviation of 50 (see http://www.mdk12.org/mspp/mspap/what-is-mspap for adetailed description of the MSPAP, including administration and scoring).
Sampling
Test scores of the third graders from all 25 Maryland school districts wereselected, excluding students who received special education services(language variables and exceptionalities related to special education haveconfounding effects on the test scores). Random sampling for the ELL studentsand stratified random sampling for the FEP students were planned accordingto FARMs status to keep the SES variable constant. However, random samplingfor ELL students was not performed because of the contingency imposed onthe author by the MSDE due to the small percentage (1.1%) of ELL students’participation in the MSPAP. Consequently, there were four subgroups:(a) ELL students with FARMs, (b) FEP students with FARMs, (c) ELL studentswith non-FARMs, and (d) FEP students with non-FARMs. Informationregarding participants’ prior educational backgrounds or formal schoolingwas not available from the MSDE data set.
In 2000, a total of 65,536 third-grade students took the MSPAP; 742 ofthem were identified as ELL students and the rest (64,794) as FEP students.From the 742 ELL students, 90 students coded as special education wereexcluded. From the remaining 652 ELL students, 492 (n
1) students were
Dow
nloa
ded
by [
Tul
ane
Uni
vers
ity]
at 2
0:26
30
Aug
ust 2
014

346 Bilingual Research Journal, 29: 2 Summer 2005
Figure 1. Overview of the sampling process.Note. “Complete” denotes complete test scores, and “non-complete” denotesincomplete test scores.
Entire Data Set (65,536)
ELLs (742) FEPs (64,794)
Special Ed (90) Non-Special Ed (652) Special Ed (9,291) Non-Special E (55,503)
Non-complete Scores Complete Scores (492) Non-complete Scores Complete Scores (53,025)
Merged Final Data Set (984)
FARMs (260) Non-FARMs (232) FARMs (17,244) Non-FARMs (35,781)
FARMs (260) Non-FARMs (232)
identified as having complete test scores in math. Among the 492 ELL students,there were 260 ELL students coded with FARMs status and 232 ELL studentswith non-FARMs status (see Figure 1 for a description of the samplingprocess). The ELL student group included 2 American Indians (.4%), 168Asian Americans (34.1%), 48 African Americans (9.8%), 56 non-HispanicWhites (11.4%), and 218 Hispanics (44.3%).
For the FEP group sampling, the same procedures were applied. First,9,291 students coded as special education were excluded. Second, from theremaining 55,503 students, 53,025 students were identified as students whotook a math portion of the MSPAP. Third, to match the ELL group, 260 FARMsstudents were randomly selected from 17,244 non-ELL students identifiedwith FARMs status. Fourth, matching 232 non-FARMs students were randomlyselected from 35,781 FEP students identified with non-FARMs status. Table 1contains demographics of the third graders who were selected for the study.
Data Analysis
Independent samples t-tests were selected to answer the first two researchquestions, an investigation of performance differences between ELL studentsand FEP students in the overall math examination, as well as the mathcommunication subskill. For the third research question, multiple linearregression analysis was employed to determine which predictor variableaccounted for the largest proportion of the variance in the criterion variable,math achievement.
Dow
nloa
ded
by [
Tul
ane
Uni
vers
ity]
at 2
0:26
30
Aug
ust 2
014

347Equity of Literacy-Based Math Assessments
Table 1
Free and Reduced Meals (FARMs) Status, Gender, and Ethnicityof English Language Learners (ELLs) and Fully EnglishProficient (FEP) Students
ELLs FEPs
n1
% n2
%
FARMsYes 260 52.8 260 52.8
No 232 47.2 232 47.2
GenderMale 246 50 224 46
Female 246 50 268 54
Ethnicity
American Indian 2 .4 2 .4
Asian American 168 34.1 16 3.3
African American 48 9.8 206 41.9
Non-Hispanic White 56 11.4 251 51
Hispanic 218 44.3 17 3.5
Grand total 492 100 492 100
The .05 level of significance was chosen for the study; however, whenthe same statistical procedures were performed more than once, the alphalevel was adjusted to a more conservative level ( = .01) in order to lowerthe chances of committing a Type I error, that is, the error of concluding whatare actually non-significant findings as significant. For Research Questions 1and 2, in addition to t-tests, a multivariate analysis of variance (MANOVA)was conducted.
Results
Achievement Differences in Math
Using a 2x2 factorial design, preliminary analyses of interaction effectsbetween FARMs and ELL status were performed prior to investigating themain effect of ELL status across the same FARMs status. The result revealeda significant interaction between ELL status and FARMs status, indicatingthat the FARMs variable had different effects for ELL students and
α
Dow
nloa
ded
by [
Tul
ane
Uni
vers
ity]
at 2
0:26
30
Aug
ust 2
014

348 Bilingual Research Journal, 29: 2 Summer 2005
Table 2
Means, Standard Deviations, and t-Test Results on Math
η η
FEP students (F [1, 980] = 52.23, p < .001). FARMs status resulted in lowerscores for FEP students, relative to non-FARMs status, but FARMs statusdid not have as large an effect on ELL scores, and the test score gap betweenFEP and ELL students was significantly lower for FARMs-status students.Therefore, these findings warrant further analyses of the main effects. Themain effects of both ELL and FARMs status were significant (ELL status,F [1, 980] = 102.31, p < .001; FARMs status, F [1, 980] = 331.72, p < .001).In addition, the effect sizes in analysis of variance (ANOVA) indicate that ELLstatus explained 10% ( ² = .10) and FARMs status, 25% ( ² = .25) of thevariance associated with math scores. The mean math scores of both groupscan be found in Table 2.
The first research question asked if there was a significant differencebetween the mean scores of ELL students and FEP students within the sameFARMs status in math. An independent samples t-test indicated no significantgroup difference between ELL students and FEP students who were identifiedwith FARMs status, the difference falling just short of statistical significance(p = .057), with a small effect size (d = .17). There was, however, a significantdifference between ELL and FEP non-FARMs students in math. The effectsize was substantial (t [462] = -13.70, p < .01, d = 1.27 [see Table 2]). Thus,it can be said that both groups from low-SES backgrounds performed similarly,but FEP students from high-SES backgrounds outperformed ELL studentsfrom high-SES backgrounds.
Non-Free and Reduced Meals groups
English languagelearners
Fully English proficient
n1
M1
SD n2
M2
SD t(462)
p d
232 517.29 44.82 232 562.31 22.27 -13.70 .000* 1.27
Free and Reduced Meals groups
n1
M1
SD n2
M2
SD t(518)
p d
260 488.78 45.81 260 496.27 43.80 1.91 .057 .17
Note. d = effect size.
*p < .001, two-tailed.
Dow
nloa
ded
by [
Tul
ane
Uni
vers
ity]
at 2
0:26
30
Aug
ust 2
014
349Equity of Literacy-Based Math Assessments
η
Math Communication Subskill
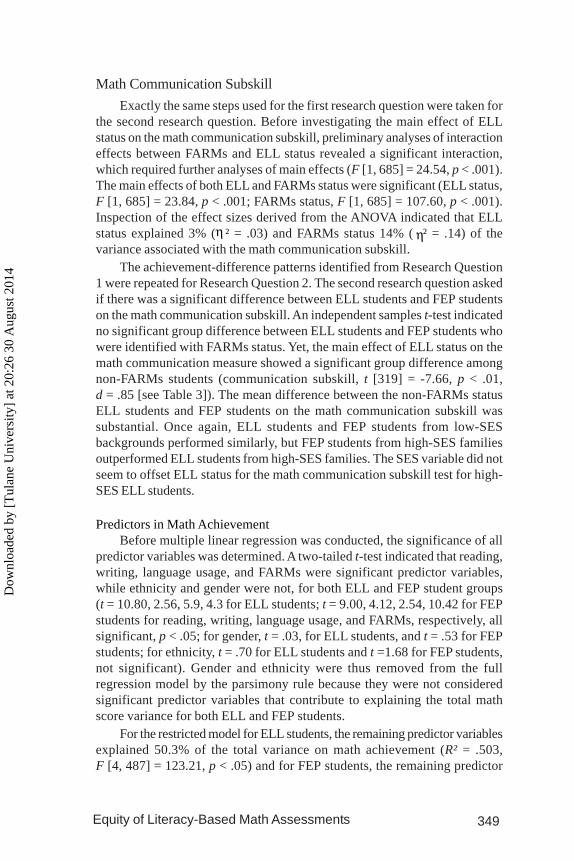
Exactly the same steps used for the first research question were taken forthe second research question. Before investigating the main effect of ELLstatus on the math communication subskill, preliminary analyses of interactioneffects between FARMs and ELL status revealed a significant interaction,which required further analyses of main effects (F [1, 685] = 24.54, p < .001).The main effects of both ELL and FARMs status were significant (ELL status,F [1, 685] = 23.84, p < .001; FARMs status, F [1, 685] = 107.60, p < .001).Inspection of the effect sizes derived from the ANOVA indicated that ELLstatus explained 3% ( ² = .03) and FARMs status 14% ( ² = .14) of thevariance associated with the math communication subskill.
The achievement-difference patterns identified from Research Question1 were repeated for Research Question 2. The second research question askedif there was a significant difference between ELL students and FEP studentson the math communication subskill. An independent samples t-test indicatedno significant group difference between ELL students and FEP students whowere identified with FARMs status. Yet, the main effect of ELL status on themath communication measure showed a significant group difference amongnon-FARMs students (communication subskill, t [319] = -7.66, p < .01,d = .85 [see Table 3]). The mean difference between the non-FARMs statusELL students and FEP students on the math communication subskill wassubstantial. Once again, ELL students and FEP students from low-SESbackgrounds performed similarly, but FEP students from high-SES familiesoutperformed ELL students from high-SES families. The SES variable did notseem to offset ELL status for the math communication subskill test for high-SES ELL students.
Predictors in Math AchievementBefore multiple linear regression was conducted, the significance of all
predictor variables was determined. A two-tailed t-test indicated that reading,writing, language usage, and FARMs were significant predictor variables,while ethnicity and gender were not, for both ELL and FEP student groups(t = 10.80, 2.56, 5.9, 4.3 for ELL students; t = 9.00, 4.12, 2.54, 10.42 for FEPstudents for reading, writing, language usage, and FARMs, respectively, allsignificant, p < .05; for gender, t = .03, for ELL students, and t = .53 for FEPstudents; for ethnicity, t = .70 for ELL students and t =1.68 for FEP students,not significant). Gender and ethnicity were thus removed from the fullregression model by the parsimony rule because they were not consideredsignificant predictor variables that contribute to explaining the total mathscore variance for both ELL and FEP students.
For the restricted model for ELL students, the remaining predictor variablesexplained 50.3% of the total variance on math achievement (R² = .503,F [4, 487] = 123.21, p < .05) and for FEP students, the remaining predictor
η
Dow
nloa
ded
by [
Tul
ane
Uni
vers
ity]
at 2
0:26
30
Aug
ust 2
014

350 Bilingual Research Journal, 29: 2 Summer 2005
Table 3
Means, Standard Deviations, and t-Test Results on the MathCommunication Subskill
variables explained 64% of the total variance on math achievement (R² = .64,F [4, 487] = 217.88, p < .05). The regression equation for ELL students andFEP students are the following (see Table 4):
Y’1 (ELLs) = .41 reading + .26 language usage - .16 FARMs + .11 writing
Y’2 (FEPs) = -.38 FARMs + .32 reading + .17 writing + .11 language usage
As indicated by the findings, FARMs status was not only a significantbut also a strong predictor of math achievement for FEP students. FARMsstatus was the strongest predictor of math achievement, followed by readingskills. For ELL students, FARMs status was a statistically significant predictoras well. It was, however, only the third strongest predictor for this group,ranking behind reading and usage (see Table 4). Notably, reading was a strongerpredictor for ELL students than it was for FEP students. Correlations amongsignificant variables for ELL and FEP students can be found in Table 5.
MANOVA Results of Math and Math Communication Subskill
As previously mentioned, a MANOVA was performed as an additionaltest to reduce the measurement error for Research Questions 1 and 2. Frompreliminary analysis of interaction effects between ELL status and FARMsstatus, a significant interaction was found on the mean scores of math and
Note. d = effect size. The n of the math communication subskill test is smaller thanthat of the math test due to the fact that fewer students were assessed on the subskillpart.
*p < .001, two-tailed.
Non-Free and Reduced Meals groups
English languagelearners
Fully English proficient
n1
M1
SD n2
M2
SDt
(319)p d
153 507.78 71.60 168 560.15 49.85 -7.66 .000* .85
Free and Reduced Meals groups
n1
M1
SD n2
M2
SDt
(366)p d
185 478.92 75.95 185 478.55 76.95 -.047 .96 .004
Dow
nloa
ded
by [
Tul
ane
Uni
vers
ity]
at 2
0:26
30
Aug
ust 2
014

351Equity of Literacy-Based Math Assessments
Table 4
Summary of Regression for Variables Predicting English LanguageLearner (ELL) Students’ and Fully English Proficient (FEP)Students’ Math Achievement in the Maryland SchoolPerformance Assessment Program
*p < .05.
ηΛ
Λ
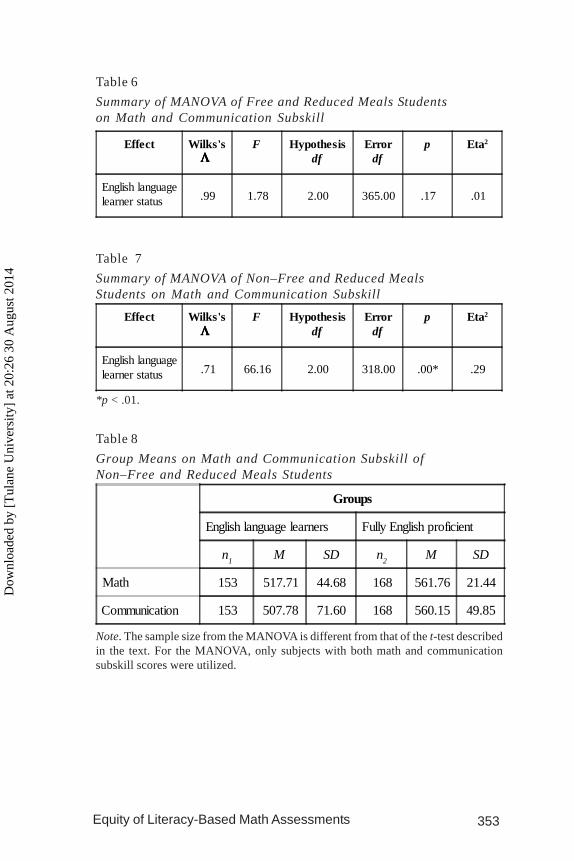
Λmath communication subskill (Wilks’s = .95, p < .01 [see Figure 2]). Thus,main effects were further analyzed. The MANOVA indicated that the overallgroup difference among FARMs status students was not statisticallysignificant (Wilks’s = .99, F [1, 366] = 1.78, p = .17 [see Table 6]). ELLstatus explained only 1% of the variance associated with the dependentvariables ( ² = .01). Among non-FARMs status students, however,MANOVA results revealed a significant group difference (Wilks’s = .71,F [1, 319] = 66.16, p < .01 [see Table 7]). ELL status explained almost 30% ofthe variance associated with the dependent variables, math and mathcommunication skills ( ² = .29). Table 8 reports descriptive statistics.η
ELL students
Predictors B Beta t p
Reading .44 .41 10.91 .000*
Writing .12 .11 2.54 .011*
Language usage .24 .26 6.0 .000*
Free and reducedmeals
-14.85 -.16 -4.76 .000*
FEP students
Reading .34 .32 9.09 .000*
Writing .18 .17 4.08 .000*
Language usage .09 .11 2.50 .013*
Free and reducedmeals
-36.90 -.38 -11.30 .000*
Dow
nloa
ded
by [
Tul
ane
Uni
vers
ity]
at 2
0:26
30
Aug
ust 2
014

352 Bilingual Research Journal, 29: 2 Summer 2005
Figure 2. Interaction between free and reduced meals (FARMs) and English languagelearner (ELL) status on math and the math communication subskill.
Note. “0” indicates non-FARMs group, and “1” indicates FARMs status. The brokenlines refer to the ELL students, the solid lines refer to the FEP students.
Table 5
Pearson Correlation Coefficients for Reading, Writing, LanguageUsage, and Free and Reduced Meals (FARMs) for EnglishLanguage Learners (ELLs) and Fully English Proficient(FEP) Students
Note. * indicates the correlation is significant at the .01 level, two-tailed.
0 1
FARMs
480
500
520
540
560
Estimated marginal means of math communication skill scores
0 1 FARMs
500
520
540
560
Estimated marginal means of math scores
Math Reading Writing Usage FARMs
ELLs FEPs ELLs FEPs ELLs FEPs ELLs FEPs ELLs FEPs
Math 1.00 1.00 .61* .66* .52* .63* .56* .60* -.30* -.68*
Reading 1.00 1.00 .50* .56* .46* .56* -.17* -.49*
Writing 1.00 1.00 .66* .74* -.21* -.54*
Usage 1.00 1.00 -.20* -.51*
FARMs 1.00 1.00
Dow
nloa
ded
by [
Tul
ane
Uni
vers
ity]
at 2
0:26
30
Aug
ust 2
014
353Equity of Literacy-Based Math Assessments
Table 6
Summary of MANOVA of Free and Reduced Meals Studentson Math and Communication Subskill
Table 8
Group Means on Math and Communication Subskill ofNon–Free and Reduced Meals Students
Note. The sample size from the MANOVA is different from that of the t-test describedin the text. For the MANOVA, only subjects with both math and communicationsubskill scores were utilized.
Table 7
Summary of MANOVA of Non–Free and Reduced MealsStudents on Math and Communication Subskill
*p < .01.
Groups
English language learners Fully English proficient
n1
M SD n2
M SD
Math 153 517.71 44.68 168 561.76 21.44
Communication 153 507.78 71.60 168 560.15 49.85
ΛΛΛΛΛ
ΛΛΛΛΛEffect Wilks's F Hypothesis
dfError
dfp Eta2
English languagelearner status .71 66.16 2.00 318.00 .00* .29
Effect Wilks's F Hypothesisdf
Errordf
p Eta2
English languagelearner status .99 1.78 2.00 365.00 .17 .01
Dow
nloa
ded
by [
Tul
ane
Uni
vers
ity]
at 2
0:26
30
Aug
ust 2
014
354 Bilingual Research Journal, 29: 2 Summer 2005
Discussion
SES emerged as an important factor in this study. SES, of course, has astrong impact on student achievement (Fernández & Nielsen, 1986; Krashen& Brown, 2005; Lytton & Pyryt, 1998; Secada, 1992; Tate, 1997). High SESgenerally results in greater cognitive academic language proficiency (CALP),consisting of superior knowledge of subject matter and aspects of academiclanguage that are similar in the first and second languages (Krashen, 1996).Children from higher income families are exposed to more print and have awider range of school-relevant experiences. As a result, they gain moreknowledge relevant to school in their home life. CALP makes a powerfulcontribution to math achievement on LPBAs in particular, a test that demandsmastery of academic language. Both non-FARMs groups in this study, FEPand ELL students, have these advantages.
A likely explanation for the finding that high-SES ELL students did not doas well as high-SES FEP students is that their true ability was masked by theirless developed academic-language proficiency in English. We predict thatover time, high-SES ELL students will do quite well, as they have the sameadvantages as high-SES FEP students, and only need to acquire academicEnglish. In other words, high-SES ELL students’ competence in math cannotbe fully demonstrated due to the language barriers built into the assessmentdespite the advantage of having high SES. The language of the test is toohard for them to understand, and the demands placed on their writingcompetence are excessive.
FARMs status made less of a difference for ELL students: FARMs andnon-FARMs ELL students performed similarly. Both of these groups sharethe same disadvantages that all low-SES students do: Lack of backgroundknowledge as well as lack of academic language. The only advantage theFARMs FEP students had over the non-FARMs ELL students was theirsuperior competence in conversational English, of little use for performingacademic tasks (Cummins, 1996; Saville-Troike, 1984).
Clearly, ELL students need more time to develop grade-level academicEnglish before they are required to take large-scale high-stakes tests. A mathtest that requires high-level reading skills to understand the questions andrequires mathematical communication through writing seems to be highlyinappropriate for assessing ELL students’ achievement in math (Kopriva &Saez, 1997). Rather, such tests can create even greater obstacles for them; notonly are their scores lower, but such students, no matter how well preparedthey are and how well they understand the material, are often “pegged” as lowperformers with the educational stigma that so often accompanies suchlabeling.
Under the heightened accountability policy mandated by No Child LeftBehind (2002), funding often depends on assessment scores. Because ofsuch high-stakes assessments, districts with higher representations of ELL
Dow
nloa
ded
by [
Tul
ane
Uni
vers
ity]
at 2
0:26
30
Aug
ust 2
014
355Equity of Literacy-Based Math Assessments
students will regard these students as burdensome (Olson, 2002). Thus, LBPAs,together with assessment-driven accountability, can seriously threatenassessment equity for ELL students.
The “adequate yearly progress (AYP)” stipulated by NCLB in establishinginitial baseline data forces all ELL students to take tests regardless of theirEnglish proficiency. This is not a sound policy. Newly revised guidelinesexempting ELL students for only 1 year are not nearly enough (Dobbs, 2004).Even for those with high levels of CALP, the tests are inaccurate, and forthose with low levels of CALP, they are, in addition, unfair and cruel. Blindlythrowing ELL students into the accountability system without consideringtheir unique needs constitutes treatment that is neither equal nor equitable.
The results also clearly suggest that ELL students should not be treatedas a homogeneous group. Those with high-SES backgrounds have, mostlikely, an excellent chance of success in school after they acquire sufficientacademic language, but it is likely that those who are from low-SES backgroundswill face serious problems. Treating ELL students as a uniform group will notaccurately portray their true performance and will result in widening gaps inacademic achievement (Stevens, Butler, & Castellon-Wellington, 2000).
Educational Implications
Although this study is not comprehensive, its results illustrate a criticalaspect of how test formats could affect ELL students’ math achievement. TheAmerican Educational Research Association (2000), on its Web site, expressedits position regarding high-stakes testing by asserting that “appropriateattention [should be given] to language difference among examinees” becausewhen the test scores of the ELL students are adversely affected by theirlinguistic proficiencies, those scores cannot be considered an accuratemeasurement of true ability.
Unfortunately, an assessment program created with good intentions canjeopardize assessment equity for ELL students. Thus, policymakers must createmechanisms that allow ELL students to be tested alternatively. One availablealternative, portfolio assessment, can show yearly progress and would freeschools and teachers to convert their energy from “teaching to the test”toward helping students expand their knowledge.
In addition, implementing an assessment alternative such as portfolioassessments would be the most meaningful way to include ELL students inthe accountability system. Portfolio assessments would help establishaccountability by allowing all ELL students to take part in the assessmentprocess, beginning from their first day of school. Then, achieving “adequateyearly progress” would not be merely a federal mandate but a tangible andmeaningful goal for all stakeholders.
Dow
nloa
ded
by [
Tul
ane
Uni
vers
ity]
at 2
0:26
30
Aug
ust 2
014

356 Bilingual Research Journal, 29: 2 Summer 2005
Furthermore, while we are waiting for alternative measures for ELLstudents, the results of this study call for exemption provisions for high-stakes standardized tests to be extended from the current 1 year to at least 3years, allowing ELL students time to improve their competence in academicEnglish. (For data on the amount of time necessary to develop sufficientacademic English to do class work in the mainstream and to be able to takehigh-stakes tests, see Krashen, 2001.)
This is not a plan, however, to keep ELL students out of the accountabilityloop. As noted above, accountability for the first 3 years of the ELL students’school careers can be measured, hopefully through portfolio assessment,which can give us a picture of both their subject matter and languagedevelopment.
Others (Abedi, 2004; Abedi et al., 2004; Abedi et al., 2003; Abedi & Lord,2001) propose a different solution: modification of tests to make them morecomprehensible for ELL students, that is, simplifying the language of thetests. Results of these efforts have produced, however, only modestimprovements in comprehensibility (Abedi et al., 2004).
Apple (1995) succinctly states that educational policy needs to recognize“the winners and losers” of educational practices (p. 331). The fact that LBPAshave been in the educational arena for a relatively short period of time in large-scale statewide assessments necessitates investigating who the winners areand who the losers are. Nevertheless, meaningful and equitable assessmentof ELL students in systemwide assessment is critical. Without assessmentthat allows ELL students to be tested equitably, these students will be perpetuallosers in a system in which they do not receive a fair chance.
References
Abedi, J. (2004). The No Child Left Behind Act and English languagelearners: Assessment and accountability issues. Educational Researcher,33(1), 4–14.
Abedi, J., Hofstetter, C., & Lord, C. (2004). Assessment accommodationsfor English language learners: Implications for policy-based empiricalresearch. Review of Educational Research, 74(1), 1–28.
Abedi, J., Leon, S., & Mirocha, J. (2003). Impact of student language back-ground on content-based performance: Analyses of extant data (CSETech. Rep. No. 603). Los Angeles: University of California, NationalCenter for Research on Evaluation, Standards, and Student Testing.
Abedi, J., & Lord, C. (2001). The language factor in mathematics tests.Applied Measurement in Education, 14(3), 219–234.
Dow
nloa
ded
by [
Tul
ane
Uni
vers
ity]
at 2
0:26
30
Aug
ust 2
014
357Equity of Literacy-Based Math Assessments
American Educational Research Association. (2000). AERA positionstatements. Retrieved May 31, 2005, from http://www.aera.net/policyandprograms/?id=378
Apple, M. W. (1995). Taking power seriously: New directions in equity inmathematics education and beyond. In W. G. Secada, E. Fennema, & L. B.Adajian (Eds.), New directions in equity in mathematics education(pp. 329–348). New York: Cambridge University Press.
August, D., & Hakuta, K. (Eds.). (1997). Improving schooling forlanguage-minority children: A research agenda. Washington, DC:National Academy Press.
Bernardo, A. B. (2002). Language and mathematical problem solving amongbilinguals. The Journal of Psychology, 136(3), 283–297.
Bernhardt, E. B. (1991). Reading development in a second language:Theoretical, empirical, & classroom perspectives. Norward, NJ: Ablex.
Bransford, J. D. (Ed.). (2000). How people learn: Brain, mind, experience,and school. Washington, DC: National Academy Press.
Brenner, M. E. (1998). Development of mathematical communication inproblem solving groups by language minority students. BilingualResearch Journal, 22(2–4), 149–163.
Carey, D. A., Fennema, E., Carpenter, T. P., & Franks, M. L. (1995). Equityand mathematics education. In W. G. Secada, E. Fennema, & L. B.Adajian (Eds.), New directions for equity in mathematics education(pp. 93–125). New York: Cambridge University Press.
Chamot, A. U., & O’Malley, J. M. (1994). The CALLA handbook: Imple-menting the cognitive academic language learning approach. NewYork: Longman.
Collier, V. (1987). Age and rate of acquisition of second language foracademic purposes. TESOL Quarterly, 21(4), 617–641.
Cuevas, G. J. (1984). Mathematics learning in English a second language.Journal for Research in Mathematics Education, 15(2), 134–144.
Cummins, J. (1980). Psychological assessment of immigrant children: Logicor institution? Journal of Multilingual and Multicultural Development,1(2), 97–111.
Cummins, J. (1981). Four misconceptions about language proficiency inbilingual education. NABE Journal, 5(3), 31–45.
Cummins, J. (1996). Negotiating identities: Education for empowerment ina diverse society. Ontario: California Association for Bilingual Education.
Dobbs, M. (2004, March 30). More changes made to “No Child” rules.Washington Post, p. 1.
Dow
nloa
ded
by [
Tul
ane
Uni
vers
ity]
at 2
0:26
30
Aug
ust 2
014
358 Bilingual Research Journal, 29: 2 Summer 2005
Fernández, R. M., & Nielsen, F. (1986). Bilingualism and Hispanicscholastic achievement: Some baseline results. Social Science Research,15(1), 43–70.
Hakuta, K., Butler, Y. G., & Witt, D. (1999). How long does it take Englishlearners to attain proficiency? (Policy Report No. 2000-1). The Universityof California Linguistic Minority Research Institute.
Khisty, L. L. (1995). Making inequality: Issues of language and meanings inmathematics teaching with Hispanics students. In W. G. Secada, E. Fennema,& L. B. Adajian (Eds.), New directions for equity in mathematics edu-cation (pp. 279–297). New York: Cambridge University.
Khisty, L. L. (1997). Making mathematics accessible to Latino students:Rethinking instructional practice. In J. Trentacosta & M. J. Kenney (Eds.),1996 yearbook multicultural and gender equity in mathematicsclassroom: The gift of diversity (pp. 92–101). Reston, VA: National Councilof Teachers of Mathematics.
Kopriva, R., & Saez, S. (1997). Guide to scoring LEP student responses toopen-ended mathematics items. Washington, DC: The Council of ChiefState School Officers.
Krashen, S. (1996). Under attack: The case against bilingual education.Century City, CA: Language Education Associates.
Krashen, S. (2001). How many children remain in bilingual education “toolong”? Some recent data. NABE News, 24, 15–17.
Krashen, S., & Brown, C. L. (2005). The ameliorating effects of high socio-economic status: A secondary analysis. Bilingual Research Journal,29(1), 185–196.
Krussel, L. (1998). Teaching the language of mathematics. The MathematicalTeacher, 91(5), 436–441.
LaCelle-Peterson, M., & Rivera, C. (1997). Is it real for all kids? A frame-work for equitable assessment policies for English language learners.Harvard Educational Review, 64(1), 55–75.
Lachat, M. A. (1999). Standards, equity and cultural diversity (No.RJ 96006401). Providence, RI: Northeast and Islands Regional EducationalLaboratory at Brown University.
Lytton, H., & Pyryt, M. (1998). Predictors of achievement in basic skills:A Canadian effective schools study. Canadian Journal of Education,23(3), 281–301.
Madden, N., Slavin, R., & Simons, K. (1995). Mathwings: Effects on studentmathematics performance (Research No. R-117-D40005). Baltimore:Center for Research on the Education of Students Placed At Risk.
Dow
nloa
ded
by [
Tul
ane
Uni
vers
ity]
at 2
0:26
30
Aug
ust 2
014

359Equity of Literacy-Based Math Assessments
McGhan, B. (1995). MEAP: Mathematics and the reading connection.Retrieved March 23, 2005, from http://comnet.org/cspt/essays/mathread.htm
McKay, P. (2000). On ESL standards for school-age learners. LanguageTesting, 17(2), 185–214.
Mestre, J. P. (1988). The role of language comprehension in mathematicsand problem solving. In R. R. Cocking & J. P. Mestre (Eds.), Linguisticand cultural influences on learning mathematics (pp. 201–240). Hillsdale,NJ: Lawrence Erlbaum Associates.
Mid-Continent Research for Education and Learning. (n.d.) Purpose of thiswork. Retrieved May 31, 2005, from http://www.mcrel.org/standards-benchmarks/docs/purpose.asp
Midobuche, E. (2001). Building cultural bridges between home and themathematics classroom. Teaching Children Mathematics, 7(9), 500–502.
Moya, S. S., & O’Malley, J. M. (1994). A portfolio assessment model forESL. The Journal of Educational Issues of Language Minority Students,13, 13–36.
Myers, D. E., & Milne, A. M. (1988). Effects of home language and primarylanguage on mathematics achievement. In R. R. Cocking & J. P. Mestre(Eds.), Linguistic and cultural influences on learning mathematics(pp. 259–293). Hillsdale, NJ: Lawrence Erlbaum Associates.
National Council of Teachers of Mathematics. (1995). Assessment standardsfor school mathematics. Reston, VA: Author.
No Child Left Behind Act, Pub. L. No. 107-110 (2002).
Olivares, R. A. (1996). Communication in mathematics for students withlimited English proficiency. In P. C. Elliot & M. J. Kenney (Eds.), 1996yearbook communication in mathematics K-12 and beyond (pp. 219–230). Reston, VA: National Council of Teachers of Mathematics.
Oller, J. W., & Perkins, K. (1978). Language in education: Testing the tests.Rowerly, MA: Newbury House.
Olson, L. (2002). States scramble to rewrite language-proficiency exams.Retrieved December 4, 2002, from http://www.edweek.org/ew/ew_printstory.cfm?slug=14lep.h22
Romberg, T. A. (1992). Further thoughts on the standards: A reaction toApple. Journal for Research in Mathematics Education, 23(5), 432–437.
Saville-Troike, M. (1984). What really matters in second language learningfor academic achievement? TESOL Quarterly, 18(2), 199–219.
Dow
nloa
ded
by [
Tul
ane
Uni
vers
ity]
at 2
0:26
30
Aug
ust 2
014
360 Bilingual Research Journal, 29: 2 Summer 2005
Secada, W. G. (1992). Race, ethnicity, social class, language, and achievementin mathematics. In D. A. Grouws (Ed.), Handbook of research onmathematics teaching and learning: A project of the National Councilof Teachers of mathematics (pp. 623–660). New York: Macmillan.
Secada, W. G., Fennema, E., & Adajian, L. B. (Eds.). (1995). New directionsfor equity in mathematics education. New York: Cambridge UniversityPress.
Shavelson, R., Baxter, G., & Pine, J. (1992). Performance assessments:Political rhetoric and measurement reality. Educational Researcher,21(4), 22–27.
Short, D. J. (1993). Assessing integrated Language and content instruction.TESOL Quarterly, 27(4), 627–656.
Silver, E. A., Smith, M. S., & Nelson, B. S. (1995). The QUASAR project:Equity concerns meet mathematics education reform in the middle school.In W. G. Secada, E. Fennema, & L. B. Adajian (Eds.), New directions forequity in mathematics education (pp. 9–56). New York: CambridgeUniversity Press.
Solano-Flores, G., & Trumbull, E. (2003). Examining language in context:The need for new research and practice paradigms in the testing ofEnglish-language learners. Educational Researcher, 32(2), 3–13.
Stanley, C., & Spafford, C. (2002). Cultural perspectives in mathematicsplanning efforts. Multicultural Education, 10(1), 40–42.
Stevens, R. A., Butler, F. A., & Castellon-Wellington, M. (2000). Academiclanguage and content assessment: Measuring the progress of Englishlanguage learners. Los Angeles: CRESST/University of California.
Tate, W. F. (1997). Race-ethnicity, SES, gender, and language proficiencytrends in mathematics achievement: An update. Journal for Research inMathematics Education, 28(6), 652–679.
Torres, H. N., & Zeidler, D. L. (2001). The effects of English languageproficiency and scientific reasoning skills on the acquisition of sciencecontent knowledge by Hispanic English language learners and nativeEnglish language speaking students. Retrieved April 8, 2003, from http://unr.edu/homepage/crowther/ejse/ejsev6n2.html#top
Tsang, S.-L. (1988). The mathematics achievement characteristics of Asian-American students. In R. R. Cocking & J. P. Mestre (Eds.), Linguisticand cultural influences on learning mathematics (pp. 123–136). Hillsdale,NJ: Lawrence Erlbaum Associates.
Dow
nloa
ded
by [
Tul
ane
Uni
vers
ity]
at 2
0:26
30
Aug
ust 2
014

361Equity of Literacy-Based Math Assessments
Acknowledgments
I would like to thank the three anonymous Bilingual Research Journalreviewers, Stephen Krashen, Pamela Guandique, and Amos Hatch for theirvaluable comments on an earlier version of this paper.
Endnote1 MSDE no longer uses the MSPAP to test students. The MSPAP did notcomply with the NCLB Act (2002) because it did not provide individual studentreport cards. The MSDE developed a Maryland School Assessment thatconsists of multiple-choice and constructed response items. The new test inmath, however, retains questions that require students to respond in writing,in addition to multiple-choice items.
Dow
nloa
ded
by [
Tul
ane
Uni
vers
ity]
at 2
0:26
30
Aug
ust 2
014
362 Bilingual Research Journal, 29: 2 Summer 2005
What would be the number of chirps per minute when the temperatureoutside is 90° if this pattern stays the same?
Answer: ________________________ Explain how you figured out your answer. ________________________________________________ ________________________________________________ ________________________________________________ ________________________________________________ ________________________________________________
Did you use the calculator on this question?yes no
Note. Retrieved from http://nces.ed.gov/nationsreportcard/ITMRLS/qtab.asp
Number of Chirps Per Minute Temperature
144 76o
152 78o
160 80o
168 82o
176 84o
Appendix A
2003 National Assessment of Educational Progress Grade 4Math Item: Apply a Linear Relationship and Justify Answer
20. The table below shows how the chirping of a cricket is related to thetemperature outside. For example, a cricket chirps 144 times each minutewhen the temperature is 76°.
Dow
nloa
ded
by [
Tul
ane
Uni
vers
ity]
at 2
0:26
30
Aug
ust 2
014

363Equity of Literacy-Based Math Assessments
GO ON
Appendix B
Maryland School Performance Assessment Program SampleMath Proportion Item Released to the Public
Step AThe zoo planner wants to have a small information center. They want to
cover the floors with tiles. Design a repeating pattern that could be used onthe floor in the information center. Show your work on the grid below.
Step B
Write a sentence or two explaining the pattern you chose.
Information Center
________________________________________________ ________________________________________________ ________________________________________________ ________________________________________________ ________________________________________________
Note. This item is reconstructed based on the information available on the MarylandState Department of Education Web site: http://www.mdk12.org/share/publicrelease/plan_task.pdf
Dow
nloa
ded
by [
Tul
ane
Uni
vers
ity]
at 2
0:26
30
Aug
ust 2
014