Embed Size (px)
Citation preview

Seventh Statewide Report Card
2020
Arizona Supreme Court
Administrative Office of the Court
Commission on Diversity, Equality,
and Justice in the Judiciary
Equitable Treatment of Minority Youth

1
Table of Contents Message from the Commission ................................................................................................ 1
Executive Summary ................................................................................................................. 2
Key Findings ............................................................................................................................ 2
Figure 1 ................................................................................................................................ 3
Data and Methodology ........................................................................................................... 4
Results ..................................................................................................................................... 5
Referral ................................................................................................................................... 5
Table 1. Arizona Population and Referrals ............................................................................. 6
Figure 2 ................................................................................................................................ 7
Detention ................................................................................................................................ 7
Table 2. Detention Relative Rate Indexes .............................................................................. 8
Figure 3 ................................................................................................................................ 9
Formal Court Processing .......................................................................................................... 9
Table 3. Court Processing Relative Rate Indexes .................................................................... 10
Figure 4 ................................................................................................................................ 11
Petition Outcomes ................................................................................................................... 11
Table 4. Petition Outcomes Relative Rate Indexes ................................................................. 12
Figure 5 ................................................................................................................................ 13
Court Dispositions .................................................................................................................... 13
Table 5. Court Dispositions Relative Rate Indexes ................................................................... 14
Figure 6 ................................................................................................................................ 15
Across the System .................................................................................................................... 15
Figure 7 ................................................................................................................................ 15
Discussion ................................................................................................................................ 17
Appendix ................................................................................................................................ 22
Supplemental Tables ............................................................................................................... 23
Glossary of Juvenile Justice Terms ............................................................................................. 29
References .............................................................................................................................. 31

1
Message from the Commission Arizona is required, by federal law, to maintain and report data on disproportionate minority contact (DMC) on an ongoing basis and to make efforts to reduce any disparity that may exist. Arizona had been monitoring DMC on a statewide level for over a decade and partnered with local jurisdictions to combat DMC in our courts. This a tireless effort and the work continues.
This is the 7th Arizona Statewide Report Card on the Equitable Treatment of Minority Youth. These reports have challenged juvenile court judges, court administration, county attorneys, and many unknown judicial employees and community leaders, to ensure all youth in the Arizona juvenile justice system are provided with fair and equitable justice. The report indicates improvements in some areas and things remaining unchanged in some areas, with a few decision points getting worse. The purpose of this report is to analyze each major decision-point in the juvenile justice continuum to determine whether all youth are receiving simila r treatment. It is our intent that this report be used as a tool by juvenile court leadership teams and policy makers to prioritize and focus their efforts in creating fair outcomes for all children who have contact with Arizona’s juvenile courts. It is a great undertaking and there remains much work to be done. This report is a collaboration between the Arizona Supreme Court's Commission on Diversity, Equality, and Justice in the Judiciary (“Commission”) and the Arizona Supreme Court Administrative Office of the Courts’ Juvenile Justice Services Division. The Commission (formerly the Commission on Minorities in the Judiciary) would like to thank Amy Stuart, Mary Hoyle, and Alicia Henry of the Administrative Office of the Courts for the report’s creation and analysis. The Commission would like to recognize the Honorable Lisa Abrams, the Honorable Joan Wagener, Professor Patricia Ferguson-Bohnee, Professor Paul Bennett, and Dr. Catharina Johnson for their assistance with finalizing this report.
Respectfully submitted,
Judge Frankie Jones, Chair, Commission on Diversity, Equality, and Justice in the Judiciary May 2021
Members Honorable Frankie Y Jones, Chair Phoenix Municipal Court
Honorable Lisa I. Abrams Superior Court in Pima County
Mr. Mike Baumstark Administrative Office of the Courts
Professor Paul D. Bennett University of Arizona James E. Rogers College of Law
Honorable David Cunanan Superior Court in Maricopa County
Associate Dean Alfred Ray English ASU Sandra Day O'Connor College of Law
Professor Patricia Ferguson-Bohnee ASU Sandra Day O'Connor College of Law
Honorable David Gass Court of Appeals, Division 1
Mr. Edgardo Gonzalez Yuma County Adult Probation
Honorable Geri Hale Tucson City Court
Dr. Catharina M. Johnson Maricopa County Juvenile Probation Department
Mr. William Knight The People’s Law Firm, PLC
Honorable Boyce “BJ” D. Little, Jr. Navajo County Justice Courts
Honorable Alicia M. Skupin Chandler City Court
Honorable Roxanne K. Song Ong (Ret.) Phoenix Municipal Court
Honorable Alisha Villa Phoenix Municipal Court
Honorable Joan Wagener Superior Court in Pima County
Honorable Dawn Walton Superior Court in Maricopa County
Honorable Roy “Chuck: Whitehead Superior Court in Maricopa County
Honorable Penny L. Willrich (Ret.) Superior Court in Maricopa County
Staff
Ms. Theresa Barrett Ms. Laura Ritenour Ms. Diana Tovar AOC – Court Services Division
This report was developed by the Arizona Supreme Court's Commission on Minorities' and the Juvenile Justice Services Division research team, Arizona Supreme Court, Administrative Office of the Courts.

2
Executive Summary In response to recommendations from the 2002 Equitable Treatment of Minority Youth report produced by the Arizona Supreme Court Commission on Minorities in the Judiciary (COM), a statewide report card examining equitable treatment was created. The purpose of this report card is to assess points of disparity for racial and ethnic minorities across the juvenile justice system using recommendations set forth by the Office of Juvenile Justice and Delinquency Prevention (OJJDP). This is the seventh report card and examines data from calendar years 2016-2018. These report cards are essential to the work on equitable treatment of minority youth as they provide a framework for understanding potential issues in the juvenile justice system. As the OJJDP states, measuring racial and ethnic disparities is similar to taking the vital signs of the juvenile justice system; it brings attention to problems and helps focus efforts aimed at addressing those problems. This report card, as well as previous publications, fulfill this need by detecting possible areas of concern within the juvenile justice system. In this report card, 14 outcomes across 5 different discretionary points were examined for potential disparity using the methodology outlined by the OJJDP. This analysis reveals that disparity is not uniform across the system. Results indicate that racial and ethnic minorities receive outcomes that are more restrictive, less restrictive, or the same as White youth depending upon the decision point being examined.
Key Findings Minorities are overrepresented at the referral, detention, direct filing to adult court, and
the Arizona Department of Juvenile Corrections (ADJC) outcomes. The referral, direct filing to adult court, and ADJC decisions are the outcomes with the
greatest disparity of any of the outcomes examined. o Black youth are the most disadvantaged group in each of these outcomes. o Each of the minority groups examined are at least 50% more likely than White youth
to be direct filed to adult court. o Black youth are 2.3 times and Latinx youth are 50% more likely than White youth to
be sent so ADJC. Indigenous youth are at least 60% more likely than White youth to be screened and
detained. Black and Indigenous youth are at least 20% more likely than White youth to have a petition
filed. Latinx and Indigenous youth are 40% more likely than White youth to receive Juvenile
Intensive Probation Supervision (JIPS). Asian and Unknown youth receive outcomes that are equal to or less restrictive than White
youth at the majority of decision points. o Asian youth are especially underrepresented at the decision to refer to the juvenile
justice system. o Unknown youth are 40% less likely than White youth to be screened and detained.
White and minority youth experience similar outcomes at the decisions to not bring the youth to detention, not file a petition, adjudicate the youth delinquent, and be awarded standard probation.
Results of the analysis performed as well as measures in place to address disparity moving forward are discussed throughout this report.

3
Prob
atio
n
Figure 1: Juvenile Justice Flow Chart
Law
Enf
orce
men
tPr
obat
ion
Probation & Judiciary
Judi
ciar
yC
ount
y A
ttorn
ey
Delinquent/IncorrigibleAct
Action by Law Enforcement
Referral
Probation or Detention
Detention
County Attorney
No Petition
Filed
Petition Filed
Advisory Hearing
Adjudication
Dismissed Adjudicated
Disposition Hearing
Committedto ADJC
Other Sanctions Probation
Standard Probation JIPS
Direct Filing to Adult Court - Discretionary or
Mandatory
Transfer Request
Transfer Hearing
Denied Granted
Remand to Adult Court
Diversion
Consequences
Successful Completion
Non-Compliance
Screened &Detained
Screened &Released
Probation OfficerRecommendation

4
Data and Methodology The purpose of this report card is to examine over and underrepresentation of racial and ethnic minorities in the juvenile justice system. Representation is assessed by comparing the outcomes of racial and ethnic minorities relative to White juveniles at various discretionary points throughout the system. The primary method of analysis is the Relative Rate Index (RRI). RRIs are calculated for different outcomes at 5 discretionary points: Referral, Detention, Formal Court Processing, Petition Outcome, and Court Disposition. For discretionary points where juveniles may experience one of several different outcomes, information detailing each of these outcomes is presented. A flowchart showing the ways in which juveniles progress through the system as well as the criminal justice system actor – law enforcement, prosecutor, judge – responsible for decision making at that point is presented in Figure 1.
Juveniles enter the juvenile justice system with a referral and exit the system at a variety of different points. This report examines how far into the system a juvenile’s referral proceeds. Juveniles may experience multiple referrals in the period examined and may be present in the data more than once.
Referral-level data for this report were extracted from the Juvenile On-Line Tracking System (JOLTSaz) and Integrated Court Information System (iCIS)1 for calendar years (CY) 2016, 2017, and 2018. These years were chosen for two reasons. First, selecting these years gives adequate time for a referral to be processed through the system, allowing for the most complete presentation of each of the referrals in 2016, 2017, and 2018. Second, capturing several years of data increases the likelihood the results accurately reflect juvenile justice system
1 Information for those who were direct filed to adult court in Pima County were not available in JOLTSaz. Information regarding these individuals was obtained directly from Pima County. Data from Maricopa County are fed into JOLTSaz from iCIS with the exception of Maricopa’s detention data. Maricopa detention data were extracted directly from iCIS.
What is a Relative Rate Index (RRI)? The Relative Rate Index (RRI) is a measure of over and underrepresentation used by the Office of Juvenile Justice and Delinquency Prevention. It is designed to be an “early warning sign” measure, not an outcome. It should be used to point out potential problem areas so that the system’s attention can be more effectively focused.
The RRI is a comparison of the rates of occurrence for racial/ethnic groups. A rate of occurrence is the number of cases of a juvenile justice event (for example, referral) in terms of another event (for example, juvenile population).
The RRI is calculated by taking the rate of occurrence of events for one race/ethnicity divided by the rate of occurrence of that same event for another race/ethnicity. For this report, the base comparison group is White. The RRI score is not calculated for any group whose proportion of the population is less than 1%.
An RRI of greater than one indicates some degree of overrepresentation. Likewise, an RRI of less than one points to a degree of underrepresentation.
RRIs represent a more robust measure of representation than other methods of analysis such as percentages. Percentages show the proportion of each racial/ethnic group at a particular decision point (referral, detention, petition, etc.) based on the total number of juveniles at that decision point. RRIs offer a comparison of youth who are a racial or ethnic minority relative to White youth, allowing for an estimate of the degree of over or underrepresentation of minority youth in the juvenile justice system. As such, minority youths’ percentages may suggest disparity, but when compared to the percentages of White youth, this disparity may disappear. By accounting for the proportion of White youth at the same point, RRIs offer a truer picture of representation in the juvenile justice system.

5
practices over time and not just at the time the data was captured.
For clarity, only totals for and averages of these years are presented in the body of this report. Tables including yearly data are presented in the Appendix.
Data extracted from JOLTSaz details each offense for which the juvenile was charged. This report card presents statistics for the offense which progressed the furthest through the system. In instances where the juvenile was adjudicated of multiple offenses, the most serious offense was examined. While juveniles always enter the system with a referral, they may exit the system at a variety of different points. As such, the number of juveniles examined at each discretionary point is expected to decrease, the further into the system the point examined progresses. To account for this, the population by which the rate of representation is calculated shifts to reflect the number of juveniles present at that point. Referral, Detention, and Petition Outcomes were evaluated using the number of referrals; Petition Outcomes were examined using the number of juveniles who had a petition filed, and Court Dispositions outcomes were assessed using the number of juveniles who were adjudicated2.
Results Referral: Law Enforcement Juveniles formally enter the court system when a referral is made. Per statute, referrals can be generated by a variety of actors3; however, the referrals examined in this report card began with law enforcement. As such, the number of referrals in the Arizona juvenile justice system are driven by the law enforcement agencies in the state. A referral is generated when an allegation is made that the juvenile committed a delinquent or incorrigible act. When a juvenile is referred, the referral is submitted to the county attorney. Decisions made by the county attorney are examined later in this report. For a referral to be made, the juvenile must be between 8 and 17 years old4.
Table 1 presents information on the average juvenile population as well as the average number of referrals for each of the racial and ethnic populations in Arizona in CY 2016 – CY 2018. Population information was gathered using the Easy Population Calculator provided by the National Center for Juvenile Justice (NCJJ) with funding from the OJJDP (NCJJ, n.d.a). Demographic information used in the NCJJ Easy Population Calculator is based upon information collected by the U.S. Census Bureau (NCJJ, n.d.b). For all other information presented in this report, the juvenile’s race or ethnicity follows what was captured in JOLTSaz. While juveniles may be both a racial and ethnic minority – for example, both Black and Latinx – juveniles were grouped into one category for analysis. Juveniles who were identified as Latinx are coded as being Latinx, while those who were not identified as being Latinx are categorized by their race. This means that those identified as being Latinx may also be White, Black, Indigenous, Asian, or Unknown, while those who were not identified as being Latinx are categorized based on their race.
2 The totals for each of the denominator categories (referral, petition, and adjudication) change slightly throughout this report to account for variations in the information available at each discretionary point. For example, in instances where a referral has been filed but no decision has been made on how to proceed – i.e., the referral is still pending – those referrals were included in the referral stage but were removed from analysis at the court processing stage. 3 Referrals can be made by police, parents, school officials, probation officers, unknown agencies, or individuals requesting that the juvenile court assume jurisdiction over the juvenile’s conduct. 4 At times, individuals who are under the age of 8 and over the age of 17 are referred to the juvenile justice system. Information on the referral and the youth referred is maintained in JOLTSaz for informational purposes only. Since these individuals are not processed through the juvenile justice system, they have been excluded from analysis in this report.

6
Table 1. Arizona Population and Referrals, CY 2016, 2017, and 2018 Population Referrals Female Male
N % N % RRI N % N % White
Total 1,165,975 41.65% 34,978 3.00% 1.0 11,564 33.06% 23,413 66.94% Average 388,658 41.65% 11,659 3.00% 1.0 3,855 33.06% 7,804 66.94%
Black Total 161,313 5.76% 11,667 7.23% 2.4 3,294 28.23% 8,367 71.72% Average 53,771 5.76% 3,889 7.23% 2.4 1,098 28.23% 2,789 71.72%
Latinx Total 1,231,112 43.97% 33,387 2.71% 0.9 9,964 29.84% 23,422 70.15% Average 410,371 43.97% 11,129 2.71% 0.9 3,321 29.84% 7,807 70.15%
Indigenous Total 143,841 5.14% 5,384 3.74% 1.2 1,764 32.76% 3,620 67.24% Average 47,947 5.14% 1,795 3.74% 1.2 588 32.76% 1,207 67.24%
Asian Total 97,505 3.48% 631 0.65% 0.2 192 30.43% 439 69.57% Average 32,502 3.48% 210 0.65% 0.2 64 30.43% 146 69.57%
Unknown5 Total - - 1,319 - - 435 32.98% 883 66.94% Average - - 440 - - 145 32.98% 294 66.94%
Overall Total Total 2,799,746 100.00% 87,366 3.12% - 27,213 31.15% 60,144 68.84% Average 933,249 33.33% 29,122 3.12% - 9,071 31.15% 20,048 68.84%
On average, 933,249 juveniles lived in Arizona in the period examined (CY 2016 - CY 2018). The majority of these juveniles were Latinx (44%), followed closely by White juveniles who made up an average of 42% of the juvenile population. Black (6%), Indigenous (5%), and Asian (3%) juveniles made up the remaining population. Of the 933,249 juveniles in Arizona, 3% (29,122) were referred
5 Juveniles identified as “Unknown” in JOLTSaz are those who did not identify or were not identified as being White, Black, Latinx, Indigenous, or Asian. Data on juveniles who are not classified into one of these categories are not gathered by the OJJDP. As such, these population numbers are not presented in this report.
Law Enforcement
Delinquent/IncorrigibleAct
Action by LawEnforcement
Referral

7
to the juvenile justice system. Of those referred, almost 70% (68.84%) were male. The average age of those referred was 15.56 years, with White, Asian, and Indigenous youth (15.69 years) having the highest average age of referral and Indigenous youth (15.34 years) having the lowest (see Table 1a in the Appendix for further details). RRIs for Black, Latinx, Indigenous, and Asian youth referred relative to White youth are depicted on Figure 2.
Black juveniles were the most overrepresented group at the referral phase with an RRI of 2.4. This means that Black juveniles were 2.4 times more likely to be referred to the juvenile justice system in Arizona than White youth. Indigenous juveniles (1.2) were also referred at a higher rate than White juveniles. Alternatively, Latinx juveniles (0.9) were slightly underrepresented at the point of referral, while Asian (0.2) juveniles were 80% less likely than White youth to be referred to the juvenile justice system – making them the most underrepresented population relative to White youth to enter the system.
Detention: Probation or Detention Personnel When a juvenile is referred, they may either be brought to detention or allowed to maintain their position in the community (not brought to detention). If the juvenile is brought to detention, juvenile probation or detention personnel will determine whether the juvenile should be detained or released back into the community using the Detention Screening Instrument (DSI)6. Juveniles may also be detained as a consequence of their delinquency or as a condition of their probation. Detention outcomes are presented on Table 2.
6 Criteria for a juvenile to be detained are outlined in Rule 23D. Juveniles are detained for a variety of reasons, such as probation personnel being concerned the juvenile may not appear for their hearing or the juvenile may pose a risk to themselves or others in the community.

8
Table 2. Detention Outcomes, CY 2016, 2017, and 2018 Referrals Not Brought to
Detention Total Brought to
Detention Screened &
Released Screened & Detained
N N % RRI N % RRI N % RRI N % RRI White
Total 34,929 30,439 87.15% 1.0 4,490 12.85% 1.0 972 2.78% 1.0 3,518 10.07% 1.0 Average 11,643 10,146 87.15% 1.0 1,497 12.85% 1.0 324 2.78% 1.0 1,173 10.07% 1.0
Black Total 11,622 9,880 85.01% 1.0 1,742 14.99% 1.2 338 2.91% 1.0 1,404 12.08% 1.2 Average 3,874 3,293 85.01% 1.0 581 14.99% 1.2 113 2.91% 1.0 468 12.08% 1.2
Latinx Total 33,243 27,816 83.67% 1.0 5,427 16.33% 1.3 1,095 3.29% 1.2 4,332 13.03% 1.3 Average 11,081 9,272 83.67% 1.0 1,809 16.33% 1.3 365 3.29% 1.2 1,444 13.03% 1.3
Indigenous Total 5,376 4,404 81.92% 0.9 972 18.08% 1.4 129 2.40% 0.9 843 15.68% 1.6 Average 1,792 1,468 81.92% 0.9 324 18.08% 1.4 43 2.40% 0.9 281 15.68% 1.6
Asian Total 631 554 87.80% 1.0 77 12.20% 0.9 20 3.17% - 7 57 9.03% 0.9 Average 210 185 87.80% 1.0 26 12.20% 0.9 7 3.17% - 19 9.03% 0.9
Unknown Total 1,312 1,214 92.53% 1.1 98 7.47% 0.6 15 1.14% - 83 6.33% 0.6 Average 437 405 92.53% 1.1 33 7.47% 0.6 5 1.14% - 28 6.33% 0.6
Overall Total Total 87,113 74,307 85.30% - 12,806 14.70% - 2,569 2.95% - 10,237 11.75% - Average 29,038 24,769 85.30% - 4,269 14.70% - 856 2.95% - 3,412 11.75% -
The majority of juveniles referred to the juvenile justice system were not brought to detention (85%). Of those brought to detention, 12% were detained and 3% were released back into the community. Indigenous (1.6), Latinx (1.3), and Black (1.2) juveniles were all overrepresented in the decision to detain while Asian (0.9) and Unknown (0.6) juveniles were underrepresented. RRIs for those brought to detention but released as well as for those not brought to detention indicate that White and minority juveniles receive similar outcomes, meaning that the relative rates for
7 Per OJJDP guidance, decision points where occurrence is fewer than 5 times for any of the groups should not be examined as the likelihood that results will be skewed by the low number of instances is high (OJJDP Technical Assistance Manual, 2009). While their recommendation is 5 times, they also advise caution against examining all decision points with small sizes. In previous versions of this report, decisions points with fewer than 10 instances were not examined. To maintain this consistency, decision points with fewer than 10 instances will not be examined.
Probation & JudiciaryProbation & Judiciary
Probation or Detention Personnel Detention
Screened &Detained
Screened &Released
9
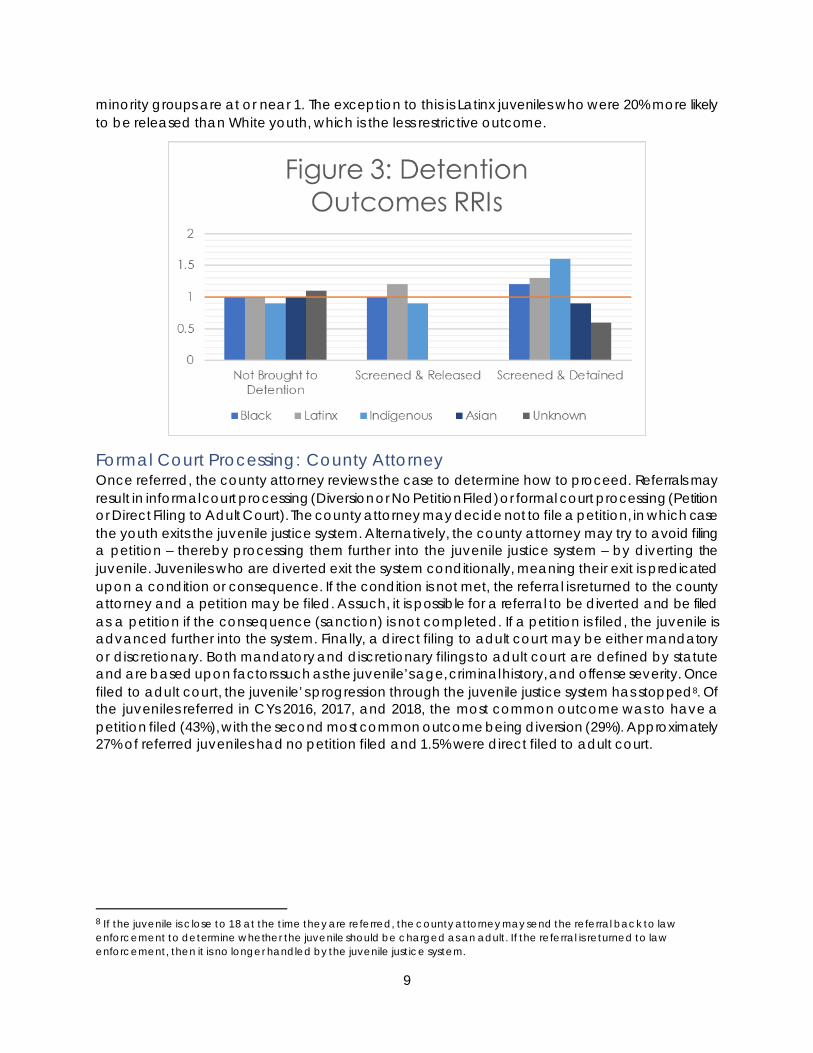
minority groups are at or near 1. The exception to this is Latinx juveniles who were 20% more likely to be released than White youth, which is the less restrictive outcome.
Formal Court Processing: County Attorney Once referred, the county attorney reviews the case to determine how to proceed. Referrals may result in informal court processing (Diversion or No Petition Filed) or formal court processing (Petition or Direct Filing to Adult Court). The county attorney may decide not to file a petition, in which case the youth exits the juvenile justice system. Alternatively, the county attorney may try to avoid filing a petition – thereby processing them further into the juvenile justice system – by diverting the juvenile. Juveniles who are diverted exit the system conditionally, meaning their exit is predicated upon a condition or consequence. If the condition is not met, the referral is returned to the county attorney and a petition may be filed. As such, it is possible for a referral to be diverted and be filed as a petition if the consequence (sanction) is not completed. If a petition is filed, the juvenile is advanced further into the system. Finally, a direct filing to adult court may be either mandatory or discretionary. Both mandatory and discretionary filings to adult court are defined by statute and are based upon factors such as the juvenile’s age, criminal history, and offense severity. Once filed to adult court, the juvenile’s progression through the juvenile justice system has stopped8. Of the juveniles referred in CYs 2016, 2017, and 2018, the most common outcome was to have a petition filed (43%), with the second most common outcome being diversion (29%). Approximately 27% of referred juveniles had no petition filed and 1.5% were direct filed to adult court.
8 If the juvenile is close to 18 at the time they are referred, the county attorney may send the referral back to law enforcement to determine whether the juvenile should be charged as an adult. If the referral is returned to law enforcement, then it is no longer handled by the juvenile justice system.

10
Table 3. Court Processing Outcomes, CY 2016, 2017, and 2018 Referrals No Petition Diversion Petition Filed Direct Filed
N N % RRI N % RRI N % RRI N % RRI White
Total 34,671 9,252 26.69% 1.0 11,454 33.04% 1.0 13,645 39.36% 1.0 320 0.92% 1.0 Average 11,557 3,084 26.69% 1.0 3,818 33.04% 1.0 4,548 39.36% 1.0 107 0.92% 1.0
Black Total 11,571 2,857 24.69% 0.9 2,682 23.18% 0.7 5,732 49.54% 1.3 300 2.59% 2.8
Average 3,857 952 24.69% 0.9 894 23.18% 0.7 1,911 49.54% 1.3 100 2.59% 2.8
Latinx Total 33,176 8,966 27.03% 1.0 8,758 26.40% 0.8 14,878 44.85% 1.1 574 1.73% 1.9 Average 11,059 2,989 27.03% 1.0 2,919 26.40% 0.8 4,959 44.85% 1.1 191 1.73% 1.9
Indigenous Total 5,345 1,442 26.98% 1.0 1,236 23.12% 0.7 2,594 48.53% 1.2 73 1.37% 1.5 Average 1,782 481 26.98% 1.0 412 23.12% 0.7 865 48.53% 1.2 24 1.37% 1.5
Asian Total 627 144 22.97% 0.9 245 39.07% 1.2 231 36.84% 0.9 7 1.12% -
Average 209 48 22.97% 0.9 82 39.07% 1.2 77 36.84% 0.9 2 1.12% -
Unknown Total 1,296 380 29.32% 1.1 487 37.58% 1.1 414 31.94% 0.8 15 1.16% - Average 432 127 29.32% 1.1 162 37.58% 1.1 138 31.94% 0.8 5 1.16% -
Overall Total Total 86,686 23,041 26.58% - 24,862 28.68% - 37,494 43.25% - 1,289 1.49% - Average 28,895 7,680 26.58% - 8,287 28.68% - 12,498 43.25% - 430 1.49% -
The outcome of no petition was similar across groups, with Unknown juveniles being 10% more likely than White juveniles to not be petitioned and Black and Asian youth being 10% less likely than White youth to not be petitioned. As for diversion, Black (0.7), Latinx (0.8), and Indigenous (0.7) youth were less likely to receive diversion than White youth. Black (1.3), Latinx (1.1), and Indigenous (1.2) juveniles were also all more likely than White juveniles to have a petition filed. Finally, on average, 1.5% of juveniles referred to the juvenile justice system were sent to adult court. Of those direct filed to adult court, Black (2.8), Latinx (1.9), and Indigenous (1.5) juveniles were
C
County Attorney
County Attorney
No Petition
Filed
Petition Filed
Direct Filing to Adult Court - Discretionary or
MandatoryDiversion
Consequences
Successful Completion
Non-Compliance

11
overrepresented9. Asian and Unknown youth were direct filed to adult court fewer than 10 times, meaning the RRIs could not be calculated. Taken together, court processing outcomes suggest that juveniles who are Black, Latinx, or Indigenous are more likely than White juveniles to be processed further into the criminal justice system via a greater likelihood of having a petition filed and a lower likelihood of being diverted. This leads to a higher likelihood of increased representation in later stages of the juvenile justice system. Black, Indigenous, and Latinx youth are also significantly more likely than their White peers to receive the most restrictive outcome – direct file to adult court. This suggests that juveniles in these three minority groups receive the most restrictive outcomes relative to their White peers in court processing decisions. Unlike their minority peers, Asian and Unknown youth received outcomes that were either the same as or less restrictive relative to White juveniles at both the decision to file a petition or to divert the juvenile, suggesting these juveniles may receive preferred outcomes at these points.
Petition Outcomes: Judiciary If a petition is filed, the juvenile will proceed to an advisory hearing. At this hearing, the county attorney may advocate for the juvenile to be remanded (transferred) to adult court. If the county attorney requests a transfer, the judge may either grant the transfer request – resulting in the juvenile being remanded to adult court – or the judge may deny the transfer request, resulting in the juvenile proceeding to an adjudication hearing. If the county attorney does not request a transfer, then the juvenile will proceed to the adjudication hearing. At the adjudication hearing, the charges against the juvenile may either be dismissed or adjudicated. If the juvenile’s charges are dismissed, then the juvenile exits the system; if the juvenile is adjudicated delinquent, then the judge will confer with the probation officer on what disposition the juvenile should receive10.
9 To better understand what could be driving these outcomes, the number of juveniles sent to adult court by type (Mandatory, Discretionary, and Remand) is provided in the appendix on Table 3a. The majority of juveniles direct filed to adult court (67%) were mandatory direct files. 10 In instances when the juvenile is not adjudicated and receives a disposition on the same day, the probation officer will make a formal recommendation to the judge about how to sanction the juvenile. If the juvenile is adjudicated and receives a disposition on the same day, no formal recommendation is made by the probation officer.

12
Table 4. Petition Outcomes, CY 2016, 2017 and 2018 Petitions
Filed Dismissed Adjudicated Transferred
N N % RRI N % RRI N % RRI White
Total 13,492 4,233 31.37% 1.0 9,245 68.52% 1.0 14 0.10% - Average 4,497 1,411 31.37% 1.0 3,082 68.52% 1.0 5 0.10% -
Black Total 5,645 2,146 38.02% 1.2 3,484 61.72% 0.9 15 0.27% - Average 1,882 715 38.02% 1.2 1,161 61.72% 0.9 5 0.27% -
Latinx Total 14,478 4,062 27.54% 0.9 10,647 72.19% 1.1 39 0.26% - Average 4,916 1,354 27.54% 0.9 3,549 72.19% 1.1 13 0.26% -
Indigenous Total 2,552 892 34.95% 1.1 1,658 64.97% 0.9 2 0.08% - Average 851 297 34.95% 1.1 553 64.97% 0.9 1 0.08% -
Asian Total 229 58 25.33% 0.8 170 74.24% 1.1 1 0.44% - Average 76 19 25.33% 0.8 57 74.24% 1.1 0 0.44% -
Unknown Total 404 131 32.43% 1.0 270 66.83% 1.0 3 0.74% - Average 135 44 32.43% 1.0 90 66.83% 1.0 1 0.74% -
Overall Total Total 37,070 11,522 31.08% - 25,474 68.72% - 74 0.20% - Average 12,357 3,841 31.08% - 8,491 68.72% - 24 0.20% -
The majority of juveniles petitioned were adjudicated delinquent (69%). Of those adjudicated, the RRIs were all at or close to 1, with Latinx and Asian juveniles (1.1) being slightly above 1 and Black and Indigenous juveniles being (0.9) slightly below 1. This indicates the likelihood of being adjudicated for White and minority juveniles is similar, regardless of the racial or ethnic group being examined. For dismissals, Black juveniles (1.2) were 20% more likely to be dismissed while Asians (0.8) were 20% less likely than Whites to have their charges dismissed. Finally, the number and
Judiciary
Advisory Hearing
Adjudication
Dismissed Adjudicated
Transfer Request
Transfer Hearing
Denied Granted
Remand to Adult Court

13
percentage of juveniles transferred are included in Table 4; however, in accordance with OJJDP recommendations, RRIs were not calculated due to the small number of events – especially for White juveniles.
Court Dispositions: Judiciary Juveniles who are adjudicated delinquent precede to a disposition hearing. At this hearing, the judge determines how the juvenile will be sanctioned. Juveniles may either receive a penalty only such as a court consequence, standard or JIPS probation, or be committed to ADJC.
Judiciary
Disposition Hearing
Committedto ADJC
Other Sanctions Probation
Standard JIPS
Probation OfficerRecommendation

14
Table 5. Disposition Decisions, CY 2016, 2017, and 2018
Adjudicated Penalty Only Probation: Standard Probation: JIPS ADJC N N % RRI N % RRI N % RRI N % RRI
White Total 9,183 514 5.60% 1.0 7,044 76.71% 1.0 1,358 14.79% 1.0 267 2.91% 1.0 Average 3,061 171 5.60% 1.0 2,348 76.71% 1.0 453 14.79% 1.0 89 2.91% 1.0
Black Total 3,462 282 8.15% 1.5 2,582 74.58% 1.0 367 10.60% 0.7 231 6.67% 2.3 Average 1,154 94 8.15% 1.5 861 74.58% 1.0 122 10.60% 0.7 77 6.67% 2.3
Latinx Total 10,596 785 7.41% 1.3 7,158 67.55% 0.9 2,191 20.68% 1.4 462 4.36% 1.5 Average 3,532 262 7.41% 1.3 2,386 67.55% 0.9 730 20.68% 1.4 154 4.36% 1.5
Indigenous Total 1,644 92 5.60% 1.0 1,172 71.29% 0.9 331 20.13% 1.4 49 2.98% 1.0 Average 548 31 5.60% 1.0 391 71.29% 0.9 110 20.13% 1.4 16 2.98% 1.0
Asian Total 169 19 11.24% - 112 66.27% 0.9 25 14.79% - 13 7.69% - Average 56 6 11.24% - 37 66.27% 0.9 8 14.79% - 4 7.69% -
Unknown Total 259 13 5.02% - 210 81.08% 1.1 33 12.74% 0.9 3 1.16% - Average 86 4 5.02% - 70 81.08% 1.1 11 12.74% 0.9 1 1.16% -
Overall Total Total 25,313 1,705 6.74% - 18,278 72.21% - 4,305 17.01% - 1,025 4.05% - Average 8,438 568 6.74% - 6,093 72.21% - 1,435 17.01% - 342 4.05% -
Probation was the most common disposition. Over 89% of adjudicated juveniles were placed on either standard (72%) or intensive (17%) probation. For standard probation, each of the RRIs were either at or close to 1, with Latinx, Indigenous, and Asian juveniles being slightly underrepresented (0.9) and Unknown youth being slightly overrepresented (1.1). For JIPS, however, racial and ethnic minorities experienced greater differences relative to White youth. In particular, Latinx and Indigenous juveniles experienced the greatest overrepresentation with an RRI of 1.4, suggesting that both of these groups were 40% more likely to receive JIPS than White juveniles. Black and Unknown juveniles were underrepresented in JIPS. While Black juveniles were the most underrepresented group in JIPS, they were the most overrepresented group in being sent to ADJC. At this decision point, their RRI is 2.3, suggesting that Black youth are 2.3 times more likely than White juveniles to be sentenced to ADJC. Latinx youth were also more likely than White youth to be sent to ADJC (1.5). The population size of Asian and Unknown youth was too small to evaluate. Finally, Black (1.5) and Latinx (1.3) youth are more likely than White youth to receive the consequence of penalty only.

15
Across the System Across the juvenile justice system, outcomes vary depending on the decision point and the racial or ethnic group being examined. Five outcomes have at least one minority group with an RRI of either 1.5 or greater or 0.5 or less, meaning there is at least a 50% difference in the likelihood of an outcome occurring between White and minority youth. These outcomes are the decision to refer, screen and detain, direct file to adult court, receive the disposition of penalty only, and commit to ADJC. While the likelihood is most pronounced for groups with an RRI of 1.5 or 0.5, several other groups experience moderate differences (RRI equal to or greater than 1.2 but less than 1.5 or

16
equal to or less than 0.8 but greater than 0.5) at these outcomes as well. At the referral outcome, Black and Indigenous juveniles are overrepresented and Asian juveniles are underrepresented. Additionally, Black, Latinx, and Indigenous youth are all at least 20% more likely to be screened and detained than White juveniles. Unknown juveniles are 40% less likely to be screened and detained than White juveniles.
As for direct filed to adult court, each of the minority groups examined were at least 50% more likely than White juveniles to be direct filed to adult court, suggesting that disparity is especially pronounced at this outcome. At the outcome of penalty only, Black and Indigenous juveniles experience a 30% greater likelihood than White juveniles to receive this outcome. Finally, Black youth are 2.4 times more likely and Latinx youth are 50% more likely than White youth to be committed to ADJC. Taken together, this suggests that – when disparity is especially pronounced for one group (RRI of 1.5 or higher) – it is likely that at least one other minority group is also experiencing a more restrictive outcome than White youth. In essence, when disparity is especially pronounced for one minority group, it is likely that disparity is also at least moderately pronounced for other minority groups as well. As such, addressing disparity at points with pronounced differential outcomes is expected to benefit multiple minority groups.
As for differences in outcomes across the system based on race or ethnicity, Black youth are the most overrepresented group at four of the five points with pronounced disparity – referrals (2.4), direct filed (2.8), penalty only (1.5), and ADJC (2.3.) Overrepresentation at the decisions to refer, direct file, and ADJC also represents the outcomes with the greatest disparity of any of the points examined. This suggests that Black juveniles experience the most pronounced and most frequent significant overrepresentation across the juvenile justice system of any of the minority groups examined. As for the other decision point with an RRI greater than 1.5, Indigenous youth are the most overrepresented group at the decision to screen and detain (1.6). Indigenous youth are also 50% more likely than White youth (1.5) to be direct filed to adult court. Finally, while not the most overrepresented group at any decision point, Latinx youth also experience overrepresentation of greater than 1.5 at two points – direct file and ADJC. At these points, Latinx juveniles are 90% (1.9) and 50% (1.5) more likely to be direct filed or sent to ADJC than White youth respectively. Although no group had an RRI of 1.5 or greater for JIPS, both Latinx and Indigenous youth had RRIs of 1.4, making them 40% more likely than White youth to receive JIPS as a disposition.
Neither Asian nor Unknown youth were significantly overrepresented at any of the outcomes examined. The greatest outcome with overrepresentation for either of these groups is diversion – where Asian youth have an RRI of 1.2 and Unknown youth have an RRI of 1.1. Overrepresentation at the diversion stage suggests that Asian and Unknown youth are more likely to be diverted from the criminal justice system at rates higher than White youth, meaning they are less likely to progress further into the system. Asian and Unknown youth are more likely than White youth to receive the less restrictive outcome at other decision points as well. Asian (0.2) youth were 80% less likely than White youth to be referred, meaning they are less likely than White youth to enter the juvenile justice system at all. Asian youth were also more likely to have their referral diverted (1.2) and their petition dismissed (0.8), suggesting that – relative to White youth – they are more likely to receive a less restrictive outcome when they move further into the juvenile justice system.
Finally, Unknown youth received outcomes similar to White youth at many of the decision points examined. The exception to this is Unknown youth have an RRI of 0.6 at the decision to screen and detain the juvenile. This suggests that Unknown juveniles are 40% less likely than White juveniles to be screened and detained. Notably, there are several decision points throughout the process

17
where RRIs for Asian and Unknown youth could not be captured due to their infrequent occurrence in the data, meaning that outcomes at these points could not be examined.
While at least one minority group appears to receive an outcome that is more restrictive than White youth at the majority of decision points assessed, there are several points where White and minority youth experience similar rates of representation. Specifically, White and minority youth were not brought to detention, had no petition filed, adjudicated, and receive standard probation at similar rates. This suggests that juveniles at these decision points are likely to receive similar outcomes, regardless of their race or ethnicity.
Discussion The purpose of this report was to examine points of disparity between White and minority youth across the juvenile justice system. In total, 5 decision points and 14 outcomes were examined using RRIs. This analysis shows that disparity is the greatest at 5 outcomes – referrals, detentions, direct filings, and ADJC. While disparity at these outcomes is especially pronounced for at least one minority group, each of these outcomes has at least one other minority group with a 20% or higher likelihood of receiving a more restrictive outcome than White youth. This means that outcomes with pronounced disparity for one minority group are likely to produce disparity for other minority groups as well. As for outcomes for specific racial and ethnic groups, Black youth are the most overrepresented at referrals, direct filed, penalty only and ADJC. Referrals, direct filed, and ADJC are also the three points with the greatest disparity in the juvenile justice system, meaning that Black juveniles are the most likely to receive restrictive outcomes relative to White youth of any of the minority groups examined. In addition to overrepresentation, underrepresentation was also examined. Asian youth are significantly underrepresented at the decision to refer while Unknown youth are significantly underrepresented at the decision to detain.
As previously stated, Black youth experience the three greatest instances of disparity of the points examined – referrals, direct filings, and ADJC. They are also overrepresented at detention, petition filed, dismissed, and penalty only and underrepresented at diversion, adjudication, and JIPS. For Black juveniles, the high rate of referrals experienced by this group may lead to adverse outcomes later in the system. This is illustrated by Black juvenile’s pronounced overrepresentation at the

18
decision to direct file and the decision to commit to ADJC as the juvenile’s contact with the juvenile justice system may factor significantly into the likelihood that they receive one of these outcomes. For example, one component of the statute dictating who is direct filed to adult court is criminal history. This means that with each additional contact a Black juvenile has with the juvenile justice system, the likelihood they will be direct filed to adult increases. These same contacts may also increase the likelihood the juvenile will be committed to ADJC, if increased contacts lead to the juvenile being labeled as a chronic offender. Additionally, Black youth are more likely to have a petition filed and are less likely to receive diversion – suggesting they are more likely than White youth to be processed further into the system. Taken together, the analysis performed suggests that Black youth enter the system at rates that are significantly higher than their White peers. Once there, they are also significantly more likely than their White peers to receive the most restrictive outcomes – direct filed and ADJC – as well as to be processed further into the system via a higher likelihood of having a petition filed and lower likelihood of having their referral dismissed.
Indigenous juveniles are also overrepresented at several points throughout the system. In particular, they are the most overrepresented group at the decision to detain. They are also slightly underrepresented at the decision not to bring the juvenile to detention and to screen and release. This suggests that detention represents a point of significant restrictiveness for Indigenous youth. This increased restrictiveness is also apparent at the decisions to direct file the juvenile to adult court and to receive JIPS when adjudicated. Given that decisions to detain are driven by the DSI, it is possible that Indigenous juveniles are scoring higher than their White peers on certain portions of the instrument. Future research should continue to explore the effect of screening tools on specific groups.

19
Unlike their Black peers, Latinx youth are underrepresented at the point of referral but are significantly more likely than White youth to be direct filed to adult court. One reason for this may be that Latinx youth are triggering different elements of the statute governing direct filings to adult court than Black youth – age of the offender11 or offense severity. Given that Latinx youth are also overrepresented at the decisions to detain, have a petition filed, and to receive JIPS or ADJC, it is possible that, when Latinx juveniles enter the system, they do so with offenses that are more severe than White youth. As such, despite being referred at lower rates, they are more likely to receive more restrictive outcomes as they move through the juvenile justice system.
Finally, both Asian and Unknown youth consistently received outcomes that were the same or less restrictive than White youth. In particular, Asian youth were the most underrepresented group at any point in the system – referral. At the referral stage they were 80% less likely than White youth to be referred. This means that Asian youth enter the system at rates that are much lower than White youth. Once in the system, they are also less likely than Whites to be detained or have a petition filed and are more likely than White youth to receive diversion. That said, Asian youth were 20% less likely to have their petition dismissed and 10% more likely to be adjudicated. This means that – although Asian youth are less likely to enter the juvenile justice system than White youth – once in the system, they receive outcomes that are slightly more restrictive than those of White youth at the end of the process.
11 Although not specific to direct filings, on average, Latinx youth tended to be slightly younger than Black youth (15.47 years as compared to 15.53 years). See Table 1a for more details.

20
Similarly, Unknown youth have rates that are very similar to Asian youth, with the exception of disposition outcome. Unlike Asian youth, Unknown youth are slightly more likely than White youth to receive standard probation. Although population data for Unknown youth were not available for the state of Arizona, it appears that both Asian and Unknown youth are less likely to enter the system than White youth. Once there, they appear to be treated similarly to or more favorably than White youth at many decision points.
Limitations There were several limitations associated with the analysis performed for this report card. First, the analysis was limited to juveniles who have been formally processed through the juvenile justice system. It does not include those who were handled informally through school, law enforcement, or unknown mechanisms that did not result in a referral. If data were available to include these juveniles in the analysis, it would provide a more detailed understanding of racial and ethnic disparities. Second, although RRIs present a better gauge of disparity than percentages, they are limited in that they do not account for factors which could also be contributing to outcomes. Most

21
importantly, the analysis performed here does not account for other legal and extralegal factors that may contribute to disparity. Namely, legally relevant factors such as prior criminal history and offense severity could explain some of the differences in representation. Additionally, other factors such as age and gender, as well as the intersection of age, gender, and minority status, may be key to understanding why disparity exists between groups.
Third, there are several limitations surrounding the depth of information regarding race and ethnicity. While this report presents information on five broader racial and ethnic groups, it should be noted that each of these groups may have significant within group differences, based on factors such as country of origin, immigration status, and the ability of individuals to be both multi-racial and multi-cultural. This limitation may be especially important for understanding patterns for those who are Latinx – as juveniles who are both Black and Latinx may experience different outcomes than those who are White and Latinx. The same may be said of those who are categorized as Unknown in this report. Finally, this report examines juveniles from the entire state of Arizona. It is likely that practices in each of the 15 counties may lead to different outcomes for juveniles based on the accepted practices of that county. In a similar vein, the way in which data is recorded and entered into JOLTSaz may vary from county to county. While the authors of this report have done their best to ensure uniformity across the information presented, it is likely that some error exists. This is a limitation of all studies using admirative data, and we do not believe that it has a substantive impact on the findings in this report.
System Improvements Since the previous report card, there have been several positive changes and encouraging programs implemented throughout the state aimed at reducing racial and ethnic disparities. Some examples include implementing a statewide, validated, assessment tool which guides decisions to detain juveniles. Through the Juvenile Justice System Improvement Project (JJSIP), evidence-based practices have been implemented and impact disproportionate minority contact in a positive way.
JJSIP includes the AZYAS, Recommendation Matrix, and the Correctional Program Checklist (CPC). Since the last report card, the AZYAS, has been revalidated using Arizona data which has resulted in all stakeholders taking a closer look at the appropriate levels of supervision and interventions based on a juvenile’s risk level. In concert with the AZYAS, the Recommendation Matrix provides a tool for probation officers to make data driven, disposition recommendations regardless of race, gender and ethnicity. Finally, the CPC evaluates the quality of program services available to all juveniles equally.
In recent years, there has been stronger collaboration with other agencies, such as the Department of Child Safety, to reduce the number of youths with dual system involvement and to address the unique needs of those who cross over to/from delinquency to dependency. In order to ensure that all tools and initiatives are implemented with fidelity, intensive training and awareness programs have been developed and delivered to all stakeholders.
The Kids at Hope philosophy permeates statewide and is evident with the downsizing of detention space and the repurposing into HOPE Centers. These Centers serve youth whether in the system or at risk. This philosophy is inclusive and believes that our youth are capable of success without exception!

22
Appendix
Table 1. Arizona Population and Referrals, CY 2016, 2017, and 2018 Population Referrals Female Male
N % N % RRI N % N % White
2016 391,027 42.04% 12,215 3.12% 1.0 4,050 33.16% 8,164 66.84% 2017 388,963 41.64% 11,941 3.07% 1.0 3,966 33.21% 7,975 66.79% 2018 385,985 41.26% 10,822 2.80% 1.0 3,548 32.79% 7,274 67.21% Total 1,165,975 41.65% 34,978 3.00% 1.0 11,564 33.06% 23,413 66.94% Average 388,658 41.65% 11,659 3.00% 1.0 3,855 33.06% 7,804 66.94%
Black 2016 52,522 5.65% 3,993 7.60% 2.4 1,161 29.08% 2,828 70.82% 2017 53,759 5.75% 3,974 7.39% 2.4 1,054 26.52% 2,920 73.48% 2018 55,032 5.88% 3,700 6.72% 2.4 1,079 29.16% 2,619 70.78% Total 161,313 5.76% 11,667 7.23% 2.4 3,294 28.23% 8,367 71.72% Average 53,771 5.76% 3,889 7.23% 2.4 1,098 28.23% 2,789 71.72%
Latinx 2016 406,927 43.75% 11,823 2.91% 0.9 3,578 30.26% 8,245 69.74% 2017 410,994 43.99% 11,552 2.81% 0.9 3,366 29.14% 8,186 70.86% 2018 413,191 44.17% 10,012 2.42% 0.9 3,020 30.16% 6,991 69.83% Total 1,231,112 43.97% 33,387 2.71% 0.9 9,964 29.84% 23,422 70.15% Average 410,371 43.97% 11,129 2.71% 0.9 3,321 29.84% 7,807 70.15%
Indigenous 2016 47,817 5.14% 1,998 4.18% 1.3 666 33.33% 1,332 66.67% 2017 47,930 5.13% 1,704 3.56% 1.2 545 31.98% 1,159 68.02% 2018 48,094 5.14% 1,682 3.50% 1.2 553 32.88% 1,129 67.12% Total 143,841 5.14% 5,384 3.74% 1.2 1,764 32.76% 3,620 67.24% Average 47,947 5.14% 1,795 3.74% 1.2 588 32.76% 1,207 67.24%
Asian 2016 31,798 3.42% 227 0.71% 0.2 69 30.40% 158 69.60% 2017 32,557 3.49% 220 0.68% 0.2 73 33.18% 147 66.82% 2018 33,150 3.54% 184 0.56% 0.2 50 27.17% 134 72.83% Total 97,505 3.48% 631 0.65% 0.2 192 30.43% 439 69.57% Average 32,502 3.48% 210 0.65% 0.2 64 30.43% 146 69.57%
Unknown 2016 - - 429 - - 144 33.57% 285 66.43% 2017 - - 455 - - 161 35.38% 294 64.62% 2018 - - 435 - - 130 29.89% 304 69.89% Total - - 1,319 - - 435 32.98% 883 66.94% Average - - 440 - - 145 32.98% 294 66.94%
Overall Total 2016 930,091 33.22% 30,685 3.30% - 9,668 31.51% 21,012 68.48% 2017 934,203 33.37% 29,846 3.19% - 9,165 30.71% 20,681 69.29% 2018 935,452 33.41% 26,835 2.87% - 8,380 31.23% 18,451 68.76% Total 2,799,746 100.00% 87,366 3.12% - 27,213 31.15% 60,144 68.84% Average 933,249 33.33% 29,122 3.12% - 9,071 31.15% 20,048 68.84%

23
Table 1a. Average Age of Juveniles Referred
White 15.69
Black 15.53
Latinx 15.47
Indigenous 15.34
Asian 15.69
Unknown 15.69
Population Average
15.56

24
Table 2. Detention Outcomes, CY 2016, 2017, and 2018 Referrals Not Brought to Detention Total Brought to
Detention Screened & Released Screened & Detained
N N % RRI N % RRI N % RRI N % RRI White
2016 12,204 10,574 86.64% 1.0 1,630 13.36% 1.0 353 2.89% 1.0 1,277 10.46% 1.0 2017 11,915 10,427 87.51% 1.0 1,488 12.49% 1.0 301 2.53% 1.0 1,187 9.96% 1.0 2018 10,810 9,438 87.31% 1.0 1,372 12.69% 1.0 318 2.94% 1.0 1,054 9.75% 1.0 Total 34,929 30,439 87.15% 1.0 4,490 12.85% 1.0 972 2.78% 1.0 3,518 10.07% 1.0 Average 11,643 10,146 87.15% 1.0 1,497 12.85% 1.0 324 2.78% 1.0 1,173 10.07% 1.0
Black 2016 3,977 3,405 85.62% 1.0 572 14.38% 1.1 113 2.84% 1.0 459 11.54% 1.1 2017 3,958 3,319 83.86% 1.0 639 16.14% 1.3 136 3.44% 1.4 503 12.71% 1.3 2018 3,687 3,156 85.60% 1.0 531 14.40% 1.1 89 2.41% 0.8 442 11.99% 1.2 Total 11,622 9,880 85.01% 1.0 1,742 14.99% 1.2 338 2.91% 1.0 1,404 12.08% 1.2 Average 3,874 3,293 85.01% 1.0 581 14.99% 1.2 113 2.91% 1.0 468 12.08% 1.2
Latinx 2016 11,777 9,827 83.44% 1.0 1,950 16.56% 1.2 391 3.32% 1.1 1,559 13.24% 1.3 2017 11,506 9,709 84.38% 1.0 1,797 15.62% 1.3 384 3.34% 1.3 1,413 12.28% 1.2 2018 9,960 8,280 83.13% 1.0 1,680 16.87% 1.3 320 3.21% 1.1 1,360 13.65% 1.4 Total 33,243 27,816 83.67% 1.0 5,427 16.33% 1.3 1,095 3.29% 1.2 4,332 13.03% 1.3 Average 11,081 9,272 83.67% 1.0 1,809 16.33% 1.3 365 3.29% 1.2 1,444 13.03% 1.3
Indigenous 2016 1,996 1,631 81.71% 0.9 365 18.29% 1.4 43 2.15% 0.7 322 16.13% 1.5 2017 1,701 1,371 80.60% 0.9 330 19.40% 1.6 51 3.00% 1.2 279 16.40% 1.6 2018 1,679 1,402 83.50% 1.0 277 16.50% 1.3 35 2.08% 0.7 242 14.41% 1.5 Total 5,376 4,404 81.92% 0.9 972 18.08% 1.4 129 2.40% 0.9 843 15.68% 1.6 Average 1,792 1,468 81.92% 0.9 324 18.08% 1.4 43 2.40% 0.9 281 15.68% 1.6
Asian 2016 227 200 88.11% 1.0 27 11.89% 0.9 7 3.08% - 20 8.81% 0.8 2017 220 191 86.82% 1.0 29 13.18% 1.1 8 3.64% - 21 9.55% 1.0 2018 184 163 88.59% 1.0 21 11.41% 0.9 5 2.72% - 16 8.70% 0.9 Total 631 554 87.80% 1.0 77 12.20% 0.9 20 3.17% - 57 9.03% 0.9 Average 210 185 87.80% 1.0 26 12.20% 0.9 7 3.17% - 19 9.03% 0.9
Unknown 2016 426 392 92.02% 1.1 34 7.98% 0.6 5 1.17% - 29 6.81% 0.7 2017 453 418 92.27% 1.1 35 7.73% 0.6 7 1.55% - 28 6.18% 0.6 2018 433 404 93.30% 1.1 29 6.70% 0.5 3 0.69% - 26 6.00% 0.6 Total 1,312 1,214 92.53% 1.1 98 7.47% 0.6 15 1.14% - 83 6.33% 0.6 Average 437 405 92.53% 1.1 33 7.47% 0.6 5 1.14% - 28 6.33% 0.6
Overall Total 2016 30,607 26,029 85.04% - 4,578 14.96% - 912 2.98% - 3,666 11.98% - 2017 29,753 25,435 85.49% - 4,318 14.51% - 887 2.98% - 3,431 11.53% - 2018 26,753 22,843 85.38% - 3,910 14.62% - 770 2.88% - 3,140 11.74% - Total 87,113 74,307 85.30% - 12,806 14.70% - 2,569 2.95% - 10,237 11.75% - Average 29,038 24,769 85.30% - 4,269 14.70% - 856 2.95% - 3,412 11.75% -

25
Table 3. Court Processing Outcomes, CY 2016, 2017, and 2018 Referrals No Petition Diversion Petition Filed Adult
N N % RRI N % RRI N % RRI N % RRI White
2016 12,118 3,367 27.79% 1.0 3,899 32.18% 1.0 4,709 38.86% 1.0 143 1.18% 1.0 2017 11,812 3,177 26.90% 1.0 3,927 33.25% 1.0 4,586 38.82% 1.0 122 1.03% 1.0 2018 10,741 2,708 25.21% 1.0 3,628 33.78% 1.0 4,350 40.50% 1.0 55 0.51% 1.0 Total 34,671 9,252 26.69% 1.0 11,454 33.04% 1.0 13,645 39.36% 1.0 320 0.92% 1.0 Average 11,557 3,084 26.69% 1.0 3,818 33.04% 1.0 4,548 39.36% 1.0 107 0.92% 1.0
Black 2016 3,969 1,015 25.57% 0.9 916 23.08% 0.7 1,945 49.00% 1.3 93 2.34% 2.0 2017 3,928 978 24.90% 0.9 919 23.40% 0.7 1,934 49.24% 1.3 97 2.47% 2.4 2018 3,674 864 23.52% 0.9 847 23.05% 0.7 1,853 50.44% 1.2 110 2.99% 5.8 Total 11,571 2,857 24.69% 0.9 2,682 23.18% 0.7 5,732 49.54% 1.3 300 2.59% 2.8 Average 3,857 952 24.69% 0.9 894 23.18% 0.7 1,911 49.54% 1.3 100 2.59% 2.8
Latinx 2016 11,752 3,332 28.35% 1.0 3,012 25.63% 0.8 5,197 44.22% 1.1 211 1.80% 1.5 2017 11,474 3,077 26.82% 1.0 3,167 27.60% 0.8 5,043 43.95% 1.1 187 1.63% 1.6 2018 9,950 2,557 25.70% 1.0 2,579 25.92% 0.8 4,638 46.61% 1.2 176 1.77% 3.5 Total 33,176 8,966 27.03% 1.0 8,758 26.40% 0.8 14,878 44.85% 1.1 574 1.73% 1.9 Average 11,059 2,989 27.03% 1.0 2,919 26.40% 0.8 4,959 44.85% 1.1 191 1.73% 1.9
Indigenous 2016 1,987 579 29.14% 1.0 434 21.84% 0.7 946 47.61% 1.2 28 1.41% 1.2 2017 1,690 465 27.51% 1.0 391 23.14% 0.7 797 47.16% 1.2 37 2.19% 2.1 2018 1,668 398 23.86% 0.9 411 24.64% 0.7 851 51.02% 1.3 8 0.48% 0.9 Total 5,345 1,442 26.98% 1.0 1,236 23.12% 0.7 2,594 48.53% 1.2 73 1.37% 1.5 Average 1,782 481 26.98% 1.0 412 23.12% 0.7 865 48.53% 1.2 24 1.37% 1.5
Asian 2016 224 57 25.45% 0.9 79 35.27% 1.1 85 37.95% 1.0 3 1.34% - 2017 219 51 23.29% 0.9 86 39.27% 1.2 78 35.62% 0.9 4 1.83% - 2018 184 36 19.57% 0.8 80 43.48% 1.3 68 36.96% 0.9 0 0.00% - Total 627 144 22.97% 0.9 245 39.07% 1.2 231 36.84% 0.9 7 1.12% - Average 209 48 22.97% 0.9 82 39.07% 1.2 77 36.84% 0.9 2 1.12% -
Unknown 2016 424 155 36.56% 1.3 138 32.55% 1.0 126 29.72% 0.8 5 1.18% - 2017 449 118 26.28% 1.0 178 39.64% 1.2 147 32.74% 0.8 6 1.34% - 2018 423 107 25.30% 1.0 171 40.43% 1.2 141 33.33% 0.8 4 0.95% - Total 1,296 380 29.32% 1.1 487 37.58% 1.1 414 31.94% 0.8 15 1.16% - Average 432 127 29.32% 1.1 162 37.58% 1.1 138 31.94% 0.8 5 1.16% -
Overall Total 2016 30,474 8,505 27.91% - 8,478 27.82% - 13,008 42.69% - 483 1.58% - 2017 29,572 7,866 26.60% - 8,668 29.31% - 12,585 42.56% - 453 1.53% - 2018 26,640 6,670 25.04% - 7,716 28.96% - 11,901 44.67% - 353 1.33% - Total 86,686 23,041 26.58% - 24,862 28.68% - 37,494 43.25% - 1,289 1.49% - Average 28,896 7,680 26.58% - 8,287 28.68% - 12.498 43.25% - 430 1.49% -
26
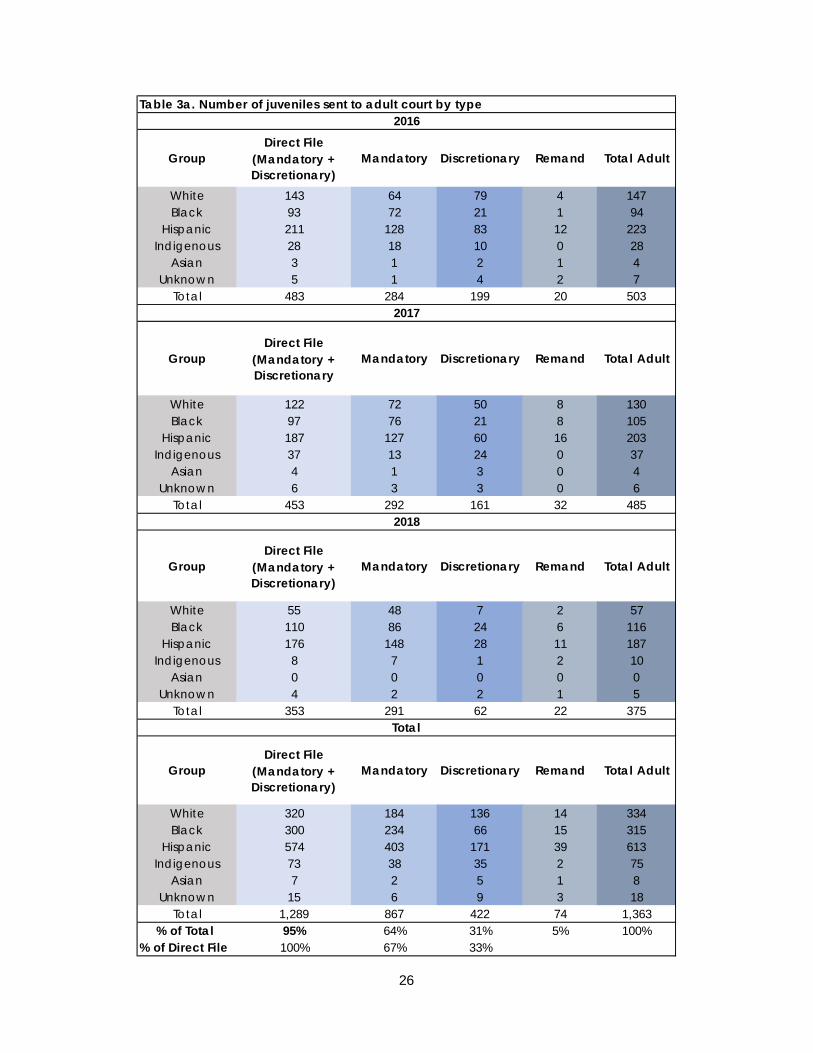
Table 3a. Number of juveniles sent to adult court by type
GroupDirect File
(Mandatory + Discretionary)
Mandatory Discretionary Remand Total Adult
White 143 64 79 4 147Black 93 72 21 1 94
Hispanic 211 128 83 12 223Indigenous 28 18 10 0 28
Asian 3 1 2 1 4Unknown 5 1 4 2 7
Total 483 284 199 20 503
GroupDirect File
(Mandatory + Discretionary
Mandatory Discretionary Remand Total Adult
White 122 72 50 8 130Black 97 76 21 8 105
Hispanic 187 127 60 16 203Indigenous 37 13 24 0 37
Asian 4 1 3 0 4Unknown 6 3 3 0 6
Total 453 292 161 32 485
GroupDirect File
(Mandatory + Discretionary)
Mandatory Discretionary Remand Total Adult
White 55 48 7 2 57Black 110 86 24 6 116
Hispanic 176 148 28 11 187Indigenous 8 7 1 2 10
Asian 0 0 0 0 0Unknown 4 2 2 1 5
Total 353 291 62 22 375
GroupDirect File
(Mandatory + Discretionary)
Mandatory Discretionary Remand Total Adult
White 320 184 136 14 334Black 300 234 66 15 315
Hispanic 574 403 171 39 613Indigenous 73 38 35 2 75
Asian 7 2 5 1 8Unknown 15 6 9 3 18
Total 1,289 867 422 74 1,363% of Total 95% 64% 31% 5% 100%
% of Direct File 100% 67% 33%
2018
Total
2016
2017

27
Table 4. Petition Outcomes, CY 2016, 2017 and 2018 Petitions
Filed Dismissed Adjudicated Transferred
N N % RRI N % RRI N % RRI White
2016 4,638 1,413 30.47% 1.0 3,221 69.45% 1.0 4 0.09% - 2017 4,536 1,425 31.42% 1.0 3,103 68.41% 1.0 8 0.18% - 2018 4,318 1,395 32.31% 1.0 2,921 67.65% 1.0 2 0.05% - Total 13,492 4,233 31.37% 1.0 9,245 68.52% 1.0 14 0.10% - Average 4,497 1,411 31.37% 1.0 3,082 68.52% 1.0 5 0.10% -
Black 2016 1,924 719 37.37% 1.2 1,204 62.58% 0.9 1 0.05% - 2017 1,904 741 38.92% 1.2 1,155 60.66% 0.9 8 0.42% - 2018 1,817 686 37.75% 1.2 1,125 61.92% 0.9 6 0.33% - Total 5,645 2,146 38.02% 1.2 3,484 61.72% 0.9 15 0.27% - Average 1,882 715 38.02% 1.2 1,161 61.72% 0.9 5 0.27% -
Latinx 2016 5,160 1,420 27.52% 0.9 3,728 72.25% 1.0 12 0.23% - 2017 5,001 1,421 28.41% 0.9 3,564 71.27% 1.0 16 0.32% - 2018 4,587 1,221 26.62% 0.8 3,355 73.14% 1.1 11 0.24% - Total 14,748 4,062 27.54% 0.9 10,647 72.19% 1.1 39 0.26% - Average 4,916 1,354 27.54% 0.9 3,549 72.19% 1.1 13 0.26% -
Indigenous 2016 936 322 34.40% 1.1 614 65.60% 0.9 0 0.00% - 2017 780 249 31.92% 1.0 531 68.08% 1.0 0 0.00% - 2018 836 321 38.40% 1.2 513 61.36% 0.9 2 0.24% - Total 2,552 892 34.95% 1.1 1,658 64.97% 0.9 2 0.08% - Average 851 297 34.95% 1.1 553 64.97% 0.9 1 0.08% -
Asian 2016 85 21 24.71% 0.8 63 74.12% 1.1 1 1.18% - 2017 77 18 23.38% 0.7 59 76.62% 1.1 0 0.00% - 2018 67 19 28.36% 0.9 48 71.64% 1.1 0 0.00% - Total 229 58 25.33% 0.8 170 74.24% 1.1 1 0.44% - Average 76 19 25.33% 0.8 57 74.24% 1.1 0 0.44% -
Unknown 2016 122 39 31.97% 1.1 81 66.39% 1.0 2 1.64% - 2017 144 58 40.28% 1.3 86 59.72% 0.9 0 0.00% - 2018 138 34 24.64% 0.8 103 74.64% 1.1 1 0.72% - Total 404 131 32.43% 1.0 270 66.83% 1.0 3 0.74% - Average 135 44 32.43% 1.0 90 66.83% 1.0 1 0.74% -
Overall Total 2016 12,865 3,934 30.58% - 8,911 69.27% - 20 0.16% - 2017 12,442 3,912 31.44% - 8,498 68.30% - 32 0.26% - 2018 11,763 3,676 31.25% - 8,065 68.56% - 22 0.19% - Total 37,070 11,522 31.08% - 25,474 68.72% - 74 0.20% - Average 12,357 3,841 31.08% - 8,491 68.72% - 25 0.20% -

28
Table 5. Disposition Decisions, CY 2016, 2017, and 2018 Adjudicated Penalty Only Probation: Standard Probation: JIPS ADJC N N % RRI N % RRI N % RR
I N % RRI
White 2016 3,200 194 6.06% 1.0 2,410 75.31% 1.0 507 15.84% 1.0 89 2.78% 1.0 2017 3,073 177 5.76% 1.0 2,396 77.97% 1.0 412 13.41% 1.0 88 2.86% 1.0 2018 2,910 143 4.91% 1.0 2,238 76.91% 1.0 439 15.09% 1.0 90 3.09% 1.0 Total 9,183 514 5.60% 1.0 7,044 76.71% 1.0 1,358 14.79% 1.0 267 2.91% 1.0 Average 3,061 171 5.60% 1.0 2,348 76.71% 1.0 453 14.79% 1.0 89 2.91% 1.0
Black 2016 1,197 121 10.11% 1.7 889 74.27% 1.0 134 11.19% 0.7 53 4.43% 1.6 2017 1,150 93 8.09% 1.4 846 73.57% 0.9 135 11.74% 0.9 76 6.61% 2.3 2016 1,115 68 6.10% 1.2 847 75.96% 1.0 98 8.79% 1.7 102 9.15% 3.0 Total 3,462 282 8.15% 1.5 2,582 74.58% 1.0 367 10.60% 0.7 231 6.67% 2.3 Average 1,154 94 8.15% 1.5 861 74.58% 1.0 122 10.60% 0.7 77 6.67% 2.3
Latinx 2016 3,714 314 8.45% 1.4 2,482 66.83% 0.9 774 20.84% 1.3 144 3.88% 1.4 2017 3,543 286 8.07% 1.4 2,379 67.15% 0.9 725 20.46% 1.5 153 4.32% 1.5 2018 3,339 185 5.54% 1.1 2,297 68.79% 0.9 692 20.72% 1.0 165 4.94% 1.6 Total 10,596 785 7.41% 1.3 7,158 67.55% 0.9 2,191 20.68% 1.4 462 4.36% 1.5 Average 3,532 262 7.41% 1.3 2,386 67.55% 0.9 730 20.68% 1.4 154 4.36% 1.5
Indigenous 2016 609 50 8.21% 1.4 459 75.37% 1.0 89 14.61% 0.9 11 1.81% 0.6 2017 525 25 4.76% 0.8 358 68.19% 0.9 125 23.81% 1.8 17 3.24% 1.1 2018 510 17 3.33% 0.7 355 69.61% 0.9 117 22.94% 2.4 21 4.12% 1.3 Total 1,644 92 5.60% 1.0 1,172 71.29% 0.9 331 20.13% 1.4 49 2.98% 1.0 Average 548 31 5.60% 1.0 391 71.29% 0.9 110 20.13% 1.4 16 2.98% 1.0
Asian 2016 62 8 12.90% - 39 62.90% 0.8 7 11.29% - 8 12.90% - 2017 59 8 13.56% - 40 67.80% 0.9 8 13.56% - 3 5.08% - 2018 48 3 6.25% - 33 68.75% 0.9 10 20.83% - 2 4.17% - Total 169 19 11.24% - 112 66.27% 0.9 25 14.79% - 13 7.69% - Average 56 6 11.24% - 37 66.27% 0.9 8 14.79% - 4 7.69% -
Unknown 2016 79 6 7.59% - 62 78.48% 1.0 11 13.92% 0.9 0 0.00% - 2017 86 5 5.81% - 67 77.91% 1.0 13 15.12% 1.1 1 1.16% - 2018 94 2 2.13% - 81 86.17% 1.1 9 9.57% 0.6 2 2.13% - Total 259 13 5.02% - 210 81.08% 1.1 33 12.74% 0.9 3 1.16% - Average 86 4 5.02% - 70 81.08% 1.1 11 12.74% 0.9 1 1.16% -
Overall Total 2016 8,861 693 7.82% - 6,341 71.56% - 1,522 17.18% - 305 3.44% - 2017 8,436 594 7.04% - 6,086 72.14% - 1,418 16.81% - 338 4.01% - 2018 8,016 418 5.21% - 5,851 72.99% - 1,365 17.03% - 382 4.77% - Total 25,313 1,705 6.74% - 18,278 72.21% - 4,305 17.01% - 1,025 4.05% - Average 8,438 568 6.74% - 6,093 72.21% - 1,435 17.01% - 342 4.05% -

29
Glossary of Juvenile Justice Terms
Adjudication: The proceeding in which the juvenile is found to be delinquent. In some respects, an “adjudication” for a delinquent offense is the juvenile court’s equivalent of a “criminal conviction” in adult court.
Arizona Department of Juvenile Corrections (ADJC): The ADJC is operated by the executive branch and is the juvenile counterpart of the Department of Corrections. ADJC operates and facilitates programs primarily aimed at more serious juvenile offenders committed to their care and custody by the juvenile courts. ADJC operates secure correctional facilities, community-based after care programs, and juvenile parole.
Delinquent Juvenile: A delinquent juvenile is a juvenile who commits an illegal offense. If the same offense had been committed by an adult, the offense would be a criminal act.
Detention: Juvenile detention is defined as the temporary confinement of a juvenile in a physically restricting facility. Juveniles are typically held in detention pending court hearings for purposes of public safety, their own protection, or as a consequence for misbehavior. This report is concerned with detention as a result of a referral and not as a consequence.
Disposition: Disposition refers to the process by which the juvenile court judge decides the best court action for the juvenile. It is comparable to “sentencing” in the adult system.
Direct Filed in Adult Court: A.R.S. §13-501 mandates that the “county attorney shall bring criminal prosecution against a juvenile in the same manner as an adult if the juvenile is 15, 16, or 17 years of age and is accused of any of the following offenses”: first degree murder; second degree murder; forcible sexual assault; armed robbery; any unknown violent offenses defined as aggravated assault, aggravated assault with a deadly weapon, drive by shooting, and discharging a firearm at a structure; a felony offense committed by a juvenile who has two prior and separate adjudications; and any offense joined to the unknown offenses. The county attorney also has statutorily defined discretion for direct filing.
Diversion: Diversion is a process by which formal court action (prosecution) is averted. The diversion process is an opportunity for youth to admit their misdeeds and to accept the consequences without going through a formal adjudication and disposition process. By statute, the county attorney has sole discretion to divert prosecution for juveniles accused of committing any incorrigible or delinquent offense.
Juvenile Intensive Probation Supervision (JIPS): Arizona Revised Statutes (A.R.S. §8-351) defines JIPS as “a program … of highly structured and closely supervised juvenile probation…which emphasizes surveillance, treatment, work, education and home detention.” A primary purpose of JIPS is to reduce the commitments to the ADJC and unknown institutional or out-of-home placements. Statute requires that all juveniles adjudicated for a second felony offense must be placed on JIPS, committed to ADJC, or sent to adult court.
Non-Adjudication: Includes cases where the petition is filed but the case may be dismissed or the juvenile turns 18 or is transferred to an unknown jurisdiction or absconds.
No Petition Filed: Includes judicially adjusted complaints (typically juveniles assigned a consequence), absconders, complaints where there is insufficient evidence to continue, victim refusals to prosecute, and unknown reasons a petition might not be filed.

30
Penalty Only: A disposition involving only fines, fees, restitution, and/or community work service.
Petition: A “petition” is a legal document filed in the juvenile court alleging that a juvenile is a delinquent, incorrigible, or a dependent child and requesting that the court assume jurisdiction over the youth. The petition initiates the formal court hearing process of the juvenile court. The county attorney, who determines what charges to bring against the juvenile, prepares the delinquent or incorrigibility petition.
Referral: Referral can be made by police, parents, school officials, probation officers or unknown agencies or individuals requesting that the juvenile court assume jurisdiction over the juvenile’s conduct. Referrals can be “paper referrals” issued as citations or police reports or “physical referrals” as in an actual arrest and custody by law enforcement. Juveniles may have multiple referrals during any given year, or over an extended period of time, between the ages of 8-17. Multiple referrals typically signal high risk, even when the referrals are for numerous, incorrigible, or relatively minor offenses.
Standard Probation: A program for the supervision of juveniles placed on probation by the court. These juveniles are under the care and control of the court and are supervised by probation officers.
Transfer to Adult Court: Adult court has been defined in statute as the appropriate justice court, municipal court or criminal division of Superior Court with jurisdiction to hear offenses committed by juveniles. Statute specifies that juveniles who commit certain offenses, are chronic felony offenders, or have historical prior convictions, must be prosecuted in the adult court and if convicted, are subject to adult sentencing laws.

31
References
National Center for Juvenile Justice. (n.d.a) Easy Access to Juvenile Populations: 1990-2019 [Population Calculator]. Retrieved March 16, 2021 from https://www.ojjdp.gov/ojstatbb/ezapop/asp/profile_selection.asp
National Center for Juvenile Justice. (n.d.b). Data Source for Population Estimates. https://www.ojjdp.gov/ojstatbb/ezapop/asp/profile_selection.asp
Office of Juvenile Justice and Delinquency Prevention (OJJDP). (2009). Disproportionate Minority Contact Technical Assistance Manual. Fourth Edition. Disproportionate Minority Contact Technical Assistance Manual, 4th Edition (ncjj.org)


![[Williams] Youth and Minority Unemployment](https://img.dokumen.tips/doc/110x75/577cd1501a28ab9e7894205d/williams-youth-and-minority-unemployment.jpg)

