Embed Size (px)
Citation preview

Epidemiology of HIV and AIDSin the
Riverside/San Bernardino, Transitional Grant Area (TGA)
Compiled by: Riverside County Community Health Agency
Department of Public HealthEpidemiology and Program Evaluation Branch
With Data and Tables Provided by: San Bernardino Department of Public Health,
HIV and STD Surveillance Program
2007

Data Sources
Unless otherwise noted, all HIV/AIDS statistics come from HIV and AIDS cases reported to Riverside County or San Bernardino County Departments of Public Health as of December 31, 2006.

Inland Empire Demographic Profile
• The 4th and 5th most populous counties, combined population exceeds four million.
• Among the fastest growing counties in California.
• Metropolitan area fifth-fastest growing in nation, 14th largest nationwide.
• Area larger than the states of Connecticut, Delaware, Massachusetts, and New Jersey combined
• Increasing Hispanic/Latino population– Potential language barriers

AIDS Surveillance Summary
Riverside/San Bernardino CA,
TGACalifornia 1 United
States 2
Cumulative Cases 8,738 143,946 988,376
Cumulative Deaths 4,181 82,989 550,394
Living Cases 4,557 60,957 437,982Cumulative Case-fatality rate
48% 58% 56%
1 California Office of AIDS. AIDS Surveillance Report for California, December 31, 2006.
2 Centers for Disease Control and Prevention. HIV/AIDS Surveillance Report 2005

Names-based HIV Reporting
• Federal HIV/AIDS funding cuts to states without reliable HIV tracking systems.
• California Senate Bill 699 allowing name-based reporting signed April 2006.
• Names-based reporting will hopefully improve access to early interventions.
• 3,255 HIV positive cases reported in the TGA, with 98% living.
7/2002 – 3/2006: “No Name” reporting
4/2006 – : “Name” reporting (501 cases)

Profile of People Living with HIV/AIDS:Riverside/San Bernardino, California Transitional Grant Area
Gender, Race/Ethnicity, Age Group, and Mode of Transmission

Proportion of the Population, Proportion of Prevalent AIDS Cases, Proportion of Prevalent HIV Cases by Race/Ethnicity
0%
10%
20%
30%
40%
50%
60%
70%
80%
White Non-Hispanic
Hispanic/Latino AfricanAmerican
Asian/Pac.Islanders
NativeAm./Alaskan
Other/Multi-Race
Perc
ent
of Tota
l Population
Living AIDS Cases
Living HIV Cases

Prevalence Rate by Race/Ethnicity
0
50
100
150
200
250
White Non-Hispanic
Hispanic/ Latino AfricanAmerican
Asian/ Pac.Islanders
NativeAm./ Alaskan
Other/ Multi-Race
AIDS
HIV
N= 33
N= 713
N= 2,666
N= 1,082
N= 57
N= 6
Rate per100,000

TGA Medi-Cal (HIV) and ADAP Users by Race/Ethnicity, Fiscal Year 2004/2005
Unknown2%Other
5%
White63%Black
10%
Hispanic20%
ADAP N= 1,714
Other2% Unknown
13%
Hispanic17%
White50%
Black18%
Medi-Cal N=2,935

Proportion of Persons Living With HIV/AIDS by Gender
TGA AIDS Prevalence
TGA HIV Prevalence
12%
88%
Male
Female
84%
16%Male
Female

Proportion of Persons Living With HIV/AIDS by Age Group
TGA AIDS Prevalence
TGA HIV Prevalence
25%
70%
1% 4%
<1313-2425-4445+
1% 10%
25%
64%
<1313-2425-4445+

Proportion of Persons Living With HIV/AIDS by Mode of Transmission
TGA AIDS PrevalenceTGA HIV Prevalence
62%13%
9%
9%2% 5%
MSMIDUMSM/ IDUHeterosexualOtherN/ R
62%9%
5%
11%
2%11%
MSMIDUMSM/ IDUHeterosexualOtherN/ R

Epidemiology of HIV/AIDS:Riverside/San Bernardino, California Transitional Grant Area
Incidence, Prevalence, Evolving Trends, and Forecast
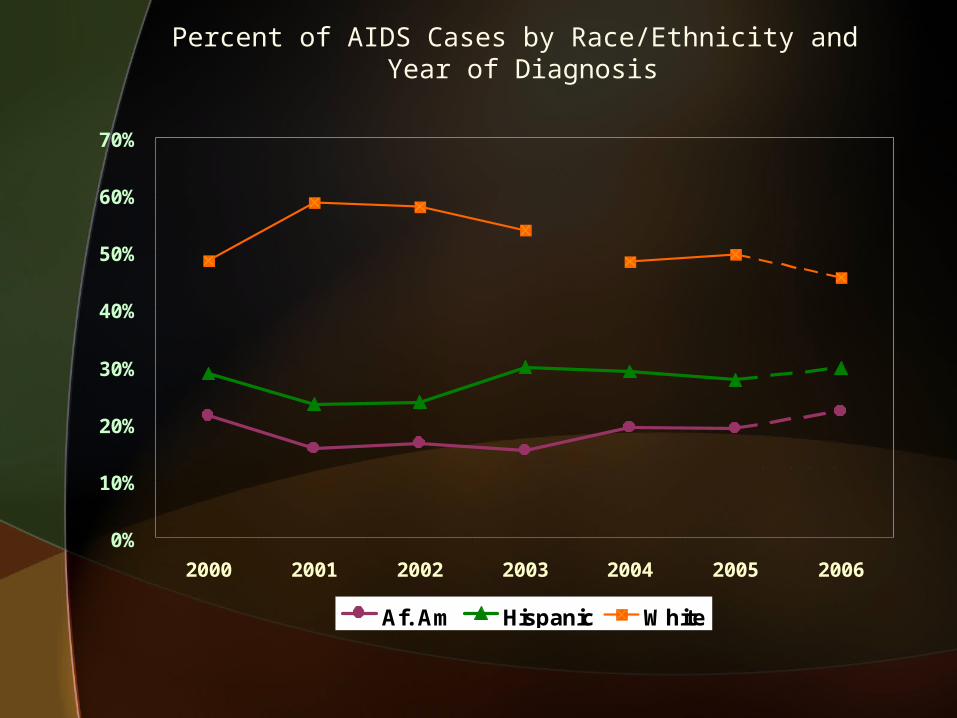
Percent of AIDS Cases by Race/Ethnicity and Year of Diagnosis
0%
10%
20%
30%
40%
50%
60%
70%
2000 2001 2002 2003 2004 2005 2006
Af. Am Hispanic White
Provisional

AIDS Incidence Rates by Race/Ethnicity and AIDS Incidence Rates by Race/Ethnicity and Year of DiagnosisYear of Diagnosis
0
5
10
15
20
25
30
2000 2001 2002 2003 2004 2005 2006
Af.Am Hispanic White
Provisional
Rate per100,000

Diagnosed AIDS Cases by Year2010 Projection
50
150
250
350
450
550
650
750
19931994
19951996
19971998
19992000
20012002
20032004
20052006
20072008
20092010
Year of Diagnosis
Nu
mb
er o
f In
div
idu
als
Dia
gn
ose
d w
ith
AID
S
200
Transitional Grant Area
Riverside
San Bernardino
R.C.
S.B.
200

Epidemiology of HIV/AIDS:Riverside/San Bernardino, California Transitional Grant Area
The Components: Profiles By County and Service Area

AIDS Prevalence by EMA Service Area of Residence
51.463.2
98.280.2
42.7
437.5
0
50
100
150
200
250
300
350
400
450
RC West RC Mid RC East SB West SB East SB Desert
Rate per100,000

Living AIDS Cases by Race/Ethnicity
0
50
100
150
200
250
300
White Af Amer/Black Hispanic Other/Unknown
Pre
va
len
ce
pe
r 1
00
,00
0 P
op
ula
tio
n
Riverside County San Bernardino County
N=267N=446
N=535N=547N=59
N=37
N=2,054
N=612

HIV Testing Risk Factors: July 1, 2005 to June 30, 2006
0%
10%
20%
30%
40%
50%
60%
MSM IDU
MSM/IDU
Heterosexual
Other
NIR/U
nk
Pe
rce
nt
of
Cli
en
ts
Riverside County San Bernardino County

TGA ADAP and Medi-Cal Users (HIV) by HARS Reporting County, Fiscal Year 2004/2005
San Bernardino21%
Riverside 49%
Other So.Ca.17%
San Francisco5%
Other4%
Unknown4%
ADAP
Riverside 27%
San Bernardino19%
Other So.Ca12%
San Francisco2%
Other3%
Unknown37%
Medi-Cal
1982
1984
1986
1988
1990
1992
1994
1996
1998
2000
2002
2004
2006
HIV/AIDS Deaths
0
1000
2000
3000
4000
5000
6000
7000
8000
9000
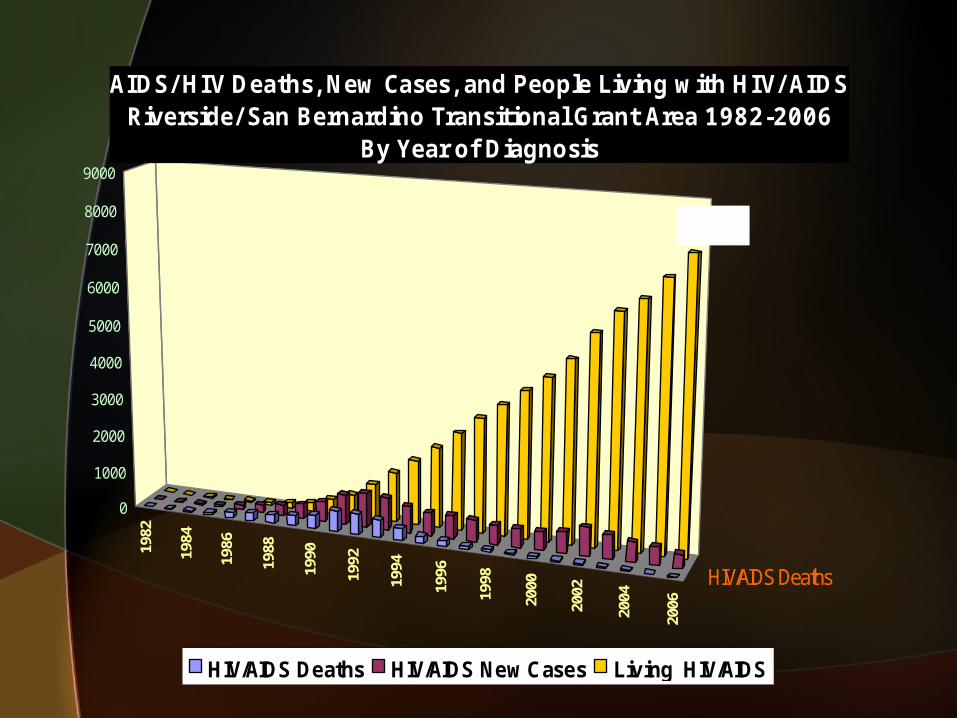
AIDS/ HIV Deaths, New Cases, and People Living with HIV/ AIDS Riverside/ San Bernardino Transitional Grant Area 1982-2006
By Year of Diagnosis
HIV/AIDS Deaths HIV/AIDS New Cases Living HIV/AIDS
7757
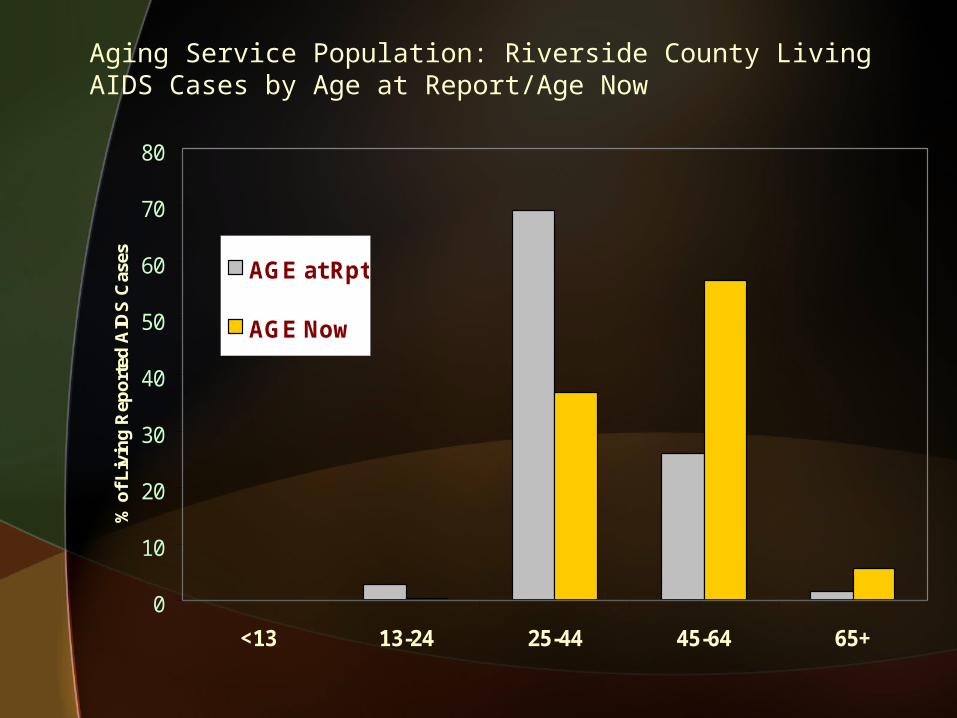
Aging Service Population: Riverside County Living AIDS Cases by Age at Report/Age Now
0
10
20
30
40
50
60
70
80
<13 13-24 25-44 45-64 65+
% o
f L
ivin
g R
epo
rted
AID
S C
ases AGE at Rpt
AGE Now

Summary
• Majority of incident and prevalent cases White, MSM
• Rates by race/ethnicity show disparity
African Americans have the highest rates
• AIDS case reporting (HARS) profile by race/ethnicity distribution similar to services utilization data.
Service use data (ADAP/Medi-Cal) show local users HARS reported in other counties
• Effective drug therapies have resulted in greater survival
Service population aging, chronic disease concerns

Acknowledgements
• Aaron Gardner
• Phill Coon
• Becky Nanyonjo
• Marshare Penny
Riverside County
San Bernardino County

Contact Information
Riverside County Department of Public HealthRiverside County Department of Public HealthEpidemiology and Program Evaluation BranchEpidemiology and Program Evaluation Branch(951) 358-5557(951) 358-5557
San Bernardino County Department of Public HealthSan Bernardino County Department of Public HealthAIDS, STD, & Reproductive Health ProgramsAIDS, STD, & Reproductive Health Programs(909) 383-3060(909) 383-3060
www.rivcohealthdata.org