Embed Size (px)
Citation preview

EPCOR Utilities Inc. Q2 2011, Page 1 of 28
EPCOR Utilities Inc. Interim Management’s Discussion and Analysis June 30, 2011 This management’s discussion and analysis (MD&A), dated August 5, 2011, should be read in conjunction with the unaudited condensed consolidated interim financial statements of EPCOR Utilities Inc. and its subsidiaries for the three and six months ended June 30, 2011 and 2010, the audited consolidated financial statements and MD&A for the year ended December 31, 2010 and the cautionary statement regarding forward-looking information on page 28. In this MD&A, any reference to “the Company”, “EPCOR”, “it”, “its”, “we”, “our” or “us”, except where otherwise noted or the context otherwise indicates, means EPCOR Utilities Inc., together with its subsidiaries. In this MD&A, Capital Power refers to Capital Power Corporation and its directly and indirectly owned subsidiaries including Capital Power L.P., except where otherwise noted or the context otherwise requires. Financial information in this MD&A is based on the unaudited condensed consolidated interim financial statements, which were prepared in accordance with International Financial Reporting Standards (IFRS), and is presented in Canadian dollars unless otherwise specified. In accordance with its terms of reference, the Audit Committee of the Company’s Board of Directors reviews the contents of the MD&A and recommends its approval by the Board of Directors. The Board of Directors has approved this MD&A.
OVERVIEW EPCOR is wholly-owned by The City of Edmonton (the City). EPCOR builds, owns and operates electrical transmission and distribution networks in Canada as well as water and wastewater treatment facilities and infrastructure in Canada and the United States (U.S.). EPCOR also provides energy and water services to residential and commercial customers. EPCOR’s electricity (collectively the Distribution and Transmission and Energy Services segments) and water (including wastewater treatment) businesses consist primarily of rate-regulated and long-term commercial contracted operations. EPCOR’s continuous improvement objective is to continue to seek out ways of maximizing the efficiency of its electricity and water operations.
EPCOR’s net income was $23 million and $32 million for the three and six months ended June 30, 2011, respectively, compared to a $10 million net loss and $73 million net income for the comparative periods in 2010. Net income from our core operations was $7 million higher for the three and the six months ended June 30, 2011, respectively, than the corresponding periods in 2010. EPCOR’s core operations performed well in the second quarter without any significant issues or disruptions to customers, although results were lower than planned. EPCOR’s equity share of income of Capital Power was higher for the current quarter and lower for the six months, respectively, than the corresponding periods in 2010. The share of income reflects changes in Capital Power’s income from the corresponding periods, as well as the impact of a reduced economic interest in Capital Power to approximately 54% (2010 – 72%) as a result of the sale of a partial interest in Capital Power in December 2010 and dilution of our interest due to a further issuance of common shares by Capital Power in March 2011.
Progress related to our 2011 capital expenditure plan continued in the second quarter. This plan is aimed towards better water management practices and improvement of existing electricity distribution and transmission infrastructure to meet the growing demand for electricity. Work on a number of significant capital projects commenced in the second quarter and will continue throughout 2011 including water distribution system renewal projects within the city of Edmonton and the Poundmaker Electricity

EPCOR Utilities Inc. Q2 2011, Page 2 of 28
Distribution Substation project in northwest Edmonton.
In June 2011, the Company sold all of the floating-rate notes received in exchange for its non-bank asset-backed commercial paper in January 2009. We received total proceeds of $48 million, which was approximately $7 million higher than the fair value of the floating-rate notes at March 31, 2011.
On May 31, 2011, the Company acquired 100% of the common shares of Chaparral City Water Company (Chaparral) from American States Water Company for total consideration of US $29 million in cash and the assumption of US $5 million in long-term debt. EPCOR control of the operations commenced on June 1, 2011. Chaparral’s net income for the second quarter of 2011 did not have a significant impact on the Water Services segment. Chaparral is a public utility company engaged principally in the purchase, production, distribution and sale of water to approximately 13,000 customers in the Town of Fountain Hills, Arizona and a small area within Scottsdale, Arizona.
CONSOLIDATED RESULTS OF OPERATIONS
Note on Comparisons
In the first quarter of 2011, EPCOR began reporting its financial results under IFRS, as mandated by the Canadian Institute of Chartered Accountants (CICA). The Company prepared its June 30, 2011 condensed consolidated interim financial statements in accordance with IFRS, which includes presenting the comparative net income results for June 30, 2010 in accordance with IFRS (see Adoption of International Financial Reporting Standards below). All comparative figures in the tables and discussion in this MD&A have been converted to IFRS.
The results of operations are discussed below.
Net Income
(Unaudited, $ millions) Three months
Six months
Net income (loss) for the periods ended June 30, 2010 $ (10) $ 73 Higher (lower) equity share of income of Capital Power 26 (40) Higher income tax expense - (8) 16 25 Higher Energy Services operating income 6 6 Floating-rate notes 5 3 Lower net financing expenses 1 3 Higher (lower) Distribution and Transmission operating income (1) 2 Lower Edmonton water utility and commercial services margins (5) (10) Other 1 3 Increase in net income from core operations 7 7 Net income for the periods ended June 30, 2011 $ 23 $ 32
Explanations of the primary period-over-period changes in net income are as follows and should be read in conjunction with the Note on Comparisons above.
• EPCOR’s equity share of income of Capital Power was higher for the three months and lower for the six months ended June 30, 2011, respectively, than the corresponding periods in 2010. The changes reflect EPCOR’s equity share of Capital Power’s change in income from the corresponding periods, as well as the impact of EPCOR’s reduced economic interest in Capital Power. In December 2010, the Company sold 9.2 million exchangeable limited partnership units of Capital Power L.P. (CPLP). In addition, in March 2011, Capital Power issued an additional 9.3 million
EPCOR Utilities Inc. Q2 2011, Page 3 of 28
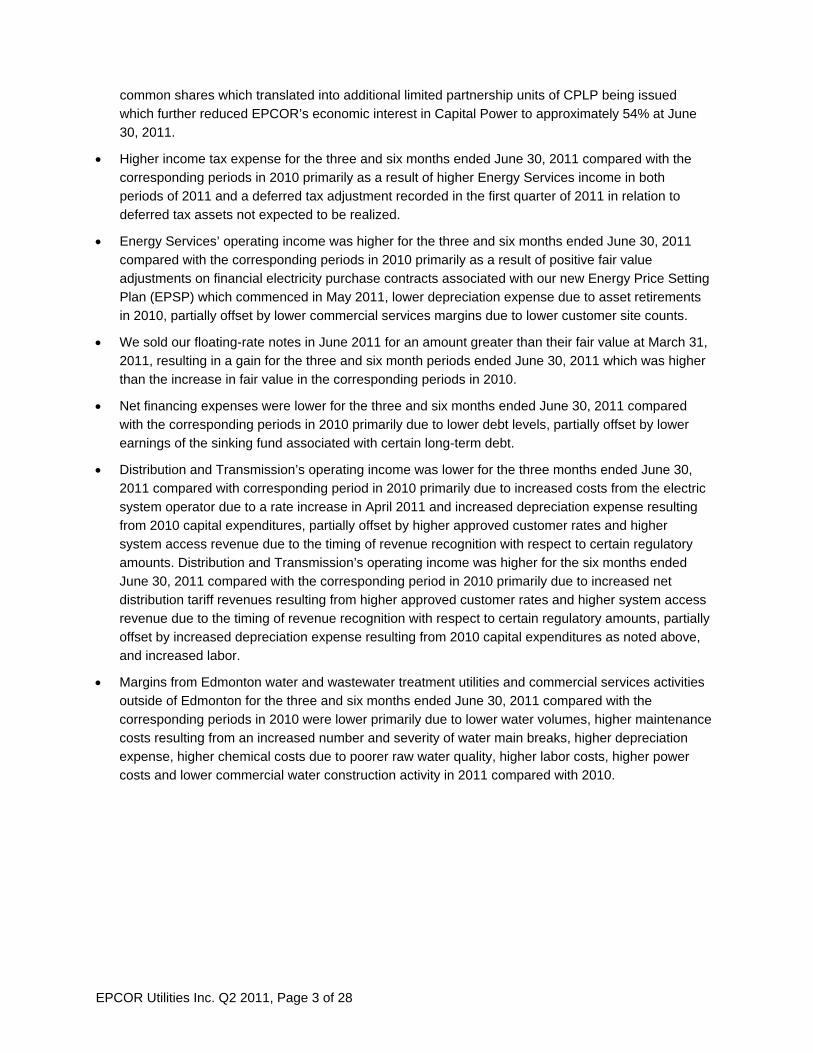
common shares which translated into additional limited partnership units of CPLP being issued which further reduced EPCOR’s economic interest in Capital Power to approximately 54% at June 30, 2011.
• Higher income tax expense for the three and six months ended June 30, 2011 compared with the corresponding periods in 2010 primarily as a result of higher Energy Services income in both periods of 2011 and a deferred tax adjustment recorded in the first quarter of 2011 in relation to deferred tax assets not expected to be realized.
• Energy Services’ operating income was higher for the three and six months ended June 30, 2011 compared with the corresponding periods in 2010 primarily as a result of positive fair value adjustments on financial electricity purchase contracts associated with our new Energy Price Setting Plan (EPSP) which commenced in May 2011, lower depreciation expense due to asset retirements in 2010, partially offset by lower commercial services margins due to lower customer site counts.
• We sold our floating-rate notes in June 2011 for an amount greater than their fair value at March 31, 2011, resulting in a gain for the three and six month periods ended June 30, 2011 which was higher than the increase in fair value in the corresponding periods in 2010.
• Net financing expenses were lower for the three and six months ended June 30, 2011 compared with the corresponding periods in 2010 primarily due to lower debt levels, partially offset by lower earnings of the sinking fund associated with certain long-term debt.
• Distribution and Transmission’s operating income was lower for the three months ended June 30, 2011 compared with corresponding period in 2010 primarily due to increased costs from the electric system operator due to a rate increase in April 2011 and increased depreciation expense resulting from 2010 capital expenditures, partially offset by higher approved customer rates and higher system access revenue due to the timing of revenue recognition with respect to certain regulatory amounts. Distribution and Transmission’s operating income was higher for the six months ended June 30, 2011 compared with the corresponding period in 2010 primarily due to increased net distribution tariff revenues resulting from higher approved customer rates and higher system access revenue due to the timing of revenue recognition with respect to certain regulatory amounts, partially offset by increased depreciation expense resulting from 2010 capital expenditures as noted above, and increased labor.
• Margins from Edmonton water and wastewater treatment utilities and commercial services activities outside of Edmonton for the three and six months ended June 30, 2011 compared with the corresponding periods in 2010 were lower primarily due to lower water volumes, higher maintenance costs resulting from an increased number and severity of water main breaks, higher depreciation expense, higher chemical costs due to poorer raw water quality, higher labor costs, higher power costs and lower commercial water construction activity in 2011 compared with 2010.
EPCOR Utilities Inc. Q2 2011, Page 4 of 28
Revenues
(Unaudited, $ millions) Three months
Six months
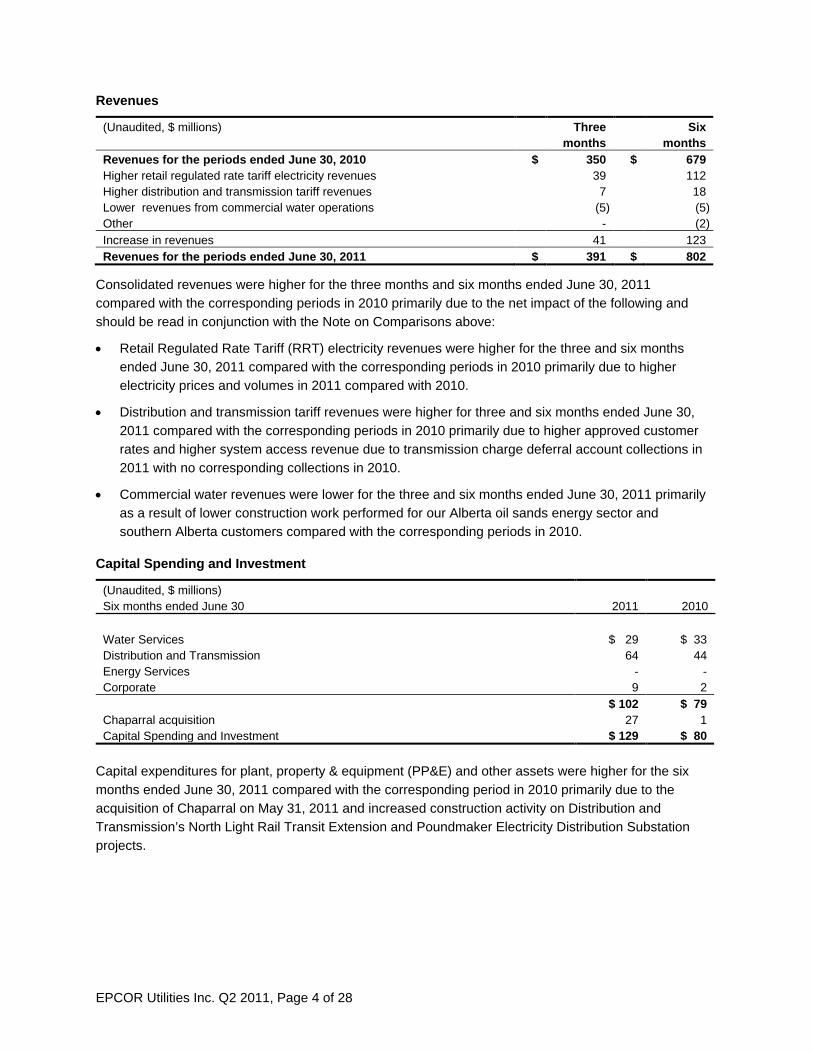
Revenues for the periods ended June 30, 2010 $ 350 $ 679 Higher retail regulated rate tariff electricity revenues 39 112 Higher distribution and transmission tariff revenues 7 18 Lower revenues from commercial water operations (5) (5) Other - (2) Increase in revenues 41 123 Revenues for the periods ended June 30, 2011 $ 391 $ 802
Consolidated revenues were higher for the three months and six months ended June 30, 2011 compared with the corresponding periods in 2010 primarily due to the net impact of the following and should be read in conjunction with the Note on Comparisons above:
• Retail Regulated Rate Tariff (RRT) electricity revenues were higher for the three and six months ended June 30, 2011 compared with the corresponding periods in 2010 primarily due to higher electricity prices and volumes in 2011 compared with 2010.
• Distribution and transmission tariff revenues were higher for three and six months ended June 30, 2011 compared with the corresponding periods in 2010 primarily due to higher approved customer rates and higher system access revenue due to transmission charge deferral account collections in 2011 with no corresponding collections in 2010.
• Commercial water revenues were lower for the three and six months ended June 30, 2011 primarily as a result of lower construction work performed for our Alberta oil sands energy sector and southern Alberta customers compared with the corresponding periods in 2010.
Capital Spending and Investment
(Unaudited, $ millions) Six months ended June 30 2011 2010 Water Services $ 29 $ 33 Distribution and Transmission 64 44 Energy Services - - Corporate 9 2 $ 102 $ 79 Chaparral acquisition 27 1 Capital Spending and Investment $ 129 $ 80
Capital expenditures for plant, property & equipment (PP&E) and other assets were higher for the six months ended June 30, 2011 compared with the corresponding period in 2010 primarily due to the acquisition of Chaparral on May 31, 2011 and increased construction activity on Distribution and Transmission’s North Light Rail Transit Extension and Poundmaker Electricity Distribution Substation projects.

EPCOR Utilities Inc. Q2 2011, Page 5 of 28
SEGMENT RESULTS
Water Services
(Unaudited, $millions)
Three months ended June 30
Six months ended June 30
2011 2010 2011 2010 Water Services results (including intersegment transactions) Revenues $ 100 $ 103 $ 180 $ 184 Expenses 82 82 153 148 Operating income $ 18 $ 21 $ 27 $ 36
Water Services’ operating income decreased $3 million and $9 million for the three and six months ended June 30, 2011, respectively, compared with the corresponding periods in 2010 due primarily to the net impact of the following items:
• Edmonton water operating income was lower for the three and six months ended June 30, 2011 compared with the corresponding periods in 2010 primarily due to lower water sales as a result of lower volumes due to higher precipitation and cooler temperatures, higher maintenance costs due to a higher number of water main breaks, higher chemical costs due to poor raw water quality during spring run-off, and labor costs in excess of amounts recovered through increased customer rates. High snowpack and extended spring run-off resulted in higher levels of silt (turbidity) in the North Saskatchewan River, requiring more chemical treatment and therefore higher chemical costs.
• Commercial services margins for the three and six months ended June 30, 2011 compared with the corresponding periods in 2010 were lower primarily due to higher staffing and power costs and lower construction activity in 2011 compared with 2010.
Distribution and Transmission
(Unaudited, $millions)
Three months ended June 30
Six months ended June 30
2011 2010 2011 2010 Distribution and Transmission results (including intersegment transactions)
Revenues $ 86 $ 74 $ 178 $ 146 Expenses 78 65 154 125 Operating income $ 8 $ 9 $ 24 $ 21
Distribution and Transmission’s operating income decreased $1 million for the three months ended June 30, 2011 compared with the corresponding period in 2010 primarily due to decreased net distribution tariff revenues resulting from increased electric system operator costs from the electric system operator due to a rate increase in April 2011, partially offset by higher approved customer rates and higher system access revenue due to the timing of revenue recognition with respect to certain regulatory accounts. Distribution and Transmission’s operating income increased $3 million for the six months ended June 30, 2011 compared with the corresponding period in 2010 primarily due to increased net distribution tariff revenues resulting from higher approved customer rates and higher system access revenue due to the timing of revenue recognition with respect to certain regulatory accounts.

EPCOR Utilities Inc. Q2 2011, Page 6 of 28
Energy Services
(Unaudited, $millions)
Three months ended June 30
Six months ended June 30
2011 2010 2011 2010 Energy Services results (including intersegment transactions) Revenues $ 242 $ 205 $ 522 $ 412 Expenses 229 198 502 399 Operating income $ 13 $ 7 $ 20 $ 13
Energy Services’ operating income increased $6 million and $7 million for the three and six months ended June 30, 2011, respectively, compared with the corresponding periods in 2010 due to the net impact of the following items:
• Energy Services’ energy margin was higher for the three and six months ended June 30, 2011, compared with the corresponding periods in 2010 primarily as a result of a positive fair value adjustment of financial contracts related to the new EPSP with no corresponding fair value adjustments in 2010.
• Commercial services margin was lower for the three and six months ended June 30, 2011, compared with the corresponding periods in 2010 as a result of lower service fees due to lower customer site counts.

EPCOR Utilities Inc. Q2 2011, Page 7 of 28
CONSOLIDATED BALANCE SHEETS
($ millions) June 30,
2011 December
31, 2010 Increase
(decrease) Explanation Cash and cash equivalents $ 39 $ 104 $ (65) Refer to liquidity and capital
resources section. Trade and other receivables
495 506 (11) Decrease primarily due to seasonal decrease in electricity consumption, partially offset by higher electricity prices.
Inventories 11 10 1 Finance lease receivables 129 130 (1) Derivative financial instrument assets
2 - 2 Increase reflects fair value adjustments relating to EPSP
Other financial assets 399 463 (64) Primarily reflects the sale of our floating-rate notes and certain current notes receivable reclassified to trade and other receivables.
Deferred tax assets 43 42 1 Investment in Capital Power 1,132 1,192 (60) Reflects EPCOR’s equity share of
other comprehensive loss and limited partnership distributions, partially offset by EPCOR’s equity share of net income.
Intangible assets 107 100 7 Reflects the acquisition of Chaparral (goodwill), partially offset by amortization of intangible assets.
Property, plant and equipment 2,484 2,385 99 Reflects capital expenditures and the acquisition of Chaparral, partially offset by depreciation expense.
Trade and other payables 235 259 (24) Decrease primarily due to lower energy purchase accruals due to lower volumes.
Other current liabilities 36 36 - Loans and borrowings (including current portion)
1,668 1,672 (4) Reflects scheduled repayment of long-term debt, partially offset by issuance of short-term debt and assumption of long-term debt from Chaparral.
Deferred revenues 565 541 24 Primarily reflect the assumption of Chaparral liabilities.
Deferred tax liabilities 1 1 - Provisions (including current portion)
42 51 (9) Primarily reflects payment of short-term incentives in April 2011.
Other non-current liabilities 17 30 (13) Primarily reflects Gold Bar asset transfer fee payment to the City in the first quarter of 2011.
Equity attributable to owners of the Company
2,277 2,342 (65) Reflects other comprehensive loss and common share dividends, partially offset by net income.
EPCOR Utilities Inc. Q2 2011, Page 8 of 28
LIQUIDITY AND CAPITAL RESOURCES
Cash inflows (outflows)
($ millions)
Three months ended June 30 Increase (decrease) Explanation 2011 2010
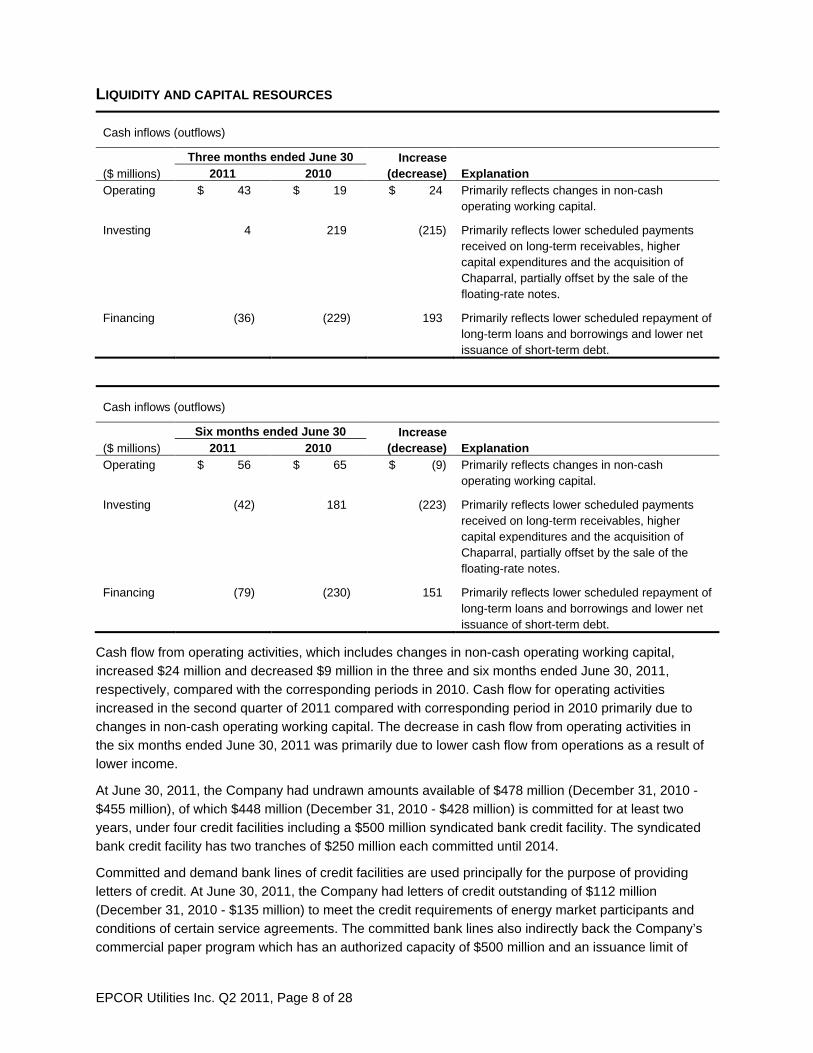
Operating $ 43 $ 19 $ 24 Primarily reflects changes in non-cash operating working capital.
Investing 4 219 (215) Primarily reflects lower scheduled payments received on long-term receivables, higher capital expenditures and the acquisition of Chaparral, partially offset by the sale of the floating-rate notes.
Financing (36) (229) 193 Primarily reflects lower scheduled repayment of long-term loans and borrowings and lower net issuance of short-term debt.
Cash inflows (outflows)
($ millions)
Six months ended June 30 Increase (decrease) Explanation 2011 2010
Operating $ 56 $ 65 $ (9) Primarily reflects changes in non-cash operating working capital.
Investing (42) 181 (223) Primarily reflects lower scheduled payments received on long-term receivables, higher capital expenditures and the acquisition of Chaparral, partially offset by the sale of the floating-rate notes.
Financing (79) (230) 151 Primarily reflects lower scheduled repayment of long-term loans and borrowings and lower net issuance of short-term debt.
Cash flow from operating activities, which includes changes in non-cash operating working capital, increased $24 million and decreased $9 million in the three and six months ended June 30, 2011, respectively, compared with the corresponding periods in 2010. Cash flow for operating activities increased in the second quarter of 2011 compared with corresponding period in 2010 primarily due to changes in non-cash operating working capital. The decrease in cash flow from operating activities in the six months ended June 30, 2011 was primarily due to lower cash flow from operations as a result of lower income.
At June 30, 2011, the Company had undrawn amounts available of $478 million (December 31, 2010 - $455 million), of which $448 million (December 31, 2010 - $428 million) is committed for at least two years, under four credit facilities including a $500 million syndicated bank credit facility. The syndicated bank credit facility has two tranches of $250 million each committed until 2014.
Committed and demand bank lines of credit facilities are used principally for the purpose of providing letters of credit. At June 30, 2011, the Company had letters of credit outstanding of $112 million (December 31, 2010 - $135 million) to meet the credit requirements of energy market participants and conditions of certain service agreements. The committed bank lines also indirectly back the Company’s commercial paper program which has an authorized capacity of $500 million and an issuance limit of

EPCOR Utilities Inc. Q2 2011, Page 9 of 28
$225 million under the committed credit facilities, of which $8 million was outstanding at June 30, 2011 (December 31, 2010 - nil).
The Company’s working capital and contractual obligations for the remainder of 2011 will be funded from operating cash flows, limited partnership distributions from Capital Power, interest received in relation to the long-term receivable from Capital Power, commercial paper issuance and the Company’s credit facilities. In addition, the Company may issue medium-term notes or sell a portion of its interest in Capital Power to fund its long-term obligations. The payments expected to be received from Capital Power in 2011 comprise a significant amount of the cash required to fund the Company’s 2011 contractual debt obligations. Should Capital Power be unable to fulfill its obligations to EPCOR or have to reduce its distributions in 2011, the Company will rely more heavily on its credit facilities or other sources of financing, such as selling a portion of its interest in Capital Power, to fund its obligations or investments.
The Company has a Canadian shelf prospectus under which it may raise up to $1 billion of debt with maturities of not less than one year. At June 30, 2011, the available amount remaining under this shelf prospectus was $1 billion. The shelf prospectus expires in January 2012.
Effects of Economic and Market Uncertainty
Canadian and U.S. economies have been slowly improving over the past couple of years; however, there is still some uncertainty regarding the likelihood of a full recovery in the near future, particularly in light of global events such as sovereign debt issues in Europe. In the first six months of 2011, the Company secured financing to fund a portion of its capital expenditures and working capital requirements at a weighted average interest rate of 1.05% per annum through the issue of commercial paper in the quarter.
If the economy were to deteriorate in the longer term, particularly in Canada and the U.S., the Company’s ability to renew credit facilities, arrange long-term financing for its capital expenditure programs and acquisitions, or refinance outstanding indebtedness when it matures could be adversely impacted. If market conditions worsen, the Company may suffer a credit rating downgrade and be unable to renew its credit facilities or access the public debt markets. We continue to believe that these circumstances have a low probability of occurring. However, we continue to monitor EPCOR’s capital programs and operating costs to minimize the risk that the Company becomes short of cash or unable to honour its obligations.
In the second quarter of 2011, the Company used cash on hand, the sale of floating-rate notes and commercial paper to fund its capital expenditures and working capital requirements. The Company plans to use cash on hand as well as commercial paper, existing credit facilities or potentially medium-term notes for its financing requirements for the balance of the year. Current and longer-term financing requirements could also be funded by a sale of a portion of the Company’s interest in Capital Power, pursuant to applicable agreements with Capital Power and as market conditions permit. Should the credit and economic environments worsen, it may adversely affect the interest rates at which we are able to borrow.
CONTRACTUAL OBLIGATIONS In January 2011, the Company entered into an agreement to acquire 100% of the stock of the Arizona- American Water Company (Arizona Water) and New Mexico-American Water Company, Inc. (New Mexico Water), both wholly-owned subsidiaries of American Water Works Company, Inc. for total

EPCOR Utilities Inc. Q2 2011, Page 10 of 28
consideration of US $470 million, including the assumption of US $10 million in debt, subject to certain

EPCOR Utilities Inc. Q2 2011, Page 11 of 28
adjustments. The transaction is subject to regulatory approvals in both states. Arizona Water is a regulated utility that provides water service to approximately 106,000 customers and wastewater services to approximately 51,000 customers primarily located in the Phoenix area. New Mexico Water provides water and wastewater services to the City of Clovis in eastern New Mexico, and in the greater Edgewood area near Albuquerque, New Mexico, serving more than 17,000 customers.
Energy Services earns a margin on electricity sales to RRT and default rate customers, a return on its deemed capital structure and a return margin on approved RRT customer service costs. The margin that Energy Services earns on RRT electricity sales is based on an EPSP approved by the Alberta Utilities Commission (AUC). The previous EPSP expired on June 30, 2011. On March 23, 2011, the AUC approved Energy Services’ new EPSP plan which took effect on July 1, 2011. In May 2011, as part of the new EPSP, Energy Services commenced managing its electricity procurement requirements on its own where they were outsourced under the previous EPSP. Under the new EPSP, Energy Services will have some exposure to fluctuating electricity spot prices. However, risk will be managed by purchasing electricity in advance for relatively short durations (about forty five days prior to the month of consumption) under a well defined purchase and risk management process set out in the EPSP.
During the second quarter of 2011, there were no other material changes to the Company’s purchase obligations, including payments for the next five years and thereafter. For further information on the Company’s contractual obligations, refer to the 2010 annual MD&A.
ADOPTION OF INTERNATIONAL FINANCIAL REPORTING STANDARDS Effective January 1, 2011, IFRS was incorporated into the CICA Handbook for publicly accountable entities. Companies with rate-regulated operations may defer the adoption of IFRS until January 1, 2012, however EPCOR chose to adopt IFRS effective January 1, 2011.
Impact on Adoption of IFRS on Financial Reporting
The conversion to IFRS resulted in differences in recognition, measurement, and disclosure of balances and transactions in the financial statements. The following tables explain how the transition from Canadian generally accepted accounting principles (GAAP) to IFRS affected the Company’s financial position and performance as well as its segments’ financial performance for the three and six months ended June 30, 2010.

EPCOR Utilities Inc. Q2 2011, Page 12 of 28
Reconciliation of equity reported under previous Canadian GAAP to equity under IFRS at June 30, 2010, being the end of the comparable period:
Previous
Canadian GAAP Measurement
adjustments Presentation adjustments IFRS
Current assets: Cash and cash equivalents $ 27 $ - $ - $ 27 Trade and other receivables1 (a) 279 (20) - 259 Inventories 12 - - 12 Deferred tax assets (b) 1 - (1) -
319 (20) (1) 298 Non-current assets:
Other assets (a, c, d) 167 (1) (165) 1 Finance lease receivables (c) - - 123 123 Other financial assets (c) 613 - 40 653 Deferred tax assets (b) 41 - 1 42 Investment in Capital Power (e) 1,488 (23) - 1,465 Intangible assets (d, f) 104 (5) 2 101 Property, plant and equipment (a, f, g, h) 1,815 (72) 519 2,262
4,228 (101) 520 4,647 Total assets $ 4,547 $ (121) $ 519 $ 4,945
Current Liabilities: Trade and other payables2 (a, i) $ 216 $ (4) $ (9) $ 203 Loans and borrowings 81 - - 81 Provisions (i) - - 9 9 Other liabilities 34 - - 34
331 (4) - 327 Non-current liabilities:
Loans and borrowings (j) 1,674 (6) - 1,668 Deferred revenues (g, h) - (15) 519 504 Provisions (a, i, k) - - 37 37 Other liabilities (i) 67 - (37) 30
1,741 (21) 519 2,239 Total liabilities 2,072 (25) 519 2,566 Equity attributable to owners of the Company:
Share capital 24 - - 24 Accumulated other
comprehensive income (loss) (e, j, l, m) (22) 30 - 8 Retained earnings (a, e, f, h, k, l, m) 2,473 (126) - 2,347
Total equity 2,475 (96) - 2,379 Total liabilities and equity $ 4,547 $ (121) $ 519 $ 4,945
1 Trade and other receivables include accounts receivable, income taxes recoverable, prepaid expenses and the current portion of long-term receivables.
2 Trade and other payables include accounts payable and accrued liabilities and income taxes payable.

EPCOR Utilities Inc. Q2 2011, Page 13 of 28
Notes to the reconciliation:
(a) IFRS does not currently contain any separate guidance relating to recognition of assets and liabilities that have arisen as a result of rate regulation. Under current IFRS standards, such items were not recognized on transition. The impact of this was to reduce trade and other receivables by $20 million, other assets by $1 million, PP&E by $2 million, trade and other payables by $4 million and non-current provisions by $2 million with a charge to retained earnings of $17 million.
(b) In accordance with IAS 12 - Income Taxes, all deferred tax balances are classified as non-current, irrespective of the underlying assets or liabilities to which they relate, or the expected reversal of the temporary difference. The effect was to reclassify $1 million from current deferred tax assets to non-current deferred tax assets.
(c) In accordance with IAS 1 - Financial Statements, financial assets should be separately presented from other assets. The effect was to reclassify $163 million from other assets of which $123 million is presented as finance lease receivables and $40 million is presented as other financial assets.
(d) In accordance with IAS 1 - Financial Statements, goodwill should be presented either on the face of the consolidated statement of financial position or as part of intangible assets. Under previous Canadian GAAP, goodwill was previously presented as part of other assets. The effect was to reclassify $2 million from other assets to intangible assets.
(e) The Company has restated its investment in Capital Power to recognize its equity share of Capital Power’s IFRS adjustments. The impact was a reduction in the investment of $23 million, an increase in accumulated other comprehensive income by $10 million and a charge to retained earnings of $33 million.
(f) The Company previously accounted for certain transactions in accordance with applicable rate regulation (regulatory accounting). As permitted previously under previous Canadian GAAP, the Company applied Financial Accounting Standards Codification Section 980 – Regulated Operations, as issued by the Financial Accounting Standards Board in the U.S. as another source of GAAP.
Under regulatory accounting, gains and losses on the disposal of the Company’s rate-regulated assets were previously deferred within PP&E or intangible assets. The Company also previously capitalized non-directly attributable overhead within PP&E and intangible assets where it was included within the Company’s rate-regulated asset base.
Under IAS 16 - Property, Plant and Equipment (IAS 16) and IAS 38 – Intangible Assets (IAS 38), assets are required to be derecognized on disposal and any associated gain or loss should be recognized in net income. Overhead may only be capitalized where it is considered to be directly attributable to the construction of the asset.
The effect of this was to reduce the net book value of PP&E by $56 million and to reduce intangible assets by $5 million with an overall reduction in retained earnings at $61 million.
(g) Although the determination of whether an arrangement contains a lease is broadly similar between previous Canadian GAAP and IFRS, previous Canadian GAAP contained more quantitative criteria in determining whether a lease is treated as capital or operating. As a result, a lease agreement which was previously determined to be an operating lease under previous Canadian GAAP was determined to be a finance lease under IAS 17 – Leases. The impact was a reduction in PP&E of $15 million which was offset by a reduction in deferred revenue of $15 million.
EPCOR Utilities Inc. Q2 2011, Page 14 of 28
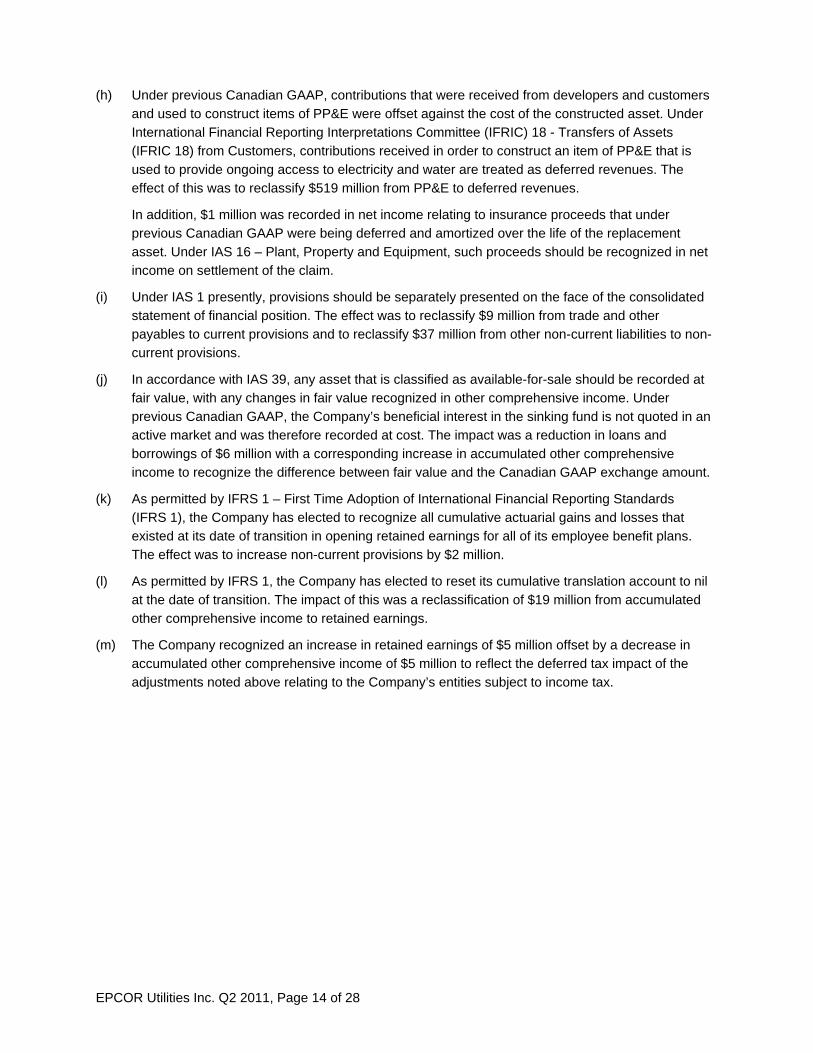
(h) Under previous Canadian GAAP, contributions that were received from developers and customers and used to construct items of PP&E were offset against the cost of the constructed asset. Under International Financial Reporting Interpretations Committee (IFRIC) 18 - Transfers of Assets (IFRIC 18) from Customers, contributions received in order to construct an item of PP&E that is used to provide ongoing access to electricity and water are treated as deferred revenues. The effect of this was to reclassify $519 million from PP&E to deferred revenues.
In addition, $1 million was recorded in net income relating to insurance proceeds that under previous Canadian GAAP were being deferred and amortized over the life of the replacement asset. Under IAS 16 – Plant, Property and Equipment, such proceeds should be recognized in net income on settlement of the claim.
(i) Under IAS 1 presently, provisions should be separately presented on the face of the consolidated statement of financial position. The effect was to reclassify $9 million from trade and other payables to current provisions and to reclassify $37 million from other non-current liabilities to non-current provisions.
(j) In accordance with IAS 39, any asset that is classified as available-for-sale should be recorded at fair value, with any changes in fair value recognized in other comprehensive income. Under previous Canadian GAAP, the Company’s beneficial interest in the sinking fund is not quoted in an active market and was therefore recorded at cost. The impact was a reduction in loans and borrowings of $6 million with a corresponding increase in accumulated other comprehensive income to recognize the difference between fair value and the Canadian GAAP exchange amount.
(k) As permitted by IFRS 1 – First Time Adoption of International Financial Reporting Standards (IFRS 1), the Company has elected to recognize all cumulative actuarial gains and losses that existed at its date of transition in opening retained earnings for all of its employee benefit plans. The effect was to increase non-current provisions by $2 million.
(l) As permitted by IFRS 1, the Company has elected to reset its cumulative translation account to nil at the date of transition. The impact of this was a reclassification of $19 million from accumulated other comprehensive income to retained earnings.
(m) The Company recognized an increase in retained earnings of $5 million offset by a decrease in accumulated other comprehensive income of $5 million to reflect the deferred tax impact of the adjustments noted above relating to the Company’s entities subject to income tax.

EPCOR Utilities Inc. Q2 2011, Page 15 of 28
Reconciliation of total comprehensive income for the three months ended June 30, 2010 reported under previous Canadian GAAP to total comprehensive income reported under IFRS, being the comparative period:
Previous
Canadian GAAP Measurement
adjustments Presentation adjustments IFRS
Continuing operations: Revenues and other income (n, o) $ 363 $ (1) $ 3 $ 365 Electricity purchases and system access fees (n) (172) (5) - (177) Operations, maintenance and administration (p) (101) - 101 - Other raw materials and operating charges (p) - - (35) (35) Staff costs and employee benefits (p) - - (56) (56) Depreciation and amortization (o, q) (22) - (3) (25) Franchise fees and property taxes (n) (15) (2) - (17) Other administrative expenses (n, p, r) - 4 (10) (6)
Operating income 53 (4) - 49 Finance expense (s) (33) 1 - (32) Equity share of income (loss) of Capital Power (t) (27) 2 - (25)
Net loss before income taxes (7) (1) - (8) Income tax expense (u) (1) (1) - (2)
Net loss for the period (8) (2) - (10) Other comprehensive income: Unrealized gain on available for sale financial assets (v) - 1 - 1
Equity share of other comprehensive income (loss) of Capital Power (t) (9) 2 - (7)
Other comprehensive income (loss) (9) 3 - (6) Total comprehensive income (loss) – all attributable to owners of the Company $ (17) $ 1 $ - $ (16)

EPCOR Utilities Inc. Q2 2011, Page 16 of 28
Reconciliation of total comprehensive income for the six months ended June 30, 2010 reported under previous Canadian GAAP to total comprehensive income reported under IFRS:
Previous
Canadian GAAP Measurement
adjustments Presentation adjustments IFRS
Continuing operations: Revenues and other income (n, o) $ 701 $ 2 $ 6 $ 709 Electricity purchases and system access fees (n) (344) (5) - (349) Operations, maintenance and administration (p) (182) - 182 - Other raw materials and operating charges (p) - - (56) (56) Staff costs and employee benefits (p) - - (108) (108) Depreciation and amortization (o, q) (45) 2 (6) (49) Franchise fees and property taxes (n) (30) (3) - (33) Other administrative expenses (n, p, r) - 2 (18) (16)
Operating income 100 (2) - 98 Finance expense (s) (67) 1 - (66) Equity share of income of Capital Power (t) 49 (4) - 45
Income before income taxes 82 (5) - 77 Income tax expense (u) (3) (1) - (4)
Net income (loss) for the period 79 (6) - 73 Other comprehensive income:
Unrealized gain on available for sale financial assets (v) - 1 - 1 Equity share of other comprehensive income (loss) of Capital Power (t) (6) 1 - (5)
Other comprehensive income (loss) (6) 2 - (4) Total comprehensive income (loss) – all
attributable to owners of the Company $ 73 $ (4) $ - $ 69
Notes to the reconciliations:
(n) As identified in note (f), the Company previously used regulatory accounting to recognize certain assets, liabilities, revenues and expenses. As a result, the timing of the Company’s recognition of certain revenues and expenses differed from IFRS, which requires that revenues and expenses are recognized as incurred. For the three months ended June 30, 2010, the impact was a decrease in revenues of $1 million, an increase in electricity purchases and system access fees of $5 million, an increase in franchise fees and property taxes of $2 million and a reduction in other administrative expenses of $5 million for an overall decrease in net income of $3 million.
For the six months ended June 30, 2010, the impact was an increase in revenues of $2 million, an increase in electricity purchases and system access fees of $5 million, an increase in franchise fees and property taxes of $3 million and a reduction in other administrative expenses of $5 million for an overall reduction in net income of nil.

EPCOR Utilities Inc. Q2 2011, Page 17 of 28
(o) Under previous Canadian GAAP, the amortization of contributions received towards the construction of PP&E used to provide ongoing access to electricity and water supply was treated as depreciation. Under IFRIC 18, such amortization is treated as revenue. The effect was to reclassify $3 million from depreciation to revenues for the three months ended June 30, 2010; and $6 million for the six months ended June 30, 2010.
(p) Under IAS 1, expenses must be presented using either a functional presentation or according to their nature. The Company has adopted presentation by nature. The effect was to reclassify salary, wages and employee benefit costs of $56 million to staff costs and employee benefits from operations, maintenance and administration for the three months ended June 30, 2010 and $108 million for the six months ended June 30, 2010. The remaining operations, maintenance and administrative costs were reclassified as either other raw material and operating charges or other administrative expenses.
(q) As identified in note (f), PP&E and intangible assets have been adjusted for the removal of non-directly attributable overhead and deferred gains and losses on derecognized assets. As a result of this, and as a result of the review of the useful lives of the components of the Company’s assets as required by IAS 16, there was a reduction in depreciation and amortization of nil for the three months ended June 30, 2010 and $2 million for the six months ended June 30, 2010.
(r) Under previous Canadian GAAP, overheads are capitalized as part of PP&E or intangible assets if they are permitted or required to be included in the Company’s rate-regulated asset base. Under IAS 16 and IAS 38, overheads may only be capitalized if they are directly attributable to the construction of PP&E or intangible assets. The effect of this was an increase to other administrative expenses of $1 million for the three months ended June 30, 2010 and $3 million for the six months ended June 30, 2010.
(s) Under previous Canadian GAAP, an allowance for funds used during construction was capitalized if it was approved or required by the regulator to be included in the Company’s rate-regulated asset base. Under IAS 23 – Borrowing Costs, there are more detailed rules on the methodology for capitalizing borrowing costs. As a result of the change in methodology, the Company recognized an increase in capitalized interest of $1 million for the three months ended June 30, 2010 and $1 million for the six months ended June 30, 2010.
(t) The Company’s income from its equity investment in Capital Power was increased by $2 million for the three months to June 30, 2010 but was reduced by $4 million for the six months ended June 30, 2010 which reflected the Company’s equity share of the adjustments recognized on transition to IFRS by Capital Power. The Company’s other comprehensive income from the investment in Capital Power was increased by $2 million for the three months ended June 30, 2010 and $1 million for the six months ended June 30, 2010.
(u) As a result of the adjustments above, the Company recognized an increase in income tax expense of $1 million for the three and six months ended June 30, 2010.
(v) As identified in note (j), the Company’s beneficial interest in the sinking fund is measured at fair value under IFRS. As a result, the Company recognized an increase in other comprehensive income of $1 million for the three and six months ended June 30, 2010.
EPCOR Utilities Inc. Q2 2011, Page 18 of 28
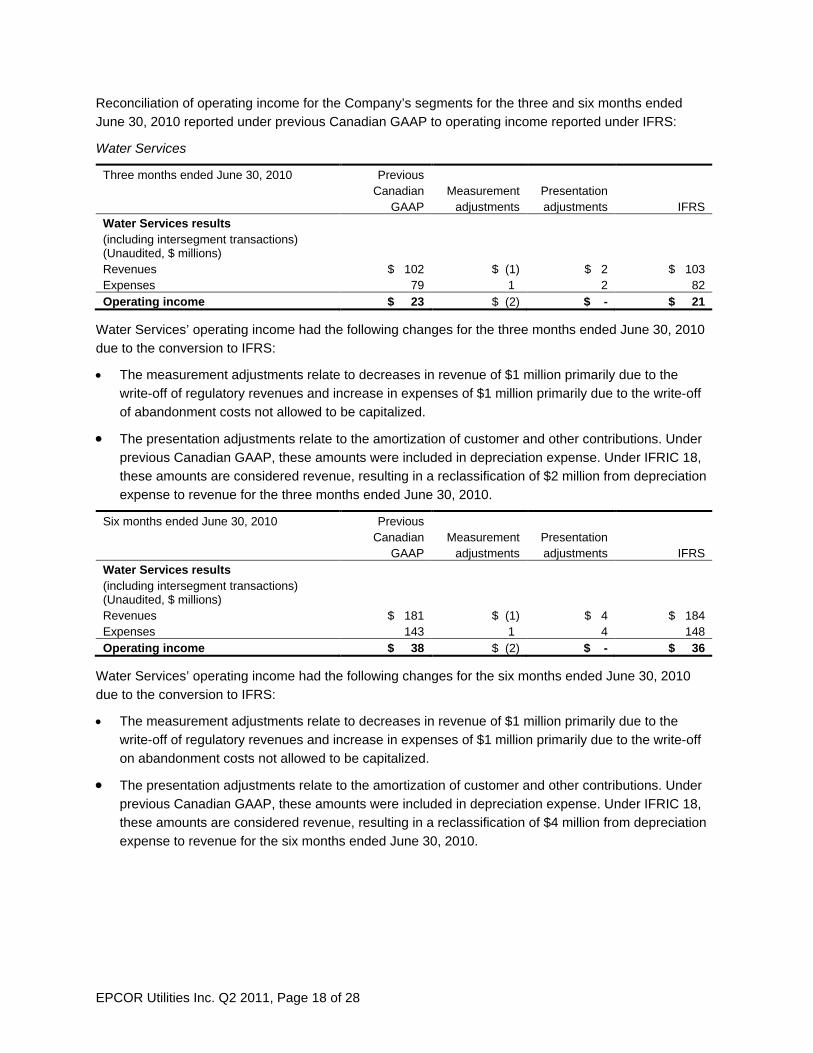
Reconciliation of operating income for the Company’s segments for the three and six months ended June 30, 2010 reported under previous Canadian GAAP to operating income reported under IFRS:
Water Services
Three months ended June 30, 2010
Previous Canadian
GAAP Measurement
adjustments Presentation adjustments IFRS
Water Services results (including intersegment transactions) (Unaudited, $ millions)
Revenues $ 102 $ (1) $ 2 $ 103 Expenses 79 1 2 82 Operating income $ 23 $ (2) $ - $ 21
Water Services’ operating income had the following changes for the three months ended June 30, 2010 due to the conversion to IFRS:
• The measurement adjustments relate to decreases in revenue of $1 million primarily due to the write-off of regulatory revenues and increase in expenses of $1 million primarily due to the write-off of abandonment costs not allowed to be capitalized.
• The presentation adjustments relate to the amortization of customer and other contributions. Under previous Canadian GAAP, these amounts were included in depreciation expense. Under IFRIC 18, these amounts are considered revenue, resulting in a reclassification of $2 million from depreciation expense to revenue for the three months ended June 30, 2010.
Six months ended June 30, 2010
Previous Canadian
GAAP Measurement
adjustments Presentation adjustments IFRS
Water Services results (including intersegment transactions) (Unaudited, $ millions)
Revenues $ 181 $ (1) $ 4 $ 184 Expenses 143 1 4 148 Operating income $ 38 $ (2) $ - $ 36
Water Services’ operating income had the following changes for the six months ended June 30, 2010 due to the conversion to IFRS:
• The measurement adjustments relate to decreases in revenue of $1 million primarily due to the write-off of regulatory revenues and increase in expenses of $1 million primarily due to the write-off on abandonment costs not allowed to be capitalized.
• The presentation adjustments relate to the amortization of customer and other contributions. Under previous Canadian GAAP, these amounts were included in depreciation expense. Under IFRIC 18, these amounts are considered revenue, resulting in a reclassification of $4 million from depreciation expense to revenue for the six months ended June 30, 2010.

EPCOR Utilities Inc. Q2 2011, Page 19 of 28
Distribution and Transmission
Three months ended June 30, 2010
Previous Canadian
GAAP Measurement
adjustments Presentation adjustments IFRS
Distribution and Transmission results (including intersegment transactions) (Unaudited, $ millions)
Revenues $ 74 $ (1) $ 1 $ 74 Expenses 64 - 1 65 Operating income $ 10 $ (1) $ - $ 9
Distribution and Transmission’s operating income had the following changes for the three months ended June 30, 2010 due to the conversion to IFRS:
• The measurement adjustments primarily relate to revenues and expenses recognized under IFRS as incurred, rather than deferred until approved by the regulator under previous Canadian GAAP.
• The presentation adjustments relate to the amortization of customer and other contributions. Under previous Canadian GAAP, these amounts were included in depreciation expense. Under IFRIC 18, these amounts are considered revenue, resulting in a reclassification of $1 million from depreciation expense to revenue for the three months ended June 30, 2010.
Six months ended June 30, 2010
Previous Canadian
GAAP Measurement
adjustments Presentation adjustments IFRS
Distribution and Transmission results (including intersegment transactions) (Unaudited, $ millions)
Revenues $ 143 $ 1 $ 2 $ 146 Expenses 121 2 2 125 Operating income $ 22 $ (1) $ - $ 21
Distribution and Transmission’s operating income had the following changes for the six months ended June 30, 2010 due to the conversion to IFRS:
• The measurement adjustments for revenues primarily relate to revenues being recognized under IFRS as realized, rather than deferred until approved by the regulator under Canadian GAAP.
• The measurement adjustments relate to expenses being recognized under IFRS as incurred, rather than deferred until approved by the regulator under previous Canadian GAAP, resulting in decreased expenses of $4 million, partially offset by the impact of componentization which decreased depreciation expense by $2 million.
• The presentation adjustments relate to the amortization of customer and other contributions. Under previous Canadian GAAP, these amounts were included in depreciation expense. Under IFRIC 18, these amounts are considered revenue, resulting in a reclassification of $2 million from depreciation expense to revenue for the six months ended June 30, 2010.

EPCOR Utilities Inc. Q2 2011, Page 20 of 28
Energy Services
Three months ended June 30, 2010 Previous Canadian
GAAP Measurement
adjustments Presentation adjustments IFRS
Energy Services results (including intersegment transactions) (Unaudited, $ millions)
Revenues $ 205 $ - $ - $ 205 Expenses 200 (2) - 198 Operating income $ 5 $ 2 $ - $ 7
Energy Services’ operating income for the three months ended June 30, 2010 was adjusted for expenses being recognized as incurred under IFRS, rather than deferred until approved by the regulator under previous Canadian GAAP.
Six months ended June 30, 2010 Previous Canadian
GAAP Measurement
adjustments Presentation adjustments IFRS
Energy Services results (including intersegment transactions) (Unaudited, $ millions)
Revenues $ 412 $ - $ - $ 412 Expenses 402 (3) - 399 Operating income $ 10 $ 3 $ - $ 13
Energy Services’ operating income for the six months ended June 30, 2010 was adjusted for expenses being recognized as incurred under IFRS, rather than deferred until approved by the regulator under previous Canadian GAAP.
Impact on Future Reporting
As a result of the transition to IFRS from previous Canadian GAAP, we expect the following changes to future reporting:
• Under previous Canadian GAAP, overhead expenses were capitalized as part of PP&E or intangible assets if they were permitted or required to be included in the Company’s rate-regulated asset base. Under IFRS, overheads may only be capitalized if they are directly attributable to the construction of PP&E or development of intangible assets. The effect of this difference is that net income, in the year the overheads are incurred, will be lower than previously reported under previous Canadian GAAP but higher in later years, since there will be no depreciation expense on such costs as there would have been under previous Canadian GAAP.
• The Company’s beneficial interest in the sinking fund is required to be measured at fair value under IFRS. As a result, there will be increased volatility in comprehensive income, which will diminish over time as the associated debt is repaid.
• Under previous Canadian GAAP, the amortization of contributions received towards the construction of PP&E used to provide ongoing access to electricity and water supply was treated as an offset to depreciation expense. Under IFRIC 18, these amounts are treated as revenue. This change will increase depreciation expense and increase revenue with no impact on net income.

EPCOR Utilities Inc. Q2 2011, Page 21 of 28
• As regulatory assets and liabilities are not recognized under IFRS, amounts which were previously recognized under previous Canadian GAAP, on the basis that regulatory approval would ultimately allow the amounts, will only be recognized when future rates are effective and the services have been provided to customers. Adoption of IFRS introduces timing differences in revenue recognition relative to these amounts and as a result, there will be increased volatility in net income.
• Currently, most of the Company’s operations are rate-regulated, and impairments of assets subject to rate-regulation are not a significant concern under the current regulatory framework. However, the Company’s non rate-regulated commercial operations are comprised of numerous cash generating units. As a result, the greater number of cash generating units and increased frequency of assessment for indicators of impairment under IFRS than under previous Canadian GAAP may give rise to more frequent impairment charges than would otherwise be the case under previous Canadian GAAP.
FUTURE ACCOUNTING STANDARD CHANGES
The following accounting standards and interpretations, which have potential significance to the Company, were issued by the International Accounting Standards Board (IASB) and the International Financial Reporting Interpretations Committees for application in future periods:
International Accounting Standards (IAS / IFRS) Effective for annual periods
beginning on or after:
IFRS 7 (Amendment) – Financial Instruments: Disclosures July 1, 2011 IAS 1 (Amendment) – Presentation of Financial Statements July 1, 2012 IFRS 9 – Financial Instruments January 1, 2013 IFRS 10 – Consolidated Financial Statements January 1, 2013 IFRS 11 – Joint Arrangements January 1, 2013 IFRS 12 – Disclosure of Interests in Other Entities January 1, 2013 IFRS 13 – Fair Value Measurement January 1, 2013 IAS 28 (Amendment) – Investments in Associates and Joint Ventures January 1, 2013
IFRS 7 (Amendment) – Financial Instruments: Disclosures
This amendment requires additional disclosure with respect to transferred assets that are not derecognized and financial assets which have been derecognized but for which the entity is still involved. The Company does not expect the amendments to have a material impact on the financial statements, because the nature of the Company’s operations and the types of financial assets that it holds.
IAS 1 (Amendment) – Presentation of Financial Statements (IAS 1)
The amendment requires entities to group items presented in other comprehensive income (OCI) on the basis of whether they might at some point be reclassified from OCI to profit or loss at a later date when specified conditions are met. By requiring items of OCI to be grouped on this basis, their potential effect on profit or loss in future periods will be clearer. The Company does not expect IAS 1 to have a material impact on the financial statements.

EPCOR Utilities Inc. Q2 2011, Page 22 of 28
IFRS 9 – Financial Instruments (IFRS 9)
This standard replaces IAS 39 – Financial Instruments: Recognition and Measurement (IAS 39) and eliminates the existing categories of financial assets and requires financial assets to be classified as either amortized cost or fair value. Gains and losses on re-measurement of financial assets at fair value will be recognized in profit or loss, except for an investment in an equity instrument which is not held-for-trading. Changes in fair value attributable to changes in credit risk of financial liabilities measured under the fair value option will be recognized in OCI with the remainder of the change recognized in profit or loss unless an accounting mismatch in profit or loss occurs at which time the entire change in fair value would be recognized in profit or loss. Derivative liabilities that are linked to and must be settled by delivery of an unquoted equity instrument must be measured at fair value. The impact on the Company of adoption of IFRS 9 has not yet been determined.
IFRS 10 - Consolidated Financial Statements (IFRS 10)
This standard replaces IAS 27 – Consolidated and Separate Financial Statements and Standing Interpretations Committee (SIC) – 12 – Consolidation – Special Purpose Entities (SIC-12) and provides a single model to be applied in the control analysis for all investees, including entities that currently are special purpose entities in the scope of SIC-12. The Company does not expect this standard to have any material impact on its financial statements as it does not change the control analysis for any of its associates or subsidiaries.
IFRS 11 – Joint Arrangements (IFRS 11)
This standard replaces IAS 31 - Interests in Joint Ventures and SIC-13 – Jointly Controlled Entities: Non-Monetary Contributions by Vendors. IFRS 11 draws a distinction between joint operations and joint ventures. Entities which previously accounted for joint ventures using proportionate consolidation will generally be required to account for such ventures using the equity method. The Company does not expect the amendment to have any impact as the Company does not have any joint arrangements at the reporting date.
IFRS 12 – Disclosure of Interest in Other Entities (IFRS 12)
This standard contains the disclosure requirements for entities that have interests in subsidiaries, joint arrangements, associates and/or unconsolidated structured entities. When applied, it is expected that the amendments to IFRS 12 will increase the current level of disclosure of the Company’s interest in other entities.
IFRS 13 – Fair Value Measurement (IFRS 13)
This standard replaces the fair value measurement guidance contained in individual IFRSs with a single source of fair value measurement guidance. It defines fair value, establishes a framework for measuring fair value and sets out disclosure requirements. The Company does not expect IFRS 13 to have a material impact on the financial statements.
IAS 28 (Amendment) – Investments in Associates and Joint Ventures
This standard was amended to conform to the IFRS 10 and IFRS 11 accounting standards. The amendments apply to the measurement of a retained stake in an investment where significant influence is succeeded by joint control, and to the measurement of a retained stake in an investment, a portion of which has been classified as held for sale. The Company does not expect these amendments to have an impact on the financial statements.

EPCOR Utilities Inc. Q2 2011, Page 23 of 28
In addition, the following projects on the IASB work-plan, with standards expected to be issued during 2012, may have an impact on the Company when adopted:
Leases
The IASB issued an exposure draft on leases which proposes recording all leased assets on the statement of financial position. EPCOR, as a lessee, is party to a number of leases, including a long-term commitment with respect to its head office and as part of its commercial water operations. EPCOR may also enter into arrangements where it is a lessor. These proposals could result in revised asset and liability amounts recorded on the statement of financial position and would alter the presentation of revenues and expenses associated with such contracts by reclassifying the related operating expenses as finance expense and depreciation expense, and related operating revenues as finance income.
Revenue Recognition
The IASB issued an exposure draft on revenue recognition to replace the current guidance contained in IAS 18 – Revenue and IAS 11 – Construction Contracts and to provide a single, consistent framework for revenue recognition. As part of the single framework approach, the percentage of completion method used for construction contracts under IAS 11 – Construction Contracts is withdrawn, which could result in differences in the timing of revenue recognition on construction contracts if it is assessed that control does not continuously pass to the customer. In addition, the exposure draft contains more detailed guidance in identifying separate deliverables and in determining the transaction price. A revised exposure draft is expected in the third quarter of 2011.
The impact of these projects on the Company will be assessed once final standards have been issued.
CRITICAL ACCOUNTING ESTIMATES In preparing the condensed consolidated interim financial statements, management necessarily made estimates in determining transaction amounts and financial statement balances. The following are the items for which significant estimates were made in the condensed consolidated interim financial statements: electricity revenues and costs, unbilled consumption of electricity and water, fair values, allowance for doubtful accounts, useful lives of assets and income taxes. Interim results will fluctuate due to the seasonal demands for electricity and water, changes in electricity prices, and the timing and recognition of regulatory decisions. Consequently, interim results are not necessarily indicative of annual results.
For further information on the Company’s critical accounting estimates, refer to the 2010 annual MD&A.
RISK MANAGEMENT This section should be read in conjunction with the Risk Management section of the most recent annual MD&A. EPCOR faces a number of risks including risks related to its investment in Capital Power, operational risks, political, legislative and regulatory risk, strategy execution risk, weather risk, financial liquidity risk, project risk, availability of people risk, credit risk, regulated rate option and default supply credit risk, water credit risk, environment risk, health and safety risk, conflicts of interest risk, general economic conditions and business environment risks and foreign exchange risk. The Company employs active programs to manage these risks.

EPCOR Utilities Inc. Q2 2011, Page 24 of 28
In December 2008, the Regional Water Customers Group (RWCG), which represents the interests of Edmonton regional water customers, requested that the AUC issue a Notice of Application in respect of its complaints regarding wholesale water rates for the years 2004 to 2007. Since that time, through a series of AUC notices and requests, both the Company and RWCG have filed evidence, including rebuttal and surrebuttal evidence, with the AUC. In June 2011, the AUC rendered its decision. Although the AUC ruled in EPCOR's favor on a number of issues such as debt costs and capital structure, the AUC disallowed certain costs. The AUC ordered EPCOR to refile its 2004 to 2007 cost models by September 30, 2011 to reflect this decision. EPCOR has fully provided for the estimated result of this decision in its financial statements.
On May 5, 2011, all four charges brought against the Company under the Alberta Occupational Health and Safety Act and Occupational Safety Code with respect to the 2007 fatality of a power lineman employee were stayed, ending all legal proceedings on this matter.
As part of ongoing risk management practices, the Company reviews current and proposed transactions to consider their impact on the risk profile of the Company. The only material changes to the risk profile or risk management strategies of EPCOR as described in the annual MD&A for 2010 that have affected the financial statements for June 30, 2011 are described below.
Electricity Price and Volume Risk
The Company is exposed to electricity price risk under its rate regulated EPSP.
The Company sells electricity to customers under a RRT. As part of the RRT, the amount of electricity to be procured, the procurement method and electricity selling prices to be charged to these customers is determined by an EPSP. Under the new EPSP, commencing July 1, 2011, and unlike the previous EPSP under which the Company’s electricity procurement requirements were managed by a third party, the Company will manage procurement of the electricity directly. In May 2011, the Company started procuring electricity for its July 2011 requirements. As part of the EPSP, the Company uses financial contracts-for-differences, a type of derivative financial instrument, to manage the Company’s exposure to fluctuations in electricity price. Under these instruments, the Company agrees to exchange, with a single creditworthy and adequately secured counterparty, the difference between the Alberta Electric System Operator (AESO) market price and the fixed contract price for a specified volume of electricity for the forward month, all in accordance with the EPSP.
The Company is exposed to the changes in the electricity spot price for electricity purchases. The Company purchases contracts-for-differences in order to fix electricity purchase costs, which in turn determine the selling price for RRT electricity. The contracts-for-differences are referenced to the AESO electricity spot price and any movement in the AESO price results in changes in the contract settlement amount.
The Company is exposed to risk from variances between forecast RRT electricity usage and actual RRT electricity usage. The Company enters into contracts-for-differences based on load (usage) forecasts for the consumption month, and the selling price to customers is based on the contracted cost and contracted volume of the contracts-for-differences. If actual usage varies from the contracted volume, the Company sells the excess or buys the shortfall at AESO electricity spot prices which may vary from the underlying cost used to establish the RRT selling price.

EPCOR Utilities Inc. Q2 2011, Page 25 of 28
Foreign Exchange Risk
The Company is exposed to foreign exchange risk on foreign currency denominated forecasted transactions, firm commitments, monetary assets and liabilities denominated in a foreign currency and on its net investments in foreign entities.
The Company’s Financial Exposure Management Policy attempts to minimize economic and material transactional exposures arising from movements in the Canadian dollar relative to the U.S. dollar or other foreign currencies. The Company’s direct exposure to foreign exchange risk arises on capital expenditure commitments denominated in U.S. dollars or other foreign currencies. The Company coordinates and manages foreign exchange risk centrally, by identifying opportunities for naturally occurring opposite movements and then dealing with any material residual foreign exchange risks.
The Company may use foreign currency forward contracts to fix the functional currency of its non-functional currency cash flows thereby reducing its anticipated U.S. dollar denominated transactional exposure. The Company looks to limit foreign currency exposures as a percentage of estimated future cash flows.
OUTLOOK In June 2011, EPCOR filed its five-year performance based regulation (PBR) renewal application in respect of its water treatment and distribution services and wastewater treatment services effective April 1, 2012 to the City. On July 20, 2011, Edmonton City Council gave the renewal application first reading. Further review by Edmonton City Administration and its consultant is expected in August 2011 in preparation for a public hearing in September 2011. Final approval by Edmonton City Council is expected in September 2011.
In June 2011, Capital Power announced its plan to sell its interest in Capital Power Income L.P. Capital Power has estimated that the sale will close in the fourth quarter of 2011. Any gain or loss on the transaction recognized by Capital Power will impact EPCOR in the form of our equity in CPLP’s net income.
In early July 2011, Capital Power issued 9.2 million common shares, which further reduced EPCOR’s economic interest to 49%.
In July 2011, EPCOR filed its first PBR application in respect of its electricity distribution and transmission operations, effective 2013.
In May 2011, the AUC approved an exemption to EPCOR’s Inter-affiliate Code of Conduct, permitting the internal transfer of management oversight of EPCOR Technologies from Water Services to Distribution and Transmission. Future segment reporting will reflect the transfer.
In October 2011, we expect to file a cost of service application for 2012, consistent with prior applications, in respect of our electricity distribution and transmission operations. In November 2011, a cost of service application for 2012 and 2013 is expected to be filed in respect of our energy services business.
EPCOR Utilities Inc. Q2 2011, Page 26 of 28
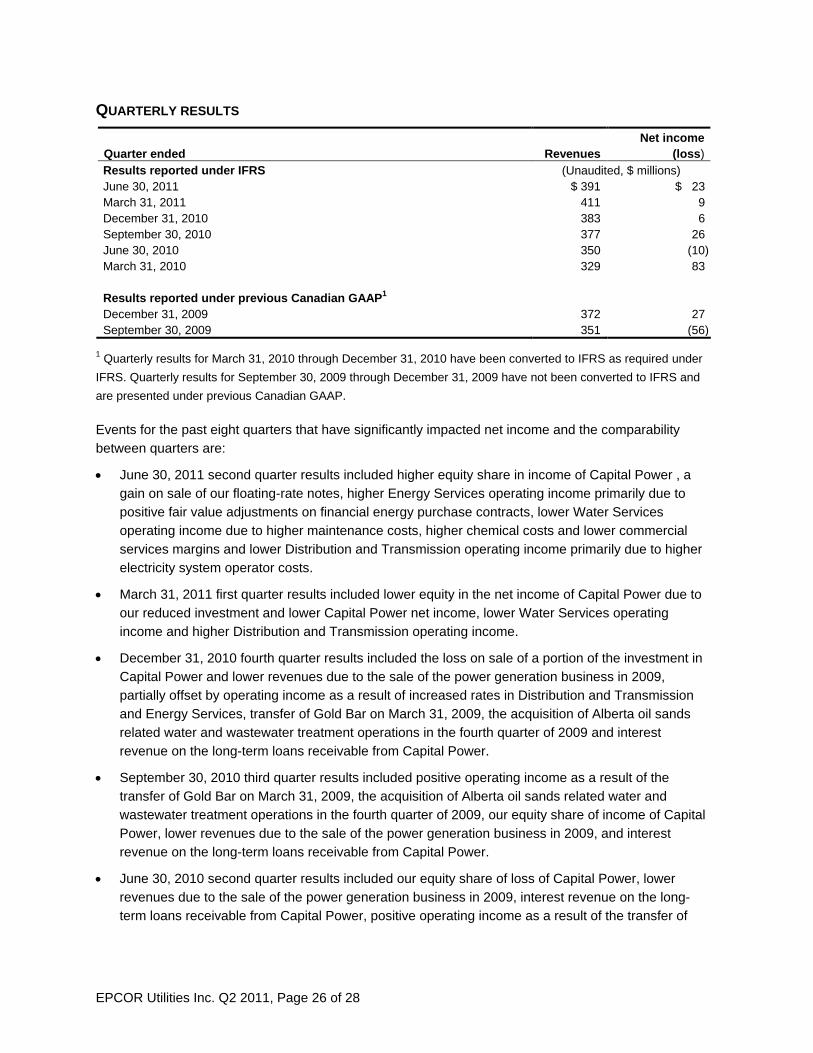
QUARTERLY RESULTS Quarter ended Revenues
Net income (loss)
Results reported under IFRS (Unaudited, $ millions) June 30, 2011 $ 391 $ 23 March 31, 2011 411 9 December 31, 2010 383 6 September 30, 2010 377 26 June 30, 2010 350 (10) March 31, 2010 329 83 Results reported under previous Canadian GAAP1 December 31, 2009 372 27 September 30, 2009 351 (56)
1 Quarterly results for March 31, 2010 through December 31, 2010 have been converted to IFRS as required under IFRS. Quarterly results for September 30, 2009 through December 31, 2009 have not been converted to IFRS and are presented under previous Canadian GAAP.
Events for the past eight quarters that have significantly impacted net income and the comparability between quarters are:
• June 30, 2011 second quarter results included higher equity share in income of Capital Power , a gain on sale of our floating-rate notes, higher Energy Services operating income primarily due to positive fair value adjustments on financial energy purchase contracts, lower Water Services operating income due to higher maintenance costs, higher chemical costs and lower commercial services margins and lower Distribution and Transmission operating income primarily due to higher electricity system operator costs.
• March 31, 2011 first quarter results included lower equity in the net income of Capital Power due to our reduced investment and lower Capital Power net income, lower Water Services operating income and higher Distribution and Transmission operating income.
• December 31, 2010 fourth quarter results included the loss on sale of a portion of the investment in Capital Power and lower revenues due to the sale of the power generation business in 2009, partially offset by operating income as a result of increased rates in Distribution and Transmission and Energy Services, transfer of Gold Bar on March 31, 2009, the acquisition of Alberta oil sands related water and wastewater treatment operations in the fourth quarter of 2009 and interest revenue on the long-term loans receivable from Capital Power.
• September 30, 2010 third quarter results included positive operating income as a result of the transfer of Gold Bar on March 31, 2009, the acquisition of Alberta oil sands related water and wastewater treatment operations in the fourth quarter of 2009, our equity share of income of Capital Power, lower revenues due to the sale of the power generation business in 2009, and interest revenue on the long-term loans receivable from Capital Power.
• June 30, 2010 second quarter results included our equity share of loss of Capital Power, lower revenues due to the sale of the power generation business in 2009, interest revenue on the long-term loans receivable from Capital Power, positive operating income as a result of the transfer of

EPCOR Utilities Inc. Q2 2011, Page 27 of 28
Gold Bar on March 31, 2009 and the acquisition of Alberta oil sands related water and wastewater treatment operations in the fourth quarter of 2009.
• March 31, 2010 first quarter results included our equity share of income of Capital Power, lower revenues due to the sale of the power generation business in 2009, interest revenue on the long-term loans receivable from Capital Power, positive operating income as a result of the transfer of Gold Bar on March 31, 2009 and the acquisition of Alberta oil sands related water and wastewater treatment operations in the fourth quarter of 2009.
December 31, 2009 fourth quarter results included adjustments to the loss on sale of the power generation business, interest revenue on the long-term loans receivable from Capital Power and positive operating income as a result of the transfer of Gold Bar on March 31, 2009.
September 30, 2009 third quarter results included a loss on the sale of the power generation business and the write-off of syndicated credit facility issue costs related to the sale of the power generation business partially offset by our equity share of income of Capital Power, interest revenue on the long-term loans receivable from Capital Power L.P. and positive operating income as a result of the transfer of Gold Bar on March 31, 2009.
FORWARD-LOOKING INFORMATION Certain information in this MD&A is forward-looking within the meaning of Canadian securities laws as it relates to anticipated financial performance, events or strategies. When used in this context, words such as “will”, “anticipate”, “believe”, “plan”, “intend”, “target”, and “expect” or similar words suggest future outcomes.
The purpose of forward-looking information is to provide investors with management’s assessment of future plans and possible outcomes and may not be appropriate for other purposes. Forward-looking information in this MD&A includes: (i) expectations regarding the Company’s 2011 capital expenditure plan; (ii) sources of funding for 2011 working capital and contractual obligations; (iii) sources of funding for 2011 financing requirements; (iv) expectations regarding the impact on the Company of the capital and credit market instability and expected risk mitigation plans; (v) expected impact on future financial reporting of conversion to IFRS and expected timing and impact on the Company’s financial reporting of announced changes to IFRS; (vi) expectations regarding the filing of rate applications in 2011; and (vii) expected timing and impact of Capital Power’s sale of its interest in Capital Power Income L.P.
These statements are based on certain assumptions and analyses made by the Company in light of its experience and perception of historical trends, current conditions and expected future developments and other factors it believes are appropriate. The material factors and assumptions underlying this forward-looking information include, but are not limited to: (i) the operation of the Company’s facilities; (ii) the Company’s assessment of the markets and regulatory environments in which it operates; (iii) weather; (iv) availability and cost of labour and management resources; (v) performance of contractors and suppliers; (vi) availability and cost of financing; (vii) foreign exchange rates; (viii) management’s analysis of applicable tax legislation; (ix) the currently applicable and proposed tax laws will not change and will be implemented; (x) counterparties will perform their obligations; (xi) expected interest rates and related credit spreads; (xii) ability to implement strategic initiatives which will yield the expected benefits; (xiii) the Company’s assessment of capital markets; and (xiv) factors and assumptions in addition to the above related to the Company’s equity interest in Capital Power.

EPCOR Utilities Inc. Q2 2011, Page 28 of 28
Whether actual results, performance or achievements will conform to the Company’s expectations and predictions is subject to a number of known and unknown risks and uncertainties which could cause actual results and experience to differ materially from EPCOR’s expectations. The primary risks and uncertainties relate to: (i) operation of the Company’s facilities; (ii) unanticipated maintenance and other expenditures; (iii) electricity load settlement; (iv) regulatory and government decisions including changes to environmental, financial reporting and tax legislation; (v) weather and economic conditions; (vi) competitive pressures; (vii) construction; (viii) availability and cost of financing; (ix) foreign exchange; (x) availability of labour and management resources; (xi) performance of counterparties, partners, contractors and suppliers in fulfilling their obligations to the Company; (xii) availability and price of electricity; (xiii) customer electricity and water consumption volumes; and (xiv) risks in addition to the above related to the Company’s equity interest in Capital Power, including power plant availability and performance.
This MD&A includes the following update to a previously issued forward-looking statement: (i) Distribution and Transmission filed its first PBR application in July 2011 as opposed to the expected timeframe of May 2011 previously disclosed.
Readers are cautioned not to place undue reliance on forward-looking statements as actual results could differ materially from the plans, expectations, estimates or intentions expressed in the forward-looking statements. Except as required by law, EPCOR disclaims any intention and assumes no obligation to update any forward-looking statement even if new information becomes available, as a result of future events or for any other reason.
ADDITIONAL INFORMATION Additional information relating to EPCOR, including EPCOR’s annual information form, is available on SEDAR at www.sedar.com.