Embed Size (px)
Citation preview

Decision 2012-272
EPCOR Distribution & Transmission Inc.
2012 Phase I and II Distribution Tariff 2012 Transmission Facility Owner Tariff
October 5, 2012

The Alberta Utilities Commission
Decision 2012-272: EPCOR Distribution & Transmission Inc.
2012 Phase I and II Distribution Tariff
2012 Transmission Facility Owner Tariff
Application No. 1607944
Proceeding ID No. 1596
October 5, 2012
Published by
The Alberta Utilities Commission
Fifth Avenue Place, Fourth Floor, 425 First Street S.W.
Calgary, Alberta
T2P 3L8
Telephone: 403-592-8845
Fax: 403-592-4406
Website: www.auc.ab.ca

AUC Decision 2012-272 (October 5, 2012) • i
Contents
1 Introduction ........................................................................................................................... 1
2 Compliance with previous directions .................................................................................. 4
3 Issues common to distribution and transmission ............................................................. 10 3.1 FTE forecasts ............................................................................................................... 10 3.2 Vacancy levels ............................................................................................................. 16 3.3 Salary escalations ......................................................................................................... 21 3.4 Cost escalations ............................................................................................................ 24 3.5 Short-term incentive program ...................................................................................... 25
3.6 Mid-term incentive program ........................................................................................ 28 3.7 Cost of debt .................................................................................................................. 30
3.7.1 The DBRS letter ................................................................................................ 31 3.7.2 Indicative corporate bond spread for EDTI ....................................................... 33 3.7.3 Government of Canada bond yield .................................................................... 34 3.7.4 Access to ACFA financing ................................................................................ 34
3.8 Property, business and linear tax deferral account ....................................................... 37
3.9 Self-insurance reserve account ..................................................................................... 38 3.10 Depreciation ................................................................................................................. 40
3.11 International Financial Reporting Standards ................................................................ 42 3.12 Updating for 2011 actual amounts ............................................................................... 44
3.12.1 Updating of categories other than operating expenses ................................... 44
3.12.2 Updating of operating expenses ...................................................................... 45 3.13 Operating expenses ...................................................................................................... 48
3.13.1 Forecasting of distribution and transmission repair costs ............................... 48 3.13.2 Cost control metrics ........................................................................................ 50
3.13.3 Inspection of customer service connections on private property .................... 51 3.13.4 Specialized rental equipment .......................................................................... 52
4 Distribution issues ............................................................................................................... 53 4.1 Distribution rate base ................................................................................................... 53
4.1.1 Distribution opening rate base ........................................................................... 53
4.1.2 Distribution 2012 capital additions ................................................................... 56 4.2 House service connection upgrades and relocates ....................................................... 57
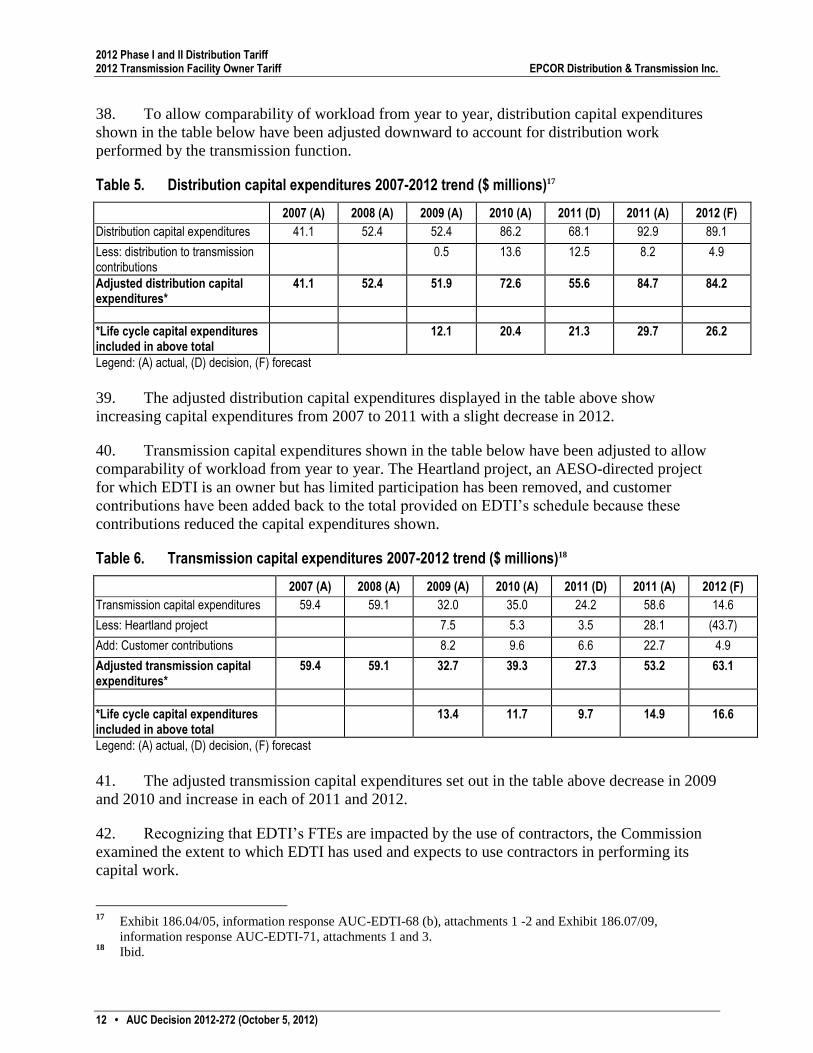
5 Transmission issues ............................................................................................................. 58 5.1 Transmission rate base ................................................................................................. 58
5.1.1 Transmission opening rate base ........................................................................ 58
5.1.2 Transmission 2012 capital additions ................................................................. 62 5.1.3 Other issues related to transmission capital additions ....................................... 63
5.1.3.1 Age as a criteria in EDTI‟s asset replacement strategy ...................... 63 5.1.3.2 Capacity to complete forecast capital work ........................................ 64 5.1.3.3 Heartland 500 kV transmission project............................................... 66
5.1.3.4 AESO-directed projects ...................................................................... 68 5.1.3.5 Process improvement initiatives ......................................................... 70
5.2 One-off projects ........................................................................................................... 74
6 Corporate services costs ..................................................................................................... 75

ii • AUC Decision 2012-272 (October 5, 2012)
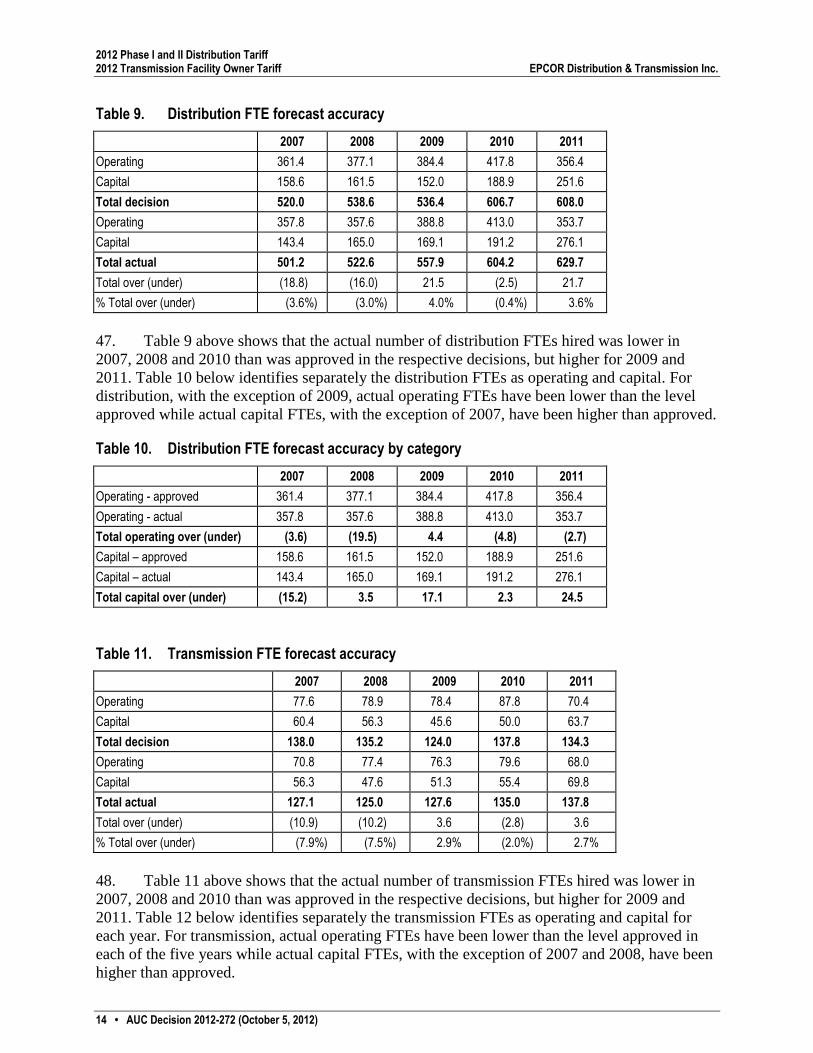
6.1 Legal and regulatory framework .................................................................................. 77 6.2 Corporate services costs allocated from EPCOR Utilities Inc. .................................... 81
6.2.1 Are the costs related to the provision of corporate services from EUI to EDTI
and EEAI necessary for EDTI and EEAI to provide utility service? ................ 81 6.2.1.1 Total corporate services costs to be allocated ..................................... 81 6.2.1.2 Short-term incentive payments allocated to the utilities by EUI ........ 85 6.2.1.3 Mid-term incentive payments allocated to the utilities by EUI .......... 86
6.2.1.4 Community relations and EPCOR community essentials council ...... 87 6.2.1.5 Other corporate services costs ............................................................ 87 6.2.1.6 Business development costs ................................................................ 88
6.2.2 Are the corporate services costs allocated correctly? ........................................ 89 6.2.2.1 Labour component of the composite cost causation allocator ............ 91
6.2.2.2 Revenue component of the composite cost causation allocator .......... 92 6.2.2.3 Capital expenditure component of the composite cost causation
allocator............................................................................................... 94 6.2.2.4 Should some corporate services costs be allocated to EUI itself for its
management of its investment in CPC, or for its management of the
funds remaining from its partial sale of CPC? .................................... 95
6.2.2.5 Has EUI acquired any new businesses to which it should allocate some
of its corporate services costs? ............................................................ 96
6.2.3 Would it be less expensive for EDTI and EEAI to provide the corporate
services or seek a different third-party provider on a stand-alone basis? ......... 98
7 Other issues ........................................................................................................................ 100 7.1 Phase II cost of service study ..................................................................................... 100
7.1.1 Distribution access service cost of service study and rates ............................. 100
7.2 Billing determinants forecast – transmission and distribution ................................... 102 7.3 Inclusion of volume variances in the TCDA.............................................................. 104
7.4 2012 system access service (SAS) rates .................................................................... 109 7.4.1 EDTI‟s proposed 2012 SAS rates ................................................................... 109
7.4.2 SAS operating reserve charge ......................................................................... 110 7.5 Maximum investment level ........................................................................................ 113 7.6 Deferral accounts ....................................................................................................... 116
7.7 Areas not individually addressed ............................................................................... 117 7.8 PBR and going-in rates .............................................................................................. 117
8 Order .................................................................................................................................. 119
9 Dissenting reasons of Commission Member Bill Lyttle regarding EDTI’s cost of debt...
............................................................................................................................................. 120
Appendix 1 – Proceeding participants .................................................................................... 129
Appendix 2 – Summary of Commission directions ................................................................ 131
List of Tables
Table 1. Major components of the 2012 distribution revenue requirement ........................ 2

AUC Decision 2012-272 (October 5, 2012) • iii
Table 2. Major components of the 2012 transmission revenue requirement ....................... 2
Table 3. Distribution FTE 2007-2012 trend .......................................................................... 11
Table 4. Transmission FTE 2007-2012 trend ........................................................................ 11
Table 5. Distribution capital expenditures 2007-2012 trend ($ millions) ........................... 12
Table 6. Transmission capital expenditures 2007-2012 trend ($ millions) ......................... 12
Table 7. Distribution capital expenditures completed by EDTI resources vs. contractors –
Table AUC-EDTI-69-1 ............................................................................................. 13
Table 8. Transmission capital expenditures completed by EDTI resources vs. contractors
– Table AUC-EDTI-69-2 .......................................................................................... 13
Table 9. Distribution FTE forecast accuracy ........................................................................ 14
Table 10. Distribution FTE forecast accuracy by category ................................................... 14
Table 11. Transmission FTE forecast accuracy ...................................................................... 14
Table 12. Transmission FTE forecast accuracy by category ................................................. 15
Table 13. Distribution vacancy information by type (FTEs) ................................................. 19
Table 14. Transmission vacancy information by type (FTEs) ............................................... 20
Table 15. Summary of escalators ............................................................................................. 24
Table 16. Estimated ED/ET 2012 stand-alone 2012 cost of long-term debt ......................... 30
Table 17. Distribution and transmission property, business and linear taxes 2009-2012 ... 37
Table 18. Distribution self-insurance reserve accounts.......................................................... 38
Table 19. Transmission self-insurance reserve accounts ....................................................... 38
Table 20. Depreciation expense by asset function 2011-2012 ($ millions) ............................ 40
Table 21. Distribution operating expenditures 2009-2012 – Table AUC-EDTI-69-3
($ millions) ................................................................................................................. 46
Table 22. Transmission operating expenditures 2009-2012 – Table AUC-EDTI-69-4
($ millions) ................................................................................................................. 47
Table 23. 2011 backcast – comparison of three-year average calculation methodologies –
Table CCA-EDTI-91-1 ($ millions) ......................................................................... 49
Table 24. Inspection of customer service connections on private property 2009-2012, Table
4.8.1-1 ($ millions) ..................................................................................................... 52

iv • AUC Decision 2012-272 (October 5, 2012)
Table 25. Distribution rate base (less working capital) – actual vs. decision ....................... 53
Table 26. EDTI distribution function capital additions ($ millions) ..................................... 54
Table 27. Distribution capital additions summary 2009-2012 ............................................... 57
Table 28. House service connection upgrades and relocates 2009-2012 – Table 4.7.2-5 ($
millions) ...................................................................................................................... 57
Table 29. Transmission rate base (less working capital) – actual vs. decision ..................... 59
Table 30. EDTI transmission function capital additions ($ million) ..................................... 59
Table 31. EDTI transmission function capital expenditures and capital additions excluding
Heartland ($ million) ................................................................................................ 60
Table 32. Heartland 500 kV transmission ($ millions) ........................................................... 60
Table 33. Transmission capital additions summary 2009-2012............................................. 62
Table 34. 2009-2012 transmission and distribution capital expenditures ($ million) ......... 65
Table 35. Forecast costs for the Heartland project 2011-2012 ($ millions) .......................... 66
Table 36. AESO-directed projects included in Section 13.2.1.13 .......................................... 69
Table 37. 2012 Process improvement initiatives ($ millions) ................................................. 70
Table 38. Transmission substation apparatus maintenance and repair 2009-2012
($ millions) ................................................................................................................. 74
Table 39. 2010-2012 corporate services costs by utility ($ millions) ..................................... 76
Table 40. 2012 corporate services costs by method ($ millions) ............................................ 82
Table 41. 2010-2012 EUI corporate services costs ($ millions) .............................................. 84
Table 42. Costs allocated by the composite cost causation allocator (2012 $ millions) ....... 90
Table 43. EPCOR Utilities Inc. – business information ($ millions) ..................................... 93
Table 44. 2012 U.S. water corporate services costs allocated by the composite cost
causation allocator ($ millions) ................................................................................ 98
Table 45. Number of customers and energy forecast – forecast accuracy table ................ 102
Table 46. Number of customers and energy – trend table ................................................... 103
Table 47. Number of customers – trend table ....................................................................... 103
Table 48. Energy sales – trend table ...................................................................................... 103

AUC Decision 2012-272 (October 5, 2012) • v
Table 49. Volume-related variances 2007-2011 ($ millions) ................................................ 105
Table 50. Major components of the 2012 distribution revenue requirement .................... 117
Table 51. Major components of the 2012 transmission revenue requirement ................... 117
Table 52. Average historical cost of debt (from AUC Rule 005 filings).............................. 124


AUC Decision 2012-272 (October 5, 2012) • 1
The Alberta Utilities Commission
Calgary, Alberta
EPCOR Distribution & Transmission Inc. Decision 2012-272
2012 Phase I and II Distribution Tariff Application No. 1607944
2012 Transmission Facility Owner Tariff Proceeding ID No. 1596
1 Introduction
1. On November 30, 2011, the Alberta Utilities Commission (the AUC or the Commission)
received Application No. 1607944, entered as Proceeding ID No. 1596 (the application) from
EPCOR Distribution & Transmission Inc. (EDTI). The application requested approval of EDTI‟s
2012 Phase I and II distribution tariff and its 2012 transmission facility owner (TFO) tariff.
Specifically, EDTI requested approval of its:
forecast distribution function revenue requirement for the 2012 test year
forecast transmission function revenue requirement for the 2012 test year
rates for distribution access service (DAS) and related fees
rates for system access service (SAS)
transmission rates to be paid by the Alberta Electric System Operator (AESO) for the use
of EDTI‟s transmission facilities over the 2012 test year
terms and conditions for DAS, distribution connection services and distribution tariff
policies
TFO terms and conditions of service
distribution function and transmission function reserve and deferral accounts
transmission charge deferral account modifications
2. In addition, EDTI requested that the Commission direct that (with the exception of
EDTI‟s SAS rates and riders) the 2012 distribution tariff and TFO tariff, ultimately approved by
the Commission on a final basis, be continued into 2013 as EDTI‟s 2013 interim distribution
tariff and TFO tariff, pending
(i) approval by the Commission of EDTI‟s first annual rate adjustment filing under EDTI‟s
performance-based regulation plan (if approved by the Commission); or
(ii) any further order from the Commission in respect of EDTI‟s 2013 tariffs.
3. EDTI‟s forecast distribution function revenue requirement for 2012 is $149.40 million,
an increase of 14 per cent over EDTI‟s 2011 actual distribution revenue. Furthermore, EDTI‟s
2012 forecast transmission function revenue requirement is $68.64 million, which represents a
17 per cent increase over EDTI‟s 2011 actual transmission revenue.
4. The following tables summarize the 2012 forecast revenue requirement for distribution
and transmission as requested by EDTI.1 Unless otherwise noted, all dollar figures in these tables
are in millions:
1 Exhibit 3, application, page 5, Table 1.2.2.1-1 and page 11, Table 1.2.2.2-1.

2012 Phase I and II Distribution Tariff 2012 Transmission Facility Owner Tariff EPCOR Distribution & Transmission Inc.
2 • AUC Decision 2012-272 (October 5, 2012)
Table 1. Major components of the 2012 distribution revenue requirement
2012 ($ millions)
Per cent of total (%)
Return on debt and equity 43.79 29
Operating expenses 33.11 22
Depreciation 27.46 18
Corporate 23.24 16
Customer accounts 7.17 5
Property taxes 6.70 4
Administrative (net of capitalized amounts) 4.17 3
Deferred and reserve 3.76 3
Total 149.40 100
Table 2. Major components of the 2012 transmission revenue requirement
2012
($ millions) Per cent of total
(%)
Return on debt and equity 24.55 36
Depreciation 13.91 20
Operating expenses 13.54 20
Property taxes 6.89 10
Corporate 6.26 9
Deferred and reserve 2.04 3
Administrative (net of capitalized amounts) 1.44 2
Total 68.63 100
5. The corporate costs in the above tables exclude corporate costs that were directly
assigned or which are embedded in other cost categories, or capitalized.
6. On December 5, 2011, the Commission issued a notice of application requiring interested
parties to submit a statement of intent to participate (SIP) by December 23, 2011. A number of
interested parties registered to participate in this proceeding including the University of Alberta
(University), the Office of the Utilities Consumer Advocate (UCA), and the Consumers‟
Coalition of Alberta (CCA). A complete list of registered parties is set out in Appendix 1.
7. On December 13, 2011, the AUC issued a letter setting out the schedule for this
proceeding. In the letter the Commission set out an initial schedule stating that it had determined
that the application should be considered by way of a full process that included an oral hearing,
which was to be held in Calgary.
8. EDTI submitted a letter, dated December 16, 2011, requesting that the 2012 corporate
service matters for both EDTI and EPCOR Energy Alberta Inc. (EEAI) be determined in this
proceeding. EDTI further submitted that all of the information related to 2012 corporate service
matters for both EEAI and EDTI had been filed in this proceeding.
9. Noting the efficiencies that would be gained in adopting a common approach respecting
corporate service matters, on December 20, 2011, the Commission issued a letter stating that
2012 corporate service matters for EDTI and EEAI would be determined in Proceeding ID
No. 1596. Furthermore, the Commission requested that parties that would be prejudiced by this

2012 Phase I and II Distribution Tariff 2012 Transmission Facility Owner Tariff EPCOR Distribution & Transmission Inc.
AUC Decision 2012-272 (October 5, 2012) • 3
common matters approach with regards to EEAI‟s 2012 corporate service costs should advise the
Commission by December 30, 2011.
10. The Commission, upon reviewing the application, considered that it may be possible to
process the application by way of a written proceeding. Therefore, on January 18, 2012, the
Commission issued a letter requesting interested parties to provide comments by February 8,
2012 as to whether an oral hearing was required and the reasons as to why an oral hearing may
be required. Furthermore, given that information requests to the applicant were due on
January 20, 2012, should the proceeding be done in writing, interested parties were asked to
provide comments as to whether or not a second round of information requests to the applicant
was required, in lieu of a hearing, as well as any other additional scheduling changes that may be
required.
11. On February 6, 2012, responding to EDTI‟s requests for a three-day extension of the
deadline to respond to information requests and the deadline for the filing of intervener evidence,
the Commission adjusted the requested deadlines and adjusted the deadline for submissions
regarding the need for an oral hearing to February 13, 2012.
12. Based on the submissions of parties, the Commission determined that there were no
compelling reasons that were presented as to why the issues in respect of this application
required testing at an oral hearing. Accordingly, the Commission in its letter, dated February 16,
2012, concluded that a written proceeding was suitable for testing this application and that the
oral hearing would be cancelled. Accordingly, the Commission established a written schedule,
which included a second round of information requests (IRs).
13. On March 22, 2012, the Commission issued a letter revising the schedule to allow for a
third round of IRs in order to test EDTI‟s 2011 actual financial information and for clarification
of previous information responses, if required, given that no oral hearing was scheduled for this
proceeding.
14. The following table outlines the process steps which were utilized to consider the
application.
Process step Deadline date
Statement of intent to participate 4 p.m., December 23, 2011
Information requests (Round 1) to applicant 4 p.m., January 20, 2012
Information responses (Round 1) from applicant 4 p.m., February 9, 2012
Information requests (Round 2) to applicant 4 p.m., March 7, 2012
Information responses (Round 2) from applicant 4 p.m., March 21, 2012
Information requests (Round 3) to applicant 4 p.m., April 11, 2012
Information responses (Round 3) from applicant 4 p.m., May 4, 2012
Intervener evidence (Round 1) 4 p.m., May 16, 2012
Information requests (Round 1) to interveners 4 p.m., May 25, 2012
Information responses (Round 1) from interveners 4 p.m., June 4, 2012
Rebuttal evidence (Round 1) 4 p.m., June 11, 2012
Argument 4 p.m., June 25, 2012
Reply argument 4 p.m., July 10, 2012

2012 Phase I and II Distribution Tariff 2012 Transmission Facility Owner Tariff EPCOR Distribution & Transmission Inc.
4 • AUC Decision 2012-272 (October 5, 2012)
15. The Commission considers that the record for this proceeding closed on July 10, 2012.
16. In this decision, the Commission has specifically identified and provided findings and
determinations for areas of issue or concern in the application raised by either the Commission or
interested parties. The Commission has reviewed all information provided by EDTI in the
application during the proceeding, including items that were not specifically addressed by parties
to consider whether the information appears reasonable.
17. In reaching the determinations set out within this decision the Commission has
considered all relevant materials comprising the record of this proceeding, including the
evidence and argument provided by each party. Accordingly, reference in this decision to
specific parts of the record are intended to assist the reader in understanding the Commission‟s
reasoning relating to a particular matter and should not be taken as an indication that the
Commission did not consider all relevant portions of the record with respect to a particular
matter.
2 Compliance with previous directions
18. The following table sets out those directions in previous decisions that were not identified
as contentious matters by interested parties in argument or reply and for which Commission is
satisfied that the directions have been complied with. The table also contains an explanation of
why the Commission is satisfied with EDTI‟s responses to the direction.
Application
section
Direction from Decision 2004-0672
Compliance to direction
2.2 Direction No. 17 - The Alberta Energy and
Utilities Board (board) directed EDTI to
provide appropriate business cases for capital
expenditures in excess of $500,000 clearly
showing:
The reasons/need for the proposed
expenditure; the alternatives examined; the
incremental capital and operating costs
associated with each alternative examined for
a minimum 10-year period; the discount or
investment rate used to compare alternatives
and the basis for its use; the rationale for
choosing a specific alternative, including any
qualitative considerations used in choosing
the alternative; and the date of preparation
and the date of approval.
After reviewing the business cases
attached as Appendix E, the
Commission finds that EDTI has
complied with this direction.
2 Decision 2004-067: EPCOR Distribution Inc., 2004 Distribution Tariff Application, Part B: 2004 Final
Distribution Tariff, Application No. 1306821, August 13, 2004.

2012 Phase I and II Distribution Tariff 2012 Transmission Facility Owner Tariff EPCOR Distribution & Transmission Inc.
AUC Decision 2012-272 (October 5, 2012) • 5
Application
section
Directions from Decision 2006-0543
Compliance to direction
2.3 Direction No. 10 - The board directed
EPCOR Distribution Inc. (EDI)/ EPCOR
Transmission Inc. (ETI) to provide actual and
forecast full-time equivalent (FTEs)
information for succession planning purposes
in future general tariff applications (GTAs).
The Commission finds that EDTI
has complied with this direction
after reviewing its succession
planning FTE‟s as set out in tables
1.4-1 and 1.4-2.
2.4 Direction No. 12 - Provide business cases for
any capital projects from EPCOR Utilities
Inc. (EUI) or other EPCOR affiliates where
the allocation is $500,000 or more in total
capital expenditure to either EDI or ETI or
both.
The Commission is satisfied with
EDTI‟s response attached as
Appendix E and finds that it has
complied with the direction.
2.6 Direction No. 28 - The board directed EDTI
to provide variance reporting of EDI capital
projects and ETI capital projects with a
minimum approved project forecast cost of
$500,000 and a variance from the approved
forecast of greater than 10 per cent.
The Commission has reviewed
Appendix E of the application and
is satisfied with EDTI‟s response to
this direction. The Commission
finds that EDTI has complied with
this direction.
2.7 Direction No. 32 - The board directed EDI, in
the next GTA, to consolidate projects that
may last longer than one year that are
seemingly the same project, such as the North
Service Centre Interior Replacements, and, if
the project is greater than $500,000, to
provide a business case.
Upon reviewing the groupings for
capital projects used by EDTI for
its 2012 application as set out in
Table 12.2-1 for distribution
projects and Table 13.2-1 for
transmission projects the
Commission finds that EDTI has
complied with this direction
Application
section
Directions from Decision 2010-5054
Compliance to direction
2.12 Direction No. 6 - The Commission directed
EDTI to provide paid overtime numbers for
meter readers as a part of its next GTA.
Upon reviewing its submissions for
its paid overtime numbers for meter
readers in MFR-Schedule 15-8 the
Commission finds that EDTI has
complied with this direction.
3 Decision 2006-054: EPCOR Transmission Inc., 2005/2006 Transmission Facility Owner Tariff, Application
No. 1389884 and EPCOR Distribution Inc., 2005/2006 Distribution Tariff – Phase I, Application No. 1389885,
June 15, 2006. 4 Decision 2010-505: EPCOR Distribution & Transmission Inc., 2010-2011 Phase I Distribution Tariff, 2010-
2011 Transmission Facility Owner Tariff, Application No. 1605759, Proceeding ID. 437, October 28, 2010.

2012 Phase I and II Distribution Tariff 2012 Transmission Facility Owner Tariff EPCOR Distribution & Transmission Inc.
6 • AUC Decision 2012-272 (October 5, 2012)
2.14 Paragraph 140 - The Commission directed
EDTI in future GTAs to clearly identify and
explain any variance in its depreciation
expense from forecast that is caused by
reasons other than forecast variances in
capital account balances.
EDTI did not change any
depreciation or amortization rates
during 2010 and 2011. It has
applied for a number of changes to
asset lives in this application. These
are discussed in Section 16 of the
application. The Commission finds
that EDTI has complied with this
direction.
2.15 Direction No. 8 - The Commission directed
EDTI to recalculate the actual debt rate costs
for 2007, 2008 and 2009 by (a) applying the
actual indicative corporate bond spread of
FortisAlberta Inc. (Fortis) on the date the debt
was issued in each of those years, (b)
corresponding the debt to the 20-year debt
terms EDTI issued for 2007 and 2008 and the
30-year debt term EDTI issued in 2009 and
(c) adding a transaction cost of five basis
points.
The Commission has reviewed
EDTI‟s calculations of cost of debt
in MFR schedules 28-1D, 28-2D,
28-1T and 28-2T and finds that
EDTI has complied with this
direction.
2.16 Direction No. 10 - The Commission directed
EDTI to use the mid-year convention in
calculating interest on notes payable in future
tariff applications.
The Commission finds that EDTI
has complied with this direction as
evidenced in its cost of debt
calculations contained in MFR
Schedule 28-2D and 28-2T.
2.17 Direction No. 11 - The Commission directed
EDTI in its next GTA to advise the
Commission on whether the City of
Edmonton (the City) would make available
Alberta Capital Financing Authority (ACFA)
financing, and what it would cost relative to
issuing debt approved in this GTA.
Having read the letter provided by
the City on its position on securing
ACFA financing for EDTI, attached
as Appendix G-4 of the application,
the Commission finds that EDTI
has complied with this direction.
The Commission is also satisfied
that EDTI has provided information
on the cost of ACFA financing but
finds that there was only limited
information on the comparative
cost of issuing debt. Nonetheless,
the Commission finds that EDTI
has essentially complied with this
direction.
2.19 Direction No. 14 - The Commission directed
EDTI to establish a deferral account to
capture any approved short term incentive
amounts in revenue requirement that are not
actually paid out, with these unpaid amounts
to be returned to the benefit of customers.
The Commission has reviewed
Section 11.2.9 of this application
and is satisfied that EDTI has
complied with the direction.

2012 Phase I and II Distribution Tariff 2012 Transmission Facility Owner Tariff EPCOR Distribution & Transmission Inc.
AUC Decision 2012-272 (October 5, 2012) • 7
2.20 Direction No. 15 - The Commission directed
EDTI to reduce the weighting of the earnings
component of its short-term incentive
program from 20 per cent to 10 per cent for
2011.
The Commission is satisfied that
the proposed short term incentive
program complies with this
direction.
2.21 Direction No. 16 - The Commission directed
EDTI to create a deferral account for any
adjustments resulting from the transition to
International Financial Reporting Standards
(IFRS) compliance, given that the impacts
may be material and not have balance impacts
on the parties.
The Commission has reviewed
EDTI‟s submission regarding this
direction in Section 11.2.10 of the
application and is satisfied that
EDTI has complied with the
direction.
2.22 Direction No. 19 - The Commission directed
EDTI, in future applications, to provide
business cases that break out forecast costs
into categories including, but not limited to,
capitalized customer and public consultation
costs, salvage proceeds if applicable,
materials, labour, engineering, contractors,
vehicles and allocated overhead.
Upon reviewing the business cases,
the Commission is satisfied that
EDTI has complied with this
direction.
2.23 Direction No. 22 - The Commission directed
EDTI in the preparation of all future business
cases to clearly describe the steps EDTI has
taken to ensure safety is not compromised
when projects are delayed which were
originally justified, in whole or in part, on the
basis of safety concerns.
Upon reviewing the business cases,
the Commission is satisfied that
EDTI has complied with this
direction.
2.24 Paragraph 417 - For each of distribution and
transmission, EDTI is directed to provide a
summary of the percentage growth of rate
base in physical measures including but not
limited to number of services, and kilometres
of conductor.
The Commission has reviewed the
information provided in
Section 2.24 of the application and
is satisfied that EDTI has complied
with this direction.
2.25 Direction No. 1 - The Commission directed
EDTI to reflect this 25 per cent premium in
costs for the new office tower by reflecting
only 80 per cent of the lease costs of the
Station Lands building in its revenue
requirement until the expiry or renegotiation
of its current 20-year lease.
The Commission has reviewed the
calculation in Table 2.25-1 showing
the disallowed amounts and is
satisfied that EDTI has complied
with this direction.

2012 Phase I and II Distribution Tariff 2012 Transmission Facility Owner Tariff EPCOR Distribution & Transmission Inc.
8 • AUC Decision 2012-272 (October 5, 2012)
Direction from Decision 2011-2115
2.26 Direction No. 1 - The Commission directed
EDTI to provide confirmation and details of
disposal of certain substation land (Plan B3,
Block 4, lots 193 and 194) at its next GTA.
The Commission has reviewed the
details of the transaction provided
in sections 9.3.3 and 9.10.6 of this
application and is satisfied that
EDTI has complied with this
direction.
19. The table below sets out a list of prior directions on vacancy calculations that EDTI has
responded to in this application that will be addressed in Section 3.2 on Vacancy rates.
Application
section
Direction from Decision 2004-067
2.1 Direction No. 6 - The board directed EDI to commence tracking vacancy rates,
commencing in the 2004 test year, for use in future GTAs.
Directions from Decision 2010-505
2.8 Paragraph 128 - The Commission directed EDTI to continue the practice of
tracking monthly data on FTE vacancies, excluding the impact of transfers,
overtime and contractor backfills
2.9 Direction No. 4 - The Commission directed EDTI to exclude transfers between
EDTI and EUI from its vacancy calculation.
2.11 Direction No. 5 - The Commission directed EDTI to exclude unpaid management
overtime from the historical vacancy rate calculation.
2.13 Direction No. 7 - The Commission directed EDTI to recalculate its average
historical vacancy rate for 2007-2009, with the unpaid overtime and transfers
between EDTI and EUI excluded from the vacancy calculation in future EDTI
GTA applications.
20. The directions below have been raised as contentious matters by interested parties or, for
other reasons, require further consideration by the Commission.
Application Section 2.5 – Direction No. 27 from Decision 2004-067
21. In this direction, the board asked EDTI to provide business cases in the form and content
described above in Direction 2.2 in respect of all capital expenditures in excess of $500,000.
22. EDTI submitted in its application that it complied with the direction and that in
Column K of Tables 12.2-1 and 13.2-1 it identified the capital project for which business cases
have been prepared for the distribution and transmission functions respectively.6
23. Upon reviewing the application, the Commission finds that EDTI has complied with the
direction. However, the Commission did not find the presentation of the information in
tables 2.2-1 and 13.2-1 helpful. The Commission asked an information request for clarification
5 Decision 2011-211: EPCOR Distribution &Transmission Inc., Disposal of Substation Land, Application
No. 1607037, Proceeding ID No. 1091, May 17, 2011. 6 Exhibit 3, application, page 185, paragraph 489.

2012 Phase I and II Distribution Tariff 2012 Transmission Facility Owner Tariff EPCOR Distribution & Transmission Inc.
AUC Decision 2012-272 (October 5, 2012) • 9
and found the format of the continuity schedules provided as AUC-EDTI-68(b) attachments 1
and 2 to be much easier to follow.7 The Commission directs EDTI, in future filings for its
transmission function, to file continuity schedules for at least three years prior to the forecast test
year or years in a format similar to AUC-EDTI-68(b) attachments 1 and 2, and to continue
submitting business cases for capital expenditures that are greater than $500,000. Further, the
Commission reminds EDTI, as per Direction 32 in Decision 2006-054, to continue preparing
business cases for capital expenditures that may last longer than one year and are in excess of
$500,000. For EDTI‟s distribution function, the Commission may request EDTI to provide this
information at the end of the performance-based regulation (PBR) term for each year of the PBR
term.
Application Section 2.10 – Direction paragraph 131 from Decision 2010-505
24. The Commission directed EDTI to provide supporting information in its historical
vacancy comparison which demonstrates that, in any area that experiences a vacancy backfilled
through paid overtime or through the use of contractors, EDTI used the approved labour dollars
for the intended workload.
25. EDTI submitted in the application that it could not comply with this direction because, by
the time it was in receipt of this direction (October 28, 2010), it was too late to implement a
formalized system for tracking this information in 2010. EDTI further added, “EDTI also
believes that even if time allowed for such a system to be put in place there is no reasonable way
for EDTI to differentiate, outside of how it currently estimates these backfills, that overtime was
incurred specifically as a result of a vacancy versus needs required by higher than forecast
workload. It is also difficult to prove the same comparison for contractors.”8
26. The UCA raised issue with EDTI‟s response in its argument9 by saying that EDTI had not
provided sufficient supporting evidence to justify the use of contractor backfills in its vacancy
rate. It stated:
Unless and until EDTI is able to provide adequate supporting data whether or not it is
tracked data or some other form of data, such as requested by the UCA for 2011 and
comply with the Commission Direction, the UCA recommends that contractor backfills
should be eliminated from the vacancy calculation if the future. [footnotes removed]
27. The Commission agrees with the UCA that EDTI has not provided sufficient supporting
evidence to justify the use of contractor backfills in its vacancy rate and finds that the direction
has not been complied with. The Commission notes that the number of new positions created is
not considered in the calculation of vacancy rates. The Commission directs EDTI for its
transmission function to develop a system to better track vacancies which takes into account
newly created positions.
Application Section 2.18 – Direction No. 13 from Decision 2010-505
28. In Decision 2010-505, the Commission directed EDTI to provide separate employee
compensation market competitiveness studies for each of EDTI, EEAI and EUI at the time of its
next rate application. While EDTI did not provide separate studies for each of EDTI, EEAI and
7 Exhibit 186.04, AUC-EDTI 68 b) Attachment 1 and Exhibit 186.05, AUC-EDTI 68 b) Attachment 2.
8 Exhibit 3, application, page 188, paragraph 494.
9 Exhibit 204.02, UCA argument, page 29, paragraph 124.

2012 Phase I and II Distribution Tariff 2012 Transmission Facility Owner Tariff EPCOR Distribution & Transmission Inc.
10 • AUC Decision 2012-272 (October 5, 2012)
EUI, the Towers Watson study did provide employee compensation information separately for
each of EDTI, EEAI and EUI. EDTI noted that the primary comparator group, as selected by
Towers Watson, included companies in comparable industries (e.g. gas and electric distribution
and transmission utilities) with similar geographic scope and complexity to EDTI and that a
study using only EDTI comparators would yield comparable results. EDTI submitted that it has
met the Commission direction from Decision 2010-505.10
29. While EDTI did not provide separate employee compensation studies for EUI, EDTI and
EEAI as directed by the Commission in Decision 2010-505, EDTI did provide separate
employee compensation information and data for each of the three companies. The Commission
considers that the separate employee compensation data provided in the application is sufficient
to satisfy the requirements of the Commission‟s direction in Decision 2010-505.
3 Issues common to distribution and transmission
30. This section addresses areas of the application where issues were raised by the
Commission or interested parties which relate to both distribution and transmission. Areas which
only relate to distribution or transmission are addressed in sections 4 and 5 respectively.
3.1 FTE forecasts
31. EDTI has applied for 797.9 full-time equivalent employees (FTEs) which represents an
increase of 55.6 FTEs over the number of FTEs approved in Decision 2010-505. Of the proposed
55.6 FTE increase, EDTI submitted that 25.3 FTEs, being approximately 45 per cent of the
additional FTEs, were added prior to the beginning of 2012 at EDTI‟s expense. EDTI argued that
this supported the need for the FTEs. Of the additional 30.4 FTEs requested by EDTI for 2012
beyond the 2011 actual level, 15.9 relate to distribution; arising from an increase of 23.7 for
capital and an offsetting reduction of 7.9 for operating. For transmission, the increase in the 2012
FTE forecast is 14.5 FTEs higher than the 2011 actual level, with 5.5 for capital and nine for
operating.
32. EDTI submitted that the forecast FTE increases in its application are required for the
following reasons:11
increased forecast workload related to growth of EDTI‟s system leading to higher levels
of operating, maintenance and repair work
higher levels of capital life cycle replacement work due to a significant increase in the
volume of required aging infrastructure replacement
33. EDTI explained that it had prepared a detailed bottom up forecast to derive the number of
FTEs that were required to meet the forecast level of work for the test period. EDTI also
explained that, given the overlapping skill sets of the employees that were needed, there was
some transfer of staff between operating and capital functions as well as between business units
10
Exhibit 208.02, EDTI argument, page 36, paragraph 110. 11
Exhibit 208.02, EDTI argument, page 9, paragraph 23.

2012 Phase I and II Distribution Tariff 2012 Transmission Facility Owner Tariff EPCOR Distribution & Transmission Inc.
AUC Decision 2012-272 (October 5, 2012) • 11
based on operational requirements.12 Further, given the cyclical nature of capital projects, EDTI
has been making greater use of contractors.
34. Tables 3 and 4 below display the overall trend of the proposed FTE increases for
distribution and transmission as compared to historical information. Since the 2011 actual levels
already include the proposed 2012 FTE increases for EDTI prior to 2012, the increases shown in
the two tables below for 2012 reflect the remaining 30.4 FTEs.13
Table 3. Distribution FTE 2007-2012 trend14
2007 (A) 2008 (A) 2009 (A) 2010 (A) 2011 (A) 2012 (F)
Operating 357.8 357.6 388.8 413.0 353.7 345.8
Capital 143.4 165.0 169.1 191.2 276.1 299.8
Total actual (A) or forecast (F) 501.2 522.6 557.9 604.2 629.7 645.6
Increase 21.4 35.3 46.3 25.5 15.9
% Increase 4.3% 6.8% 8.3% 4.2% 2.5%
Legend: (A) actual, (F) forecast
Table 4. Transmission FTE 2007-2012 trend15
2007 (A) 2008 (A) 2009 (A) 2010 (A) 2011 (A) 2012 (F)
Operating 70.8 77.4 76.3 79.6 68.0 77.0
Capital 56.3 47.6 51.3 55.4 69.8 75.3
Total actual (A) or forecast (F) 127.1 125.0 127.6 135.0 137.8 152.3
Increase (2.1) 2.6 7.4 2.8 14.5
% Increase (1.7%) 2.1% 5.8% 2.1% 10.5%
35. The revenue requirement impacts related to FTE increases for 2012 in comparison to the
2011 decision amounts were summarized as follows by EDTI:16
i. distribution: $3.5 million of the overall total $17 million increase
ii. transmission: $1.9 million of the overall total $9 million increase
36. None of the interested parties raised concerns with regard to the combined 55.6 FTE
increase for distribution and transmission proposed in the application for 2012.
Commission findings
37. EDTI has explained the increase in FTEs as being due to increases in workload related to
growth of its system and higher levels of capital life cycle replacement work.
12
Exhibit 203.02, EDTI rebuttal evidence, page 14, lines 2-6. 13
Distribution 15.9 FTEs + transmission 14.5 FTEs.
14 Exhibit 208.02, EDTI argument, page 8; Exhibit 186.06, information response AUC-EDTI-70, Attachment 1,
Schedules 5-5 and 15-9, and Decision 2010-505, pages 19-20, Tables 4-7. 15
Ibid. 16
Exhibit 167.03, information response AUC-EDTI-16, attachments 1 and 2.
2012 Phase I and II Distribution Tariff 2012 Transmission Facility Owner Tariff EPCOR Distribution & Transmission Inc.
12 • AUC Decision 2012-272 (October 5, 2012)
38. To allow comparability of workload from year to year, distribution capital expenditures
shown in the table below have been adjusted downward to account for distribution work
performed by the transmission function.
Table 5. Distribution capital expenditures 2007-2012 trend ($ millions)17
2007 (A) 2008 (A) 2009 (A) 2010 (A) 2011 (D) 2011 (A) 2012 (F)
Distribution capital expenditures 41.1 52.4 52.4 86.2 68.1 92.9 89.1
Less: distribution to transmission contributions
0.5 13.6 12.5 8.2 4.9
Adjusted distribution capital expenditures*
41.1 52.4 51.9 72.6 55.6 84.7 84.2
*Life cycle capital expenditures included in above total
12.1 20.4 21.3 29.7 26.2
Legend: (A) actual, (D) decision, (F) forecast
39. The adjusted distribution capital expenditures displayed in the table above show
increasing capital expenditures from 2007 to 2011 with a slight decrease in 2012.
40. Transmission capital expenditures shown in the table below have been adjusted to allow
comparability of workload from year to year. The Heartland project, an AESO-directed project
for which EDTI is an owner but has limited participation has been removed, and customer
contributions have been added back to the total provided on EDTI‟s schedule because these
contributions reduced the capital expenditures shown.
Table 6. Transmission capital expenditures 2007-2012 trend ($ millions)18
2007 (A) 2008 (A) 2009 (A) 2010 (A) 2011 (D) 2011 (A) 2012 (F)
Transmission capital expenditures 59.4 59.1 32.0 35.0 24.2 58.6 14.6
Less: Heartland project 7.5 5.3 3.5 28.1 (43.7)
Add: Customer contributions 8.2 9.6 6.6 22.7 4.9
Adjusted transmission capital expenditures*
59.4 59.1 32.7 39.3 27.3 53.2 63.1
*Life cycle capital expenditures included in above total
13.4 11.7 9.7 14.9 16.6
Legend: (A) actual, (D) decision, (F) forecast
41. The adjusted transmission capital expenditures set out in the table above decrease in 2009
and 2010 and increase in each of 2011 and 2012.
42. Recognizing that EDTI‟s FTEs are impacted by the use of contractors, the Commission
examined the extent to which EDTI has used and expects to use contractors in performing its
capital work.
17
Exhibit 186.04/05, information response AUC-EDTI-68 (b), attachments 1 -2 and Exhibit 186.07/09,
information response AUC-EDTI-71, attachments 1 and 3. 18
Ibid.

2012 Phase I and II Distribution Tariff 2012 Transmission Facility Owner Tariff EPCOR Distribution & Transmission Inc.
AUC Decision 2012-272 (October 5, 2012) • 13
43. In response to an information request on FTE levels in relation to capital activity, EDTI
provided the following tables indicating the proportion of work done by contractors and internal
resources:19
Table 7. Distribution capital expenditures completed by EDTI resources vs. contractors – Table AUC-EDTI-69-1
A 2009 (A)
B 2010 (A)
C 2011 (A)
D 2012 (F)
1 % of contractor expenses 16.55 24.40 31.24 26.14
2 % of internal expenses 83.45 75.60 68.76 73.86
3 Total 100.00 100.00 100.00 100.00
Table 8. Transmission capital expenditures completed by EDTI resources vs. contractors – Table AUC-EDTI-69-2
A 2009 (A)
B 2010 (A)
C 2011 (A)
D 2012 (F)
1 % of contractor expenses 27.99 43.44 52.06 58.95
2 % of internal expenses 72.01 56.56 47.94 41.05
3 Total 100.00 100.00 100.00 100.00
44. As the tables are based on assumptions, the Commission considers the data to be
approximate. The general trend for distribution shows that approximately three quarters of
distribution capital is constructed using internal resources, i.e. capital FTEs. For transmission
capital, the trend from 2009 to the present shows an increasing reliance on the use of contractors.
45. The Commission also considered the possible impact on FTEs from the change in
accounting to IFRS in 2011. As noted in Decision 2010-505,20 there was a shift of approximately
60 operating FTEs to capital for distribution and 14 operating FTEs to capital for transmission,
as a result of this accounting change. Although FTEs from 2007 to 2010 are presented on a
different basis, data for 2011 and 2012 was prepared in accordance with IFRS making these two
years comparable.
46. An additional perspective from which to consider the forecast FTE numbers is to
examine past experience and the forecasting accuracy of EDTI. Summaries and comparisons of
EDTI‟s historical and proposed FTEs for distribution and transmission are shown in the
following tables:
19
Exhibit 186.02, information request AUC-EDTI-69(c). 20
Decision 2010-505, page 21, paragraph 113.
2012 Phase I and II Distribution Tariff 2012 Transmission Facility Owner Tariff EPCOR Distribution & Transmission Inc.
14 • AUC Decision 2012-272 (October 5, 2012)
Table 9. Distribution FTE forecast accuracy
2007 2008 2009 2010 2011
Operating 361.4 377.1 384.4 417.8 356.4
Capital 158.6 161.5 152.0 188.9 251.6
Total decision 520.0 538.6 536.4 606.7 608.0
Operating 357.8 357.6 388.8 413.0 353.7
Capital 143.4 165.0 169.1 191.2 276.1
Total actual 501.2 522.6 557.9 604.2 629.7
Total over (under) (18.8) (16.0) 21.5 (2.5) 21.7
% Total over (under) (3.6%) (3.0%) 4.0% (0.4%) 3.6%
47. Table 9 above shows that the actual number of distribution FTEs hired was lower in
2007, 2008 and 2010 than was approved in the respective decisions, but higher for 2009 and
2011. Table 10 below identifies separately the distribution FTEs as operating and capital. For
distribution, with the exception of 2009, actual operating FTEs have been lower than the level
approved while actual capital FTEs, with the exception of 2007, have been higher than approved.
Table 10. Distribution FTE forecast accuracy by category
2007 2008 2009 2010 2011
Operating - approved 361.4 377.1 384.4 417.8 356.4
Operating - actual 357.8 357.6 388.8 413.0 353.7
Total operating over (under) (3.6) (19.5) 4.4 (4.8) (2.7)
Capital – approved 158.6 161.5 152.0 188.9 251.6
Capital – actual 143.4 165.0 169.1 191.2 276.1
Total capital over (under) (15.2) 3.5 17.1 2.3 24.5
Table 11. Transmission FTE forecast accuracy
2007 2008 2009 2010 2011
Operating 77.6 78.9 78.4 87.8 70.4
Capital 60.4 56.3 45.6 50.0 63.7
Total decision 138.0 135.2 124.0 137.8 134.3
Operating 70.8 77.4 76.3 79.6 68.0
Capital 56.3 47.6 51.3 55.4 69.8
Total actual 127.1 125.0 127.6 135.0 137.8
Total over (under) (10.9) (10.2) 3.6 (2.8) 3.6
% Total over (under) (7.9%) (7.5%) 2.9% (2.0%) 2.7%
48. Table 11 above shows that the actual number of transmission FTEs hired was lower in
2007, 2008 and 2010 than was approved in the respective decisions, but higher for 2009 and
2011. Table 12 below identifies separately the transmission FTEs as operating and capital for
each year. For transmission, actual operating FTEs have been lower than the level approved in
each of the five years while actual capital FTEs, with the exception of 2007 and 2008, have been
higher than approved.

2012 Phase I and II Distribution Tariff 2012 Transmission Facility Owner Tariff EPCOR Distribution & Transmission Inc.
AUC Decision 2012-272 (October 5, 2012) • 15
Table 12. Transmission FTE forecast accuracy by category
2007 2008 2009 2010 2011
Operating – approved 77.6 78.9 78.4 87.8 70.4
Operating - actual 70.8 77.4 76.3 79.6 68.0
Total decision over (under) (6.8) (1.5) (2.1) (8.2) (2.4)
Capital - approved 60.4 56.3 45.6 50.0 63.7
Capital – actual 56.3 47.6 51.3 55.4 69.8
Total actual over (under) (4.1) (8.7) 5.7 5.4 6.1
49. The primary reasons provided by EDTI for the FTE increases were related to increased
workload arising from the growth of EDTI‟s system and higher levels of capital life cycle
replacement related to aging infrastructure. The Commission does not consider the fact that
EDTI hired more FTEs in 2011 than had been approved to be determinative of the need for the
FTEs. Therefore, the Commission will consider the proposed increase in FTEs using a two-step
process, from the 2011 approved level to the 2011 actual level, and from the 2011 actual level to
the 2012 forecast level that EDTI has proposed.
50. In the first step of the two step process, the Commission has reviewed the actual adjusted
capital expenditure levels for both distribution and transmission for 2011 as shown in tables 5
and 6 above. These tables show that distribution and transmission adjusted capital expenditures
were higher than the approved levels by $29.1 million21 and $25.9 million22 respectively. The
related higher-than-forecast distribution and transmission capital additions for 2011 have been
allowed as opening rate base adjustments for 2012, in sections 4.1.1 and 5.1.1 of this decision.
The 25.3 FTEs in excess of the approved 2011 levels as presented in tables 9 and 11 were capital
FTEs.
51. For these reasons, the Commission will accept the actual 2011 FTEs as the starting point
for step two of the assessment.
52. For distribution, the Commission notes that distribution capital expenditures forecast for
2012 are lower than 2011 actual levels, both in aggregate and for the capital expenditures life
cycle replacement projects. Further, as shown in Table 7 above, generally three quarters of
distribution capital expenditures are constructed using internal resources. As distribution capital
expenditures are forecast to decrease and there is a similar forecast decrease in the use of
contractors, the Commission finds no support for the forecast increase in distribution capital FTE
levels. The Commission is not persuaded that distribution capital FTE increases beyond 2011
actual levels, as forecast by EDTI, are required and therefore, the Commission directs that the
2012 distribution capital FTEs be held to the 2011 actual levels.
53. For transmission, the proposed FTE increase in the 2012 FTE forecast is 14.5 FTEs
higher than the 2011 actual level, with 5.5 forecast for capital FTEs and nine forecast for
operating FTEs.
54. The 2012 adjusted forecast capital expenditures for transmission shown in Table 6 above
exceeds the level of 2011 actual expenditures; however, construction of capital expenditures by
21
$29.1 = distribution adjusted actual capital expenditures $84.7 million - $55.6 million approved. 22
$25.9 = transmission adjusted actual capital expenditures $53.2 million - $27.3 million approved.

2012 Phase I and II Distribution Tariff 2012 Transmission Facility Owner Tariff EPCOR Distribution & Transmission Inc.
16 • AUC Decision 2012-272 (October 5, 2012)
internal resources as shown in Table 8 is forecast to decrease, somewhat mitigating the need for
increased capital FTEs. However, the Commission finds that the forecast percentage increase in
capital FTEs of 7.9 per cent23 is reasonable in view of the 18.624 per cent forecast increase in
capital expenditures.
55. With regard to the operating FTEs requested by EDTI, relative to the 2011 FTEs as
shown in tables 3 and 4, the Commission considers that the relative size and offsetting nature of
the reduction in distribution operating FTEs compensates to some extent for the proposed
increase in transmission operating FTEs, given the transfer of staff between business units based
on operational requirements as stated by EDTI.25
56. For all of the reasons provided above, the Commission finds that capital FTE levels for
distribution in the 2012 test year shall be reduced by 23.7 FTEs and, instead, be based on the
2011 actual levels. The Commission directs EDTI to reflect this reduction in distribution capital
FTEs along with all related costs in the compliance application and to provide a schedule with all
resulting adjustments.
3.2 Vacancy levels
57. The vacancy rate represents a ratio of the number of vacant FTE positions compared to
the total approved FTEs for a given period, and it is applied as a reduction against the forecast
labour expenses to reflect that a certain number of positions will be vacant in the given period,
thereby reducing the forecast labour expenses. The higher the vacancy rate used in the forecast
period, the greater the reduction applied against the total potential labour dollars for the proposed
FTE level.
58. In the application, EDTI applied a 2.5 per cent vacancy rate for its salaried employees,
with the exception of the meter reading staff, and a zero per cent vacancy rate for all labour staff.
EDTI stated that it calculated the 2.5 per cent vacancy rate used for both distribution and
transmission functions based on an average because these business functions were highly
integrated with staff being transferred between business units based on operational
requirements.26 For (hourly) labour, EDTI stated that it did not apply a vacancy rate because it
forecast its labour requirements on a gross basis using a bottom up calculation based on its
forecast operating and capital work requirements. EDTI submitted it did not apply a vacancy rate
for meter reader staff because it used a detailed bottom up calculation of the “net” FTEs required
to perform its meter reading function.
59. EDTI stated its zero per cent vacancy rate approach for labour and meter reader staff
reflects the nature of their work. EDTI indicated that labour and meter reader staff must complete
the forecast work level and, if a particular employee is unable to fulfill his or her function, then
EDTI has no choice but to backfill that employee to ensure that the work levels are maintained.
23
7.8% = transmission capital 2012 FTE forecast increase of 5.5 / transmission 2011 capital FTE actual total
of 69.8. 24
18.6 % = transmission 2012 adjusted capital expenditure increase of $9.9 million / transmission 2011 adjusted
capital expenditures actual total of $53.2 million. 25
Exhibit 203.02, EDTI rebuttal evidence, page 14, lines 2-6. 26
Exhibit 203.02, EDTI rebuttal evidence, page 14, lines 2-6.

2012 Phase I and II Distribution Tariff 2012 Transmission Facility Owner Tariff EPCOR Distribution & Transmission Inc.
AUC Decision 2012-272 (October 5, 2012) • 17
60. EDTI‟s proposed 2.5 per cent vacancy rate was based on a three-year average of both the
transmission and distribution functions using 2008-2010 actuals, as shown in tables 13 and 14
below for distribution and transmission respectively. EDTI did not propose to recalculate its
three-year average of vacancy rates to reflect 2011 actual information, which had become
available during the course of the proceeding, to remain consistent with its approach with regard
to all of its forecasts in the application.
61. The vacancy rate calculations reflected backfilling by contractors and paid overtime. It
was EDTI‟s position that the FTE increases included in the 2012 test year mitigated a portion of
the negative and small vacancies experienced in 2009 and 2010; thereby supporting the use of
the blended 2.5 per cent vacancy rate.27
62. EDTI indicated that there was no reasonable way to differentiate between overtime and
contractor costs incurred as a result of a vacancy as opposed to overtime and contractor costs
incurred to meet higher than forecast workload.28 It was EDTI‟s position that the estimates of
paid overtime and contractor backfill were conservative, and that they significantly understated
the actual level of backfill. EDTI explained its view of vacancies as follows:
[170]….EDTI notes that when it experiences higher than forecast work levels, it uses
paid overtime and contractors to meet those work levels. What is relevant on an actual
basis is not solely the work that EDTI had forecast and the FTEs necessary to accomplish
that work, but the actual work demand it is faced with and the total number of FTEs
actually necessary to meet that work demand. In a very real sense, higher than forecast
workload results in “vacancy”, as EDTI does not have the resources to accomplish the
additional workload. By using paid overtime and hiring contractors (in addition to hiring
additional staff), EDTI “backfills” the entire “vacancy” amount, which includes not only
any shortfall in manpower vis-à-vis EDTI‟s original FTE forecast, but also EDTI‟s
shortfall in resources necessary to meet the higher than forecast workload.29
63. EDTI stated that, while it had used the same approach to calculate backfills for 2012 as in
its previous application, it had taken steps to improve the calculation where possible. For
example, EDTI reviewed contractor use to try to determine which contractors had been used to
backfill vacancies (e.g., engineering contractors to backfill work of salaried engineering staff).
Conservative estimates of 25 per cent of paid overtime for salaried engineering staff were used
as vacancy backfill given that a precise number cannot be determined. EDTI confirmed that, in
accordance with directions 4 and 5 from Decision 2010-505, all unpaid management overtime
and transfers of staff with EUI had been excluded from the backfill calculations.
64. The UCA argued that the blended vacancy rate developed by EDTI was not calculated
based on the correct three-year historical average of vacancy rates and that not enough
supporting information had been provided by EDTI to allow backfilling by contractors and
overtime to be reflected in the vacancy rate calculations. The UCA submitted that historical
vacancy information and forecast work demand were distinct in purpose, and backfills related to
incorrect forecasts of work demand should not be included in the historical vacancy information.
27
Exhibit 3, application, page 72, paragraph 186. 28
Exhibit 3, application, page 64, paragraph 168. 29
Exhibit 3, application, pages 64-65, paragraph 170.

2012 Phase I and II Distribution Tariff 2012 Transmission Facility Owner Tariff EPCOR Distribution & Transmission Inc.
18 • AUC Decision 2012-272 (October 5, 2012)
Eliminating contractor backfills and overtime from the vacancy calculations would also simplify
the tracking and reporting of vacancy calculations.30
65. The UCA recommended that separate vacancy rates should be used for distribution and
transmission as they had separate revenue requirements and this practice was used by AltaLink
Management Ltd. (AltaLink), ATCO Electric Ltd. (ATCO Electric), ATCO Gas, and AltaGas
Utilities Inc. (AltaGas). The UCA estimated that the distribution vacancy rate should be
3.9 per cent instead of the 3.4 per cent calculated by EDTI. With regard to transmission, the
UCA proposed that the 2.5 per cent included in the application should be used.
66. EDTI rejected the UCA‟s calculation of vacancy rates with regard to the exclusion of
contractor backfills and overtime, arguing that it had used the calculation which was accepted by
the Commission in recent decisions. EDTI stated that it had followed Commission directions
from Decision 2010-505 to track and support specific vacancy information to the extent possible
given the timing of the decision and that it was not possible to retroactively track data from
previous years.
67. EDTI challenged the UCA position that historical vacancy information and work demand
are one sided since the vacancy calculation began with a calculation of the difference between
approved and actual amounts, which captures all changes in FTEs regardless of the reason. For
this reason, EDTI argued that all decreases in FTEs should be considered as well as the
increases.
68. EDTI submitted that use of a blended distribution and transmission vacancy rate was
reasonable due to the integrated nature of the two functions, but if the UCA proposal to use
3.9 per cent was accepted for distribution, then the negative 2.09 per cent vacancy rate for
transmission should be used, resulting in a blended rate of 0.91 per cent which is much lower
than the vacancy rate proposed by EDTI of 2.5 per cent.
Commission findings
69. The Commission has prepared the following tables and analysis to better understand the
forecast vacancy rates proposed in the application
70. Tables 13 and 14 below present the approved and actual number of FTEs by type of
employee within each of distribution and transmission. Each table also shows the variance by
type of employee resulting in the vacancy factor before any backfilling is included as an
adjustment. Each table includes the vacancy factor after backfilling is considered, as provided by
EDTI, along with the three-year historical vacancy factor.
30
Exhibit 189.02, UCA intervener evidence – Radway, page 28, A34.

2012 Phase I and II Distribution Tariff 2012 Transmission Facility Owner Tariff EPCOR Distribution & Transmission Inc.
AUC Decision 2012-272 (October 5, 2012) • 19
Table 13. Distribution vacancy information by type (FTEs)31
2008 2009 2010 2011 2012 (F)
Salary - meter readers 70.6 73.4 73.8 71.9
Salary - other 171.7 172.3 190.6 190.2
Labour 296.3 290.7 342.3 345.9
Total decision FTEs 538.6 536.4 606.7 608.0
Salary - meter readers 72.1 72.5 72.0 69.6 73.9
Salary - other 151.1 166.2 185.8 198.4 207.5
Labour 299.4 320.0 346.3 361.7 364.2
Total actual FTEs 522.6 558.7 604.2 629.7 645.6
Salary - meter readers (over)under (1.5) 0.9 1.8 2.3
Salary - other (over)under 20.6 6.1 4.8 (8.2)
Labour (over)under (3.1) (29.3) (4.0) (15.8)
Total (over) under 16.0 (22.3) 2.5 (21.7)
% Total (over) under 3.0% (4.2%) 0.4% (3.6%)
vacancy factors before backfill
Salary - meter readers (2.1%) 1.2% 2.4% 3.2%
Salary - other 12.0% 3.5% 2.5% (4.3%)
Labour (1.0%) (10.1%) (1.2%) (4.6%)
Vacancy factors after backfill
Salary - meter readers not used not used not used not used
Salary - other 6.1% 3.1% 0.8% (4.9%)
Labour not used not used not used not used
EDTI 3-year historical factor 3.4%
71. Table 13 above (using 2011 actual information) shows that, of 630 FTEs for distribution
(forecast 608 FTEs), only the salary – other employee type (which includes approximately
200 FTEs) had a vacancy rate of 2.5 per cent applied by EDTI in the application. The table
section displaying vacancy factors by employee type before backfill shows that, for each year
being compared, the labour category had a negative vacancy rate, but the remaining two
categories experienced positive or negative vacancy rates depending on the year.
72. Table 14 below (using 2011 actual information) shows that, of 138 FTEs for transmission
only, the salary employee type (which includes about 50 FTEs) had a vacancy rate of 2.5 per
cent applied by EDTI in the application. The table section displaying vacancy factors by
employee type before backfill shows that, for each year being compared, the labour category had
a positive vacancy rate, but the remaining category experienced positive or negative vacancy
rates depending on the year. In 2011, the negative vacancy rates are due in part to the hiring of
22 additional FTEs.
31
Exhibit 208.02, EDTI argument, page 8; Exhibit 186.06, information response AUC-EDTI-70, Attachment 1,
schedules 5-5 and 15-9; and Decision 2010-505, pages 19-20, Tables 4-7.

2012 Phase I and II Distribution Tariff 2012 Transmission Facility Owner Tariff EPCOR Distribution & Transmission Inc.
20 • AUC Decision 2012-272 (October 5, 2012)
Table 14. Transmission vacancy information by type (FTEs)32
2008 2009 2010 2011 2012 (F)
Salary 44.6 42.6 48.1 46.8
Labour 90.6 81.4 89.7 87.4
Total decision FTEs 135.2 124.0 137.8 134.3
Salary 42.8 46.2 46.1 53.4 61.3
Labour 82.2 80.6 88.9 84.5 91.0
Total actual FTEs 125.0 126.8 135.0 137.9 152.3
Salary (over) under 1.8 (3.6) 2.0 (6.6)
Labour (over) under 8.4 0.8 0.8 2.9
Total over (under) 10.2 (2.8) 2.8 (3.6)
% Total over (under) 7.5% (2.2%) 2.0% (2.7%)
vacancy factors before backfill
Salary 4.0% (8.5%) 4.0% (14.1%)
Labour 9.3% 1.0% 0.9% 3.3%
Vacancy factors after backfill
Salary 3.8% (10.1%) 0% (14.6%)
Labour not used not used not used not used
EDTI 3-year historical factor (2.1%)
73. The Commission has reviewed the relative sizes of the salaried employee groups to
which EDTI has applied a blended vacancy factor of 2.5 per cent for both distribution and
transmission. The number of distribution salary – other FTEs is approximately four times larger
than the transmission salary FTEs, using 2011 actual information, based on the tables shown
above.
74. The vacancy factors before backfills shown in the tables above display a trend where
distribution has a negative vacancy factor for labour FTEs but transmission has a positive
vacancy factor for the same category. Further, the salary FTE categories for each of distribution
and transmission experience significantly different vacancy factors, before backfills, in the same
historical year and across years.
75. The Commission, after considering the above analysis, accepts the UCA‟s position that
separate vacancy factors should be applied to each of distribution and transmission, as is the
practice for other Alberta utilities such as AltaLink, ATCO Electric, ATCO Gas, and AltaGas,
because separate revenue requirements are approved for distribution and transmission.
76. For the above reasons, the Commission finds that EDTI should apply a separate vacancy
rate for distribution and transmission rather than use a blended overall rate, as proposed in the
application. In addition, the Commission has considered whether the vacancy rates should be on
a gross or net basis.
77. With respect to the issue of whether the vacancy rate should be gross or net, the
Commission recognizes the complexity and subjective nature of backfill calculations being
applied against the “gross” vacancy rates to derive “net” vacancy rates which are then used to
32
Ibid.

2012 Phase I and II Distribution Tariff 2012 Transmission Facility Owner Tariff EPCOR Distribution & Transmission Inc.
AUC Decision 2012-272 (October 5, 2012) • 21
forecast vacancies. The UCA argued that EDTI had not adequately supported the contractor and
overtime backfills used in the application. The UCA submitted that eliminating the backfill
calculations would simplify tracking and reporting of vacancy calculations. Further, while EDTI
explained that it had taken additional steps to improve backfill calculations where possible, it
stated there was no reasonable way to differentiate contractor costs and overtime resulting from
vacancies rather than higher-than-forecast workload.
78. To address the subjective nature of approximating “net” vacancy rates, and in
consideration of the inability to differentiate backfill information between vacancy related
backfills and higher forecast workload, the Commission finds that gross vacancy rates shall be
used instead. Gross vacancy rates can be calculated for historical comparison, as shown in
tables 13and 14, and comparison between approved FTEs and actual FTEs then becomes a
straightforward calculation. The Commission notes that the existing vacancy calculation does not
take into account the number of actual new positions hired during the period, which were not
part of the approved forecast FTE level, and that this has the effect of understating the actual
vacancy rate.
79. Accordingly, for distribution, the Commission directs that a gross vacancy rate of 3.4 per
cent33 is to be applied to the salary – other category, based on calculating the four year average of
the vacancy factors before backfills, as shown in Table 13 above. For transmission, the
Commission directs that no vacancy rate shall be applied to the salary category for the 2012 test
year, because in the Commission‟s view use of a negative vacancy factor would provide more
than 100 per cent of salary for each FTE to which it is applied. Additionally, the Commission
does not agree with EDTI‟s calculation of its negative vacancy factor because it fails to take into
account FTEs in excess of the approved forecast amount.
80. With regard to Section 2.8 of the application on the tracking of monthly FTE vacancy
data, the Commission disagrees with EDTI‟s position that it has complied with this direction.
Tables 1.4.3-3 and 1.4.3-6 for distribution and transmission vacancy respectively provide
monthly information for salaried employees but do not provide any information on the labour
FTE category, which is the dominant FTE category for both business units. The Commission
finds that EDTI has complied with the directions shown in sections 2.9, 2.11 and 2.13 of the
application. However, EDTI has only partially complied with directions in sections 2.1 and 2.8
of the application, having only tracked vacancy rates for salaried employees. For transmission,
EDTI is directed to track monthly data on each FTE category as shown in Table 14 above, and to
provide this information as part of future filings. EDTI is also directed to track new positions that
are hired but were not part of the approved FTE level and to reflect these in the vacancy
calculations. For EDTI‟s distribution function, the Commission may request EDTI to provide
this information at the end of the PBR term for each year of the PBR term.
3.3 Salary escalations
81. EDTI provided details with respect to employee compensation in Section 1.6.1 of the
application. In the application, EDTI included a salary escalation factor of four per cent for non-
union employees and three per cent for all of its union employees.
82. Consistent with previous applications, EDTI retained Towers Watson to provide an
assessment of the market competitiveness of EPCOR‟s compensation and benefits. EDTI stated
33
3.4% = (12% + 3.5% + 2.5% - 4.3%)/4 years.

2012 Phase I and II Distribution Tariff 2012 Transmission Facility Owner Tariff EPCOR Distribution & Transmission Inc.
22 • AUC Decision 2012-272 (October 5, 2012)
that the methodology for the Towers Watson review in the application was consistent with the
reviews conducted in 2004, 2006 and 2009.34 EDTI noted that Towers Watson defines market
competitiveness as +/- 10 per cent of the market 50th percentile.35
83. EDTI stated that as an overall objective the EPCOR group seeks to ensure that total
employee compensation is competitive and targets mid-market, or 50th percentile, for total
employee compensation.36
84. EDTI noted that the Towers Watson analysis showed that, on an overall basis, EPCOR‟s
non-union positions are five per cent below the market median for target total direct
compensation. Based on this, Towers Watson recommended a range of escalation for non-union
salaries of 3.5 per cent to 4.5 per cent. EDTI‟s forecast reflects the escalation of all non-union
salaries at 4.0 per cent, the mid-point of Towers Watson‟s recommended range. EDTI stated that
the proposed salary escalation of four per cent for non-union employees will ensure these
positions do not fall further behind the market median.37
85. EDTI stated that EPCOR completed its negotiations for a new three year collective
agreement with the Civic Service Union (CSU) on October 11, 2011. Based on the terms of the
collective agreement, the actual salary and labour escalators for CSU 52 unionized employees
were 2.75 per cent, 3.00 per cent and 3.50 per cent for 2011, 2012 and 2013 respectively.
Accordingly, EDTI applied a 3.00 per cent salary escalation to the base salaries for all CSU
employees for 2012.38
86. EDTI stated that it had successfully concluded negotiations for a new three year
collective agreement with the International Brotherhood of Electrical Workers (IBEW) on
April 21, 2010. Based on the terms of this agreement, the actual salary escalator for IBEW
unionized employees was 3.00 per cent for each of 2010, 2011 and 2012. Accordingly, EDTI
applied a 3.00 per cent salary escalation to the base salaries for all IBEW employees for 2012.39
87. EDTI also stated that it was working with the IBEW to reclassify some positions as set
out in a letter of understanding. EDTI stated that it will reclassify approximately 60 employees
over eight different job classes and will adjust the compensation levels to address specific
instances where the current compensation levels do not adequately reflect the scope of the
position under the new job class.40 EDTI stated that it has included a $0.25 million increase in its
total compensation to reflect that 2012 pay levels for some positions are likely to rise under the
reclassification process.41 EDTI stated that the benefits of developing the job reclassification
descriptions are not quantified because the benefit of being able to use employees within a labour
class interchangeably is already reflected in its forecasting methods. EDTI also stated that the
34
Exhibit 208, EDTI argument, page 35, paragraph 105. 35
Exhibit 208, EDTI argument, page 35, paragraph 106. 36
Exhibit 208, EDTI argument, page 35, paragraph 103. 37
Exhibit 208, EDTI argument, page 37, paragraphs 112 and 113. 38
Exhibit 208, EDTI argument, page 37, paragraph 116. 39
Exhibit 208, EDTI argument, page 38, paragraph 117. 40
Exhibit 208, EDTI argument, page 38, paragraphs 118 and 119. 41
Exhibit 208, EDTI argument, page 39, paragraph 120.

2012 Phase I and II Distribution Tariff 2012 Transmission Facility Owner Tariff EPCOR Distribution & Transmission Inc.
AUC Decision 2012-272 (October 5, 2012) • 23
reclassification effort will better align EDTI‟s actual staffing flexibility with that already
assumed in its budgeting process.42
88. The UCA argued that as noted in the Towers Watson report, the total target cash for EUI
union positions is 10 per cent over market for stratum two, nine per cent over market for stratum
one and nine per cent over market in total for all EUI union positions. The UCA stated that given
that Towers Watson defines market competitiveness as +/- 10 per cent of the market 50th
percentile and that union positions are already at the upper end for market competitiveness, there
should be no increases in union wages included in 2012 revenue requirement.43
89. EDTI responded to this issue in reply argument. EDTI stated that the escalation rate of
3.0 per cent should be approved because:
it reflects actual wage increases in Canada as the Conference Board of Canada is
forecasting a 3.2 per cent growth in wages and salaries per employee in Alberta
based on the terms of the CSU and IBEW agreements, it will be reflected in what EDTI
actually pays its employees in 2012
the evidence shows that EDTI‟s 2011 union wages are within 10 per cent of the market
median in 2011 and applying the 3 per cent escalator will not bring union wages outside
the range but keep it in a similar position, as the escalator reflects the expected general
escalation of wages in Canada
applying no escalation would result in a reduction in wages on a real dollar basis44
90. The UCA also addressed the issue of the reclassification of some union positions set out
in the letter of understanding with the IBEW. The UCA stated that, since EDTI did not include
any of the benefits of this agreement in its application, the $0.5 million cost should be excluded
from EDTI‟s revenue requirement. The UCA also stated that it was not appropriate to include
this cost in EDTI‟s revenue requirement in 2012 given that 2012 rates will form the going-in
rates for PBR for EDTI.
91. EDTI noted that the UCA incorrectly cited $0.5 million as the cost included in the
application and stated that the increase to EDTI is actually $0.25 million. EDTI also stated that it
had outlined the intangible benefits of the reclassification and that these intangible benefits were
already included in the application. EDTI argued that the $0.25 million cost reflects EDTI‟s
actual labour expense, that it was prudently incurred and there is no reason why known labour
costs should not be in the 2012 revenue requirement. Finally, EDTI stated that the fact that 2012
is the going-in year for rates is not a justification to make “random” reductions in forecast costs
and would be contrary to the Commission‟s statutory obligation to approve just and reasonable
rates based on EDTI‟s prudent costs.45
Commission findings
92. The Towers Watson analysis showed that, on an overall basis, EDTI‟s non-union
positions are five per cent below the market median for target total direct compensation. The
42
Exhibit 208, EDTI argument, page 39, paragraph 121 43
Exhibit 204, UCA argument, page 9, paragraphs 24, 26 and 27. 44
Exhibit 211, EDTI reply argument, pages 19 and 20, paragraphs 58 to 62. 45
Exhibit 211, EDTI reply argument, page 18, paragraph 55.

2012 Phase I and II Distribution Tariff 2012 Transmission Facility Owner Tariff EPCOR Distribution & Transmission Inc.
24 • AUC Decision 2012-272 (October 5, 2012)
Commission approves the escalation factor of four per cent for EDTI s non-union employees for
2012.
93. While the UCA stated that the Towers Watson report showed that the target total cash for
all EUI union positions is nine per cent over market, the Commission‟s review of the Towers
Watson report shows that the target total cash for all EDTI union positions is five per cent over
market.46 Applying a three per cent escalation in 2012 will still keep the target total cash for the
average EDTI union position within 10 per cent of the market median. The Commission finds the
salary escalation of three per cent for both CSU and IBEW union employees for 2012 to be
reasonable and approves the three per cent escalation factor rate as filed.
94. With respect to the $0.25 million salary adjustment for IBEW employees, the
Commission accepts EDTI‟s submission that the reclassification effort will give EDTI the
benefit of being able to use employees within a labour class interchangeably and this will be of
benefit to customers. The Commission approves the $0.25 million increase in total compensation
for 2012.
3.4 Cost escalations
95. As in previous EDTI GTA‟s, EDTI retained Dr. David Ryan of the University of Alberta
to provide forecast escalators to be used in the application. EDTI provided Dr. Ryan‟s Forecast
Values for Escalators for 2012 report in Appendix G-4 of the application. The following table
provides a summary of the historical and forecast values for the various escalators that were
recommended by Dr. Ryan:
Table 15. Summary of escalators
2008 (A) 2009 (A) 2010 (A) 2011 (F) 2012 (F)
Contractor costs 5.0% -3.2% 5.8% 4.0% 3.2%
Other costs 3.1% -0.1% 1.0% 2.2% 2.2%
Material costs 1.3% 2.7% -2.1% 1.2% 3.2%
Legend: (A) actual, (F) forecast
96. Dr. Ryan‟s recommended 2012 escalation factor of 3.2 per cent for contractor costs was
based on the Conference Board of Canada‟s medium-term forecast, as at July 19, 2011, for
growth in wages and salaries per employee in Alberta.
97. In developing the recommended escalation factor of 2.2 per cent for other costs, Dr. Ryan
calculated an average of the most recent forecast of the inflation rate for 2012 for Alberta from
the Conference Board of Canada, the Bank of Montreal, the TD Bank Financial Group, the Royal
Bank of Canada and the Canadian Imperial Bank of Commerce.
98. In developing the recommended forecast escalator for material costs, Dr. Ryan ran a
regression on the industrial price index for industrial electrical equipment (Statistics Canada
series number V53434263) and the consumer price index for Canada (Statistics Canada CanSIM
II Series V41693271) using actual data for the period 1997 to 2010. Dr. Ryan stated that there
was a strong and statistically significant relationship between these two Statistics Canada series.
Using this estimated relationship and a forecast of the consumer price index for Canada (from
46
Exhibit 78, Appendix G-2, 2011 Competitive Compensation and Benefits Analysis, Towers Watson, page 18.

2012 Phase I and II Distribution Tariff 2012 Transmission Facility Owner Tariff EPCOR Distribution & Transmission Inc.
AUC Decision 2012-272 (October 5, 2012) • 25
the Conference Board of Canada‟s July 19, 2011 forecast) Dr. Ryan developed a forecast of the
industrial price index for 2011 and 2012. The growth in the forecast industrial price index from
2011 to 2012 was 3.2 per cent, which is Dr. Ryan‟s recommended escalation factor for material
costs.
99. While the interveners requested further information through information requests, none
of the interveners addressed any of the proposed escalators in either argument or reply argument.
Commission findings
100. The Commission has reviewed the report developed by Dr. Ryan and considers the
methodology utilized by Dr. Ryan and the recommended escalation factors for contractor,
material and other costs to be reasonable. The Commission approves the forecast escalation
factors for contractor, material and other costs as filed by EDTI.
3.5 Short-term incentive program
101. EDTI provided details of its short-term incentive (STI) program in sections 1.6.1.1.1 and
1.6.1.1.2 of the application.
102. In Decision 2010-505, EDTI was directed to reduce the financial performance measure of
its STI program from 20 per cent to 10 per cent. The Commission directed EDTI to reduce the
financial performance measure to 10 per cent in order to be consistent with previous directions
for other Alberta utilities. EDTI complied with this direction in the application and has based its
STI program on a 10 per cent relative weighting for the financial performance measure with the
remaining 90 per cent accounted for in EDTI‟s specific performance measures.47 EDTI stated
that the specific financial performance target is corporate net income, which is comprised of net
income measured at the EUI level.48
103. EDTI stated that, in accordance with Direction 14 in Decision 2010-505, any approved
STI amounts included in revenue requirement but not paid out to employees will be captured in a
STI deferral account and refunded back to customers.49
104. EDTI included $2.35 million in STI program costs in the distribution function revenue
requirement and $0.63 million in the transmission function revenue requirement.50
105. EDTI stated that employees are also eligible for supplemental STI incentives for
performance that achieves or exceeds pre-set stretch target financial performance. EDTI stated
that it did not include a forecast of any supplemental STI payouts in its revenue requirement and
that all supplemental STI payout amounts will be borne by EDTI‟s shareholder.51 EDTI also
refers to these supplemental STI incentive payments as “pool B payments.”52
106. Interveners addressed several concerns with EDTI‟s STI program in argument and reply
argument.
47
Exhibit 3, application, page 127, paragraph 335. 48
Exhibit 3, application, page 128, paragraph 337. 49
Exhibit 3, application, page 130, paragraph 347. 50
Exhibit 3, application, page 169, Table 1.6.3.4-2 and page 170, Table 1.6.3.4-3. 51
Exhibit 3, application, page 130, paragraph 348. 52
Exhibit 169, UCA-EDTI-113 (a).

2012 Phase I and II Distribution Tariff 2012 Transmission Facility Owner Tariff EPCOR Distribution & Transmission Inc.
26 • AUC Decision 2012-272 (October 5, 2012)
107. The UCA stated that in previous decisions the Commission has ruled that the earnings
component of STI programs be based on the earnings of the utility and not the parent or
affiliates.53 In particular, the UCA noted Commission directions in Direct Energy Regulated
Services‟ (DERS) 2009/10/11 Default Rate Tariff application (Decision 2009-23854) and ATCO
Electric‟s 2011/12 GTA (Decision 2011-13455).56 The UCA went on to state that the 10 per cent
of EDTI‟s STI program related to EUI earnings is contrary to the principle that the earnings
measure of a STI program should be based on the earnings of the utility and that there is no
direct benefit to the regulated utility nor to the customers of the regulated utility. The UCA
submitted that STI costs related to the 10 per cent earnings component of the program should be
denied.57
108. In response, EDTI stated that its STI program does not raise the same concerns as the
ATCO Electric and DERS incentive plans because:
The net income component for EDTI‟s non-union staff at all levels is based on the same
10 per cent weighting.
Unlike ATCO Electric, individuals within EUI and EDTI management, including the
CEO of EUI, do not exercise discretion over the payouts for the STI program.
Over 90 per cent of EUI revenues are derived from regulated business.
109. EDTI also stated that the earnings component of its STI program should be based on
EUI‟s earnings because the STI program is EPCOR-wide and thus ensures that all EPCOR
employees are incented to find cost savings and performance improvements across all business
units. The financial performance measure does not bias the STI program towards any single
business unit, which would occur if the program was based on individual business unit
performance.58
110. EDTI stated that its STI program is consistent with previous Commission approvals
respecting EDTI‟s STI program under which the earnings measure has explicitly been based on
EUI‟s overall net income.59 EDTI went on to state that while the Commission directed EDTI to
reduce the weightings of the earnings component for 2011 in Decision 2010-505, it did not direct
EDTI to change the earnings measure from an EUI financial performance measure to an EDTI
measure.60 EDTI also stated that, consistent with the Commission‟s conclusions in paragraph 202
of Decision 2010-505, it would be unfair to change the STI program for the 2012 test year, given
that 2012 will almost be over by the time a decision is issued in this proceeding.61
111. In its reply argument, the UCA stated that, while EDTI attempted to differentiate itself
from the circumstances of DERS and ATCO Electric, the UCA noted that the Commission had
53
Exhibit 204, UCA argument, page 5, paragraph 9. 54
Decision 2009-238: Direct Energy Regulated Services, 2009/2010/2011 Default Rate Tariffs and Regulated
Rate Tariffs, Application No. 1600749, Proceeding ID. 149, December 3, 2009. 55
Decision 2011-134: ATCO Electric Ltd., 2011-2012 Phase I Distribution Tariff, 2011-2012 Transmission
Facility Owner Tariff, Application No. 1606228, Proceeding ID No. 650, April 13, 2011. 56
Exhibit 190, UCA evidence of Russ Bell, A11, lines 15-21. 57
Exhibit 204, UCA argument, page 6, paragraph 13. 58
Exhibit 208, EDTI argument, page 27, paragraphs 77 and 78. 59
Exhibit 208, EDTI argument, page 28, paragraph 81. 60
Exhibit 211, EDTI reply argument, page 13, paragraph 40. 61
Exhibit 211, EDTI reply argument, page 13, paragraph 41.

2012 Phase I and II Distribution Tariff 2012 Transmission Facility Owner Tariff EPCOR Distribution & Transmission Inc.
AUC Decision 2012-272 (October 5, 2012) • 27
ordered that only financial goals related to the regulated business unit be included in DERS‟
incentive plan62 and that the Commission had ordered that the ATCO Electric variable pay
program be based solely on the financial results of ATCO Electric.63 The UCA submitted that,
because increased earnings of affiliates benefits shareholders of those companies but not the
regulated customers, any incentive plan that is based on corporate earnings should be funded by
the shareholder and not the customer.64
112. In respect of the pool B payments, the UCA submitted that, while EDTI confirmed that it
has not included any pool B payments in revenue requirement, it was concerned that EDTI will
include pool B payments in the actual results in determining utility return on equity (ROE) in
2012 and subsequent years. The UCA recommended that the Commission direct EDTI to
exclude all actual pool B payments from utility costs and the calculation of ROE in 2012 and
subsequent years.65
113. In response EDTI stated that it is unreasonable to exclude certain incentive costs from the
calculation of actual return as it would make the calculation of returns less meaningful because it
would no longer represent the actual return to the shareholder. Further, EDTI argued that the
UCA‟s recommendation would run counter to and would blunt the incentives that EDTI is
intended to have under PBR to find and implement efficiencies and cost savings.66
Commission findings
114. EDTI has complied with Commission directions from Decision 2010-505 by limiting the
financial component of its STI program to 10 per cent and by setting up a deferral account to
capture any forecast STI payments not actually paid out to employees.
115. The Commission acknowledges that EDTI‟s employees have been working to achieve the
performance measures in EDTI‟s STI program throughout 2012 and the year is almost over. The
Commission finds that it would be unfair to alter the terms of the STI program at this time.
Hence, for the purposes of this decision, the Commission approves the STI program and the STI
amounts included in revenue requirement for 2012.
116. However, the Commission notes that in previous decisions in respect of variable pay
programs, DERS and ATCO Electric have been directed to tie the net income component of their
respective variable pay programs to the net income of the utility itself and not to corporate net
income. The Commission considers that the findings in the ATCO Electric and DERS decisions
apply equally to EDTI.
117. The Commission also considers that an EDTI STI program based on the earnings of EUI
may violate the spirit and intent of EPCOR‟s Inter-Affiliate Code of Conduct. EPCOR‟s Inter-
Affiliate Code of Conduct “…attempts to anticipate and adjust for the potential misalignment of
interest between shareholders and Utility customers occasioned by Affiliate transactions...”67
62
Exhibit 209, UCA reply argument, page 4, paragraph 7. 63
Exhibit 209, UCA reply argument, page 5, paragraph 9. 64
Exhibit 209, UCA reply argument, page 5, paragraph 11. 65
Exhibit 204, UCA argument, pages 7 and 8, paragraphs 18 and 20. 66
Exhibit 208, EDTI argument, page 29, paragraphs 86 and 87. 67
Decision 2004-010: EPCOR Utilities Inc., Code of Conduct and Exemption Application, Application
No. 1316005, February 3, 2004, Appendix 1, EPCOR Group Inter-Affiliate Code of Conduct, Section 1.1.

2012 Phase I and II Distribution Tariff 2012 Transmission Facility Owner Tariff EPCOR Distribution & Transmission Inc.
28 • AUC Decision 2012-272 (October 5, 2012)
EPCOR‟s Code of Conduct also requires utilities to demonstrate “...respect for the spirit and
intent behind the words by those individuals to whom the Code applies.”68
118. Accordingly, the Commission directs EDTI transmission to base the financial component
of its STI program for the purposes of its regulatory applications on the net income of EDTI for
2013 onward. EDTI distribution is not limited or restricted by the Commission in its
compensation practices, during the PBR term, including the terms of its STI program. Therefore,
this direction will not apply to EDTI‟s distribution function as its distribution function is now
under a performance based regulation regime beginning in 2013. However, the direction will still
apply to the transmission function and the Commission directs that the STI program for
transmission will be based on the net income of EDTI at the time of EDTI‟s next transmission
general tariff application.
119. In respect of the pool B payments, the Commission considers that any actual pool B
payments made to EDTI employees in 2012 and beyond should be treated as disallowed costs
and directs EDTI to deduct any pool B payments from EDTI‟s expenses when determining
EDTI‟s return on equity in 2012 for distribution and transmission, and for 2013 and beyond for
transmission.
3.6 Mid-term incentive program
120. EDTI provided details of the proposed mid-term incentive (MTI) program in
Section 1.6.1.1.3 of the application. EDTI stated that the MTI program is a new program,
established mid-2010, that was designed to foster alignment with EPCOR‟s long term business
strategy and objectives of reinvesting proceeds from the “sell down” of Capital Power
Corporation (CPC).69
121. EDTI stated that the MTI program only applies to its senior management and is set as a
percentage of base salary with target payouts ranging from 20 per cent to 100 per cent of base
salary for director, vice president and executive positions.70 EDTI included $340,000 in MTI
program costs in its distribution revenue requirement and $80,000 in its transmission revenue
requirement.71 EDTI stated that there is only one metric in the program: a compounded property,
plant and equipment (PP&E) growth metric that is a composite measure of the period to period
changes in net PP&E, additions of intangible assets, long term receivables and lease assets.72
122. Interveners raised a number of issues with EDTI‟s proposed MTI program in argument
and reply argument.
123. The UCA stated that there is no reference to any operational performance metrics or to
effective or efficient capital spending or that growth in PP&E is a customer focused goal. The
UCA submitted that the proposed MTI program incents behavior that is consistent with the
Averch-Johnson (or “gold plating”) effect, which is to simply increase investment in assets.73
The UCA also pointed out that the MTI program was based on EUI assets, not EDTI assets.
68
Decision 2004-010, Appendix 1, EPCOR Group Inter-Affiliate Code of Conduct, Section 1.1. 69
Exhibit 208, EDTI argument, page 30, paragraph 89. 70
Exhibit 3, application, page 134, paragraph 365. 71
Exhibit 3, application, page 171, tables 1.6.4-2 and 1.6.4-3 72
Exhibit 208, EDTI argument, page 31, paragraph 93. 73
Exhibit 204, UCA argument, page 6, paragraph 14.

2012 Phase I and II Distribution Tariff 2012 Transmission Facility Owner Tariff EPCOR Distribution & Transmission Inc.
AUC Decision 2012-272 (October 5, 2012) • 29
Thus, there was no indication that customers benefit from the MTI program and the primary
beneficiary of the program was EDTI‟s shareholder, not customers.74 The UCA also submitted
that EDTI‟s proposed MTI program violated previous rulings on incentive compensation in that
there was no operational benefit included in the program and the program was based on EUI
performance and not EDTI performance.75 For those reasons the UCA recommended that the
costs of the MTI program be removed from revenue requirement.
124. The CCA stated that it shared the UCA‟s concerns respecting the MTI program providing
incentives to increase investment in assets and with the MTI program being based on growth in
EUI capital not EDTI capital. In addition, the CCA submitted that any MTI associated with
reinvestment of proceeds from the sale of CPC assets should be part of the transaction costs of
such investments and should not be included in EDTI‟s 2012 revenue requirement. Further, the
CCA stated that, in the absence of any reference to efficient capital spending in the formulation
of the MTI program, any MTI costs that are based on the growth of EDTI‟s assets should be
disallowed since such payments would not benefit EDTI‟s customers.76
125. EDTI submitted that the MTI program provides an incentive for management to invest in
capital to achieve the following benefits for customers:
assist in regaining the benefits of scale economies that customers enjoyed prior to the
CPC transaction
increase the borrowing capacity and access to capital available to EDTI (and EUI‟s other
subsidiaries)
allow for sharing of best practices among employees of the EPCOR group
126. EDTI stated that the MTI program is an important component of its compensation that is
required to keep compensation levels competitive and retain employees and, without it, EDTI‟s
total direct compensation for officers and senior management would be significantly below
market median and uncompetitive. EDTI stated that the MTI program is an essential component
of the overall compensation paid to executive and key leadership employees.77
127. In response to the UCA‟s concerns, EDTI stated that any incentive to place capital
unnecessarily and imprudently is mitigated by its strong governance processes.78 EDTI also
stated that there are many measures and processes in place to ensure that there is no Averch-
Johnson effect; not the least of which is the regulatory risk that capital expenditures will be
found to be imprudent by the Commission.79
Commission findings
128. The Commission is concerned with the structure of the new MTI program proposed by
EDTI. Specifically, because the MTI program is based on assets, and there is no assurance that
the assets will be required for the provision of utility service, the Commission finds that the MTI
program creates an incentive to invest in assets that may not be required for the provision of
74
Exhibit 204, UCA argument, page 7, paragraph 15. 75
Exhibit 204, UCA argument, page 7, paragraph 16. 76
Exhibit 207, CCA argument, pages 32 and 33, paragraphs 123 to 126. 77
Exhibit 208, EDTI argument, page 34, paragraph 101. 78
Exhibit 208, EDTI argument, page 33, paragraph 99. 79
Exhibit 211, EDTI reply argument, page 16, paragraph 50.

2012 Phase I and II Distribution Tariff 2012 Transmission Facility Owner Tariff EPCOR Distribution & Transmission Inc.
30 • AUC Decision 2012-272 (October 5, 2012)
utility service. The Commission discusses additional concerns with EDTI‟s MTI program in
Section 6.2.1.3 of this decision. For all of these reasons, the Commission directs EDTI to remove
the MTI costs from its 2012 revenue requirement in its compliance filing.
129. Should EDTI choose to implement the MTI program and make incentive payments to
eligible employees in 2012, the Commission directs EDTI to remove the cost of those payments
from its actual 2012 expenses when determining its actual return on equity for 2012.
3.7 Cost of debt
130. The Commission advises parties that Section 9 of this decision contains a dissent with
respect to the majority‟s findings on cost of debt.
131. In the application, EDTI applied for approval of its 2012 cost of new long-term debt,
which it estimated to be 4.45 per cent for its distribution function and 5.25 per cent for its
transmission function. For each of its distribution and transmission functions, EDTI is
forecasting to issue $35 million in long-term debt for 2012.80
132. In its application, EDTI submitted its cost of new long-term debt calculations attached as
Appendix G-10. In AUC-EDTI-54-Attachment 1, EDTI updated its cost of new long-term debt
calculations to reflect changes in capital market conditions, interest rate expectations and credit
quality considerations. Table 16 shows the derivation of the estimated 2012 cost of new long-
term debt for distribution (ED) and transmission (ET) based on the updated information, as filed
by EDTI.81
Table 16. Estimated ED/ET 2012 stand-alone 2012 cost of long-term debt
ED ET
Yield on ten-year Government of Canada Bond 2.30% 2.30%
Plus: maturity premium 0.60 0.60
Plus: credit risk premium 1.50 2.30
Plus: financing cost .05 .05
Estimated 2012 stand-alone costs of new long-term debt 4.45% 5.25%
133. The first component of EDTI‟s calculation, the forecast yield on the 2012 10-year
Government of Canada bonds, has been established by reference to data from Consensus
Forecasts (Consensus). The second and third components are maturity and credit risk premiums.
The final component represents the allowance made for financing costs.82
134. With respect to EDTI‟s proposed cost of new long-term debt to be included in revenue
requirement, various issues were raised by interested parties and the Commission. The views of
the parties and Commission findings, with respect to EDTI‟s cost of new long-term debt, will be
discussed in the decision as follows:
80
Exhibit 3, application, page 1472, paragraphs 4978 and 4981. 81
Exhibit 167.13, AUC-EDTI-54, Attachment 1. 82
Exhibit 167.13, AUC-EDTI-54, Attachment 1.

2012 Phase I and II Distribution Tariff 2012 Transmission Facility Owner Tariff EPCOR Distribution & Transmission Inc.
AUC Decision 2012-272 (October 5, 2012) • 31
the impact of the letter from Dominion Bond Rating Service (DBRS) on the credit rating
of transmission
the indicative corporate bond spread that should be used by distribution and transmission
the use of Consensus Forecasts as opposed to actual Government of Canada bond yield
the impact of Alberta Capital Financing Authority (ACFA)
3.7.1 The DBRS letter
135. EDTI provided letters from DBRS dated December 13, 2011 that assigned an “indicative
long term credit rating of A (low) for ED [distribution] and BBB (high) for ET [transmission].”83
The letters are not actual credit ratings and reflect risks of the stand-alone operations for
distribution and transmission and assume no guarantee of debt or explicit credit support from
EPCOR Utilities Inc. or the City. The ratings represented a downgrade for transmission from
A (low) to BBB (high) but the rating for distribution remained the same at A (low) as provided
by DBRS at the time EDTI‟s application was filed.84 EDTI proposed that this raised the cost of
debt for transmission vis-à-vis distribution.
136. The CCA raised concerns with transmission‟s bond rating downgrade on several counts.
The proposed downgrade was triggered by the Heartland project, which is eventually going to be
transferred to an affiliate and the CCA did not consider it fair that EDTI‟s customers should bear
the costs of a temporary downgrade due to an affiliate project being held temporarily in EDTI‟s
books.85 The CCA based its position on EDTI‟s response to AUC-EDTI-61,86 where EDTI said
that the Heartland project was currently being treated in a manner similar to other EDTI AESO-
directed capital projects, but it will eventually be transferred to a new TFO that will own and
operate the Heartland facilities and be regulated by the Commission. In its response, EDTI also
expressed its view that the downgrade was temporary and expected some improvement once the
Heartland project is transferred to the new TFO that will own and operate it.
137. To make its argument, the CCA further relied on the response to CCA-EDTI-10187 stating
that it is not clear from the DBRS letter that DBRS understood that Heartland will be transferred
from transmission‟s books to an affiliate and that any deterioration in credit is temporary. It also
argued that DBRS does not seem to have looked at transmission‟s credit beyond the date at
which the assessment was made because no pro forma financial statements had been provided by
EDTI beyond 2012.88 Refuting the CCA‟s position, EDTI quoted from the DBRS letter:
The magnitude and size of potential transmission projects, such as the recently approved
Heartland Transmission project, could further expose the entity to both construction and
execution risk and is likely to put significant pressure on the credit metrics and
potentially the credit rating in the future, depending on the size of the expenditures and
how they are financed.89 (emphasis added by EDTI)
83
Exhibit 150.10, CCA-EDTI-22, Attachment 5. 84
Exhibit 87, application, Appendix G-11 for distribution and Exhibit 88, Appendix G12 for transmission. 85
Exhibit 191.00, CCA argument, page 29, paragraph 108. 86
Exhibit 186, AUC-EDTI-61. 87
Exhibit 188, CCA-EDTI-101. 88
Exhibit 191, CCA evidence, page 5, paragraph 5. 89
Exhibit 208, EDTI argument, page 143, paragraph 416.

2012 Phase I and II Distribution Tariff 2012 Transmission Facility Owner Tariff EPCOR Distribution & Transmission Inc.
32 • AUC Decision 2012-272 (October 5, 2012)
138. Based upon the letter, EDTI argued that projects like Heartland could be a concern in the
future, but are not a reason for, or a contributing factor to, the “downgrade” that occurred in
December 2011. Since the rating considers the risks and returns of the transmission function, it is
relevant to consider the stand-alone BBB (high) credit rating of transmission.
139. The CCA countered this argument in its reply stating:90
CCA submits there is no evidence that DBRS considered any other large scale
transmission projects when it triggered the credit downgrade for ET. Although EDTI is
urging the Commission to speculate that DBRS may have considered other large scale,
transmission projects in addition to Heartland, based on the vague language in the DBRS
letter, there is no evidence of ET's plans to embark on any other large scale transmission
projects.
140. EDTI also argued that the CCA provided no evidence to support its argument that EDTI
knew that a downgrade was a possibility or the steps it could have taken to forestall the
downgrade.
Commission findings
141. With respect to the CCA‟s submission that customers should not pay the costs of a
temporary “downgrade” because EDTI has claimed that the Heartland assets will eventually be
transferred to a new TFO, the Commission considers that, because no such transfer has occurred
at this time, the Commission will assess the Heartland project like any other AESO-directed
capital project. Costs related to the Heartland project, deemed fair and reasonable, will be taken
into account in the calculation of EDTI‟s cost of debt and will not be considered temporary in
nature.
142. In keeping with past Commission decisions, for the purposes of this decision, the
Commission has considered the cost of debt for distribution and transmission on a stand-alone
basis. EDTI submitted letters from DBRS providing credit ratings for distribution and
transmission on a stand-alone basis. With respect to transmission, the letter from DBRS
indicated that transmission would be “downgraded” from an A (low) to BBB (high). As such,
EDTI submitted its cost of debt should be increased to recognize transmission‟s higher credit
risk.
143. The Commission has reviewed the letters from DBRS. Having reviewed the response to
CCA-EDTI-101, the Commission finds that the letters do not constitute a full credit rating
assessment because DBRS did not have access to EDTI‟s pro forma financial statements beyond
2012. The Commission also finds that the letter with respect to transmission is vague with
regards to the causes of the “downgrade” and has noted an inconsistency in EDTI‟s argument
with regards to Heartland‟s role in the “downgrade.” Specifically, during the course of the
proceeding, EDTI indicated that transmission‟s credit rating would improve once the Heartland
assets are transferred to a new TFO that will own and operate it. However, in argument, EDTI
indicated that Heartland could cause a further “downgrade” in the future and is not a cause for
the current “downgrade.”91
90
Exhibit 210, CCA reply, page 7, paragraph 26. 91
Exhibit 186, AUC-EDTI-61 d) & Exhibit 0208, EDTI final argument, page 143, paragraph 147.

2012 Phase I and II Distribution Tariff 2012 Transmission Facility Owner Tariff EPCOR Distribution & Transmission Inc.
AUC Decision 2012-272 (October 5, 2012) • 33
144. Moreover, in the last Generic Cost of Capital proceeding Decision 2011-474,92 the
Commission set the equity ratios for utilities so as to ensure an A-range credit rating. Given the
lack of persuasive information in the DBRS letter, the Commission does not consider that there
is sufficient evidence to indicate that the equity thickness established for transmission and
distribution in Decision 2011-474 would not be sufficient to ensure an A-range credit rating.
Further, the Commission notes that, at the time of Decision 2011-474, the Heartland project was
well known and EDTI could have addressed the impact of it on its credit rating at that time.
145. Consequently, the Commission does not find the credit rating provided in the DBRS
letter for transmission sufficient to justify a “downgrade” to the stand-alone credit rating of
transmission as proposed by EDTI.
146. For all of these reasons, the Commission will not approve transmission‟s cost of debt
based upon the credit rating proposed in the letter from DBRS. For the purposes of this decision,
the Commission will continue to apply the credit rating of A (low) for transmission; the rating
issued by DBRS prior to the “downgrade.” The Commission accepts distribution‟s credit rating
of A (low) as proposed in the application.
3.7.2 Indicative corporate bond spread for EDTI
147. In the application, EDTI calculated the cost of debt for its 2007, 2008, 2009, 2010 and
2011 issues using the spread for Fortis for its credit risk premium as directed by the
Commission.93 However, in accordance with a proposal by the Commission in Decision
2010-50594 for its 2012 cost of debt, EDTI used the average spread of a group of comparable
utilities. For its calculations, EDTI used the long-term credit risk premiums estimated by the
National Bank and TD Securities for a group of operating companies defined by them as utilities
or pipelines and which have DBRS ratings of A (low) and BBB (high). EDTI submitted a
proposed credit spread of 150 basis points for distribution and 230 basis points for
transmission.95
148. EDTI expressed its preference for this method because estimation using single data points
can be problematic as individual observations are more likely to be materially skewed by
individual company or issue-specific circumstances.96
149. In CCA-EDTI-81,97 the CCA presented information regarding the Fortis credit spread.
EDTI responded that it had relied on the approach suggested by the Commission in using the
credit spread of a group of comparable utilities and, furthermore, the CCA data on the Fortis
credit spread was not reliable.
92
Decision 2011-474: 2011 Generic Cost of Capital, Application No. 1606549, Proceeding ID No. 833,
December 8, 2011, page 35, paragraph 194 and Decision 2009-216: 2009 Generic Cost of Capital, Application
No. 1578571, Proceeding ID. 85, November 12, 2009page 88, paragraph 334. 93
Decision 2010-505, page 33, paragraph 179. 94
Exhibit 168.01, CCA-EDTI-81. 95
Exhibit 167.13, AUC-EDTI-54, Attachment 1, page 4. 96
Exhibit 168.01, CCA-EDTI-81. 97
Exhibit 168.01, CCA-EDTI-81.

2012 Phase I and II Distribution Tariff 2012 Transmission Facility Owner Tariff EPCOR Distribution & Transmission Inc.
34 • AUC Decision 2012-272 (October 5, 2012)
Commission findings
150. While the CCA explored the credit spread for Fortis, which was previously used as a
proxy credit spread for EDTI, the Commission prefers a credit spread based on the credit spreads
for a group of comparative companies of equivalent risk.
151. However, while the Commission accepts the methodology for estimating the credit
spread, it does not accept the credit spread calculated for transmission because it was calculated
using the credit spread of utilities with BBB (high) ratings. Given that the Commission did not
accept the credit rating “downgrade” for transmission, as proposed by EDTI, the Commission
finds that it would be inconsistent to use a credit spread that was based on utilities with BBB
(high) ratings.
152. The Commission accepts EDTI‟s proposal that the credit spread for distribution be 150
basis points, based on its analysis of comparative companies with an A (low) credit rating. Given
the Commission‟s finding with respect to the credit spread for transmission, the Commission
directs EDTI to use the 150 basis point credit spread for transmission.
3.7.3 Government of Canada bond yield
153. EDTI submitted information on the Consensus forecast bond yield for a 10-year bond.
The Commission has assessed the Consensus forecasts used by EDTI by comparing it to actual
Government of Canada long-term bond yields. In AUC-EDTI-54 Attachment 1, EDTI submitted
the Consensus forecasts of June 2012 (2.1 per cent) and March 2013 (2.5 per cent).
Commission findings
154. As 2012 is nearing its end, the Commission considers that it is more reliable to use the
actual Government of Canada long-term bond yields as opposed to the Consensus forecasts. In
keeping with the Commission‟s practice of using the mid-year convention98 for EDTI‟s debt
matters, the Commission has compared the June 2012 Consensus Forecasts bond yield with the
actual Government of Canada long-term bond yield. In June 2012, the actual Government of
Canada long-term bond yield was 2.32 per cent. Using the Consensus forecast bond yield for
June 2012 with a maturity premium added in, EDTI‟s yield on a long-term bond would be
2.90 per cent. The Commission finds that the Consensus forecast overstates the bond yield by
58 basis points. Based on the evidence in this proceeding, the Commission considers that the
Consensus forecasts relied on by EDTI are not a reasonable predictor of the actual Government
of Canada bond yield in this case.
155. The Commission directs EDTI, in its compliance filing, to calculate the cost of its 2012
debt issues using the Government of Canada long-term bond yield for the month of June 2012
(2.32 per cent) which includes the maturity premium.
3.7.4 Access to ACFA financing
156. EDTI is owned by the City of Edmonton (the City). The City is eligible to access
financing through ACFA. This source of financing is cheaper than obtaining debt from the
marketplace because it takes advantage of the province of Alberta‟s AAA credit rating. EDTI has
98
Decision 2010-505, page 34, paragraph 187.

2012 Phase I and II Distribution Tariff 2012 Transmission Facility Owner Tariff EPCOR Distribution & Transmission Inc.
AUC Decision 2012-272 (October 5, 2012) • 35
previously submitted that it cannot obtain ACFA financing because the City declined to provide
it to EDTI.99
157. In Decision 2010-505,100 the Commission directed EDTI to advise the Commission on
whether the City of Edmonton would make available ACFA financing in its next general tariff
application. In the application, EDTI submitted a letter from the City,101 which conveyed that the
City‟s position has not changed and outlined three reasons why the City is not prepared to
provide ACFA funding to EDTI.
158. First, the City stated that EUI was established as an independent company and if the City
were to procure ACFA financing on EUI‟s behalf, city council would be forced to become
actively involved in the management of EUI. Second, the City voiced its concerns about the
effect the additional debt would have on the City‟s bond and credit rating and the consequent
adverse impact on the City and Edmonton taxpayers. Third, the City discussed the additional
administrative burden that would be created for the City if it were to borrow on EUI‟s behalf.
159. The UCA stated that, “[c]ustomers should not be required to pay the higher cost of debt
simply because EDTI‟s sole shareholder, the City has chosen not to allow EDTI access to ACFA
financing.”102
160. The UCA argued further that EDTI has a non-taxable status because of its municipal
ownership as a result of which it was awarded a two per cent increase in common equity.103 Since
customers are paying the cost of an increased common equity ratio arising from EDTI‟s non
taxable status by paying higher rates, customers should also benefit from lower debt rates by
having access to the AAA credit rating that ACFA financing provides.
161. The UCA compared EDTI with ENMAX, noting that its sole shareholder, the City of
Calgary, provides ENMAX with access to ACFA financing, thereby enabling it to obtain debt at
lower rates than if it had issued debt on its own.
162. The UCA acknowledged the Commission cannot direct EDTI to secure its debt financing
from a specific source, but asserts that the Commission can determine the costs related to debt to
be included in just and reasonable rates. There is a 1.75 per cent spread between ACFA financing
and the cost of debt EDTI sources in the market. ENMAX pays a 25 basis point premium to The
City of Calgary for providing it with access to ACFA financing. Based upon these
considerations, the UCA recommended that the average cost of debt for EDTI be reduced by
1.50 per cent to approximate the impact of ACFA financing.104
163. In its argument, the UCA recommended that for purposes of consistency all items arising
from municipal ownership should be included in rates, including the impact of ACFA
financing.105
99
Decision 2010-505, page 34, paragraph 189. 100
Decision 2010-505, page 34, paragraph 189. 101
Exhibit 86, application, Appendix G-4, 102
Exhibit 204, UCA argument, page 9, paragraph 28. 103
Exhibit 204, UCA argument, page 10, paragraph 31. 104
Exhibit 190.02, evidence of Russ Bell, A19. 105
Exhibit 204, UCA argument, page 11, paragraph 40.

2012 Phase I and II Distribution Tariff 2012 Transmission Facility Owner Tariff EPCOR Distribution & Transmission Inc.
36 • AUC Decision 2012-272 (October 5, 2012)
164. EDTI refuted the UCA‟s proposed 1.50 per cent downward adjustment on the grounds
that the recommendation would constitute retroactive ratemaking and confuses the cost of new
debt with the average cost of total debt. EDTI also argued that basing debt on the ACFA rate
violated the stand-alone principle which dictates that EDTI be treated as an entity entirely
separate from its parent or any other activities of the entity or corporation.106 In its rebuttal
evidence, EDTI stated:107
...In order for him [Mr. Bell] to logically sustain the position that ACFA cost rates should
be deemed to the distribution and transmission operations of EDTI, Mr. Bell would have
to “look upstream” through multiple layers of ownership. The proposition that ACFA
cost rates which cannot even be accessed by either EUI or EDTI should be deemed to be
available to the stand-alone distribution and transmission functions of EDTI is therefore
an obvious violation of the stand-alone concept.
165. In response to the UCA‟s argument that EDTI only enjoys the benefit of municipal
ownership by enjoying a higher common equity ratio, EDTI discussed the benefit to EDTI‟s
customers of lower rates because its revenue requirement does not include an allowance for
income taxes.
Commission findings
166. The UCA recommended that EDTI‟s average cost of debt be reduced by 1.50 per cent to
reflect the spread between EDTI‟s cost of debt and ACFA financing, net of an adjustment for
financing costs. The recommendation involves two issues; whether the ACFA financing rate
should be used as a reference for EDTI‟s interest rates and if so, whether the 1.50 per cent
reduction proposed by the UCA is a reasonable adjustment.
167. Although the Commission can deem a lower cost of debt on a go forward basis on newly
issued debt, the Commission does not consider it reasonable to do so. The Commission has
reviewed the letter from the City regarding its reasons for not providing ACFA financing to
EDTI. The Commission acknowledges the City‟s reasons for not providing ACFA funding to
EDTI, and recognizes that the City has made a policy decision on behalf of its constituents. The
Commission does not have sufficient evidence to conclude that the City‟s reasons for denying
ACFA funding to EDTI are unreasonable. If the City had chosen to provide ACFA funding to
EDTI (as The City of Calgary has done for ENMAX) the Commission would recognize the
lower rate in EDTI‟s revenue requirement, because the City would have made a policy decision
to fund its investment at a rate lower than the rate applicable to a utility with A (low) credit
rating. However, the Commission is not prepared to deem a lower cost of debt, simply because
the City may provide ACFA funding.
168. The Commission considers that the UCA‟s recommendation would be contrary to the
stand-alone principle. With respect to other aspects of EDTI‟s cost of debt, the Commission has
assessed distribution and transmission‟s cost of debt on a stand-alone basis.
169. As the Commission has determined that the ACFA financing rate should be not be used
as a reference for EDTI‟s cost of debt, the Commission will not direct a 1.50 per cent reduction
to EDTI‟s cost of debt as requested by the UCA.
106
Exhibit 203.05, rebuttal evidence of Dr. Evans, page 3 and 4. 107
Exhibit 203.05, rebuttal evidence of Dr. Evans, page 5.

2012 Phase I and II Distribution Tariff 2012 Transmission Facility Owner Tariff EPCOR Distribution & Transmission Inc.
AUC Decision 2012-272 (October 5, 2012) • 37
3.8 Property, business and linear tax deferral account
170. The deferral account for property, business and linear taxes was approved in Decision
2008-125108 because the City was in the process of implementing significant changes to its tax
regime, and as a result, significant fluctuations in mill rates and assessment values were
expected.
171. This deferral account captures variances between forecast and actual property, linear and
business taxes. With the changes in the tax regime, the city intended to eliminate business tax
revenue and recover an equal amount of revenue from the non-residential property tax base. As a
result, EDTI‟s business tax decreased over the 2008 to 2011 period, to nil in 2012, while its
property taxes and linear taxes increased significantly.
172. In its application, EDTI noted that the City has now completed its property and business
transition plan.109
173. Table 17 below sets out a summary of EDTI‟s historical and forecast property, business
and linear taxes in respect of its distribution and transmission functions.
Table 17. Distribution and transmission property, business and linear taxes 2009-2012110
Sec A 2009 (A)
B 2010 (D)
C 2010 (A)
D 2011 (D)
E 2011 (UF)
F 2012 (F)
1 11.1.1 Distribution-property, business and linear taxes
4.44 4.74 5.09 5.25 5.82 6.69
2 11.1.2 Transmission-property, business and linear taxes
3.96 4.18 4.74 5.04 5.72 6.89
Legend: (A) actual, (D) decision, (UF) updated forecast, (F) forecast
174. EDTI submitted111 that the historical forecast-to-actual variances demonstrate that there
remains a substantial level of uncertainty in this cost area. Accordingly, it requested a
continuation of EDTI‟s distribution and transmission property, business and linear tax deferral
accounts for the 2012 test period, on the basis approved in Decision 2008-125.112
Commission findings
175. The variances discussed by EDTI are for the years 2009 to 2011; a period where
uncertainty was expected due to the City‟s transition plans. The City has completed its transition
plans in its tax regimes. The Commission finds that the variances cited by EDTI do not make a
compelling case for the continuation of the deferral account, now that the transition has ended.
Consequently, the Commission finds that this deferral account is no longer warranted.
176. The Commission finds the forecast distribution and transmission property, business, and
linear taxes to be reasonable and approves the 2012 forecast as filed.
108
Decision 2008-125: EPCOR Distribution & Transmission Inc., 2007-2009 Distribution Tariff, 2007-2009
Transmission Facility Owners Tariff, Code of Conduct Exemption, Application No. 1558686, Proceeding
ID. 14, December 3, 2008, page 15. 109
Exhibit 3, application, page 953, paragraph 2955. 110
Exhibit 3, application, page 952, Table 11.1-1. 111
Exhibit 3, application, page 954, paragraph 2959. 112
Decision 2008-125, page 12, Section 4.4.1

2012 Phase I and II Distribution Tariff 2012 Transmission Facility Owner Tariff EPCOR Distribution & Transmission Inc.
38 • AUC Decision 2012-272 (October 5, 2012)
3.9 Self-insurance reserve account
177. In the application, EDTI is requesting approval for the continuation of its distribution and
transmission self-insurance reserve account (SIR) for the 2012 test period. By way of its SIR,
EDTI is seeking approval for those costs that meet the criteria set out in EDTI‟s Procedure for
Claims against Self-Insurance Reserve approved by the Commission in decisions 2004-067113
and 2006-054,114 copies of which are attached as Appendix C-5 and Appendix C-6 in the
application.
178. The tables below summarize EDTI‟s distribution and transmission self-insurance reserve
accounts.
Table 18. Distribution self-insurance reserve accounts
Deferral account A
2009 (A) B
2010 (D) C
2010 (A) D
2011 (D) E
2011 (UF) F
2012 (F)
1 SIR forecast - - - - - -
2 SIR actual - - 0.11 - (0.11) -
3 SIR true-up - (0.11) 0.11 -
4 Total - - - - - -
Legend: (A) actual, (D) decision, (UF) updated forecast, (F) forecast
Table 19. Transmission self-insurance reserve accounts
Deferral account A
2009 (A) B
2010 (D) C
2010 (A) D
2011 (D) E
2011 (UF) F
2012 (F)
1 SIR forecast - - - - - -
2 SIR actual - - 0.11 - 0.35 -
3 SIR true-up - (0.11) (0.35) 0.46
4 Total - - - - - 0.46
Legend: (A) actual, (D) decision, (UF) updated forecast, (F) forecast
179. The balance for the distribution SIR account for 2012 was zero and EDTI made no
forecasts for the 2012 test period.
180. EDTI submitted that it had experienced three incidents that qualified to be claimed
against its transmission SIR account for 2012. They were a CV-5 Cable termination failure, the
Victoria Substation Insulated Bus Failure and the Rossdale Capacitor Bank Failure.
181. With regards to the CV-5 cable termination, EDTI incurred $0.11 million in costs in
2010, of which $0.04 million was an expenditure on capital repair which will be capitalized. As
such, in its compliance filing EDTI stated it would reduce the 2010 SIR claim to $0.07 million. It
forecasted an additional $0.06 million for 2011 in costs relating to further repair and
113
Decision 2004-067: EPCOR Distribution Inc., 2004 Distribution Tariff Application, Part B: 2004 Final
Distribution Tariff, Application No. 1306821, August 13, 2004 114
Decision 2006-054: EPCOR Transmission Inc., 2005/2006 Transmission Facility Owner Tariff, Application
No. 1389884 and EPCOR Distribution Inc., 2005/2006 Distribution Tariff – Phase I, Application No. 1389885,
June 15, 2006.

2012 Phase I and II Distribution Tariff 2012 Transmission Facility Owner Tariff EPCOR Distribution & Transmission Inc.
AUC Decision 2012-272 (October 5, 2012) • 39
investigation of the failure. It also incurred $0.33 million in additional capital repair costs of
which an insurance claim of $0.10 million has been made. If successful, this amount will be
included in the SIR on an actual basis.
182. The Victoria Substation Insulated Bus Failure cost EDTI $0.18 million in 2011 and EDTI
plans to pursue “cost recovery” against the original project consultants and contractors because
the bus failed prematurely.115 The Rossdale Capacitor Bank Failure cost EDTI $0.11 million in
repair activities.116 The CCA raised issue with $0.19 million of the $0.46 million included as SIR
claims in EDTI‟s transmission reserve account because they are internal costs comprised of
salary, vehicle and labour costs and should be removed from the SIR recovery process to prevent
double counting. The CCA argued that, as the definition of costs in EDTI‟s SIR policy does not
specifically exclude the inclusion of internal costs such as labour costs,117 these costs would be
recovered twice: once through its O&M expense in the revenue requirement and again through
the SIR. The CCA recommended that EDTI‟s SIR policy be amended to specifically state that
only incremental operating costs directly associated with the SIR event should be included for
recovery through the SIR mechanism and internal costs (labour, material), which normally form
part of the revenue requirement, should not be a part of the SIR claim.118
183. EDTI refuted the CCA‟s position by stating that “CCA‟s position is based upon a
fundamental misunderstanding about the costs embedded in rates.”119 EDTI also argued that the
fact that it does not differentiate between internal and any other costs does not mean that EDTI is
recovering costs through its SIR claim that are already included in its revenue requirement. In its
argument, EDTI elaborated:
EDTI‟s repair costs included in its revenue requirement are based on a three-year
historical average forecasting approach, and no SIR claim related costs are included in
the historical amounts on which the forecast is based. There are no costs embedded in the
2012 Forecast for SIR expenses, whether internal or external. The costs of any internal
labour time spent on a SIR event in any given year would be incurred in that year, but no
allowance has been made in the Revenue Requirement for that expense. Where there is a
SIR event, EDTI incurs costs in addition to those forecast in the Revenue Requirement
and EDTI will have to find ways to offset the need to divert internal resources to address
the SIR event, such as by hiring contractors or incurring overtime. The SIR expense is
ultimately recovered through the SIR process.120
184. EDTI further emphasized that, without the SIR process, EDTI would have to attempt to
forecast repair costs related to unforeseeable events, which would result in a higher forecast of
repair costs than currently reflected in EDTI‟s application. Therefore, the SIR process is
necessary and reasonable.
115
Exhibit 3, application, page 972, paragraph 3020. 116
Exhibit 3, application, page 975, paragraph 3030. 117
Exhibit 207, CCA argument, page 19, paragraph 68. 118
Exhibit 207, CCA argument, page 19, paragraph 69. 119
Exhibit 208, EDTI argument, page 61, paragraph 170. 120
Exhibit 208, EDTI argument, page 61, paragraph 169.
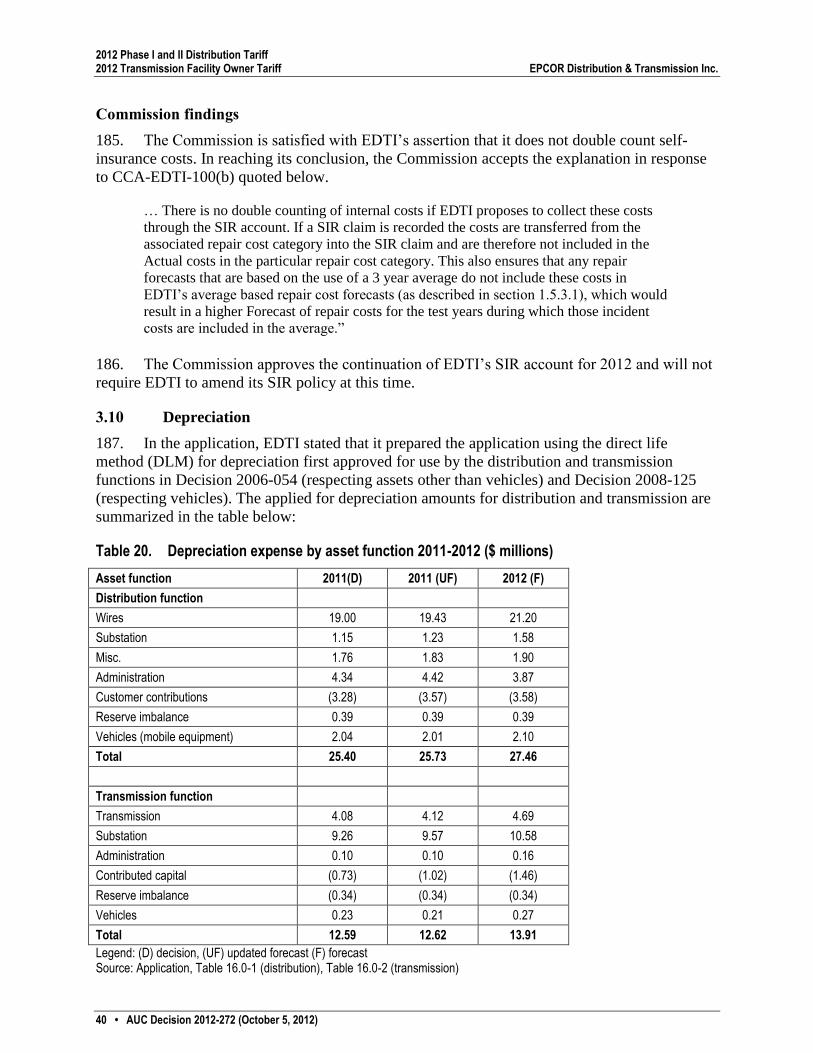
2012 Phase I and II Distribution Tariff 2012 Transmission Facility Owner Tariff EPCOR Distribution & Transmission Inc.
40 • AUC Decision 2012-272 (October 5, 2012)
Commission findings
185. The Commission is satisfied with EDTI‟s assertion that it does not double count self-
insurance costs. In reaching its conclusion, the Commission accepts the explanation in response
to CCA-EDTI-100(b) quoted below.
… There is no double counting of internal costs if EDTI proposes to collect these costs
through the SIR account. If a SIR claim is recorded the costs are transferred from the
associated repair cost category into the SIR claim and are therefore not included in the
Actual costs in the particular repair cost category. This also ensures that any repair
forecasts that are based on the use of a 3 year average do not include these costs in
EDTI‟s average based repair cost forecasts (as described in section 1.5.3.1), which would
result in a higher Forecast of repair costs for the test years during which those incident
costs are included in the average.”
186. The Commission approves the continuation of EDTI‟s SIR account for 2012 and will not
require EDTI to amend its SIR policy at this time.
3.10 Depreciation
187. In the application, EDTI stated that it prepared the application using the direct life
method (DLM) for depreciation first approved for use by the distribution and transmission
functions in Decision 2006-054 (respecting assets other than vehicles) and Decision 2008-125
(respecting vehicles). The applied for depreciation amounts for distribution and transmission are
summarized in the table below:
Table 20. Depreciation expense by asset function 2011-2012 ($ millions)
Asset function 2011(D) 2011 (UF) 2012 (F)
Distribution function
Wires 19.00 19.43 21.20
Substation 1.15 1.23 1.58
Misc. 1.76 1.83 1.90
Administration 4.34 4.42 3.87
Customer contributions (3.28) (3.57) (3.58)
Reserve imbalance 0.39 0.39 0.39
Vehicles (mobile equipment) 2.04 2.01 2.10
Total 25.40 25.73 27.46
Transmission function
Transmission 4.08 4.12 4.69
Substation 9.26 9.57 10.58
Administration 0.10 0.10 0.16
Contributed capital (0.73) (1.02) (1.46)
Reserve imbalance (0.34) (0.34) (0.34)
Vehicles 0.23 0.21 0.27
Total 12.59 12.62 13.91
Legend: (D) decision, (UF) updated forecast (F) forecast Source: Application, Table 16.0-1 (distribution), Table 16.0-2 (transmission)

2012 Phase I and II Distribution Tariff 2012 Transmission Facility Owner Tariff EPCOR Distribution & Transmission Inc.
AUC Decision 2012-272 (October 5, 2012) • 41
188. EDTI further submitted that:121
Under DLM, changes in annual depreciation expense in a given asset category are due
solely to additions and planned (as opposed to actual, physical) retirements in that
category. For all years up to and including 2011, consistent with one of the fundamental
premises of DLM, the service lives for all assets have not been changed from those
approved by the Commission in Decision 2008-125.
and
In 2011, EDTI conducted a review of the reasonableness of asset service lives used to
calculate depreciation and as a result of this review, EDTI is proposing to adjust the
useful lives associated with a number of asset categories. EDTI engaged an external
depreciation expert from Gannet Fleming to review and advise on the appropriateness of
the asset lives of all of its distribution and transmission asset categories included in
EDTI‟s depreciation model.
189. EDTI proposed to implement the recommended changes to asset service lives on a
prospective basis by applying the adjusted depreciation rates for 2012 and future asset additions.
EDTI stated that implementing the changes on a retroactive basis would be administratively
complex and in an effort to minimize the level of effort required to implement the changes, chose
the prospective approach.
190. In AUC-EDTI-05, the Commission asked why the new rates were being applied only to
new assets when at the time of the original adoption of the DLM method the record had indicated
that extraordinary events, such as changes in useful lives, would be applied prospectively and
asked what the impact on revenue requirement would be.122
191. In response to the Commission‟s request, EDTI clarified that the proposed
implementation for new assets is simpler and that the impact on return is minor for both
distribution ($0.04 million increase for 2012) and transmission ($0.00 million increase for 2012).
However, for the distribution function, EDTI stated that retroactive application of the new
service lives would have reduced the amount of depreciation collected each year by
$1.01 million and would have extended the overall collection period.
192. The Commission also enquired in AUC-EDTI-56 about the additional work that had been
done with respect to the transition of asset values to IFRS and the possibility of changing the
basis of depreciation for regulatory purposes. EDTI responded:
On a go forward basis a portion of the retirement data generated for IFRS reporting of
capital assets could be used to record retirements for regulatory purposes if there were to
be a change in the depreciation method used by EDTI in the future. The fact that an
actual retirement has occurred and the vintage of the actual asset retired could be used by
EDTI to record an actual retirement for regulatory purposes.123
121
Exhibit 3, application paragraph 4956 and 4957. 122
Exhibit 148.02, AUC-EDTI-5(b). 123
Exhibit 167.02, AUC-EDTI-56(c).

2012 Phase I and II Distribution Tariff 2012 Transmission Facility Owner Tariff EPCOR Distribution & Transmission Inc.
42 • AUC Decision 2012-272 (October 5, 2012)
Commission findings
193. The Commission has reviewed the changes in depreciation rates and the affected asset
classes. For asset classes, such as meters where there has been a change in technology such that
useful lives differ, the Commission finds that it is reasonable to adjust the asset lives on a
prospective basis by creating a new asset class. Given the affected asset classes and the small
impact on revenue requirement, the Commission accepts the implementation of the change in
asset service lives on a prospective basis as proposed by EDTI. The Commission cautions EDTI
that should extraordinary events, such as the need to change the useful life of assets, occur in the
future a change from the DLM may be necessary.
3.11 International Financial Reporting Standards
194. In Decision 2010-505, the Commission approved the 2011 implementation of
International Financial Reporting Standards (IFRS) along with the creation of a related deferral
account as follows:
261. … The Commission recognizes that the final IFRS requirements may not be yet
determined and for this reason a deferral account would allow the impacts from any
unforeseen adjustments to be collected, reviewed and addressed. Given that the impacts
may be material and not have balance impacts on the parties, the Commission directs that
a deferral account should be created for any adjustments resulting from the transition to
IFRS compliance.
262. The Commission approves EDTI‟s proposed adoption of IFRS in 2011. If EDTI
does not adopt IFRS on January 1, 2011, then the impact on revenue requirement of the
retention of Canadian GAPP account shall be included in the IFRS deferral account, with
its disposition to be addressed in a future EDTI application.124
195. EDTI stated that it had prepared its 2011 updated forecast and 2012 test year forecast in
accordance with AUC Rule 026: Rule Regarding Regulatory Account Procedures Pertaining to
the Implementation of the International Financial Reporting Standards.
196. The CCA indicated that the Canadian Accounting Standards Board had delayed the
deadline for implementation of IFRS for entities with rate-regulated activities from January 1,
2012 to January1, 2013. The CCA suggested that further changes to IFRS for rate-regulated
entities may be imminent.
197. The CCA submitted that the existing IFRS deferral account would capture any
differences arising from the yet-to-be finalized IFRS applicable to entities with rate-regulated
operations; however this would only apply to 2011 as EDTI should be directed to re-file its 2012
test year to reflect the revised IFRS standards.125 The CCA argued that IFRS impacts were
significant and the International Accounting Standards Board (IASB) may allow rate-regulated
entities to continue pre-changeover accounting practices so that the impacts on affected accounts
could be reversed.126
124
Decision 2010-505, pages 45 - 46, paragraphs 262 – 262. 125
Exhibit 191.01, CCA intervener evidence, pages 25-27, paragraphs 67-71. 126
Exhibit 201.01, CCA argument, page 39, paragraphs 146-149.

2012 Phase I and II Distribution Tariff 2012 Transmission Facility Owner Tariff EPCOR Distribution & Transmission Inc.
AUC Decision 2012-272 (October 5, 2012) • 43
198. EDTI challenged the CCA‟s recommendation, arguing there was no evidence on the
record that the IASB has finalized IFRS for rate-regulated entities and that transition to IFRS had
only resulted in a non-material change to capital overhead and revenue requirement. For these
reasons, EDTI argued there was no need to maintain a deferral account or require a complete
refiling of EDTI‟s 2012 forecast.127
Commission findings
199. EDTI adopted IFRS on January 1, 2011 in accordance with the standards then in effect.
The deferral accounts created in Decision 2010-505 were created due to uncertainty with respect
to the initial adoption of IFRS to capture “any adjustments resulting from the transition to IFRS
compliance.” As the transition to IFRS was completed in 2011, the deferral accounts for
distribution and transmission are no longer needed.
200. The Commission is of the view that future changes to IFRS will be addressed as
accounting changes should they arise.
201. The Commission rejects the CCA proposal that, should the IASB defer the mandatory
adoption date for IFRS, EDTI should be directed to re-file its 2012 test year to reflect the revised
IFRS standards because EDTI has already adopted IFRS.
202. The Commission notes that IASB IFRS requirements were not finalized at the time of the
2010 and 2011 GTA application upon which Decision 2010-505 was based. That decision
approved implementation of IFRS to be effective January 1, 2011. The Commission does not
accept the CCA proposal that IFRS implementation should be reversed one year after
implementation due to the IFRS requirements not yet being finalized given the revised deadline
for IFRS implementation of January 1, 2013 is approaching quickly.
203. Additionally, in Decision 2012-237,128 the Commission addressed the IFRS deferral
account for distribution utilities, determining that further accounting changes due to IFRS shall
be assessed as a Z factor as discussed below:
689. Fortis and AltaGas requested Y factor treatment for accounting changes. The
Commission considers that impacts associated with major changes to accounting
standards, whether it is the initial adoption of IFRS or any other modifications to
accounting standards, should be infrequent. Other than the initial adoption of IFRS, it is
unforeseeable when subsequent major changes to accounting standards will occur. In
addition, Fortis recognized that the majority of the AUC Rule 026 changes it would need
to make are required for financial reporting purposes, and that regulatory reporting would
likely not be affected. As a result, the Commission determines that because of the
infrequent and unforeseeable nature of accounting changes, they should be assessed as Z
factors.129 (footnotes removed)
204. For the above reasons, the Commission shall dispense with the IFRS deferral accounts for
both distribution and transmission.
127
Exhibit 208.02, EDTI argument, page 20, paragraphs 51-55. 128
Decision 2012-237: Rate Regulation Initiative, Distribution Performance-Based Regulation, Application
No. 1606029, Proceeding ID No. 566, September 12, 2012. 129
Decision 2012-237, page 149, paragraph 689.

2012 Phase I and II Distribution Tariff 2012 Transmission Facility Owner Tariff EPCOR Distribution & Transmission Inc.
44 • AUC Decision 2012-272 (October 5, 2012)
3.12 Updating for 2011 actual amounts
3.12.1 Updating of categories other than operating expenses
205. In the compliance filing required by order of this decision, EDTI proposed to adjust its
2012 forecast for 2011 actual results consistent with the approach approved in
Decision 2010-505.
206. EDTI stated adjustments would be made for 2012 opening rate base and construction
work in progress which would also impact 2012 forecast return on rate base. The 2012 forecast
depreciation expense would be adjusted, and the actual costs of long term debt placed in 2011
would be reflected. This long-term debt adjustment would also impact the weighted average cost
of debt as well as the weighted average cost of capital for the 2012 forecast.130
207. The CCA proposed that EDTI update its 2012 revenue requirement to reflect all actual
asset and liability continuity balances as at December 31, 2011 in place of the forecast amounts
used. The CCA clarified which balances would be included under its proposal.131
208. The CCA also submitted that actual customer numbers as at December 31, 2011 should
be used in place of forecast numbers. The CCA submitted that, since EDTI intends to update the
opening balance of 2012 rate base to reflect 2011 actual capital additions, then 2011 actual
customer numbers should also be used for the determination of 2012 revenue requirement, which
will be re-based for use in the PBR period of 2013-2017.132
Commission findings
209. In Decision 2010-505,133 the Commission addressed the topic of updating forecast
information with actual results in the context of the 2010-2011 GTA as follows:
23. The Commission confirms that it requires the best available information at the
time it makes its decision and confirms its views from Decision 2008-113. There, the
Commission adopted the Board‟s views on the use of updated information in a
prospective rate-setting environment as set out in Decision 2006-004:
In recent years, when confronted with the question of whether or not to
consider events that have occurred after the preparation of revenue
requirement forecasts, the Board has usually taken the position that such
information will be used in assessing the reasonableness and accuracy of
the forecasts and the methodology utilized in preparing the forecasts. The
Board has not, however, substituted the forecasts with the updated
information, except with respect to certain specific forecast items. For
example, the Board has updated interest rate forecasts in determining the
cost of capital, income tax rates, opening balances for plant property and
equipment and has excluded amounts forecast for capital projects that did
not proceed. The Board has determined that the use of updated
information in these particular types of categories was in the overall
public interest and had as its objective an appropriate revenue stream
without undue benefit or detriment to the regulated utility. The utility has
130
Exhibit 186.02, information response AUC-EDTI-58(a). 131
Exhibit 201.01, information response AUC-CCA-2(a). 132
Exhibit 191.01, CCA intervener evidence, page 14-16, paragraphs 35-41. 133
Decision 2010-505, pages 4-5, paragraphs 23 and 30.

2012 Phase I and II Distribution Tariff 2012 Transmission Facility Owner Tariff EPCOR Distribution & Transmission Inc.
AUC Decision 2012-272 (October 5, 2012) • 45
also always been able to update its application and its forecasts to reflect
any unforeseen increases in costs. The Board continues to be of the view
that this is the appropriate use of information that becomes available
subsequent to the preparation of the forecasts underpinning an
application.
…
30. The Commission has traditionally required that a utility‟s revenue requirement
schedules be updated for any year-end actual rate base figures that become available prior
to close of record. These updates, for example, may affect the return on capital and any
associated income taxes. The Commission believes that such updates should apply to
figures that will be, more or less, automatically recalculated in the revenue requirement
model when the year-end actual figures are input. In contrast to this, updating for actuals
in any year does not require an update to forecast items such as the load forecast, capital
spending and operating and maintenance expenses.
210. The Commission retains its views on this matter as set out in Decision 2010-505. With
regard to the CCA‟s proposal to update the forecast customer numbers (which were not
addressed in Decision 2010-505) with 2011 actual amounts, the Commission considers that
unless there is a history of forecasting errors, forecast customer numbers should not be updated.
The Commission has reviewed the forecast accuracy of the actual customer numbers to the
approved numbers.134 As shown in Section 7.2 of this decision, the difference between approved
and actual customer numbers for 2010 and 2011 has only been approximately one per cent,
indicating the forecasts are reasonable.
211. In an attempt to strike a balance between materiality and the prospective nature of
applications, the Commission accepts EDTI‟s proposed adjustments for updating of 2011 actual
results as reasonable for the non-operating expense categories.
212. Consistent with the above, EDTI, in its compliance filing, is directed to reflect all
changes to the 2012 revenue requirement consistent with the approach determined in
Decision 2010-505, when the 2011 actual figures are input into EDTI‟s revenue requirement
model.
3.12.2 Updating of operating expenses
213. The UCA stated that 2011 actual results were $1.07 million lower than the updated 2011
forecast for distribution operating expenses, which included savings for both operations and
maintenance and customer accounting costs of $0.74 million and $0.33 million respectively. The
UCA argued that this was an efficiency gain which should be reflected as a reduction to the 2012
forecast as EDTI‟s 2012 forecast would form the basis of the 2013 going-in rates for PBR.
214. The UCA submitted that the distribution forecasts for 2012 showed increasing levels of
supervision and engineering as well as higher customer accounting costs, driven by meter
reading costs where there was little growth in the number of standard meters as most new meters
were AMR meters. These increases were in contrast to the savings between the 2011 forecast and
actual amounts, which included supervision and engineering cost savings of $0.55 million for
distribution.
134
Exhibit 186.06, information response AUC-EDTI-70, Attachment 1, Schedule 13-1.
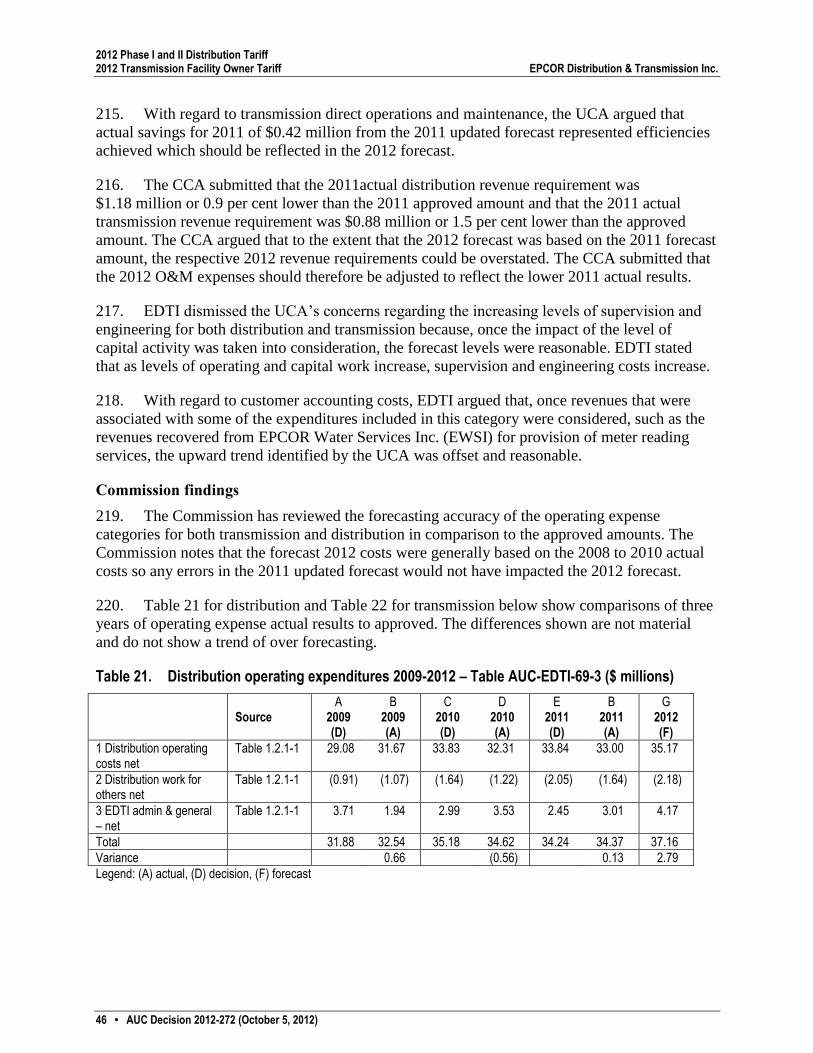
2012 Phase I and II Distribution Tariff 2012 Transmission Facility Owner Tariff EPCOR Distribution & Transmission Inc.
46 • AUC Decision 2012-272 (October 5, 2012)
215. With regard to transmission direct operations and maintenance, the UCA argued that
actual savings for 2011 of $0.42 million from the 2011 updated forecast represented efficiencies
achieved which should be reflected in the 2012 forecast.
216. The CCA submitted that the 2011actual distribution revenue requirement was
$1.18 million or 0.9 per cent lower than the 2011 approved amount and that the 2011 actual
transmission revenue requirement was $0.88 million or 1.5 per cent lower than the approved
amount. The CCA argued that to the extent that the 2012 forecast was based on the 2011 forecast
amount, the respective 2012 revenue requirements could be overstated. The CCA submitted that
the 2012 O&M expenses should therefore be adjusted to reflect the lower 2011 actual results.
217. EDTI dismissed the UCA‟s concerns regarding the increasing levels of supervision and
engineering for both distribution and transmission because, once the impact of the level of
capital activity was taken into consideration, the forecast levels were reasonable. EDTI stated
that as levels of operating and capital work increase, supervision and engineering costs increase.
218. With regard to customer accounting costs, EDTI argued that, once revenues that were
associated with some of the expenditures included in this category were considered, such as the
revenues recovered from EPCOR Water Services Inc. (EWSI) for provision of meter reading
services, the upward trend identified by the UCA was offset and reasonable.
Commission findings
219. The Commission has reviewed the forecasting accuracy of the operating expense
categories for both transmission and distribution in comparison to the approved amounts. The
Commission notes that the forecast 2012 costs were generally based on the 2008 to 2010 actual
costs so any errors in the 2011 updated forecast would not have impacted the 2012 forecast.
220. Table 21 for distribution and Table 22 for transmission below show comparisons of three
years of operating expense actual results to approved. The differences shown are not material
and do not show a trend of over forecasting.
Table 21. Distribution operating expenditures 2009-2012 – Table AUC-EDTI-69-3 ($ millions)
Source
A 2009 (D)
B 2009 (A)
C 2010 (D)
D 2010 (A)
E 2011 (D)
B 2011 (A)
G 2012 (F)
1 Distribution operating costs net
Table 1.2.1-1 29.08 31.67 33.83 32.31 33.84 33.00 35.17
2 Distribution work for others net
Table 1.2.1-1 (0.91) (1.07) (1.64) (1.22) (2.05) (1.64) (2.18)
3 EDTI admin & general – net
Table 1.2.1-1 3.71 1.94 2.99 3.53 2.45 3.01 4.17
Total 31.88 32.54 35.18 34.62 34.24 34.37 37.16
Variance 0.66 (0.56) 0.13 2.79
Legend: (A) actual, (D) decision, (F) forecast

2012 Phase I and II Distribution Tariff 2012 Transmission Facility Owner Tariff EPCOR Distribution & Transmission Inc.
AUC Decision 2012-272 (October 5, 2012) • 47
Table 22. Transmission operating expenditures 2009-2012 – Table AUC-EDTI-69-4 ($ millions)
Source
A 2009 (D)
B 2009 (A)
C 2010 (D)
D 2010 (A)
E 2011 (D)
F 2011 (A)
G 2012 (F)
1 Distribution operating costs net
Table 1.2.1-1 9.87 10.3 11.53 11.79 11.62 12.15 13.64
2 Distribution work for others net
Table 1.2.1-1 (0.27) (0.20) (0.09) (0.04) (0.09) (0.06) (0.10)
3 EDTI admin & general – net
Table 1.2.1-1 1.54 1.01 1.55 1.36 1.82 1.66 1.44
Total 11.14 11.11 12.99 13.11 13.35 13.75 14.98
Variance (0.03) 0.12 0.40 1.23
221. As acknowledged by the CCA and the UCA, the differences are relatively small in
comparison to the total expenses and some categories also having offsetting revenues.
222. As discussed in the Commission findings in the Section 3.12.1 above, for the updates
from 2011 actual results for categories other than operating expenses, the Commission does not
typically adjust operating expense forecasts for actual results, unless the forecast methodology
used or the forecasting accuracy were in question.
223. Further, both the UCA and the CCA argued that 2012 rates will be used as going-in rates
for distribution PBR. Decision 2012-237 addressed adjustments to PBR going-in rates as
follows:
88. … The Commission confirms the findings in Decision 2009-035 that adjustments
to going-in rates should not be made to reflect actual results. Further, adjustments should
not be made selectively but, rather, should only be made in the context of a full rate case.
Adjustments may be made in exceptional situations, however, like the case of the short
term incentive plan adjustment approved in the ENMAX decision.
89. Accordingly, the Commission will consider adjustments that are in the nature of
a correction to the going-in rates, and which are not rate adjustments made after-the-fact
to reflect actual results. ….135
224. The Commission does not accept the UCA and the CCA positions that the operating
expense forecast for 2012 should be adjusted for 2011 actual results, consistent with previous
Commission decisions, specifically Decision 2010-505 and 2008-113,136 and given that the
forecasting accuracy on a total basis appears reasonable. Further, with respect to the going-in
rates for the PBR term, adjustments will not be made for actual results consistent with
Decision 2012-237.
135
Decision 2012-237: Rate Regulation Initiative – Distribution Performance-Based Regulation, Application
1606029, Proceeding ID No. 566, September 12, 2012, page 20, paragraphs 88 – 89. 136
Decision 2008-113: ATCO Gas 2008-2009 General Rate Application Phase I, Application No. 1553052,
Proceeding ID. 11, November 13, 2008.

2012 Phase I and II Distribution Tariff 2012 Transmission Facility Owner Tariff EPCOR Distribution & Transmission Inc.
48 • AUC Decision 2012-272 (October 5, 2012)
3.13 Operating expenses
3.13.1 Forecasting of distribution and transmission repair costs
225. EDTI has developed and used an updated methodology for forecasting its distribution and
transmission repair costs which is based on a three year average of EDTI‟s actual repair costs by
expense type for 2008 through 2010.137 Actual repair costs have exceeded forecast repair costs in
each of 2008 to 2010.
226. The updated methodology uses the following steps:
actual repair costs for each year are broken down into their expense types
each expense type is then individually adjusted for actual cost escalation for those years
an average cost for each expense type is then calculated for 2008 to 2010 in 2010 dollars
each expense type is inflated using 2011 approved escalation rates from
Decision 2010-505
all expense types are then inflated to 2012 using the proposed 2012 escalation factors
the proposed employee fringe benefit rates are finally applied to all labour costs
227. The previous forecast method took an average of the total actual repair costs for the
previous three years; then adjusted the average total for inflation for the applicable test year
using EDTI‟s common escalation factors; and adjusted for expected increases or decreases in
overall work requirements.
228. The CCA expressed concern that the resulting forecast using the revised methodology is
significantly higher than previous actual results from 2008 to 2010; possibly due to double
counting of escalation. In response to a CCA information request for backcasting information to
assess the accuracy of 2009 and 2010 actual results under the proposed methodology, EDTI
responded that it did not have sufficient time available to prepare the requested information
under the IR process timelines.
229. The CCA argued that the revised methodology should be denied until further examination
can take place at EDTI‟s next GTA because sufficient evidence was not provided as part of this
proceeding. It was the CCA‟s position that the revised methodology produced exaggerated
forecast results.138
230. EDTI responded that the previous forecast method produced unreasonably low forecast
costs compared to actuals. EDTI argued that it had provided various information in response to
IRs including a backcast of 2011 costs which compared the old and proposed methods139 that
demonstrated the refined method provided a more reliable forecast.140
231. EDTI argued that the CCA analysis was flawed and that no double counting of escalation
for any of the expense types occurred. EDTI stated that the 2011 backcast that it had provided
137
Exhibit 3, application, pages 84-86, paragraphs 204-209. 138
Exhibit 201.01, CCA argument, pages 8-10, paragraphs 31-44. 139
Exhibit 168.09, information response CCA-EDTI-91, Attachment 1. 140
Exhibit 208.02, EDTI argument, pages 21-22, paragraphs 56-63.

2012 Phase I and II Distribution Tariff 2012 Transmission Facility Owner Tariff EPCOR Distribution & Transmission Inc.
AUC Decision 2012-272 (October 5, 2012) • 49
showed the refined methodology had produced a forecast which was lower than 2011 actuals that
was contrary to the CCA‟s claim of exaggerated forecasts.141
Commission findings
232. The Commission has reviewed the refined methodology calculation along with the
comparison to the previous method, as provided by EDTI and as shown in Table 23 below.
Based on this review, the Commission finds that the refined methodology does not double count
escalation but rather adjusts the historical dollars to a relatively constant dollar basis, which is
then escalated using a two step process to forecast the adjusted average amounts into 2012
dollars.
233. The Commission finds the refined methodology as proposed by EDTI for use in
forecasting both distribution and transmission repair costs to be reasonable, given the under-
forecasting that has been experienced by EDTI for 2008 through 2010.
Table 23. 2011 backcast – comparison of three-year average calculation methodologies – Table CCA-EDTI-91-1 ($ millions)
A B C D E F
2011 forecast calculation
Section reference
Description
Escalated 3-year actual
average 2007-2009 A
Previous method
Refined 3-year average method
(2007-2009 A)
2011 actuals
Distribution function
1 5.1-3 High load move services for external parties
0.05 0.05 0.06 0.06
2 5.1-3 Installation of temporary service connections
0.46 0.47 0.51 0.42
3 4.3.1 Distribution 5 kV and 25 kV substation repair
0.03 0.03 0.03 0.03
4 4.4.3 Distribution aerial repair and aerial system damage
0.20 0.20 0.22 0.15
5 4.5.4 Distribution network repair 0.03 0.03 0.04 0.06
6 4.5.5 Distribution underground repair and unrecoverable damage costs
0.83 0.86 0.94 1.08
7 4.7.3 Meter repair 0.04 0.04 0.05 0.04
8 4.11.1 Distribution aerial transformer repair
0.09 0.09 0.10 0.08
9 4.11.2 Distribution aerial transformer repair
0.10 0.10 0.11 0.11
10 Total distribution 1.83 1.88 2.05 2.04
141
Exhibit 211.02, EDTI reply argument, pages 35-37, paragraphs 93-100.

2012 Phase I and II Distribution Tariff 2012 Transmission Facility Owner Tariff EPCOR Distribution & Transmission Inc.
50 • AUC Decision 2012-272 (October 5, 2012)
A B C D E F
2011 forecast calculation
Section reference
Description
Escalated 3-year actual
average 2007-2009 A
Previous method
Refined 3-year average method
(2007-2009 A)
2011 actuals
Transmission function
11 6.3.3.1 Transmission substation apparatus 0.34 0.35 0.38 0.39
12 6.3.3.2 Transmission substation relaying 0.11 0.12 0.13 0.21
13 6.3.3.3 Transmission substation SCADA, telecontrol and communication system repair
0.07 0.07 0.08 0.06
14 6.3.3.4 Transmission substation buildings and switchyards
0.24 0.25 0.28 0.38
15 6.4 Transmission aerial repair 0.05 0.05 0.05 0.03
16 6.5 Transmission underground cable repair
0.09 0.10 0.11 0.21
17 Total transmission 0.90 0.93 1.02 1.27
18 Total distribution + transmission 2.73 2.81 3.08 3.30
19 20
Distribution variance 2011 actual – previous method 2011 actual – refined method
0.16
(0.02)
21 22
Transmission variance 2011 actual – previous method 2011 actual – refined method
0.34
0.25
234. The Commission rejects the CCA‟s proposal to deny use of the refined methodology and
accepts the forecast methodology and resulting forecasts for both distribution and transmission
repair costs as filed.
3.13.2 Cost control metrics
235. The CCA submitted that because EDTI will commence PBR in 2013, the Commission‟s
determination of costs for the 2012 GTA should be considered in the context of what EDTI has
been able to achieve in prior years relative to the rapidly escalating costs since 2008.142
236. The CCA introduced a metric into this proceeding referred to as “controllable operating
cost per customer” (COCC). EDTI defined controllable operating cost in an information
response143 as follows:
….those costs under the reasonable control of EDTI that reflect the underlying year over
year recurring costs. EDTI understands non-controllable costs to mean those costs subject
to reserves, deferrals, flow through operating costs and costs that have offsetting
revenues, such as work for others.
237. The CCA submitted that the COCC metric for EDTI distribution showed a rapid increase
from 2009 through to 2011, followed by a slight increase in 2012. The COCC metric for EDTI
transmission showed a steady increase from 2009 to 2012.
142
Exhibit 201.01, CCA argument, page 23, paragraph 91. 143
Exhibit 150.01, information response CCA-EDTI-28(b).

2012 Phase I and II Distribution Tariff 2012 Transmission Facility Owner Tariff EPCOR Distribution & Transmission Inc.
AUC Decision 2012-272 (October 5, 2012) • 51
238. The CCA argued that the COCC was a useful tool to assess the productivity gains or
losses achieved by EDTI. For this reason, EDTI should be directed to file this metric in future
proceedings as well as a detailed assessment of the rationale underlying the changes in this
metric.
239. EDTI responded that the CCA had overstated the increase in the COCC metric while
ignoring the drivers behind these trends, which EDTI had provided.
240. EDTI argued that, while COCC may contribute to an overall picture of productivity
within an organization, it should be considered with other important measures related to
reliability, safety, and customer satisfaction. For this reason, COCC should not be used as a basis
for assessing forecast costs but instead the utility must provide evidence to justify its forecast
costs.
241. While EDTI was not opposed to filing the controllable cost per customer measure, it
could see little point in making it a filing requirement for future tariff applications.
Commission findings
242. The Commission recently issued Decision 2012-237. Elements of that proceeding set out
the measures and reporting that are required under PBR. The Commission rejects the CCA
proposal to make the controllable operating cost per customer a requirement for future
proceedings for distribution.
243. For regulation of transmission utilities, under the current regulatory framework,
interveners can continue to participate in testing of the application and raise issues such as trends
in controllable operating cost per customer.
3.13.3 Inspection of customer service connections on private property
244. EDTI uses contractors to inspect customer-owned facilities on private property to ensure
compliance with EDTI‟s Customer Connection Guide and the Alberta Safety Codes Act, RSA
2000, c. S-1. The contractor advises EDTI when the facilities are safe to energize and also
provides inspectors to assist EDTI‟s engineers in assessing a customer‟s service requirements
and investigating power quality, code and safety issues relating to customer-owned facilities on
private property.144
245. Prior to 2011, a qualified contractor, The Inspections Group Inc., had been given the
exclusive rights by the City to issue electrical permits and perform electrical inspections within
the city boundaries. In 2011, the City took over the role of issuing electrical permits within city
boundaries. For this application, EDTI averaged the historical cost per inspection of
approximately $77 with the rate proposed by the City of $150 to develop its forecast using
$113.50 per inspection. The table below shows the historical and forecast costs for this category.
The $0.37 million increase is primarily due to the increased unit rate per inspection.
144
Exhibit 3, application, page 399, paragraphs 1074-1076.

2012 Phase I and II Distribution Tariff 2012 Transmission Facility Owner Tariff EPCOR Distribution & Transmission Inc.
52 • AUC Decision 2012-272 (October 5, 2012)
Table 24. Inspection of customer service connections on private property 2009-2012 – Table 4.8.1-1 ($ millions)
A
2009 (A) B
2010 (D) C
2010 (A) D
2011 (D) E
2011 (UF) F
2012 (F)
1 0.60 0.40 0.73 0.47 0.57 0.94
2 Variance 0.33 0.10 0.37
Legend: (A) actual, (D) decision, (UF) updated forecast, (F) forecast
246. The CCA argued that the increase in 2012 costs was not reasonable now that the City will
take over the role of issuing electrical permits, performing inspections, and managing all relevant
site information at a cost significantly higher than the independent contractor previously used by
EDTI.
247. The CCA initially recommended that the proposed increase be denied and instead that the
2011 updated forecast should be escalated by the 3.2 per cent proposed in the application for
EDTI contractors to $0.59 million resulting in a proposed reduction of $0.35 million.145
248. EDTI responded that electrical permitting and inspections under the Safety Codes Act in
Edmonton is under the authority of the City. EDTI indicated it had negotiated an inspection price
of $110 per inspection, and that EDTI and the City were still working on a final draft of the
agreement which will include the $110 per inspection rate, as other matters in the contract
remain to be finalized.146
249. The CCA replied that EDTI should be directed to reflect the negotiated $110 per
inspection price, and to provide details of all other matters in the contract which remain to be
finalized as part of the compliance filing.
Commission findings
250. The Commission observes that the issue raised by the parties was the rate per inspection
and not the volume to which the rate was applied. While the CCA concluded that the forecast
should be recalculated downwards for a reduction of $150 to $110 per inspection, the
Commission notes that, in its application, EDTI indicated it had used a rate of $113.50 per
inspection.
251. The Commission rejects the CCA proposal to reduce the forecast by using the negotiated
$110 rate per inspection, as the resulting adjustment would not be material.
252. The Commission rejects the CCA‟s proposal regarding all other matters in the contract
which remain to be finalized because the Commission has accepted EDTI‟s forecast of its
inspection costs as reasonable.
3.13.4 Specialized rental equipment
253. Costs related to specialized rental equipment are included in fleet costs for both
distribution and transmission which are allocated to various operating cost categories and capital
projects that the fleet is used to support.
145
Exhibit 201.01, CCA argument, pages 3-4, paragraphs 9-16. 146
Exhibit 208.02, EDTI argument, page 52, paragraph 164.
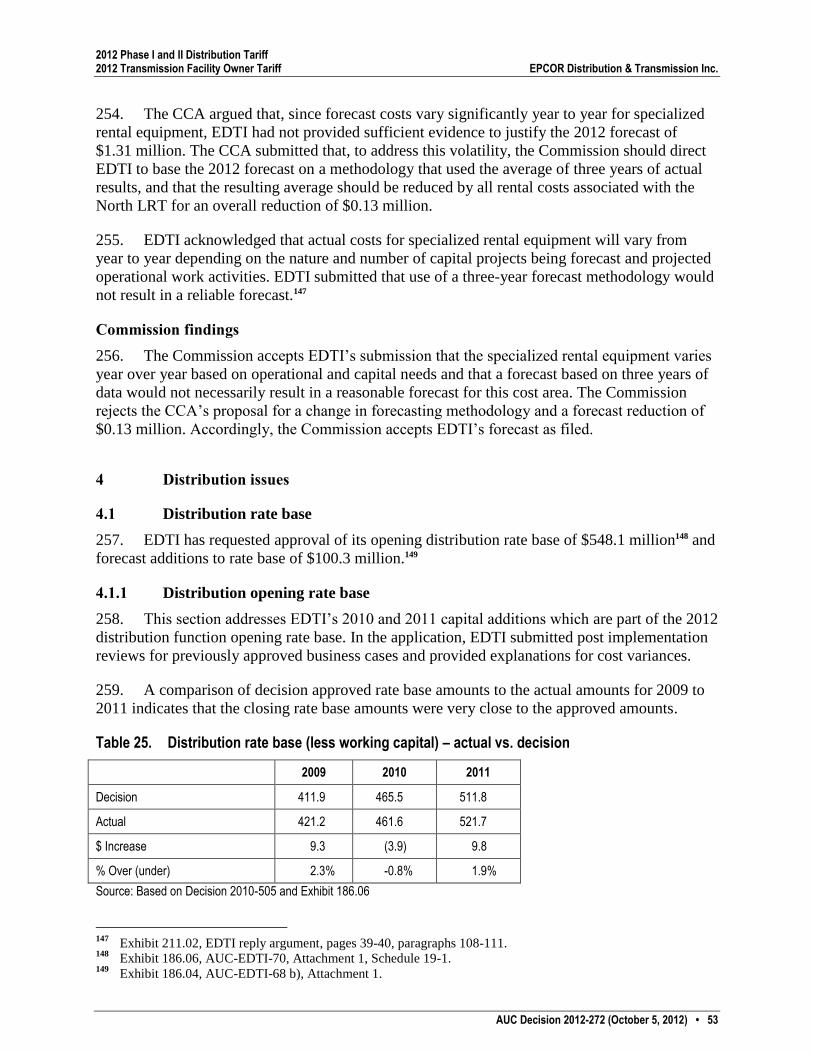
2012 Phase I and II Distribution Tariff 2012 Transmission Facility Owner Tariff EPCOR Distribution & Transmission Inc.
AUC Decision 2012-272 (October 5, 2012) • 53
254. The CCA argued that, since forecast costs vary significantly year to year for specialized
rental equipment, EDTI had not provided sufficient evidence to justify the 2012 forecast of
$1.31 million. The CCA submitted that, to address this volatility, the Commission should direct
EDTI to base the 2012 forecast on a methodology that used the average of three years of actual
results, and that the resulting average should be reduced by all rental costs associated with the
North LRT for an overall reduction of $0.13 million.
255. EDTI acknowledged that actual costs for specialized rental equipment will vary from
year to year depending on the nature and number of capital projects being forecast and projected
operational work activities. EDTI submitted that use of a three-year forecast methodology would
not result in a reliable forecast.147
Commission findings
256. The Commission accepts EDTI‟s submission that the specialized rental equipment varies
year over year based on operational and capital needs and that a forecast based on three years of
data would not necessarily result in a reasonable forecast for this cost area. The Commission
rejects the CCA‟s proposal for a change in forecasting methodology and a forecast reduction of
$0.13 million. Accordingly, the Commission accepts EDTI‟s forecast as filed.
4 Distribution issues
4.1 Distribution rate base
257. EDTI has requested approval of its opening distribution rate base of $548.1 million148 and
forecast additions to rate base of $100.3 million.149
4.1.1 Distribution opening rate base
258. This section addresses EDTI‟s 2010 and 2011 capital additions which are part of the 2012
distribution function opening rate base. In the application, EDTI submitted post implementation
reviews for previously approved business cases and provided explanations for cost variances.
259. A comparison of decision approved rate base amounts to the actual amounts for 2009 to
2011 indicates that the closing rate base amounts were very close to the approved amounts.
Table 25. Distribution rate base (less working capital) – actual vs. decision
2009 2010 2011
Decision 411.9 465.5 511.8
Actual 421.2 461.6 521.7
$ Increase 9.3 (3.9) 9.8
% Over (under) 2.3% -0.8% 1.9%
Source: Based on Decision 2010-505 and Exhibit 186.06
147
Exhibit 211.02, EDTI reply argument, pages 39-40, paragraphs 108-111. 148
Exhibit 186.06, AUC-EDTI-70, Attachment 1, Schedule 19-1. 149
Exhibit 186.04, AUC-EDTI-68 b), Attachment 1.

2012 Phase I and II Distribution Tariff 2012 Transmission Facility Owner Tariff EPCOR Distribution & Transmission Inc.
54 • AUC Decision 2012-272 (October 5, 2012)
260. Interveners did not express concerns with EDTI‟s capital additions over the 2010 to 2011
period. The Commission assessed the reasonableness of EDTI‟s proposed 2012 opening rate
base in the following analysis of capital activity during the 2010 to 2011 period.
261. In order to assess the reasonableness of capital additions to rate base, the Commission
examined the approved forecast capital additions and actual capital activity during the period.
Projects may not be completed in the time period anticipated, resulting in variances between
capital additions and either opening or closing construction work in process (CWIP). Moreover,
projects not approved may be undertaken and actual costs incurred could be over or under the
forecast amounts. In the following analysis, changes in CWIP due to the timing of completion
for projects were considered as well as significant variances in costs incurred. The following
schedule reflects EDTI‟s capital activity for the period from 2009 to 2012.
Table 26. EDTI distribution function capital additions ($ millions)
2009 (D) 2009 (A) 2010 (D) 2010 (A) 2011 (D) 2011 (A) 2012 (F)
Opening CWIP balance 0.7 5.2 21.8 8.1 2.0 15.3 15.7
Capital Expenditures 39.3 52.4 66.2 86.1 68.1 92.9 89.0
Subtotal 40.0 57.6 88.0 94.3 70.0 108.2 104.8
Closing CWIP balance 0.6 8.1 2.0 16.0 13.7 16.4 4.5
Total additions to rate base 39.4 49.5 86.0 78.3 56.4 91.7 100.3
Variance in capital additions 10.1 (7.7) 35.4 8.6
Source: Based on Exhibit 186.04, AUC-EDTI-68 (b), Attachment 1 Legend: (D) decision, (A) actual, (F) forecast
262. As shown in Table 26, 2010 actual capital additions were $7.7 million less than forecast,
capital expenditures exceeded the amount approved in Decision 2010-505 by $19.9 million and
the closing CWIP balance was $14.0 million greater than forecast due to projects that were not
completed when expected. The 2010 opening CWIP balance was $13.7 million less than forecast
due primarily to the postponement of EDTI‟s distribution function Summerside substation
contribution payment because of project delays.
263. The delay of projects from 2009 to 2010 and from 2010 to 2011 explain, to a large extent,
the discrepancy between approved and actual capital additions and the increased closing CWIP
balance for 2010 as compared to the decision amounts in the above table. Some projects had cost
overruns and others cost less than forecast. The combined impact of the change in timing of
projects plus the variances from forecasts, as analyzed below, account for the majority of the
$7.7 million discrepancy in 2010 capital additions.
264. The following three projects were not completed in 2010 as originally forecast:
The life-cycle replacement and extension of underground distribution cable project was
originally forecast to be completed at a cost of $5.6 million, however $1.8 million of
$5.9 million of this capital expenditure remains in CWIP.
The new 15 kV and 25 kV circuit additions (growth project) was originally forecast to be
completed at a cost of $3.2 million; however $3.4 million of the $3.7 million of this
capital expenditure remains in CWIP.

2012 Phase I and II Distribution Tariff 2012 Transmission Facility Owner Tariff EPCOR Distribution & Transmission Inc.
AUC Decision 2012-272 (October 5, 2012) • 55
The North light rail transit (NLRT) distribution system relocate (growth project) was
originally forecast to be completed at a cost of $7.5 million; $7.1 million of capital
expenditures were incurred and all amounts remained in CWIP.
265. The following projects included in capital additions had costs which were at least
$2.0 million greater or less than the 2010 forecast:
Underground residential rebates were $2.1 million greater than the 2010 forecast.
New underground and aerial service connections for commercial industrial, multi-family
and miscellaneous customers were $3.0 million greater than the 2010 forecast.
The Summerside feeders (growth project) was $2.0 million less than the 2010 forecast.
266. For 2011, capital additions were $35.4 million greater than forecast while capital
expenditures exceeded forecast amounts by $24.8 million. Due to the delay in completing some
projects in 2010, the opening CWIP balance was $13.3 million higher than forecast but, by the
end of the year, the variance from forecast had decreased to $2.7 million.
267. EDTI explained that approximately half of the $35.4 million (63 per cent) increase in
2011 capital additions (decision versus actual amounts) was related to capital projects not
completed as planned in 2010. As indicated in the analysis for 2010 above, there was
$12.3 million related to three projects in opening CWIP. The relocation of distribution facilities
to accommodate the northern extension of the City of Edmonton Light Rail Transportation
system, an unanticipated project, accounted for $14.55 million of the 2011 capital additions.150
Also contributing to the increase in capital additions were net cost overruns.
268. EDTI provided detailed explanations151 respecting 2011 project variances. The following
projects included in capital additions had costs which were at least $1.0 million greater or less
than forecast:
Franchise agreement driven relocations and conversions were $4.1 million greater than
forecast.
Underground residential distribution (URD) servicing expenses were $3.7 million greater
than forecast.
Capitalized underground system damage was $2.7 million greater than forecast.
New underground and aerial line reconfigurations and extensions to meet customer
growth were $2.7 million greater than forecast.
The life cycle replacement of extension of underground distribution cable was
$2.3 million greater than forecast.
New underground and aerial service connections for commercial, industrial, multifamily
and miscellaneous customers were $1.5 million greater than forecast.
New 15 kV and 25 kV circuit additions were $1.0 million less than forecast.
Replacement of faulted distribution paper-insulated lead-cased (PILC) cables was
$1.0 million less than forecast.
150
Exhibit 167.02, AUC-EDTI-17. 151
Exhibit 167.06, AUC-EDTI-17 Attachment 3.

2012 Phase I and II Distribution Tariff 2012 Transmission Facility Owner Tariff EPCOR Distribution & Transmission Inc.
56 • AUC Decision 2012-272 (October 5, 2012)
Distribution pole and aerial line life cycle replacements were $1.1 million less than
forecast.
Contributions to EDTI‟s transmission function were $1.3 million less than forecast.
Commission findings
269. With respect to Table 26 above, the Commission notes a discrepancy between the 2010
actual closing CWIP balance of $16.0 million and the 2011 actual opening CWIP balance of
$15.3 million The Commission directs EDTI in its compliance filing to correct the discrepancy
and to reflect this change in the 2012 opening and closing forecast CWIP balances.
270. The Commission has reviewed the cost variance analyses and explanations regarding
project delays in the application, capital business cases, the 33 distribution related post
implementation reviews (D-PIR)152 and IR responses related to the 2010 and 2011 capital
additions. Although the actual capital expenditures differed from the amounts approved on an
individual basis, some higher and some lower, the explanations provided by EDTI were
reasonable. Reasonable explanations were also provided for the introduction of projects which
had not been anticipated and projects which were cancelled. The Commission notes that
interveners did not raise concerns regarding individual projects or the opening rate base amounts.
Based on its review and analysis of the post implementation reviews and other explanations
provided in the application, and subject to the direction above regarding CWIP balances, the
Commission approves the opening distribution rate base as filed.
4.1.2 Distribution 2012 capital additions
271. EDTI applied for approval of $100.3 million of distribution capital additions for 2012. In
its application, EDTI classified its 2012 forecast and previous years‟ capital additions into major
cost categories, generally following uniform system of accounts/minimum filing requirements
(USA/MFR) numbering for distribution capital.153 Within each major category, similar projects
were grouped into sub-categories consistent with directions arising from Decision 2006-054.
EDTI also indicated whether the projects were growth driven, life-cycle replacement or process
improvement.154
272. As can be seen from the following table provided by EDTI, growth projects have been
and continue to be the primary driver of EDTI‟s distribution capital program for the 2012 test
year. The most volatile component of capital additions is EDTI‟s distribution function
contributions for transmission assets, which EDTI explained is related to the timing of the
completion of AESO-directed transmission projects.155
152
Exhibit 55, Appendix E-1-D-PIR. 153
Exhibit 3, application, paragraph 3124. 154
Exhibit 206.02, argument. 155
Exhibit 3, application, page 1199.

2012 Phase I and II Distribution Tariff 2012 Transmission Facility Owner Tariff EPCOR Distribution & Transmission Inc.
AUC Decision 2012-272 (October 5, 2012) • 57
Table 27. Distribution capital additions summary 2009-2012
TOTALS 2009 (A) 2010 (A) 2011 (A) 2012 (F)
Life-cycle projects 12.4 18.6 28.4 26.5
Performance improvement projects 2.5 2.1 3.3 3.5
Growth projects 24.1 27.8 51.0 41.2
Multi-category 9.0 15.8 9.5 12.7
Subtotal 48.0 64.3 92.2 83.9
Contributions 1.5 13.8 (0.4) 16.4
Grand Totals 49.4 78.3 91.7 100.3
Source: Table 12.2-1; Exhibit 167.06, Attachment 3
273. EDTI submitted that major growth related projects included:
a. Increased capital additions associated with underground residential distribution (URD)
servicing and related activities, including lot rebates.
b. The addition and modification of distribution infrastructure in response to strong
economic growth in the City of Edmonton over the past few years, such as the new
feeders from the Poundmaker Substation.
c. Life cycle replacement spending.
274. Pursuant to Commission directions arising from Decision 2006-054, EDTI provided a
total of 31 distribution capital project business cases (D-CBC).156 Interveners did not express
concerns with EDTI‟s 2012 forecast distribution capital additions.
Commission findings
275. The Commission has reviewed all the business cases and found the projects to be justified
and the cost estimates reasonable. The Commission approves EDTI‟s distribution function
forecast capital additions as filed.
4.2 House service connection upgrades and relocates
276. House service connection upgrades and relocates include labour, vehicle, and material
costs associated with customer requests for upgrades to, or relocations of, their aerial service
connections. The following table157 summarizes the expense forecasts and actual results for this
category:
Table 28. House service connection upgrades and relocates 2009-2012 – Table 4.7.2-5 ($ millions)
A
2009 (A) B
2010 (D) C
2010 (A) D
2011 (D) E
2011 (UF) F
2012 (F)
1 0.45 0.36 0.39 0.39 0.40 0.41
2 Variance 0.03 0.01 0.01
Legend: (A) actual, (D) decision, (UF) updated forecast, (F) forecast
156
Exhibit 54, Appendix E-1-D-CBC. 157
Exhibit 3, application, page 393, paragraph 1051.

2012 Phase I and II Distribution Tariff 2012 Transmission Facility Owner Tariff EPCOR Distribution & Transmission Inc.
58 • AUC Decision 2012-272 (October 5, 2012)
277. EDTI has modified its methodology to prepare the 2012 forecast based on a three-year
annual average of actual service changeover requests from 2008 to 2010. EDTI‟s previous
forecast methodology was based on the number of energized residential sites in its service area
and the latest year‟s actual service changeover requests.
278. While the CCA did not oppose the use of the proposed three year average, it considered
the 2010 actual number of changeover requests to be unusually high. For this reason, the CCA
recommended that a four-year average be used instead.158
279. EDTI rejected the CCA proposal because the use of the three-year average already
addressed the volatility that resulted from a high year, and it also allowed for a higher than usual
year to be included when calculating the average.
Commission findings
280. The Commission finds that the forecasting method based on the average of three years
proposed by EDTI better addresses the volatility than the previous methodology. The
Commission is not persuaded by the CCA that a four-year period is warranted based on 2010
data, as typically three years of data are used to address volatility and a three-year forecast
methodology has been utilized elsewhere in the application.
5 Transmission issues
5.1 Transmission rate base
281. EDTI has requested approval of its opening transmission rate base of $311.5 million,159
and forecast additions to rate base of $46.4 million.160
5.1.1 Transmission opening rate base
282. This section addresses EDTI‟s 2010 and 2011 capital additions which were included in
the 2012 transmission function opening rate base. In the application, EDTI submitted 30 post-
implementation reviews for previously approved business cases and provided explanations for
cost variances.
283. As shown in the following table, closing rate base amounts for the period from 2009 to
2011 were between 2.4 per cent and 3.1 per cent less than the amounts approved in
Decision 2010-505.
158
Exhibit 201.01, CCA argument, pages 12-13, paragraphs 51-56. 159
Exhibit 186.06. AUC-EDTI-70, Attachment 1, Schedule 9-1. 160
Exhibit 186.05. AUC-EDTI-68 b), Attachment 2.

2012 Phase I and II Distribution Tariff 2012 Transmission Facility Owner Tariff EPCOR Distribution & Transmission Inc.
AUC Decision 2012-272 (October 5, 2012) • 59
Table 29. Transmission rate base (less working capital) – actual vs. decision
2009 2010 2011
Decision 289.0 304.6 324.2
Actual 282.1 296.9 313.9
$ Increase (6.9) (7.7) (10.2)
% Over (Under) -2.4% -2.5% -3.1%
Source: Based on Decision 2010-505; Exhibit 186.06
284. In order to assess the reasonableness of capital additions, the Commission has examined
the actual capital activity during the period. Projects may not be completed in the time period
anticipated, resulting in variances between capital additions and either opening or closing CWIP.
Moreover, projects not approved may be undertaken and actual costs incurred could be over or
under the forecast amounts. In the following analysis, changes in CWIP due to the timing of
completion of projects will be considered as well as significant variances in costs incurred. The
following schedule sets out EDTI‟s capital activity for the period from 2009 to 2012.
Table 30. EDTI transmission function capital additions ($ millions)
2009 (D) 2009 (A) 2010 (D) 2010 (A) 2011 (D) 2011 (A) 2012 (F)
Opening CWIP balance 3.4 9.8 22.7 22.7 21.0 24.8 54.8
Capital Expenditures 25.6 32.0 46.8 35.0 24.2 58.6 14.5
Subtotal 29.1 41.8 69.5 57.7 45.2 83.4 69.4
Closing CWIP balance 4.7 22.7 21.0 24.8 30.2 58.3 22.9
Total additions to rate base 24.4 19.1 48.5 32.9 15.0 25.1 46.4
Variance 5.3 (15.6) 10.1 21.3
Source: Based on Exhibit 186.05, AUC-EDTI-68 (b), Attachment 2
285. As discussed in Section 13.2.1.10, the Heartland project is a joint venture with AltaLink
and the majority of EDTI‟s Heartland related expenditures are transfers to EDTI from AltaLink.
To better understand the capital activity presented in the above table, the Commission
constructed the following table, which excludes Heartland related expenditures.

2012 Phase I and II Distribution Tariff 2012 Transmission Facility Owner Tariff EPCOR Distribution & Transmission Inc.
60 • AUC Decision 2012-272 (October 5, 2012)
Table 31. EDTI transmission function capital expenditures and capital additions excluding Heartland ($ millions)
2009 (D) 2009 (A) 2010 (D) 2010 (A) 2011 (D) 2011 (A) 2012 (F)
Opening CWIP balance 0.7 8.2 13.6 13.6 6.1 10.4 11.1
Capital expenditures 24.2 24.5 40.9 29.7 20.7 30.5 58.2
Subtotal 24.9 32.7 54.5 43.2 26.7 40.8 69.4
Closing CWIP balance 0.5 13.6 6.1 10.4 11.7 15.7 22.9
Total additions to rate base 24.4 19.1 48.5 32.9 15.0 25.1 46.4
Variance 5.3 (15.6) 10.1 21.3
Source: Exhibit 186.05, AUC-EDTI-68 (b), Attachment 2
Table 32. Heartland 500 kV transmission ($ millions)
2009 (D) 2009 (A) 2010 (D) 2010 (A) 2011 (D) 2011 (A) 2012 (F)
Opening CWIP balance 2.7 1.6 9.1 9.1 14.9 14.5 43.7
Capital expenditures (transfer to partnership)
1.4 7.5 5.8 5.3 3.5 28.1 (43.7)
Subtotal 4.2 9.1 15.0 14.5 18.5 42.6 -
Closing CWIP balance 4.2 9.1 15.0 14.5 18.5 42.6 -
Total additions to rate base - -
- - - - -
Source: Exhibit 186.05, AUC-EDTI-68 (b), Attachment 2
286. As shown in Table 31, 2010 actual capital expenditures and additions to rate base were
$11.3 million and $15.6 million respectively lower than forecast, while closing 2010 CWIP was
$4.3 million greater than forecast. The 2010 variances were primarily due to the following
projects not being completed in 2010:
904L line de-bottlenecking growth project – due to delays and increases in the scope of
work, capital expenditures and additions to rate base were respectively $5.8 and
$8.0 million less than forecast leading to a closing CWIP balance which was $2.2 million
greater than forecast.
The transmission cable forced oil cooling system (FOCS) programmable logic controllers
(PLCs) life cycle replacement project – due to delays, capital expenditures and additions
to rate base were respectively $2.9 and $4.1 million less than forecast, contributing to a
closing CWIP balance that was $1.2 million greater than forecast.
The cable barrier splice performance improvement project – due to delays in construction
work, capital expenditures and additions to rate base were respectively $4.9 and
$6.5 million less than forecast, which led to a closing CWIP balance that was
$1.6 million greater than forecast.
287. As shown in Table 31, for 2011, actual capital expenditures and additions to rate base
were $9.8 and $10.1 million respectively greater than forecast.

2012 Phase I and II Distribution Tariff 2012 Transmission Facility Owner Tariff EPCOR Distribution & Transmission Inc.
AUC Decision 2012-272 (October 5, 2012) • 61
288. Opening CWIP was $4.3 million greater than forecast while closing CWIP was
$4.0 million greater than forecast. The $15.6 million reduction in forecast capital additions in
2010 was offset by the $9.8 million additions in excess of forecast in 2011 and the $4 million
higher-than-forecast balance in ending CWIP.
289. EDTI provided explanations for the transmission capital cost variances in the application
including 30 post-implementation reviews (PIRs).161 Additional details were provided by EDTI
in response to IRs.
290. Major contributors to the increase in capital additions included the completion of the
transmission cable FOCS system PLCs life cycle replacement project at $2.7 million greater than
forecast, and the 904L line de-bottlenecking growth project at a cost of $2.8 million greater than
forecast. Further, there was very little progress made on the cable barrier splice performance
improvement project and therefore $0.3 million was added to CWIP.
291. The increase in closing CWIP was primarily due to the Poundmaker substation POD
addition growth project, which has a forecast in-service date of September 1, 2012,162 for which
EDTI incurred expenditures net of customer contributions in 2011 that were $2.4 million greater
than forecast.
292. The above increases were offset by EDTI‟s limited progress on its system planning load
and sustainability study, which was approved in Decision 2010-505 with a forecast cost of
$1.94 million. Should the planning load and sustainability study identify the need for further life
cycle replacement projects, EDTI proposed that the cost of the engineering study should be
moved to rate base from CWIP in conjunction with the addition to rate base of the expenditures
associated with the replacement projects identified. Furthermore, EDTI submitted that these
projects and their associated costs will be included in future capital forecasts for approval by the
Commission.163
293. Interveners did not raise concerns with EDTI‟s opening transmission function capital rate
base amounts.
Commission findings
294. The opening rate base for 2010 was $6.9 million less than approved in Decision
2010-505. During 2010 and 2011, the discrepancy increased to $10.2 million by an amount
approximately equal to the $4 million increase in CWIP, primarily due to the timing of the
completion of projects. Hence, capital additions during the 2010 to 2011 period were
$5.5 million less than approved in Decision 2010-505 (see Table 31) with the negative variance
in capital additions offset primarily due to the timing of projects, as reflected in the $4 million
higher than approved ending CWIP balance.
295. The Commission has reviewed the analyses of individual project variances provided in
the application including the 30 post implementation reviews provided.164 The Commission finds
that the capital additions are reasonable and accordingly approves EDTI‟s transmission function
161
Exhibit 57, Appendix E-2-T-PIR. 162
Exhibit 3, application, paragraph 4101. 163
Exhibit 3, application, paragraph 4662. 164
Exhibit 57, Appendix E-2-T-PIR.

2012 Phase I and II Distribution Tariff 2012 Transmission Facility Owner Tariff EPCOR Distribution & Transmission Inc.
62 • AUC Decision 2012-272 (October 5, 2012)
2012 opening rate base as filed, subject to the following direction regarding CWIP balances. The
Commission directs EDTI to correct the $4.6 million discrepancy between 2011 actual closing
CWIP and 2012 forecast opening CWIP and to reflect this correction in 2012 opening and
closing CWIP balances in the compliance filing.
296. The Commission agrees in principle with EDTI‟s proposal to transfer the costs of the
system planning load and sustainability study to rate base in conjunction with the addition to rate
base of life-cycle expenditures that arise out of the study. As EDTI is not transferring the costs to
rate base at this time, a review of the project costs incurred will be made at the time the request
for transfer to rate base is submitted.
5.1.2 Transmission 2012 capital additions
297. EDTI has applied for approval of $46.4 million of 2012 transmission capital additions.
298. In the application, EDTI grouped its transmission capital additions into major cost
categories including AESO direct-assigned projects, transmission substation equipment, and
underground transmission equipment. Within each major category, all similar projects were
grouped into sub-categories consistent with directions 31, 32, and 33 from Decision 2006-054.
EDTI also classified its capital projects as being either growth driven, life-cycle replacement or
process improvement. The data in the following table indicates that growth-driven projects are
the primary driver of EDTI‟s 2012 transmission capital program.
Table 33. Transmission capital additions summary 2009-2012
TOTALS 2009 (A) 2010 (A) 2011 (A) 2012 (F)
Life-cycle projects 13.9 11.3 15.0 18.6
Performance improvement projects 1.5 3.4 4.8 5.8
Growth projects 6.1 38.4 21.1 38.4
Insert subtotals 21.6 53.1 40.9 62.8
Contributions -2.4 -20.2 -15.8 -16.4
Grand Totals 19.2 32.9 25.1 46.4
Source: Based on Table 13.2-1; Exhibit 167.07, AUC-EDTI-17 Attachment 4
299. The largest projects in EDTI‟s forecast transmission capital program for the 2012 test
year are the Poundmaker Substation ($24.66 million) and the Genesee interface to the new
HVDC converter station ($12.91 million). Life-cycle spending is forecast to be $3.6 million
higher than 2011 actual additions, primarily in response to the need to replace aging medium
voltage switchgear infrastructure.165 The Heartland project, as discussed in Section 13.2.1.10 of
the application, is forecast to be transferred from CWIP to a partnership.
Commission findings
300. In the application, EDTI provided a total of eighteen transmission capital project business
cases (T-CBC).166 The Commission has reviewed the documentation related to each of the capital
165
Exhibit 3, application, paragraph 3960. 166
Exhibit 56, Appendix E-2-T-CBC.

2012 Phase I and II Distribution Tariff 2012 Transmission Facility Owner Tariff EPCOR Distribution & Transmission Inc.
AUC Decision 2012-272 (October 5, 2012) • 63
projects and, subject findings in Section 5.1.3, the Commission approves the forecast
$46.4 million capital additions as filed.
5.1.3 Other issues related to transmission capital additions
301. Interveners expressed concerns regarding the following factors which are related to the
transmission capital additions forecast. These are examined individually in the following
sections.
age as a criteria in EDTI‟s asset replacement strategy
capacity to complete forecast capital work
the Heartland project
AESO direct-assigned projects
process improvement initiatives
5.1.3.1 Age as a criteria in EDTI’s asset replacement strategy
302. EDTI submitted that its aging infrastructure was causing problems including reliability
and security of supply, public and employee safety, stranded capacity, operational difficulties,
environmental concerns and an inability to handle anticipated load growth.
303. EDTI‟s approach to replacing aging infrastructure assets is to proactively monitor the
condition of the assets and to replace deteriorating assets on an as-needed basis. EDTI provided
an overview of its aging infrastructure, including the age profile of a number of types of assets in
Section 1.2.3 of the application. EDTI also provided information respecting various projects in
Section 13 of the application and further details were provided in EDTI‟s responses to
information requests.
304. The UCA submitted in its evidence that, “EDTI‟s assessment of assets for replacement
appears to be based largely on the age of the asset and not on the condition of the assets.”167
Consequently, the UCA recommended that EDTI‟s 2012 forecast transmission life cycle
expenditures be set at 2011 actual transmission capital addition amounts.
305. In argument, EDTI clarified that, as explained in its application, it does not simply
replace assets when they reach a predetermined age but actively monitors the condition of its
assets, performs condition based maintenance and refurbishes equipment, and only replaces
deteriorating assets on an as-needed basis when further refurbishment is no longer technically
and/or economically feasible.168 EDTI noted that the UCA had mischaracterized its assessment of
transmission assets for life-cycle replacement, based solely on EDTI‟s response to UCA-EDTI-
38169 regarding the prioritization of the replacement of the assets selected for inclusion in EDTI‟s
transmission function protective relay and control (P+C) equipment devices life-cycle
replacement program.
167
Exhibit 190.02, UCA evidence, A42. 168
Exhibit 206.02, EDTI argument, paragraph 337. 169
Exhibit 151.

2012 Phase I and II Distribution Tariff 2012 Transmission Facility Owner Tariff EPCOR Distribution & Transmission Inc.
64 • AUC Decision 2012-272 (October 5, 2012)
306. In reply argument, the UCA repeated its earlier submission that the analysis provided in
UCA-EDTI-38 “clearly demonstrated that age was the predominant factor in prioritizing
projects” and that the proposed increase in lifecycle projects should be denied.170
Commission findings
307. The Commission has reviewed EDTI‟s transmission function business cases and IRs
respecting EDTI‟s life-cycle replacement programs. In particular the Commission notes EDTI's
submission that it determines when an asset has reached the end of its useful life “through
condition assessments of the particular asset in question, which include a combination of time-
based inspections, testing, failure investigations, compliance with structural and electrical code
requirements, industry life-cycle practices, and other condition assessments as required.”171
308. Moreover, the Commission has reviewed EDTI‟s response to UCA-EDTI-38 and notes
that the weighted factor assessment tool was used only to determine the prioritization of assets
selected for replacement. Accordingly, the Commission finds that the UCA has mischaracterized
EDTI‟s assessment of transmission assets for life-cycle replacement and consequently rejects the
UCA‟s proposal to deny the increase in lifecycle projects.
5.1.3.2 Capacity to complete forecast capital work
309. EDTI indicated that engineering and labour FTEs directly involved in the delivery of
capital projects and operating activities are forecast using EDTI‟s detailed bottom-up budgeting
approach, which produces reasonable and reliable FTE forecasts. The UCA, in the preamble to
UCA-EDTI-96, noted that EDTI has in the past had difficulty completing some forecast work
due to time and resource constraints. EDTI noted in argument that the UCA sought assurances
that EDTI would be able to complete all planned work in 2012.172
310. In response to the UCA-EDTI-96, EDTI noted that it was taking prudent steps to ensure
that it would complete the level of work reflected in its forecast but identified a number of
important reasons, apart from resource constraints, as to why certain types of work may not be
completed in a given year. For example, projects could be delayed due to factors which EDTI
cannot control including safety considerations, delays in obtaining approvals or outage
constraints. EDTI also noted in its responses to UCA-EDTI-96, as well as its response to
AUC-EDTI-69, that it had been successful in completing the levels of work forecast over the
2010-2011 period. Specifically, on an aggregate basis, EDTI‟s capital expenditures over the
2010-2011 test period exceeded the total decision amounts. As stated in AUC-EDTI-69, the
higher than forecast levels of capital work completed by both the distribution and transmission
functions shows that, despite fluctuations in the specific types of work completed, EDTI has
demonstrated its ability to complete its forecast levels of capital work.
311. In addition, in response to AUC-EDTI-69 concerning EDTI‟s ability to deliver on both
capital and operating work when volumes of different types of work fluctuate, EDTI stated that it
had improved its ability to complete its forecast levels of operating work in conjunction with
growing levels of capital work despite operating costs being higher for both the distribution and
transmission functions, over the period from 2009 to 2011. Moreover, EDTI submitted that it is
170
Exhibit 209.02, UCA reply argument, paragraph 37. 171
Exhibit 152, UCA-EDTI-96 d). 172
Exhibit 206.02, EDTI argument. paragraph 31.

2012 Phase I and II Distribution Tariff 2012 Transmission Facility Owner Tariff EPCOR Distribution & Transmission Inc.
AUC Decision 2012-272 (October 5, 2012) • 65
not systematically under spending its operating costs to deliver forecast levels of capital
expenditures.173
312. In response to AUC-EDTI-08 and AUC-EDTI-19, EDTI provided a detailed explanation
of the method it uses to determine the number of FTEs required in relation to the forecast levels
of work in a test period. EDTI submitted that the detailed process not only ensures that EDTI‟s
forecast reflects the correct level of resources necessary to complete its anticipated workload, it
also ensures that EDTI is not overstaffed.174
Commission findings
313. The Commission acknowledges EDTI‟s submissions that it has consistently spent more
than its forecast operating expenses for each of its transmission and distribution functions during
the period from 2009 to 2011. As presented in the following table, during the 2009 to 2011
period, with the exception of 2010 for distribution, EDTI also spent more on capital expenditures
than forecast and, in aggregate during the three year period, actual expenditures exceeded
forecasts.175 Forecast capital expenditures for 2012 are $84.1 million for distribution (excluding
contributions) and $63.2 million for transmission (excluding Heartland and contributions)
compared to 2011 actuals of $84.6 million for distribution (excluding contributions) and
$53.2 million for transmission (excluding Heartland and contributions).
Table 34. 2009-2012 transmission and distribution capital expenditures ($ million)
2009 2010 2011 2012
Project type (D) (A) (D) (A) (D) (A) (F)
Transmission totals excluding contributions
25.9 40.3 57.1 44.6 30.7 81.3 19.5
Distribution totals excluding contributions
39.3 51.9 65.3 72.5 55.6 84.6 84.1
Total capital expenditures excluding contributions
65.2 92.1 122.4 117.1 86.3 165.9 103.6
Heartland totals 1.4 7.5 5.8 5.3 3.5 28.2 (43.7)
Total capital expenditures excluding contributions and Heartland
63.8 84.6 116.5 111.7 82.8 137.8 147.3
Source: Based on Exhibit 186.04, AUC-EDTI-68 b) Attachment 1, and Exhibit 186.05, AUC-EDTI-68 b), Attachment 2.
314. The Commission notes that there is no monitoring of the labour component of the
forecast operating work and the capital projects and that the information provided regarding the
extent to which work was performed by EDTI staff compared to contractors was an estimate
based on the function.
315. The fact that EDTI has spent more money than forecast does not necessarily mean the
forecast work has been completed. However, having reviewed the capital projects, it appears that
although there have been some delays in projects and new projects added, the capital program
has proceeded largely as forecast. In Section 3.1, the Commission has examined the forecast
number of FTEs and included in that section an analysis respecting the use of contractors. The
173
Exhibit 186, AUC-EDTI-69. 174
Exhibit 206.02, EDTI argument, paragraph 26. 175
Exhibit 186.04, AUC-EDTI-68.

2012 Phase I and II Distribution Tariff 2012 Transmission Facility Owner Tariff EPCOR Distribution & Transmission Inc.
66 • AUC Decision 2012-272 (October 5, 2012)
Commission is satisfied that EDTI has the ability to manage ongoing operating needs as well as
the proposed capital projects.
5.1.3.3 Heartland 500 kV transmission project
316. EDTI described the Heartland project in its 2010-2011 application. In accordance with
the AESO‟s directions, EDTI and AltaLink jointly filed a proposal to provide service (PPS) with
the AESO in mid-2010 and the Heartland facility application with the Commission in
September 2010. The Commission held an oral public hearing on the facility application in the
spring of 2011 and approved the facility application in Decision 2011-436.176
317. As discussed below, the CCA expressed concern regarding the capital overhead rate
applied to the Heartland project. The Heartland project is also relevant to the analysis of capital
expenditures and the cost of debt as discussed in sections 5.1.2 and 3.7 of this decision.
318. EDTI submitted that it has incurred costs in respect of this project associated with such
things as engineering studies, public consultation, regulatory approvals and long lead time items
and that it will continue to accumulate these costs in its CWIP account, pending their anticipated
transfer to a limited partnership. In CCA-EDTI-78, EDTI provided the following Heartland
CWIP continuity schedules:
Table 35. Forecast costs for the Heartland project 2011-2012 ($ millions)
2011 updated
forecast 2012
forecast
Opening CWIP in EDTI 14.44 43.69
EDTI direct costs for management oversight and public consultation 0.96 0.25
AltaLink costs for project management and oversight 26.21 51.34
Capital overhead 0.01 0.52
AFUDC 2.07 1.55
Contribution from Heartland Limited Partnership - (97.35)
Closing CWIP in EDTI 43.69 -
Source: Exhibit 168.01, CCA-EDTI-78
319. EDTI submitted that it was capturing all indirect costs associated with the Heartland
project through the capital overhead applied to this project at the rate of one per cent of the total
capital expenditures, consistent with EDTI‟s approach respecting all AESO-directed projects.
This approach has been used to date and will continue to be used until the Heartland project is
transferred to a new transmission facility owner (TFO) that will be created by EDTI and
AltaLink.177
320. The CCA questioned the relatively low capital overhead rate applied to AESO-directed
projects and to the Heartland project, in particular.178 The CCA noted that EDTI charged capital
176
Decision 2011-436: AltaLink Management Ltd. and EPCOR Distribution & Transmission Inc., Heartland
Transmission Project, Application No. 1606609, Proceeding ID No. 457, November 1, 2011. 177
Exhibit 186, AUC-EDTI-60. 178
Exhibit 191, CCA evidence, Section 5.
2012 Phase I and II Distribution Tariff 2012 Transmission Facility Owner Tariff EPCOR Distribution & Transmission Inc.
AUC Decision 2012-272 (October 5, 2012) • 67
overhead rates of one and six per cent, respectively for AESO-directed and non-AESO-directed
transmission projects, and nine per cent for distribution projects.
321. EDTI explained that a one per cent overhead rate is used for AESO-directed projects as
they are generally larger in scope than internal projects and rely to a greater extent on external
resources to complete. The CCA submitted that, in its view, EDTI had not demonstrated why the
overhead rates should be lower for AESO-directed projects and recommended that all
transmission projects (excluding the Heartland project) and distribution projects be charged the
same capital overhead rate in 2012.179
322. Furthermore, the CCA pointed out that EDTI justified its rate by submitting that the
Heartland project is currently an EDTI in-house project, i.e. not an affiliate transaction. Given
that the Heartland project is a significant project in EDTI‟s books that is expected to be
transferred in the future to an affiliate, the CCA recommended that the overhead rates applicable
to affiliate projects180 should be applied to Heartland for 2012 and beyond.181
323. EDTI submitted that it allocated indirect support to projects in a manner that provides a
strong causation link to the support provided to projects. EDTI applies a lower overhead rate to
AESO-directed projects as they are typically managed and constructed by contractors, have a
lower proportion of EDTI labour and salary costs than non-AESO-directed projects, and
therefore require less support to complete.182
324. In reply argument, the CCA, noting that Heartland costs were substantially made up of
contractor related expenditures, acknowledged that its recommended approach to overhead
recovery, i.e., that which is used for affiliates of EDTI, would not appropriately capture the
overhead costs associated with the Heartland project. The CCA therefore submitted that the
overhead charges for Heartland should be calculated on the same basis as for affiliates as
77 per cent of project management labour costs with an additional 20 per cent cost recovery
surcharge.183
325. EDTI argued that the corporate cost allocation method applied fully captures the costs
associated with the Heartland project. Additionally, the CCA‟s recommendation that overhead
charges for Heartland should be allocated on the basis of project management time instead of on
the basis of direct labour and salaries is unsubstantiated. EDTI pointed out that the CCA had
overlooked the fact that AltaLink, being the joint venture partner responsible for the actual
construction of the project, will have the significant direct labour charges and the majority of the
project oversight from a construction point of view. EDTI‟s responsibilities, on the other hand,
related to the public consultation process and involvement in the various regulatory proceedings.
In view of the above, EDTI submitted that the CCA recommendations regarding additional costs
should be rejected.184
179
Exhibit 191, CCA evidence, paragraph 34. 180
Exhibit 3, application, paragraph 1712. EDTI submitted that it provides services to affiliates on a cost recovery
basis. To ensure that it is recovering its reasonable costs EDTI adds an overhear charge of 77 per cent to direct
labour costs and cost recovery surcharge of 20 per cent to its direct costs of providing services. 181
Exhibit 191, CCA evidence, paragraph 33. 182
Exhibit 203.02, EDTI rebuttal evidence, section 9. 183
Exhibit 207.01, CCA argument, paragraph 89. 184
Exhibit 211.02, EDTI reply argument, paragraph 182.
2012 Phase I and II Distribution Tariff 2012 Transmission Facility Owner Tariff EPCOR Distribution & Transmission Inc.
68 • AUC Decision 2012-272 (October 5, 2012)
326. Respecting the CCA's recommendation that all transmission projects, excluding
Heartland, should be charged the same overhead rate, EDTI submitted that the allocation
methodology is not representative of the relative administrative effort that AESO-directed and
non-AESO-directed projects require on an actual basis. EDTI reiterated that its approach to
overhead allocation is based on a strong cost causation relationship and the CCA‟s
recommendation, without any evidentiary support, is not representative of actual effort and costs,
and therefore should be rejected.185
Commission findings
327. The Commission accepts the principle that the method of cost allocation should where
possible reflect cost causation and finds that EDTI has determined its allocation rates based on
this principle. The Commission recognizes that, if too little overhead is allocated to the Heartland
project, other projects would have to absorb a disproportionate share of overhead. However,
based on the record, as presented in Table 35 above, the forecast Heartland costs for 2012
include only $0.25 million of EDTI direct costs for management oversight and public
consultation. The majority of costs ($51.34 million) are transferred from AltaLink. EDTI has
recorded AFUDC on the balance in the account and overhead at the rate of one per cent on costs
incurred in the current year.
328. As it is expected that the Heartland project will be transferred to an affiliate, it could be
argued that overhead should be allocated on the basis used for affiliates. However, given the
uncertainty of the future transfer and the small amount of direct costs incurred, the Commission
considers the allocation of overhead at the one per cent rate applied to AESO-directed projects is
reasonable.
329. The Commission rejects the CCA recommendation that all transmission projects
(excluding the Heartland project) and distribution projects should be charged overhead at the
same rate. The Commission relies on EDTI‟s explanation that AESO-directed projects are
generally larger in scope than internal projects and rely to a greater extent on external resources
to complete
5.1.3.4 AESO-directed projects
330. EDTI provided descriptions of AESO-directed projects in Section 13.2.1 of the
application. In sections 13.2.1.1 to 13.2.12, EDTI described the projects currently being
undertaken.
331. Four “proposed” AESO-directed projects, “under review and discussion with the AESO,
which may proceed during the Test Period,”186 were described in Section 13.2.13. EDTI
submitted that these projects do not impact EDTI‟s 2012 forecast revenue requirement and have
been included in the application for information purposes only. The following table summarizes
the forecast costs of the four proposed AESO-directed projects, which EDTI included as
additions to rate base.
185
Exhibit 211.02, EDTI reply argument, paragraph 183. 186
Exhibit 3, paragraph 4104.

2012 Phase I and II Distribution Tariff 2012 Transmission Facility Owner Tariff EPCOR Distribution & Transmission Inc.
AUC Decision 2012-272 (October 5, 2012) • 69
Table 36. AESO-directed projects included in Section 13.2.1.13
Project 2012 additions to rate base
($ millions)
Genesee interface to HVDC converter station 12.91
East HVDC converter station interface – RAS scheme communication 0.10
Total HVDC converter stations 13.01
Victoria substation capacity upgrade 0.51
Lambton transformers capacity upgrades 0.18
Total capacity upgrades 0.69
332. In response to AUC-EDTI-48,187 wherein EDTI was asked to clarify whether the four
projects “were included in the application for information purposes only”188 and their inclusion in
the application as capital additions,189 EDTI stated that these projects were and should have been
included in the 2012 revenue requirement. However, in argument EDTI stated that it now
expected that the majority of the work on the two HVDC projects would not be completed until
2013. Nevertheless, EDTI submitted that, for the following reasons, the Commission should
allow EDTI to include the two HVDC projects in its 2012 forecast revenue requirement as filed,
and to true-up the dollar amounts in the normal course of its AESO-directed projects deferral
account:
a. EDTI has clear direction to proceed with the projects
b. EDTI expects to incur significant expenditures on these projects
c. The AESO-directed projects deferral account will ensure that
i. customers will pay actual costs to complete the projects
ii. customer refunds or charges will occur relatively quickly with the expected filing
of EDTI‟s 2012-2013 capital application in October 2012.
d. A significant amount of work will be required to remove these projects from the 2012
forecast revenue requirement.190
Commission findings
333. The Commission acknowledges EDTI‟s submission that “EDTI now expects that the
majority of the work associated with [the Genesee Interface to HVDC Converter Station project
and the East HVDC Converter Station Interface – RAS Scheme Communications project] is
expected to be completed in 2013.”191
334. Even though EDTI has an AESO-directed projects deferral account, the majority of the
work will not be completed until 2013 and, as such, the Commission finds that EDTI should not
include these projects as capital additions in its 2012 forecast revenue requirement as filed.
Accordingly, the Commission directs EDTI to remove the Genesee Interface to HVDC
Converter Station and the East HVDC Converter Station Interface from its 2012 revenue
187
Exhibit 167.02, AUC-EDTI-48. 188
Exhibit 3, application, paragraph 4104. 189
Exhibit 3, Table 13.2-1, EDTI transmission capital additions 2009-2012, page 1214. 190
Exhibit 206.02, EDTI argument, paragraphs 351 and 352. 191
Exhibit 206.02, EDTI argument, paragraph 350.

2012 Phase I and II Distribution Tariff 2012 Transmission Facility Owner Tariff EPCOR Distribution & Transmission Inc.
70 • AUC Decision 2012-272 (October 5, 2012)
requirement. Moreover, the Commission directs EDTI in its compliance filing to reflect this
direction in EDTI‟s transmission capital additions schedule and all related schedules.
5.1.3.5 Process improvement initiatives
335. EDTI submitted that it seeks to identify and implement process improvement
opportunities and incorporate the associated cost savings into its forecasts. In Section 1.2.4,
EDTI provided a listing of process improvement initiatives distinguishing initiatives that resulted
in cost reductions and initiatives that resulted in improved reliability, safety or customer service.
The following table shows the process improvement initiatives that EDTI identified and
proposed to implement in the 2012 test year where the benefits will begin to be realized in that
year.192
Table 37. 2012 Process improvement initiatives ($ millions)
Description Savings 2012 rate base
additions
($ millions)
Process improvements that result in operating cost savings
GIS – performance improvement project 0.18 0.83
SUBTOTAL 0.18
Process improvements that result in improved reliability, safety and customer service
Installation of network current limiting fuse program 0.57
Distribution system aerial underground fault indicators and fusing 0.96
Installation of automated switches on selected 25kv circuits 1.41
Transmission substation security upgrades 0.93
Medium voltage switchgear – arc resistance upgrade 0.74
Communication system upgrade 1.93
SCADA MTU system security upgrades 0.63
Switchgear on-line monitoring installation 0.54
Transmission underground cable spares 0.77
Safety software (T,D) 0.37
Source; Based on Exhibit 3, Table 1.2.4-1
336. Respecting the GIS performance project noted in the above table, EDTI submitted that
the project was initiated to increase the flexibility and speed of making configuration changes to
its GIS tool. The proposed enhancements would allow for real-time updates of information from
the office to the field and increase the usability of the GIS system. EDTI proposed to increase the
flexibility and speed of configuration changes to EDTI‟s GIS tools through the addition of
FieldSmart Configuration Environment (FCE) and FieldSmart PLOT (PLOT) modules.193
Respecting its proposal, EDTI further clarified that “[t]here is no specific forecast decrease in
costs shown in any of EDTI‟s operating sections, as the cost associated with hiring a vendor
($0.18 million) is an avoided cost and not a reduction to current cost levels.”194
192
Exhibit 3, application, paragraph 59. 193
Exhibit 3, application, paragraph 63. 194
Exhibit 150, CCA-EDTI-31.

2012 Phase I and II Distribution Tariff 2012 Transmission Facility Owner Tariff EPCOR Distribution & Transmission Inc.
AUC Decision 2012-272 (October 5, 2012) • 71
337. The CCA asked information requests about process improvements and submitted in
evidence that EDTI‟s projects, related to process improvements resulting in improved reliability,
safety and customer service, should result in O&M savings in the test year. “To suggest none of
the foregoing projects will avoid any costs in 2012, or provide tangible productivity savings in
2012, is not plausible.”195
338. The CCA identified four process improvement projects that the CCA submitted should
have some related O&M savings in the 2012 test year. The following bulleted subsections
describe the identified projects and provide the CCA‟s views regarding the savings that should
accrue from each of the projects:
Distribution system aerial, underground fault indicators and fusing
The purpose of this project is to improve the safety and reliability of EDTI‟s distribution
system. The primary justification for installation of fault indicators is to reduce outage
duration time. Notwithstanding, EDTI submitted that it will not realize any cost savings
as no staffing reductions will be facilitated by the reduced investigation and patrol time.196
CCA questioned EDTI‟s position that although it would undertake measures which result
in higher productivity, no cost savings were forecast for 2012. Furthermore, the CCA
stated that it is necessary for EDTI to rationalize its deployment of trouble crews in a
more efficient manner to realize the benefits of the costs associated with the productivity
initiatives.197
Installation of automated switches on selected 25 kV circuits
The purpose of this project is to improve the reliability of EDTI‟s distribution system.
EDTI submitted that reduced patrol times, a secondary benefit, may result in faster
restoration of the isolated outages as the location of the fault can be found faster. EDTI
also submitted that the time and costs to complete any repairs will be the same as this
project will not reduce EDTI‟s staffing as regards to Trouble Crews.198
CCA submitted that it is reasonable to expect that a reduction in fault investigation and
patrol times should translate to reduced costs. “There is little merit in investing in
productivity and process improvement initiatives which simply result in the same labour
component doing the same things but in less time.199
Communications system upgrade
EDTI submitted that this project consists of installing fibre optic communication cables
to remedy deficiencies in the communication system used for SCADA and teleprotection
purposes to improve the reliability and operational integrity of EDTI‟s existing
communications system. Furthermore, the project will “allow EDTI‟s unmanned
substations and transmission distribution functions to continue to reliably operate through
195
Exhibit 191, CCA evidence, paragraph 45. 196
Exhibit 150, CCA-EDTI-32. 197
Exhibit 191, CCA evidence, paragraph 48. 198
Exhibit 150, CCA-EDTI-32. 199
Exhibit 191, CCA evidence, paragraph 49.

2012 Phase I and II Distribution Tariff 2012 Transmission Facility Owner Tariff EPCOR Distribution & Transmission Inc.
72 • AUC Decision 2012-272 (October 5, 2012)
communication equipment that provides adequate data and visibility of EDTI‟s
substations while meeting a number of standards and guidelines.”200
Implicitly assuming that actuals from prior years were used to generate the 2012 forecast,
the CCA submitted that EDTI‟s project, since it remedied SCADA and teleprotection
communications deficiencies, would provide EDTI more compensation than required.201
Switchgear on-line monitoring installation
The existing gas insulated switchgear at EDTI‟s Bellamy substation is 34 years old and
EDTI has recorded 25 failures on various components of this switchgear in the last 11
years. EDTI submitted that this project would not result in any cost decreases as this
work would simply give EDTI the ability to detect and help prevent insulation failures
during the period leading up to the replacement of the gas insulated switchgear at EDTI‟s
Bellamy substation.202
Noting the numerous failures on the switchgear in the last 11 years, the CCA opined that
the failures would have required O&M costs to remediate. The CCA submitted that if this
was the case and EDTI had incorporated actuals from prior years to generate the 2012
forecast of repair costs, the 2012 repair cost forecast would provide EDTI more
compensation than required.203
339. The CCA submitted that, based on the evidence filed, EDTI will implement productivity
improvements not specifically identified in the forecast. The CCA submitted that a $ 0.25 million
reduction in O&M should be directed in respect of the potential productivity savings in 2012.204
340. EDTI submitted that the productivity improvement benefits to be realized in future test
periods are in the nature of improved reliability, safety and customer service (i.e., not O&M
savings as asserted by the CCA). EDTI further stated that the projects are not new to EDTI and
“EDTI has never forecast any cost reductions related to their implementation, nor has its
experience in implementing these projects identified any cost reductions as asserted by the
CCA.”205 The purpose of the projects outlined in the first two bulleted items above is to improve
overall system reliability with the intent of reducing the number of customers impacted by
outages and the speed at which outages are restored. Further, the purpose of the communications
project identified in Section 1.1.3 is to add a redundant fibre optic cable to transmission having
only one cable routed to them.206
341. With respect to the CCA‟s recommendation to reduce operating costs by $0.25 million,
EDTI submitted that, while EDTI will continue to search for new ways to be more efficient, this
does not justify a reduction in EDTI‟s forecast operating costs. Process improvements take time
to develop and implement, after which cost savings may be realized. As the present application
has a one year test period, there is not sufficient time for EDTI to realize any material cost
200
Exhibit 150, CCA-EDTI-32. 201
Exhibit 191, CCA evidence, paragraph 51. 202
Exhibit 150, CCA-EDTI-32. 203
Exhibit 191, CCA evidence, paragraph 53. 204
Exhibit 191, CCA evidence, paragraph 58 205
Exhibit 203.02, EDTI rebuttal, A39. 206
Exhibit 203.02, EDTI rebuttal, A40.

2012 Phase I and II Distribution Tariff 2012 Transmission Facility Owner Tariff EPCOR Distribution & Transmission Inc.
AUC Decision 2012-272 (October 5, 2012) • 73
savings beyond those already identified in the application. The CCA‟s recommendation is unfair
and incongruent respecting the reality of how cost savings are achieved and realized.
342. In respect of the performance improvement project issue, the CCA submitted that while
customers will pay the capital and operating costs in 2012, all savings from the aforementioned
projects will flow to EDTI over the period from 2012 to 2017. The CCA also noted EDTI‟s
evidence that initiatives identified and implemented during a test period may result in savings
that were not contemplated at the time the test period forecast was prepared. The CCA therefore
reiterated its recommendation to reduce 2012 O&M expenses by $0.25 million, arguing that the
reduction would give due recognition to the potential savings.207
343. With respect to the GIS project, the CCA stated that while it did not dispute the costs and
benefits of the project, considering that the completion date is near the end of 2012, it is doubtful
that the full extent of the touted benefits, or for that matter the projected $0.18 million of annual
cost savings, will be realized. In order to better match the project‟s capital costs and incremental
operating expenses to rate revenues, the CCA reasserted its recommendation that the project be
deferred to 2013.208
344. EDTI reasserted that the benefits associated with the forecast ten process improvement
projects will be realized in future test periods and will be in the nature of improved reliability,
safety and customer service. EDTI submitted that the CCA‟s position that EDTI‟s 2012 forecast
should be reduced to account for potential further process improvements is without merit and
should be rejected. With respect to the CCA‟s assertion that the GIS performance project be
deferred to 2013 because 2012 is the going-in year for PBR, EDTI submitted that what the
CCA‟s suggestion “amounts to is cherry picking a particular cost for adjustment, but ignoring
likely cost increases that will come over the course of the PBR term.”209 Further, there is no
reasonable basis for suggesting that the project should be deferred; based on the expected
benefits of the projects as outlined in the business case. The project is reasonable and prudent,
and the costs of the project are properly included in 2012.
Commission findings
345. The Commission has reviewed the application and the business case related to the GIS
system and notes the expected operational improvements and the expectation of avoided costs.
Considering the ongoing and continuing nature of the perceived benefits, the Commission finds
that the project is reasonable and prudent. Accordingly, the Commission approves the 2012 GIS
project costs.
346. The Commission acknowledges EDTI‟s submission that, although reduced investigation
and patrol time will result in faster restoration of the outages, as trouble crews are staffed
24 hours and seven days per week, there will be no cost reductions from the safety and reliability
projects. Therefore, the Commission rejects the CCA‟s proposal for a proposed reduction to
forecast costs of $0.25 million.
347. Notwithstanding, the Commission acknowledges the concerns of the CCA that cost
savings are not forecast for projects described as process improvements and EDTI‟s position that
207
Exhibit 207, CCA argument. 208
Exhibit 207, CCA argument. 209
Exhibit 206.02, EDTI argument.

2012 Phase I and II Distribution Tariff 2012 Transmission Facility Owner Tariff EPCOR Distribution & Transmission Inc.
74 • AUC Decision 2012-272 (October 5, 2012)
emergency staff must be available so that there is no direct relationship between reduced times
on individual projects and forecast costs. However, given EDTI‟s method of forecasting FTEs,
benefits could be incorporated in the scheduling and forecasting process although not specifically
identified as related to a particular project. In the analysis of FTEs in Table 3 the number of
distribution operating FTEs is forecast to decrease from 353.7 in 2011 to 345.8 in 2012 and in
Table 4 the number of transmission operating FTEs is forecast to increase from 68 in 2011 to 77
in 2012. The decrease in forecast distribution operating FTEs, despite system growth, indicates
efficiencies although the source is not specifically identified. Considering the above, the CCA
has not persuaded the Commission to reduce EDTI‟s 2012 O&M expenses. Accordingly, the
Commission approves EDTI‟s 2012 process improvement initiatives as shown in Table 1.2.4-1
of the application.
5.2 One-off projects
348. In the 2012 test year, EDTI proposes to carry out a number of “one-off” substation
maintenance projects. The following table summarizes EDTI‟s 2012 forecast and prior years‟
cost respecting one-off transmission substation apparatus maintenance and repair.
Table 38. Transmission substation apparatus maintenance and repair 2009-2012 ($ millions)
2009 (A) 2010 (D) 2010 (A) 2011(D) 2011 (UF) 2012 (F)
“one-off” maintenance” 0.01 0.15 0.05 0.00 0.00 0.43
Source: Based on Exhibit 3, Table 6.3.3.1-3; CCA-EDTI-57 Legend: (A) actual, (D) decision, (UF) updated forecast, (F) forecast
349. EDTI submitted that its 2012 transmission substation apparatus maintenance and repair
forecast included the following two project expenditures:
a. $0.16 million to decommission and remove from service the 15 kV switchgear transfer
bus installed at EDTI‟s Hardisty Substation, and
b. $0.27 million to refurbish the load tap changer on one transformer located at EDTI‟s East
Industrial Substation.
350. EDTI submitted that it typically identifies one-off operating and maintenance projects
that must be completed in each test period. Moreover, responding to CCA-EDTI-57, EDTI stated
that it often identifies projects that must be completed during a test period that were not
anticipated and the associated costs were therefore not included in a tariff application.
351. EDTI confirmed that the proposed one-off substation maintenance projects would be
completed in 2012. With respect to the 15 kV switchgear transfer bus project, EDTI submitted
that it had to be decommissioned and removed from the site as EDTI could no longer safely
maintain the equipment, as its is required to under the Alberta Electrical Utility Code.
Furthermore, delays respecting the load tap changer one-off project could result in a catastrophic
failure of the transformer.210
352. The UCA voiced concerns respecting the two one-off projects and submitted that the
projects have not been justified. Furthermore, the UCA expressed a concern that EDTI has
210
Exhibit 150, CCA-EDTI-58.

2012 Phase I and II Distribution Tariff 2012 Transmission Facility Owner Tariff EPCOR Distribution & Transmission Inc.
AUC Decision 2012-272 (October 5, 2012) • 75
forecast these costs for 2012, which happens to be the revenue requirement that will set the going
in rates for PBR.211
353. EDTI submitted in its rebuttal evidence that it had provided clear justification for the two
projects because there were no maintenance options to carrying out these projects and the
consequences of delaying these projects were not acceptable.212
354. In argument, EDTI reiterated that it has provided clear and detailed justification for the
projects in its application. Furthermore, while these are one-off projects, EDTI submitted that it
anticipated that it would carry out similar projects in the future such as the Celanese transmission
substation and East Industrial Load Tap Changer Refurbishment projects for 2013 referred to in
its application.213
Commission findings
355. The Commission acknowledges EDTI‟s determination that serious problems have been
identified and projects of a non-recurring basis, or “one-off” projects, are required to address
them. Further, as EDTI has stated, “there are not maintenance options available to EDTI by
which the risks associated with leaving the problem unaddressed could be mitigated.”214 The
Commission recognizes that a utility cannot possibly identify all of the maintenance projects that
may arise in a test period. For purposes of this application, the Commission finds that EDTI has
provided justification for the one-off projects described above. Accordingly, the Commission
approves EDTI‟s forecast costs for 2012 one-off projects.
6 Corporate services costs
356. By way of a letter dated December 16, 2011, EUI asked that the Commission consider
matters related to both EDTI and EEAI in the area of corporate services costs as part of this
proceeding. The Commission undertook to consider matters relating to corporate services costs
for both EDTI and EEAI for 2012 in this proceeding and informed parties in a letter dated
December 20, 2011.
357. In this section, references to EDTI will also incorporate EEAI and findings of the
Commission will apply to both EDTI and EEAI for the 2012 forecast period unless stated
otherwise.
358. EDTI and EEAI are members of the EPCOR group of companies. EDTI and EEAI
receive services from and provide services to other members of the EPCOR group including:
(i) services provided by EUI to EDTI and EEAI (corporate services) and (ii) services provided
by EDTI and EEAI to other EPCOR affiliates including each other (affiliate services). This
section will address the forecast EUI corporate services costs as they relate to EDTI and EEAI
for the 2012 test year.
359. Corporate services costs are recovered by EUI from EDTI and EEAI through one of three
mechanisms: direct assignment of the cost, allocation of the cost, or by way of an asset usage fee.
211
Exhibit 190.02, CCA evidence of Russ Bell, A 35; Exhibit 204.02, UCA argument. 212
Exhibit 203.02, EDTI rebuttal evidence. 213
Exhibit 206.02, EDTI argument. 214
Exhibit 206.02, EDTI argument.

2012 Phase I and II Distribution Tariff 2012 Transmission Facility Owner Tariff EPCOR Distribution & Transmission Inc.
76 • AUC Decision 2012-272 (October 5, 2012)
The 2012 forecast EUI corporate services costs and the amounts assigned to each of EDTI and
EEAI, with the comparative 2010 and 2011 decision approved and actual expenditures, are
shown in the table below:
Table 39. 2010-2012 corporate services costs by utility ($ millions)
Corporate Services Costs 2010
approved 2010
actual 2011
approved 2011
actual 2012
forecast
EUI
Directly assigned 17.35 17.48 18.06 17.40 18.92
Allocated 61.66 55.88 65.64 58.47 69.74
Asset usage fees 13.78 13.23 15.56 17.53 17.97
Total EUI costs 92.79 86.59 99.26 93.41 106.63
EDTI
Directly assigned 4.46 4.91 4.76 5.00 4.93
Allocated 22.02 19.95 23.50 21.49 24.25
Allocations non recoverable (1.54) (0.35) (1.38) (1.94) (0.81)
Asset usage fees 4.60 4.51 5.20 6.06 6.08
Negotiated settlement reductions (2.85) (3.17)
Total EDTI costs 26.69 29.02 28.91 30.61 34.45
EEAI
Directly assigned 8.85 7.90 8.93 8.08 9.53
Allocated 11.10 9.38 11.72 10.80 10.49
Allocations non recoverable (0.90) (0.29) (0.80) (1.19) (0.41)
Asset usage fees 3.35 3.05 3.70 4.20 4.14
Negotiated settlement reductions (2.16) (2.33)
Total EEAI costs 20.24 20.04 21.22 21.88 23.75
Source: AUC-EDTI-70 Table 10.0-1 Revised
360. A review of the table above reveals that EUI was successful in identifying and capturing
cost savings in both 2010 and 2011. However, the costs allocated to both EDTI and EEAI are,
with the exception of the costs in 2010 for EEAI, higher than the amounts agreed to in the
negotiated settlement approved by the Commission in Decision 2011-262.215 In AUC-EDTI-33,
in responding to a Commission information request about changes to the allocators introduced
since EDTI‟s last application, EDTI identified 33 examples of changes in cost allocation
practices.216 These changes affect approximately 80 per cent of the corporate services allocated to
EDTI and EEAI.
215
Decision 2011-262: EPCOR Distribution & Transmission Inc. and EPCOR Energy Alberta Inc., 2010-2011
Corporate Costs Module – Approval of a Negotiated Settlement Agreement, Application No. 1605759,
Proceeding ID No. 437, June 21, 2011. 216
Exhibit 167.01, AUC-EDTI-33, page 62.

2012 Phase I and II Distribution Tariff 2012 Transmission Facility Owner Tariff EPCOR Distribution & Transmission Inc.
AUC Decision 2012-272 (October 5, 2012) • 77
6.1 Legal and regulatory framework
361. In information response AUC-EDTI-11, EDTI outlined the basic legal framework under
which it considered that the Commission should assess the EDTI and EEAI applied-for corporate
services costs. EDTI submitted that the legislation requires the Commission to ensure that an
electric utility owner‟s tariff:
is just and reasonable
provides the owner with a reasonable opportunity to recover its prudent costs and
expenses that the Commission considers appropriate, including a fair allocation of the
owner‟s costs and expenses that relate to the owner‟s electric utilities
is not unduly preferential, arbitrarily or unjustly discriminatory or inconsistent with or in
contravention of the Electric Utilities Act, SA 2003, c. E-5.1 or any other enactment or
any law
362. EDTI submitted that the Commission must also exercise its discretion with a view to
ensuring that both utility and customer interests are taken into account and balanced in the rate
setting process.
363. EDTI submitted that the record demonstrates that its corporate services costs reflect
functions and activities that are necessary for the utilities to provide utility service and that those
costs are substantially lower than the costs that the utilities would incur to procure the services
on a stand-alone basis, either through self-providing them or procuring them from an arms-length
third-party service provider.
364. During this proceeding, the UCA filed evidence by Shelley Radway which addressed the
legal and regulatory framework that, in its view, the Commission should consider when
assessing EDTI and EEAI‟s corporate services costs. The UCA cited several regulatory
principles that should be considered when assessing the corporate services costs, including the
burden of proof; the no-harm principle (including its relationship to the code of conduct) and the
stand-alone principle. A brief summary of the arguments provided by the UCA on these
principles follows.
365. The UCA submitted that the EPCOR Group Inter-Affiliate Code of Conduct (Code or
Code of Conduct) is an important consideration as part of the regulatory principles. EUI has an
exemption in its Code of Conduct to allow for shared services, such as corporate services costs,
to be allocated to the utilities and EUI‟s other businesses, whether they were regulated or not, in
order to allow for efficiencies to be passed on for mutual benefit of the businesses. The UCA
submitted that there is no provision in the Code of Conduct that states that EUI has a right to
automatically pass on additional costs when it engages in transactions which cause inefficiencies
such as the so called “lost economies of scale” due to a sale of an unregulated corporate asset. In
other words, the purpose of the Code of Conduct does not allow EUI to pass on increased costs
due to inefficient transactions, but rather the utilities should be shielded from the activity of the
corporate parent due to the stand-alone principle. Under the stand-alone principle, the revenue
requirement of each of EDTI and EEAI should not be influenced by the ups or downs of the
operations of EUI or the sale of generation assets to a newly created “sister company,” such as
Capital Power Corporation (Capital Power or CPC). The UCA submitted that the stand-alone
principle is important because it shields a regulated entity from increases in costs caused by the
activity of the corporation or its affiliates. EUI is free to make decisions that benefit its

2012 Phase I and II Distribution Tariff 2012 Transmission Facility Owner Tariff EPCOR Distribution & Transmission Inc.
78 • AUC Decision 2012-272 (October 5, 2012)
shareholder even if it makes EUI less competitive. Corporations are free to manage their
businesses in ways that allow them to be less efficient in their markets, but they are not free to
pass on these increased costs to regulated utilities.
366. Further, the UCA submitted that the additional corporate services costs allocated to the
utilities after the sale of the CPC generation assets have “harmed” the utilities‟ customers. The
UCA cited previous proceedings before the Commission, and its predecessor the board, where
the sale of regulated assets was outside of the ordinary course of business and was only approved
if there was no harm to customers. The UCA acknowledged that, while there was no requirement
for EUI to seek approval of the sale of its generation assets, the impact of the sale and any
resulting harm to the utilities‟ customers was still a matter for the Commission to decide.
367. In its rebuttal evidence, EDTI objected to the UCA‟s application of the no-harm principle
and the stand-alone principle. EDTI submitted that to accept the UCA‟s position would mean
that, under the Code of Conduct, it would be permissible for costs to decrease as economies of
scale increase, but any increase due to reductions in economies of scale would be prohibited.217
368. EDTI submitted that it has demonstrated that the shared corporate services structure
continues to be prudent for the utilities, and yield reasonable costs for these services, which are,
in fact, substantially lower costs than either EDTI or EEAI could obtain on a stand-alone basis.
Commission findings
369. Pursuant to Section 121(2) of the Electric Utilities Act when considering whether to
approve a tariff application, the Commission must ensure that:
(a) the tariff is just and reasonable,
(b) the tariff is not unduly preferential, arbitrarily or unjustly discriminatory or inconsistent
with or in contravention of this or any other enactment or any law, […]
370. As well, pursuant to Section 122(1) of the Electric Utilities Act, when considering a tariff
application, the Commission must have regard for the principle that a tariff approved by it must
provide the owner of an electric utility with a reasonable opportunity to recover:
(h) any other prudent costs and expenses that the Commission considers appropriate,
including a fair allocation of the owner‟s costs and expenses that relate to any or
all of the owner‟s electric utilities.
371. Section 121(4) of the Electric Utilities Act also states that the burden of proof to show
that a tariff is just and reasonable is on the person seeking approval of the tariff.
372. Similarly, the legislative framework governing EEAI stresses an assessment of the
prudency of EEAI‟s costs. EEAI‟s tariff is prepared under Section 103 of the Electric Utilities
Act, which requires each owner of an electric distribution system to prepare a regulated rate tariff
for the purpose of recovering the prudent costs of providing electricity services to eligible
customers. Further, under subsection 6(1)(a) of the Regulated Rate Option Regulation,
AR 262/2005, the Commission must have regard for the principle that a regulated rate tariff,
217
Exhibit 203.02, EDTI rebuttal evidence at page 3.

2012 Phase I and II Distribution Tariff 2012 Transmission Facility Owner Tariff EPCOR Distribution & Transmission Inc.
AUC Decision 2012-272 (October 5, 2012) • 79
including the risk margin included therein, must provide the owner with a reasonable opportunity
to recover the prudent costs and expenses incurred by the owner.
373. In its argument, the UCA acknowledged that “it is for the Commission to decide whether
or not to apply the no-harm principle or some other set of criteria to evaluate the significant
increase in the quantum of corporate costs forced upon EDTI‟s and EEAI‟s customers.”218
374. The Commission finds that compliance with this legislative framework can be best
assessed through the three questions that were set out in Decision 2010-505219 where the
Commission asked parties to consider whether:
1. the costs related to the provision of services from EUI and EDTI are necessary for
EDTI and EEAI to provide utility service?
2. the costs are allocated correctly among EDTI, EEAI and EWSI?220
3. it would be less expensive for EDTI and EEAI to provide the services themselves or
seek a different third party provider on a stand alone basis?
375. As well, in Decision 2011-399,221 the Commission stated:
23. Based on the matters discussed in Section 4.3 of Decision 2010-505 and further
pursued in the corporate cost module, in addressing issues related to the quantum of lost
economies in EDTI‟s revenue requirement for 2012, the Commission expects to consider
the following:
i) whether some corporate costs should be allocated to EUI itself for its
management of its investment in Capital Power
ii) whether some corporate costs should be allocated to EUI itself for its
management of the funds remaining from its partial sale of Capital Power
iii) whether any corporate costs constitute business development costs unrelated to
EDTI and EEAI and are therefore not recoverable from customers of EDTI and
EEAI
iv) whether the costs for any remaining services provided to Capital Power are in
excess of the direct charges to Capital Power
v) whether or not EUI has adequately adjusted its corporate costs to reflect its
smaller size
vi) whether or not EUI has acquired any new businesses to which it should allocate
some of its corporate costs
vii) whether there are any legal principles that the Commission should consider in
addressing the issue of lost economies of scale
218
Exhibit 204.02, UCA argument at page 23, paragraph 99. 219
Decision 2010-505 at paragraph 100. 220
As the application filed by EPCOR only addresses the corporate services costs for EDTI and EEAI, this
decision only considers the corporate services costs related to EDTI and EEAI. 221
Decision 2011-399: EPCOR Distribution & Transmission Inc., Determination of Whether an Audit of
Corporate Costs is Required, Application No. 1605759, Proceeding ID No. 437, October 7, 2011, at
paragraph 23.

2012 Phase I and II Distribution Tariff 2012 Transmission Facility Owner Tariff EPCOR Distribution & Transmission Inc.
80 • AUC Decision 2012-272 (October 5, 2012)
viii) whether any adjustments are required if it is determined that EUI, as opposed
to customers, should pay for any or all lost economies of scale that would
remain in 2012 and beyond222
376. The Commission considers the best starting point for its assessment of the allocated
corporate services costs is its findings in Decision 2010-505, with reference to the eight points
from Decision 2011-399 where applicable.
377. The Commission first addresses the arguments of the UCA, specifically the stand-alone
principle and the no-harm principle as submitted by the UCA.
378. The Commission considers that the UCA‟s position is inconsistent with the intent of the
Code. Previous decisions from the board have confirmed that the Code was not intended to
ensure that costs never go up but rather to protect ratepayers from a lack of transparency and the
potential for abuse through the use of affiliates.223 The UCA‟s approach would be contrary to the
legislative framework outlined above. Specifically, when approving a tariff the Commission
must provide the owner with the opportunity to recover its prudent costs and expenses.
Conversely, corporate services costs allocated from EUI to each of EDTI and EEAI will not
automatically be approved. The Commission must ensure that the corporate services costs
allocated are just and reasonable.
379. With respect to the no-harm principle, based on the facts in this proceeding, the
Commission considers that it cannot rely on the no-harm test. EUI was not, at the time of sale of
CPC a designated utility pursuant to the Public Utilities Designation Regulation, AR 194/2006.
As such, there was no requirement for EUI to seek approval of the sale of its generation assets.
Historically, when employing the no-harm test, the Commission has indicated that when a
finding of harm has occurred in the past, the Commission must assess the available evidence to
determine whether mitigation of harm is to be required on an ongoing basis.224 The issue of
whether the no-harm test should be used with respect to the sale of CPC and the corporate
services costs allocation was not addressed during EDTI and EEAI‟s last GRA as the issue of
corporate services costs was negotiated.225 Given that it is now four years after the sale of CPC
and that EUI is not currently nor was it at the time of sale a designated utility, the Commission
considers that it is incongruous to employ the no-harm test to assess the corporate services costs.
The legislative framework, coupled with the three questions from Decision 2010-505 provide the
Commission with the necessary guidance to ensure that EDTI‟s corporate services costs are just
and reasonable.
380. For all of the above reasons, in the sections that follow, the Commission will use the
three questions set out in Decision 2010-505, with reference to the eight points in Decision
2011-399 where applicable, to determine whether the allocation of corporate services costs to the
utilities is just and reasonable. In making this determination, the Commission considers that the
applicant has the onus to support its tariff application.
222
Decision 2011-399 at paragraph 23. 223
See Decision 2003-040: ATCO Group, Affiliate Transactions and Code of Conduct Proceeding, Part B: Code of
Conduct, Application No. 1237673, May 22, 2003, at page 24 and page 76. 224
Decision 2009-176: AltaGas Utilities Inc. 2008-2009 General Rate Application Phase I, Application
No. 1579247, Proceeding ID. 88, October 29, 2009, at paragraph 300. 225
See Proceeding ID No. 437.

2012 Phase I and II Distribution Tariff 2012 Transmission Facility Owner Tariff EPCOR Distribution & Transmission Inc.
AUC Decision 2012-272 (October 5, 2012) • 81
6.2 Corporate services costs allocated from EPCOR Utilities Inc.
381. In Decision 2010-505 the Commission made the following finding:226
The Commission has concluded that it is not in a position to determine the proper
regulatory treatment for EDTI‟s and EEAI‟s allocated corporate costs considering the
effects of the corporate restructuring following the spin off of CPC from EUI. For some
items, there is some evidence that could support the allocation of portions of what EUI is
allocating to EDTI and EEAI, yet there is also some evidence favoring the UCA‟s and the
CCA‟s requests to lower those cost allocations. The Commission also recognizes that
neither CPC nor EUI are regulated companies.
382. As such, the Commission directed that a separate module be convened for the purpose of
investigating the corporate services costs in a more detailed fashion. The Commission invited
parties to consider whether all, none or some of the corporate services costs allocated to the
utilities should be allowed and outlined the “basic framework for analysis”227 which included the
three questions described above. In Decision 2011-262, the Commission approved a negotiated
settlement agreement that reflected an agreement on the quantum of corporate services costs
allocated or assigned to EDTI and EEAI but also included an outstanding matter related to the
requirement for an independent audit of the EUI corporate and shared costs. As outlined above,
the question of whether or not an audit was required was addressed in Decision 2011-399 and the
eight points the Commission expected to consider when assessing EDTI‟s corporate services
costs in EDTI‟s next GTA were introduced.
383. The three questions identified in Decision 2010-505 are discussed in the sections that
follow in the context of this application and, where appropriate, supported with references to the
eight points from Decision 2011-399.
6.2.1 Are the costs related to the provision of corporate services from EUI to EDTI and
EEAI necessary for EDTI and EEAI to provide utility service?
6.2.1.1 Total corporate services costs to be allocated
384. In support of its applied for corporate services costs, EDTI provided evidence that
outlined the basis for the 2012 corporate services costs forecast including a service by service
discussion of why each corporate service is required to enable EDTI and EEAI to provide utility
service. This evidence was supported with an assessment prepared by PA Consulting with the
assistance of Solvera Solutions on the reasonableness of the 2012 forecast (the PA report). EDTI
also filed expert evidence by Dr. Dennis Weisman addressing matters related to the role of
regulation as a proxy for competition.
385. In the application, EDTI identified the corporate services provided by EUI to EDTI and
EEAI. As presented in the table below, the costs of these corporate services are directly assigned,
allocated or charged as an asset usage fee:
226
Decision 2010-505 at paragraph 97. 227
Decision 2010-505 at paragraph 99.

2012 Phase I and II Distribution Tariff 2012 Transmission Facility Owner Tariff EPCOR Distribution & Transmission Inc.
82 • AUC Decision 2012-272 (October 5, 2012)
Table 40. 2012 corporate services costs by method ($ millions)
Corporate services costs EUI total
EDTI dist.
EDTI trans.
EDTI total
EEAI total
Other total
Directly assigned costs
Total IS 15.60 3.98 0.64 4.62 7.31 3.68
SCM-space rent 2.59 0.00 0.00 0.00 2.15 0.44
SCM-facility 0.64 0.31 0.00 0.31 0.00 0.33
Corporate security 0.08 0.00 0.00 0.00 0.07 0.01
Total directly assigned costs 18.92 4.29 0.64 4.93 9.53 4.46
Allocated costs
Supply chain management 14.78 3.86 1.44 5.30 1.87 7.60
Human resources 6.40 1.99 0.30 2.29 0.83 3.28
Information services 10.14 2.94 0.48 3.42 1.95 4.77
Corporate finance 6.13 1.56 0.58 2.14 0.89 3.11
Executive & executive assistants 2.70 0.65 0.27 0.92 0.42 1.36
Treasury 2.38 0.47 0.31 0.78 0.13 1.48
Board costs 2.04 0.53 0.22 0.75 0.34 0.95
Incentive compensation 6.67 1.76 0.57 2.33 1.00 3.35
Public & government affairs 6.08 1.47 0.58 2.05 1.16 2.88
Legal services 2.88 0.75 0.31 1.01 0.48 1.34
Risk, assurance & advisory serv. 2.34 0.56 0.23 0.79 0.36 1.18
Business transformation 0.75 0.18 0.07 0.25 0.12 0.38
Strategic Planning 1.70 0.41 0.17 0.58 0.27 0.86
Regulatory affairs 2.83 0.68 0.28 0.96 0.22 1.21
Health, safety and environment 1.91 0.55 0.08 0.63 0.23 1.05
Total allocated costs 69.73 18.35 5.91 24.26 10.50 34.98
Asset usage fees
Leasehold assets 2.52 0.50 0.16 0.66 0.79 1.07
HRIS 1.24 0.36 0.06 0.42 0.14 0.68
IS infrastructure 10.62 3.14 0.55 3.69 2.85 4.08
Financial system 2.01 0.49 0.22 0.71 0.16 1.14
Fiber optic assets 0.16 0.06 0.01 0.07 0.00 0.09
Furniture and fixtures 1.38 0.37 0.12 0.49 0.19 0.70
Vehicle 0.04 0.01 0.00 0.01 0.01 0.02
Total asset usage fees 17.97 4.94 1.14 6.08 4.14 7.75
Total corporate services costs 106.63 27.58 7.69 34.45 23.76 47.19
Source: Directly assigned–application Table 10.2-1; Allocated costs-application Table 10.3-2; Asset usage fees application Section 10.5.
386. In evaluating the necessity of each of the services, EDTI‟s evidence relied heavily on the
PA report and the included benchmarking results. The PA report summarizes the assessment of
whether a cost is necessary as follows:
4. In determining whether the cost[s] related to the provision of each service are
necessary, we assessed the need for the service itself, and additionally, the reasonableness
of the costs at the Corporate Service cost pool level.

2012 Phase I and II Distribution Tariff 2012 Transmission Facility Owner Tariff EPCOR Distribution & Transmission Inc.
AUC Decision 2012-272 (October 5, 2012) • 83
5. With exceptions noted regarding EEAI in Chapter 2, the 40 Corporate Services
provided by EUI are necessary for EDTI and EEAI to provide utility service. The
exceptions relating to EEAI are Fleet Management (section 2.3) and Inventory
Management & Warehousing (section 2.5). EEAI does not require these two services and
does not receive an allocation of costs for them.
6. EPCOR‟s proposed 2012 Corporate Services spend by service, when normalized by a
combination of revenues, net assets, and headcount is consistent with industry norms and
is reasonable.
7. EPCOR‟s use of At-Risk-Pay for its employees to participate in the cost management
process by rewarding them for achieving lower than budgeted costs is consistent with
good management practice. We conclude that the inclusion of cost management as a
factor in the At-Risk-Pay calculation makes a meaningful contribution to ensuring that
the costs of Corporate Services are reasonable.
387. A benchmarking approach was also used by Dr. Weisman in his evidence sponsored by
EDTI:
The relevant model of competition is one that essentially compares the relative
performance of two or more similarly-situated utilities. In this context, the term
“similarly-situated” refers to utilities that provide service under similar conditions,
including population density, climatic conditions, etc. The basic idea is to create a
“yardstick” by which the regulator can evaluate the relative performance of the utility
even though that utility may not face actual competition.
388. The UCA challenged the validity of the PA report in determining the reasonableness of
the corporate services costs. The UCA submitted that the sample data relied on in the
benchmarking study was not comparable to EUI as it did not contain similar companies and the
data normalization performed by PA Consulting further compromised the value of the resulting
analysis.
389. During the proceeding the Commission requested clarification of the characteristics of
the benchmarking comparator companies and data normalization process in information requests
AUC-EDTI-34, AUC-EDTI-35, AUC-EDTI-36 and AUC-EDTI-37. Further, specific corporate
services cost items were evaluated in detail and are described in the sections that follow. These
corporate services cost items include: short-term incentive payments, mid-term incentive
payments, business development costs, community relations, and the EPCOR community
essentials council. Each of these items is discussed below.
Commission findings
390. The Commission finds the PA Report did not adequately demonstrate that all of the
corporate services provided to EDTI and EEAI are necessary for the provision of utility service
or that the costs of the services charged to EDTI and EEAI are reasonable. The Commission
shares many of the concerns raised by the UCA and the CCA regarding the comparability of the
data and the normalization of this data performed in the PA Report. The Commission finds that
the benchmarking does not demonstrate the need for all of the services. The normalization,
including the implicit assumption that all of the costs are variable,228 does not support the
228
Exhibit 167.02, AUC-EDTI-36.

2012 Phase I and II Distribution Tariff 2012 Transmission Facility Owner Tariff EPCOR Distribution & Transmission Inc.
84 • AUC Decision 2012-272 (October 5, 2012)
conclusion that the costs are reasonable. The Commission finds that EDTI has not adequately
demonstrated that some of the corporate services costs charged to EDTI and EEAI are necessary
to provide utility service.
391. The appropriate size has been questioned relative to lost economies of scale. In Decision
2010-505, the Commission raised the question as to whether EUI should pay for any or all lost
economies of scale that would remain in 2012 and beyond. The actual corporate services costs
after the CPC transaction indicates that costs were reduced in 2010 and 2011. In AUC-EDTI-64,
in responding to a Commission information request about the relationship between changes to
the business activity in EDTI and the corporate services costs, EDTI stated:229
PA Consulting‟s view is that as part of the CPC divestiture, EUI materially reduced its
corporate costs and redesigned its corporate activities to be reasonably scaled to provide
services to its remaining businesses and provide a platform for growth of those utility
businesses.
392. In prior proceedings, the Commission expressed concern about the lack of comparable
corporate services costs information for EDTI and EEAI after the CPC transaction in 2009.230 In
this proceeding, there are two years of comparable corporate services costs data from which the
Commission can assess the reasonableness of the corporate services costs attributed to EDTI and
EEAI. This actual historical data also provides assistance to the Commission in assessing how
the 2012 forecast reflects EUI‟s actual cost experience. The actual total corporate services costs
for 2010 and 2011 are compared to the 2012 forecast in the table below:
Table 41. 2010-2012 EUI corporate services costs ($ millions)
Category 2010 (D)
2010 (A)
2010 (D)-2010 (A)
2011 (D)
2011 (A)
2011 (D)-2011 (A)
2011 (A)-2010 (A)
2012 (F)
2012 (F)-2011 (A)
Directly assigned 17.35 17.48 0.7% 18.06 17.40 (3.7%) (0.05%) 18.92 8.7%
Allocated 61.66 55.88 (9.4%) 65.64 58.47 (10.9%) 4.6% 69.74 19.3%
Asset usage fees 13.78 13.23 (4.0%) 15.56 17.53 12.7% 32.5% 17.97 2.5%
Total EUI Costs 92.79 86.59 (6.7%) 99.26 93.10 (5.9%) 7.9% 106.63 14.2%
Source: AUC-EDTI-70 Table 10.0-1 Revised Legend: (D) decision, (A) actual, (F) forecast
393. Based on the table above, the total actual corporate services costs increased by
7.9 per cent ($6.82 million) from 2010 to 2011. For 2012, EUI is forecasting an increase of
14.2 per cent ($13.22 million) in total EUI corporate services costs. This incorporates an increase
of 19.3 per cent in the category of allocated costs. Given the general cost escalators231 used in
other parts of the application, the Commission finds the 19.3 per cent forecast increase in the
allocated category of corporate services costs to be excessive. As the corporate services required
by EDTI and EEAI do not appear to have changed significantly,232 the Commission has concerns
with the increasing allocated cost category.
229
Exhibit 186.02, AUC-EDTI-64 230
Decision 2011-399, paragraph 25. 231
Refer to Section 3.4 Cost escalations. 232
Exhibit 186.02, AUC-EDTI-64, page 22.

2012 Phase I and II Distribution Tariff 2012 Transmission Facility Owner Tariff EPCOR Distribution & Transmission Inc.
AUC Decision 2012-272 (October 5, 2012) • 85
394. The corporate services in the directly assigned category appear to be within an acceptable
level of escalation. Also, when considering the impact of the Station Lands facility in 2011,233 the
asset usage category is within an acceptable level of escalation. The allocated category of costs
will be addressed in detail in this decision.
395. The corporate services costs in the allocated cost category for 2010 were 9.4 per cent less
than the approved amount and for 2011 were 10.9 per cent less than the approved amount. This
suggests a significant amount of discretion in the actual expenditures and possible forecasting
errors. Based on a review of the historical actual information, the nature of the costs included in
the allocated cost category and the lack of persuasive support for the increases in allocated
corporate services costs, the Commission considers that this forecast is excessive and would
result in unreasonable costs being allocated to EDTI and EEAI. Therefore, for the purpose of
allocating costs to EDTI and EEAI, the Commission directs EDTI to reduce the 2012 forecast
corporate services costs in the allocated category by nine per cent after any other corporate
services costs reductions identified in the application or directed in this decision are applied. The
Commission finds that a nine per cent reduction is reasonable given the reduction in
discretionary expenditures and any forecast errors reflected in the 9.4 per cent and 10.9 per cent
reductions experienced in 2010 and 2011 respectively.
396. The Commission will now examine individually specific costs included in the allocated
cost category in the following sections.
6.2.1.2 Short-term incentive payments allocated to the utilities by EUI
397. Included in the total corporate services costs allocated to EDTI and EEAI is an amount
related to the short-term incentive compensation paid to EUI corporate employees. This
incentive compensation is based on individual performance ratings as well as EUI‟s overall
annual corporate targets. For 2012, the corporate targets include an EUI earnings amount and
three additional broad categories: health and safety, operational efficiency and customer service.
398. Both the UCA and the CCA recommend that a portion of the STI amounts be excluded
from EDTI‟s revenue requirements. The UCA put forward the position that the EUI earnings
component of the program for corporate employees puts the interests of customers of the utilities
in conflict with the incentive to increase profits. The CCA adopted a similar position and
additionally questioned the resulting earnings impact from PP&E growth. In its argument the
CCA stated:234
The recommended disallowance should be in addition to the disallowance of any earnings
related STI exceeding the 10% weighting referred to in EDTI‟s rebuttal. Since EDTI has
failed to identify the portion of STI that is related to earnings driven by PP&E growth,
CCA recommends that 50% of the STI excluding the 10% already recognized by EDTI as
earnings related, be considered PP&E related and excluded from 2012 STI allocated to
EDTI.
399. EDTI argued that the positions of the UCA and the CCA are flawed in reasoning and
misapply prior Commission directions. The short-term incentive programs are corporate wide
and therefore all employees have similar targets. Customers of EDTI and EEAI will benefit from
233
The Commission approved the move to Station Lands in Decision 2010-505, pages 12-14. 234
Exhibit 207.01, CCA argument, page 35.

2012 Phase I and II Distribution Tariff 2012 Transmission Facility Owner Tariff EPCOR Distribution & Transmission Inc.
86 • AUC Decision 2012-272 (October 5, 2012)
efficiencies found in all EPCOR business units and corporate departments and as such the
amounts related to the short term incentive program included in the allocated corporate services
costs are reasonable and should be approved. In addressing the issue of PP&E growth within the
STI program, EDTI stated:235
…EDTI cannot identify the portion of STI that is related to earnings driven by PP&E
growth because there is no direct link and there is unlikely to be any effect at all. If
anything, the portion would be a small fraction of the 10% earnings component. As such,
there is no rational basis for the CCA‟s suggestion that 50% of the STI should be
considered PP&E-related.
Commission findings
400. Consistent with the findings made in Section 3.5, the Commission accepts the forecast
2012 STI amounts included in the total allocated corporate services costs.
6.2.1.3 Mid-term incentive payments allocated to the utilities by EUI
401. In mid-2010, EDTI established a new MTI program. This program is designed to provide
an incentive to EDTI senior management to invest the proceeds from the sale of Capital Power,
and any subsequent sale of EDTI‟s remaining interest, in regulated and contracted utility
investments. Costs related to the MTI are included in the total corporate services costs allocated
to EDTI and EEAI. EDTI submitted that this plan will benefit customers of the utilities by both
regaining the lost economies of scale that resulted from the Capital Power transaction and
increasing EDTI‟s access to capital by shifting EDTI‟s portfolio toward lower risk utility
investments.
402. The UCA and the CCA both recommended that the cost of MTI should not be included in
the revenue requirement of EDTI because it is not required to provide utility service. Further, a
program that creates an incentive to invest without regard for efficient capital spending would
result in any benefit being for the benefit of the EUI shareholders and not in the best interests of
the customers of the utilities.
403. EDTI refuted the assessment of the UCA and the CCA and argued that it has sufficient
controls in place to mitigate any negative effects of the MTI program.
Commission findings
404. In addition to the findings made in Section 3.6, the Commission does not accept that the
forecast 2012 MTI amounts included in the EUI corporate services costs are required to provide
utility service. EDTI identified a net benefit to utility customers from the increased economies of
scale that will be captured through the allocation of costs to new businesses as it seeks out
growth opportunities. While there may be some possible transitory future benefit, EUI could
divest itself of the acquired businesses and leave utility customers in the position of having paid
the costs related to acquisitions and captured little or none of the benefits. The Commission
considers that the MTI program is designed in a way that any resulting benefits will accrue to the
shareholder of EUI. As the Commission is not convinced that MTI provides any benefit to utility
customers, the Commission finds that this cost should not be approved as an element of the costs
235
Exhibit 211.02, EDTI reply argument, page 47.

2012 Phase I and II Distribution Tariff 2012 Transmission Facility Owner Tariff EPCOR Distribution & Transmission Inc.
AUC Decision 2012-272 (October 5, 2012) • 87
to be allocated to EDTI and EEAI. The Commission directs EDTI to remove all MTI amounts
from the corporate services costs allocated to EDTI and EEAI.
6.2.1.4 Community relations and EPCOR community essentials council
405. In its submissions during the proceeding, the UCA recommended that the costs allocated
to EDTI related to community relations and the community essentials council should be denied.
The UCA stated that these costs are not required for the provision of utility service. Further, any
requirement for these services would be included directly in the costs of EDTI.
406. EDTI responded to the UCA‟s position, with support from PA consulting, stating the
community relations and EPCOR community essentials council provide services that are
required and are beneficial to EDTI and EEAI customers as the face of the utility and the first
point of contact for citizens and the communities it serves. Removing these costs would have the
effect of harming these communities.
Commission findings
407. In its evidence the UCA made reference to a number of prior Commission decisions
including Decision 2010-483,236 Decision 2009-238237 and Decision 2011-450238 that address the
issue of customer communications and brand development. Each of these decisions denies costs
related to the types of activities identified by EDTI as included in community relations and the
EPCOR community essentials council services. The Commission acknowledges that EDTI has
removed certain costs such as donations from these costs but finds that the remaining costs are
not required for the provision of utility service and directs EDTI to remove these costs from the
2012 forecast corporate services costs allocated to EDTI and EEAI.
6.2.1.5 Other corporate services costs
408. The UCA also questioned the applied-for FTE additions in the corporate services costs as
unnecessary and not justified. The UCA submitted that the regulatory workload for 2012 is
relatively the same as 2010 and there is no demonstrated need for the additional positions. In
making this assertion the UCA stated:
Q27. Are there any corporate costs that are in excess of what is needed for EDTI?
A27. Yes, EDTI has included five FTEs equivalent for additional regulatory work; one
headcount equivalent is included in Legal Services and three headcount equivalent in
Regulatory Affairs and one FTE in EDTI Shared Services.
[…]
A29 I find the requested number of additional FTEs excessive, given that the number of
regulatory applications forecast for 2012 is no different than for 2010 where there was
almost the same amount of workload.
236
Decision 2010-483: ENMAX Energy Corporation, 2009-2011 Regulated Rate Option Non-Energy Tariff
Application, Part 2 – Tariff Application, Application No. 1605947, Proceeding ID. 521, October 7, 2010. 237
Decision 2009-238: Direct Energy Regulated Services, 2009/2010/2011 Default Rate Tariffs and Regulated
Rate Tariffs, Application No. 1600749, Proceeding ID. 149, December 3, 2009. 238
Decision 2011-450: ATCO Gas (a Division of ATCO Gas and Pipelines Ltd.), 2011-2012 General Rate
Application Phase I, Application No. 1606822, Proceeding ID No. 969, December 5, 2011.

2012 Phase I and II Distribution Tariff 2012 Transmission Facility Owner Tariff EPCOR Distribution & Transmission Inc.
88 • AUC Decision 2012-272 (October 5, 2012)
409. EDTI responded to the UCA‟s claims by referring to the detailed explanations provided
within its submissions that clearly identify the need for each of the five new positions. Further,
EDTI submitted that there are several lengthy and complex initiatives underway in 2012
demonstrating that additional resources are necessary. This was supported in EDTI‟s argument
when it stated that the UCA evidence:
…ignores the fact that 2012 is panning out to be one of the busiest and most work
intensive years from a regulatory perspective for EDTI, EEAI and other utilities and
interveners in Alberta, with not only numerous tariff and facilities applications but also
novel proceedings…
Commission findings
410. The Commission acknowledges the detailed explanation provided by EDTI that
additional resources are necessary for 2012. Of the five additional positions referred to by
interveners, four positions are part of the total corporate services costs to be allocated. In
response to AUC-EDTI 63,239 EDTI indicated that additional support had been requested by
EDTI and EEAI. Given that EDTI and EEAI expressed a need for additional support the
Commission approves the allocation of the costs of these four positions to EDTI and EEAI
subject to the nine per cent reduction directed above.
6.2.1.6 Business development costs
411. In Decision 2011-399, the Commission identified business development costs as one of
the areas of interest in making an assessment of the level of corporate services costs EUI
proposed to allocate to EDTI. EDTI addressed the business development costs in Section 10.1.9
of the application. It described the types of costs incurred and the activities undertaken in pursuit
of growth within the EPCOR group of companies. EDTI estimated the corporate services costs
related to business development will range between $0.37 and $0.65 million in 2012. EDTI
further submitted that including these costs in the pool of costs allocated to EDTI and EEAI is
reasonable because the utilities will benefit from any future economies of scale that may result
from the business development activities.
412. Both the UCA and the CCA rejected the position put forward by EDTI and recommended
that all costs related to business development be excluded from the revenue requirement of
EDTI. This would include the costs identified by EUI and any additional costs that can be
reasonably estimated or identified as relating to business development activities as the amount
identified by EUI is not inclusive of all the related costs. Both the UCA and the CCA argued that
the business development activities do not relate to the provision of utility service.
Commission findings
413. The Commission agrees with the position put forward by the UCA and the CCA that
business development costs are not related to the provision of utility service. Business
development costs relate to the growth within the EPCOR group of companies not EDTI and
EEAI and therefore should not be included in the corporate services costs allocated to EDTI and
EEAI. The Commission finds that the argument for including the business development costs put
forward by EDTI that there will be potential future benefits from economies of scale
239
Exhibit 186.02, AUC-EDTI-63, page 19.

2012 Phase I and II Distribution Tariff 2012 Transmission Facility Owner Tariff EPCOR Distribution & Transmission Inc.
AUC Decision 2012-272 (October 5, 2012) • 89
acknowledges that there is no current benefit from these services to EDTI and EEAI and,
therefore, the costs are not currently required for the provision of utility service.
414. Additionally, as discussed regarding MTI above, there is no assurance that future benefits
would accrue to the benefit of customers.
415. The Commission further finds that EDTI has not fully identified the costs related to
business development and the range of costs between $0.37 million and $0.65 million does not
capture the total costs forecast for these activities as it only includes the direct costs and makes
no provision for overheads or indirect costs.240
416. The Commission directs EDTI to remove $1.15 million ($0.65 million including a
77 per cent241 overhead charge) from the 2012 forecast EUI corporate services costs and to
remove the proportionate share of these business development costs from the amounts allocated
to EDTI and EEAI.
6.2.2 Are the corporate services costs allocated correctly?
417. EUI charges fees related to assets owned by the service provider that are used in
providing the corporate services. These fees are referred to as assets usage fees. In addition, EUI
assigns corporate services costs to the EPCOR business units using the following six step
process:
(1) categorize the corporate services costs as directly assignable or allocable
(2) assign the directly assignable costs to the appropriate business unit
(3) review/develop/modify/refine the allocation methods for allocable costs
(4) apply the allocation methods to the allocable costs
(5) allocate the corporate services costs to the business unit‟s master overhead pool
(6) conduct a final review for reasonableness
418. EDTI stated in the application that the cost allocation process is designed to ensure that
the allocation of corporate services costs among business units is appropriate, fair and
reasonable, cost-effective, predictable, reflects the benefit received by function, and is consistent
with the transfer pricing principles in EPCOR‟s Inter-Affiliate Code of Conduct.
419. Corporate services costs are allocated on one of two bases:
(1) using a single functional cost causation allocator where the costs can be logically
allocated using an identified cost causation driver; or
(2) using a composite cost causation allocator. The composite cost causation allocator is
used for costs of a governance nature, and it is appropriate that these types of costs be
allocated based on a combination of the business unit‟s share of EPCOR group‟s
revenues, assets, capital expenditures and headcount.
240
Exhibit 148.02, AUC-EDTI-13, page 61. 241
Exhibit 148.02, AUC-EDTI-13, page 61.

2012 Phase I and II Distribution Tariff 2012 Transmission Facility Owner Tariff EPCOR Distribution & Transmission Inc.
90 • AUC Decision 2012-272 (October 5, 2012)
420. The composite cost causation allocator is used to allocate a large number of costs which
are presented in the following table:
Table 42. Costs allocated by the composite cost causation allocator (2012 $ millions)
2012 forecast corporate services costs EUI total
EDTI dist
EDTI trans
EEAI
Composite cost causation allocator – EUI Revenue, Assets, CapEx, Headcount
SCM administration 1.55 0.40 0.17 0.26
Real estate 0.54 0.14 0.06 0.09
SCM corporate services 8.19 1.97 0.82 1.28
Taxation 0.83 0.22 0.09 0.14
Corporate accounting 0.91 0.22 0.09 0.14
Consolidated reporting & analysis 1.37 0.33 0.14 0.21
Financial management training program 0.51 0.13 0.06 0.09
Audit fees 0.96 0.23 0.10 0.15
Executives & executive assistant costs 2.70 0.65 0.27 0.42
Board costs 2.04 0.53 0.22 0.34
Government relations 0.76 0.20 0.08 0.13
Public consultation 0.16 0.04 0.02 0.03
EPCOR community essentials council 0.77 0.18 0.08 0.12
Legal services 2.88 0.75 0.31 0.48
Risk, assurance and advisory services 2.34 0.56 0.23 0.36
Business transformation 0.75 0.18 0.07 0.12
Strategic planning 1.70 0.41 0.17 0.27
Regulatory affairs 2.83 0.68 0.28 0.44
Total composite cost causation allocator 31.79 7.82 3.26 5.07
100% 24.6% 10.25% 16.0%
Source: Application Table 10.1.5-1 and Table 10.3-2
421. In Section 1 of its report, PA Consulting described the use of a composite allocator as
follows:242
The use of a multi-factor formula to allocate costs that cannot be directly charged and for
which a cost causative factor cannot be identified, is a common practice in the utility
industry.
The most common is a three factor formula, with each factor equally weighted, and is
generally referred to as the Massachusetts Formula (MF), where the three components of
the factor are representative of:
- Plant
- Revenues
- Labor
As there are no universal definitions for “Plant”, “Revenues”, and “Labor”, utilities have
implemented the Massachusetts Formula using a variety of different measures
representative of the three components. For example, to represent labor some companies
use payroll expense, while others use employee headcount. Further, variations in the
formula have emerged over time, as utilities and regulators alike have modified the
242
Exhibit 81, Appendix G-5, pages 9-10.

2012 Phase I and II Distribution Tariff 2012 Transmission Facility Owner Tariff EPCOR Distribution & Transmission Inc.
AUC Decision 2012-272 (October 5, 2012) • 91
Massachusetts Formula to address situation specific issues, resulting in so-called
Modified Massachusetts Formula (MMF) allocation formulas.
Some of the more common measures used in Massachusetts Formula or Modified
Massachusetts
Formula implementations include:
Assets: Net Plant is a common component of general allocators in the utility industry,
especially when there are no significant non-regulated affiliates; also used are Total
Assets and PP&E.
Revenue: Total Revenue; Margin (Total Operating Revenues less Cost of Fuel/Gas);
Number of Customers.
Labor: Payroll; Headcount; O&M Expenses
422. During the proceeding, the following five issues were identified with respect to the
composite cost causation allocator:
(1) whether fully-loaded payroll is a more accurate representation of labour than
headcount; (labour component)
(2) whether the revenue component of the composite allocator should be total revenue or
margin, i.e. net of commodity revenue (revenue component)
(3) whether the inclusion of capital expenditures in the composite cost causation allocator
improves the quality of the allocation
(4) whether some corporate services costs should be allocated to EUI itself for its
management of its investment in CPC, or for its management of the funds remaining
from its partial sale of CPC
(5) whether EUI has acquired any new businesses to which it should allocate some of its
corporate services costs
423. Each of these issues is addressed in the sections that follow.
6.2.2.1 Labour component of the composite cost causation allocator
424. The question of whether headcount or payroll cost is most suitable for inclusion as the
labour component of the composite cost causation allocator was discussed in responses to
information requests, specifically AUC-EDTI-15 and AUC-EDTI-30. PA Consulting provided
additional analysis that demonstrated using payroll in the place of headcount produced a similar
result but caused a shift slightly away from EEAI and toward EDTI consistent with somewhat
higher average salary levels for the EDTI workforce.
425. In AUC-EDTI-15, PA Consulting discussed the relative merits of payroll or headcount as
an allocator:
Conceptually, headcount is a good allocator for services that vary, or are driven, by the
existence of an employee. For example, payroll costs are driven by the number of
employees and the frequency with which they are paid, while the actual rate of pay for
the employees is not a driver of payroll costs. Costs for office space, desktop computing
and communications costs, and human resources support all are driven by the number of

2012 Phase I and II Distribution Tariff 2012 Transmission Facility Owner Tariff EPCOR Distribution & Transmission Inc.
92 • AUC Decision 2012-272 (October 5, 2012)
employees, while the actual compensation or the range of compensation of those
employees is not a material driver of these types of costs.
Fully burdened labour cost, assuming that the burdening is for pension and benefits, is
administratively more complex to administer. Further, the variations that overtime pay,
short term incentive pay, and medium term incentive compensation can make fully
burdened labour a less stable allocation factor.
In selecting an allocation factor for Corporate Services costs the Company should choose
a clear driver of the cost. This approach provides a clearly understood cost driver for each
service or activity and provides transparency to the business units as to the Corporate
Services costs they will incur due to changes in their headcount or vehicle count, for
example.
Commission findings
426. The Commission accepts the position that fully burdened labour cost is administratively
more complex and as such may not be as clear or stable as headcount as an allocator.
Additionally, given the relatively minor variation in the resulting allocation demonstrated in the
analysis of the alternatives, the Commission finds that the use of headcount for the labour
component in the composite cost causation allocator is acceptable as utilized in the applied-for
allocated corporate services costs. However, given the different mix of employees in the
companies, the Commission considers there should be a review of the impact of the use of
payroll or full-time equivalents (FTEs) rather than headcount. The Commission therefore directs
EDTI and EEAI to include in any future applications that incorporate the composite cost
causation allocator, an analysis of the use of payroll and FTEs as the labour component. Should
the profile of the mix of employees in the EPCOR businesses be modified, the Commission may
determine that headcount no longer results in the most fair and reasonable allocation
6.2.2.2 Revenue component of the composite cost causation allocator
427. EDTI submitted that the use of revenue as a component in a composite allocation
indicator is widely accepted as reasonable. The question of what is included in revenue was
discussed in CCA-EDTI-79. In the information requests, the CCA questioned the inclusion of
commodity revenue in the revenue component of EPCOR‟s composite cost causation allocator.
428. In its response to the CCA information request, EDTI provided the following explanation
of why commodity revenue should be included:243
The revenue component of the composite allocator is EUI‟s proxy for cash flows. By not
including commodity revenue in the allocation process, the approximate corporate cost of
managing and governing the cash flows from this form of revenue would not be taken
into account and allocated appropriately, resulting in an allocation of corporate costs
unrepresentative of the level of service provided.
243
Exhibit 168.01, CCA-EDTI-79, page 27.

2012 Phase I and II Distribution Tariff 2012 Transmission Facility Owner Tariff EPCOR Distribution & Transmission Inc.
AUC Decision 2012-272 (October 5, 2012) • 93
429. The Commission also expressed an interest in the revenue component in AUC-EDTI-15
when it asked:244
Please indicate whether the revenue component in the calculation includes flow through
charges and if so, comment on this practice.
430. In its response, EPCOR provided additional clarification related to the use of specific
revenue components as follows:
In responding to the Commission‟s question and in reference to the term “flow through
charges”, we assume the Commission means the electricity transmission and distribution
tariffed charges to EEAI by EDTI for the delivery of electricity. The revenue component
used in EUI‟s corporate allocation model does include these flow through charges, as
reported in each EUI subsidiaries‟ stand-alone financial statements. We believe this
approach is reasonable. The corporate allocation model‟s reliance on stand-alone
financial statement data provides for transparency, as revenue, net asset, and capital
expenditure data for each subsidiary are clear and unambiguous. Further, it avoids the
potentially very complicated definitional question of exactly what is or is not a flow
through charge.
Commission findings
431. In examining the financial statements of EPCOR Utilities Inc. for the period ending
December 31, 2011,245 the Commission observed in the Notes to the Consolidated Financial
Statements, note 37, that inter-segment revenue and electricity purchases and system access fees
are identified as amounts reducing total revenue. This information is summarized in the table
below:
Table 43. EPCOR Utilities Inc. – business information ($ millions)
Year ended December 31, 2011
Water services Dist & trans
Energy services Corporate
Intersegment elimination Cons
External revenues and other income
312 330 1,152 39 - 1,833
Inter-segment revenue - 152 11 - (163) -
Total revenue and other income
312 482 1,163 39 (163) 1,833
Portion of total revenue and other income
17% 26% 63% 2% (9%) 100%
Electricity purchases and system access fees
- (143) (1,077) - 144 (1,076)
Net revenue 312 339 86 39 (19) 757
Portion of net revenue 41% 45% 11% 5% (2%) 100%
Net Income 4 38 8 96 - 144
Portion of net income 3% 26% 6% 67% 100%
Source: EUI Financial Statements year ended December 31, 2011, note 37
432. It can be observed from the information summarized in the table above that the inclusion
or exclusion of specific revenue items can significantly alter the resulting revenue component of
244
Exhibit 148.02, AUC-EDTI-15, page 68. 245
Exhibit 167.08, AUC-EDTI-17 Attachment 5, page 55.

2012 Phase I and II Distribution Tariff 2012 Transmission Facility Owner Tariff EPCOR Distribution & Transmission Inc.
94 • AUC Decision 2012-272 (October 5, 2012)
the composite cost causation allocator. In the case of the Energy Services segment, the segment
revenue is 63 per cent of consolidated total revenue while only 11 per cent of net revenue after
deducting electricity purchases and system access fees, and six per cent of net income.
Additionally, with the distribution and transmission segment, 32 per cent of the revenue is
related to inter-segment amounts that are eliminated on consolidation. While the Commission
acknowledges this is an approximation of the impact of commodity revenue and flow through
amounts, this analysis is of assistance in making a determination of the relative significance
when choosing to include or exclude items from the revenue component of the composite cost
causation allocator.
433. There is a distortive effect on the revenue component of the composite allocator of
including inter-company transactions and flow through amounts in revenues. As commodity
prices are not stable or predictable, the use of revenues including commodity charges does not
reflect the underlying business activity and the related burden on corporate services. Due to the
volatility of commodity prices the allocator is neither predictable nor stable.
434. The Commission, having factored in both the availability and transparency of the revenue
components, considers the exclusion of commodity and flow through items, a measure of
margin, is a better reflection of the burden each business segment has on the total corporate
services costs allocated using the composite cost causation allocator. To ensure each revenue
item is only included once in the calculation of the revenue component of the composite cost
causation allocator, the Commission directs EDTI and EEAI to include revenue net of
commodity charges, items that flow through to utility customers, and any items eliminated on
consolidation as the revenue component of the composite cost causation allocator.
6.2.2.3 Capital expenditure component of the composite cost causation allocator
435. In the application, EDTI indicated that the composite cost causation allocator is
comprised of four components: (1) total annual revenue, (2) total net assets, (3) headcount, and
(4) total annual capital expenditures.246 Each component is weighted equally.
436. In CCA-EDTI-10, the CCA expressed a concern that the components and weightings
used in the composite cost causation allocator appear to place almost three times the weighting
on the capital costs of EUI subsidiaries. This over-emphasis on capital may not be appropriate
based on the level of capital related services being provided by EUI.
437. In its response to CCA-EDTI-10, EPCOR provided the following clarification:247
When EUI modified its composite cost causation allocator in conjunction with the 2010 -
2011 General Tariff Application, it first considered what aspects of a business are most
important and therefore require a high degree of effort to manage and govern. EUI
concluded that those aspects were its assets, cash flow, investment / capital expenditure
decisions, and employees.
and
Revenue was determined to be a sound and reasonable proxy for cash flow and capital
expenditures for investment decisions.
246
Exhibit 81.0, Appendix G-5, page 10. 247
Exhibit 150.01, CCA-EDTI-10, page 48.

2012 Phase I and II Distribution Tariff 2012 Transmission Facility Owner Tariff EPCOR Distribution & Transmission Inc.
AUC Decision 2012-272 (October 5, 2012) • 95
438. In describing the use of the composite cost causation allocator, EDTI stated that the
composite cost causation allocator is used when costs tend to be of a governance nature, and it is
appropriate that these types of costs be allocated based on a combination of the business unit‟s
share of EPCOR group revenues, assets, capital expenditures and headcount.
Commission findings
439. The Commission agrees with the assertion made by the CCA that an allocator with an
equal weighting of capital expenditures, assets, revenue and headcount places greater emphasis
on investments in capital. This puts a disproportionate emphasis in the allocation of governance
costs on those business units that have more capital expenditures. Because capital expenditures
vary from year to year, the inclusion of capital expenditures in the composite cost causation
allocator reduces the predictability and stability of the allocator.
440. For these reasons, the Commission directs EDTI to remove capital expenditures as a
component of the composite cost causation allocator for the purpose of allocating corporate
services costs to EDTI and EEAI.
6.2.2.4 Should some corporate services costs be allocated to EUI itself for its
management of its investment in CPC, or for its management of the funds
remaining from its partial sale of CPC?
441. The question of whether or not the corporate services costs are allocated correctly also
includes the question as to whether a portion of the costs should be allocated to EUI itself. In
addressing this question, the parties discussed several issues including: (i) the costs to manage
the investment in CPC, (ii) the costs to manage the other assets held by EUI including any funds
related to the sell down of its interest in CPC and (iii) the revenues related to these assets.
442. In its submissions, EDTI put forward the position that the costs related to managing the
investment in CPC and other assets outside of EPCOR‟s operating businesses were allocated to
EDTI and EEAI as part of the corporate services costs allocation process. EDTI further indicated
that it is reasonable for customers of EDTI and EEAI to pay a portion of these costs as they are
minimal248 and utility customers will benefit from the economies of scale that are captured once
the assets are converted to investments in active businesses.
443. The Commission explored the benefits to the utilities of non-controlled investments249 in
AUC-EDTI-31:250
Please confirm whether the investment income from CPC and other investments held by
EUI benefits customers of the regulated companies. If there is a benefit to customers,
please fully explain.
In its response EDTI explained:
The investment income from CPC and other investments held by EUI do not directly
benefit customers of the regulated companies in the sense that there is no revenue offset
from that investment income reducing the revenue requirement otherwise recoverable
248
Costs to manage CPC estimated at $.07 million; Exhibit 148.02, AUC-EDTI-13, page 62. 249
Non-controlled investment is an investment where EUI does not have a controlling interest. 250
Exhibit 167.02, AUC-EDTI-31, page 55.

2012 Phase I and II Distribution Tariff 2012 Transmission Facility Owner Tariff EPCOR Distribution & Transmission Inc.
96 • AUC Decision 2012-272 (October 5, 2012)
from regulated customers. The fact that EUI holds investments in EDTI and other utility
businesses, however, provides significant benefits to customers of the regulated
companies in the form of economies of scale. PA Consulting conservatively estimated
that if EDTI were not part of the EUI group of companies, but instead operated on a
standalone basis, costs to be recovered from its regulated customers in 2012 would be
$6.29 million higher (see Exhibit 81, Appendix G-5, section 5).
444. Both the UCA and the CCA recommended that costs related to investment management
be excluded from the revenue requirement of the utilities because the costs are not required for
the provision of utility service. Further, the CCA submitted that no mechanism exists to capture
any future benefit to utility customers.251
Commission findings
445. The Commission finds that it is unreasonable for EDTI and EEAI to bear a portion of the
costs of managing the investments of EUI because they are not costs for the provision of utility
service. Further, the Commission does not consider that EDTI and EEAI should bear a portion of
the cost of activities related to possible future investments on the basis of a possible future
benefit from increased economies of scale. For these reasons, in addition to the directions above
that identify the removal of specific costs, the Commission finds that a portion of the EUI
corporate services costs that, in the Commission‟s view, are not required for the provision of
utility service should be removed from the costs allocated to EDTI and EEAI.
446. Accordingly, the Commission finds that, for the purposes of allocating costs to EDTI and
EEAI, the composite cost causation allocator should be calculated recognizing EUI‟s investment
in CPC or any other investments held by EUI. The Commission directs EDTI to include the
revenues (including equity income), assets and headcount associated with EUI‟s investment in
CPC and any other assets held by EUI, in the calculation of the composite cost causation
allocator.
6.2.2.5 Has EUI acquired any new businesses to which it should allocate some of its
corporate services costs?
447. EDTI identified two transactions in which EUI acquired new businesses to which it is
allocating a portion of the corporate services costs in 2012. EDTI describes the transaction as
follows:252
On May 31, 2011, EPCOR acquired 100% of the common shares of Chaparral City
Water Company (“Chaparral”) from American States Water Company with control of the
operations commencing June 1, 2011. Chaparral is a public utility company, regulated by
the Arizona Corporation Commission, engaged principally in the purchase, production,
distribution and sale of water to approximately 13,000 customers in the Town of Fountain
Hills, Arizona and a small area within Scottsdale, Arizona.
and
In January 2011, EPCOR entered into an agreement to acquire 100% of the stock of
Arizona Water and New Mexico Water, both wholly-owned subsidiaries of American
251
Exhibit 207.01, CCA argument, paragraph 150. 252
Exhibit 3, application, paragraphs 2076 and 2077.

2012 Phase I and II Distribution Tariff 2012 Transmission Facility Owner Tariff EPCOR Distribution & Transmission Inc.
AUC Decision 2012-272 (October 5, 2012) • 97
Water Works Company, Inc. The transaction is subject to regulatory approval in both
states. Arizona Water is a utility regulated by the Arizona Corporation Commission that
provides water service to approximately 106,000 customers and wastewater services to
approximately 51,000 customers primarily located in the Phoenix area. New Mexico
Water is a utility regulated by the New Mexico Public Regulation Commission that
provides water and wastewater services to the city of Clovis in eastern New Mexico, and
in the greater Edgewood area near Albuquerque, New Mexico, serving more than 17,000
customers. The transaction is expected to be completed near the end of the first quarter of
2012.
448. EDTI submitted that the U.S. Water implementation team made an assessment of whether
or not the US water operations would be provided services by the EUI corporate services
departments.253 This determination resulted in the introduction of changes to the composite cost
causation allocator by incorporating the concept of a Canadian only calculation. Those corporate
services that will not be required by or provided to the U.S. Water Utilities will continue to be
allocated to the Canadian members of the EPCOR group using allocation methods that reflect
Canadian operations only. This is accomplished by the use of a Canadian composite cost
causation allocator as calculated in Table 10.1.5-3.
449. Of the EUI corporate services that were allocated using the composite cost causation
allocator, eight of the 18 services representing 28.5 per cent of the total costs were not allocated
to the U.S. Water operation. The table below indicates the services for which costs were
determined to be required by the U.S. Water operations and the amounts allocated:
253
Exhibit 3, application, paragraph 2080.

2012 Phase I and II Distribution Tariff 2012 Transmission Facility Owner Tariff EPCOR Distribution & Transmission Inc.
98 • AUC Decision 2012-272 (October 5, 2012)
Table 44. 2012 U.S. water corporate services costs allocated by the composite cost causation allocator ($ millions)
2012 forecast corporate services costs Allocation EUI total
U.S. Water
SCM administration Self-provided locally in the U.S. 1.55 0.00
Real estate Self-provided locally in the U.S. 0.54 0.00
SCM corporate services Yes 8.19 0.62
Taxation Self-provided locally in the U.S. 0.83 0.00
Corporate accounting Yes 0.91 0.07
Consolidated reporting & analysis Yes 1.37 0.10
Financial management training program Applies only in Canada 0.51 0.00
Audit fees Yes 0.96 0.07
Executives & executive assistant costs Yes 2.70 0.21
Board costs Self-provided locally in the U.S. 2.04 0.00
Government relations Self-provided locally in the U.S. 0.76 0.00
Public consultation Self-provided locally in the U.S. 0.16 0.00
EPCOR community essentials council Yes 0.77 0.06
Legal services Self-provided locally in the U.S. 2.88 0.00
Risk, assurance and advisory services Yes 2.34 0.18
Business transformation Yes 0.75 0.06
Strategic planning Yes 1.70 0.13
Regulatory affairs Yes 2.83 0.22
Total composite cost causation allocator 31.79 1.5
100% 4.7%
Source: Application Table 10.1.10-1 and Table 10.3-2
Commission findings
450. The Commission has considered the submissions related to the incorporation of the
U.S. Water operation and finds EDTI has not adequately demonstrated that the governance
related costs allocated by the composite cost causation allocator should not be allocated to the
U.S. Water operation. The assertion that the governance related services will not be used is
unsupported. The three components of the corporate costs assignment include direct assignment,
fees for asset usage and cost allocation. Within cost allocation, there are functional allocations
and allocations for which a causative factor could not be identified that are allocated using a
composite allocator. Specifically, the costs allocated using the composite cost causation allocator
can not be directly assigned or allocated using a functional allocator and, as such, are remote
from the business. It is likely that any one of the group of companies could make an argument
that it did not benefit directly from certain of the governance cost groups. For the purpose of
allocating costs to EDTI and EEAI, the Commission directs EDTI to abandon the Canadian
composite cost causation allocator.
6.2.3 Would it be less expensive for EDTI and EEAI to provide the corporate services
or seek a different third-party provider on a stand-alone basis?
451. In addressing the third question of whether it would be less expensive for EDTI and
EEAI to seek an alternate provider or provide the services themselves, EPCOR relies heavily on
the PA Report. The PA Report provided a service-by-service analysis of the potential cost to

2012 Phase I and II Distribution Tariff 2012 Transmission Facility Owner Tariff EPCOR Distribution & Transmission Inc.
AUC Decision 2012-272 (October 5, 2012) • 99
each of the utilities if it were to establish the capability to provide the necessary services
internally, or where possible, find a third party provider.
452. With respect to the utilities establishing the capacity to provide the necessary services
internally, PA made a number of assumptions including:254
…we assumed that for the self-provision alternatives, the facility costs would be the same
as would be allocated to EDTI by EUI.
…labour rates, non-labour cost, and IT support costs will be the same, as both business
units will hire from the same labour markets for the same skills and use labour volumes
that are equal to or higher than those represented by the allocations from EUI.
..we assumed that for the self-provision alternatives, information services and contractor
costs will be the same as the status quo cost.
453. With respect to the utilities establishing an alternate third party to provide the necessary
services, PA made a number of limiting assumptions or statements including:255
…there was a significant relationship aspect to the service which could not be
realistically accommodated through a third party provider.
…economic and practical realities of outsourcing a small volume of services and the
costs to manage a small contract.
…we have identified certain EUI provided services that would not be prudent to source
from third parties.
…we have considered the range of likely commercial arrangements for each service,
based on our experience and EPCOR‟s experience.
Commission findings
454. The Commission finds the PA Report addresses the question of self provisioning and
outsourcing to a third party in a very limited and restrictive way. Each service is evaluated in the
context of each of the utilities providing the services in the same manner as EUI and generally
requiring the same resources. Additionally, the PA Report does not address the possibility that
the utilities could themselves achieve economies of scale by sharing resources focused only on
the utility businesses.
455. The assumptions made by PA quoted above make it highly unlikely that the self-
provisioning option would be found to be less costly. Similarly, the limiting assumptions with
respect to the third party provisioning resulted in PA not exploring in any detail the costs
associated with third party outsourcing, either at the EUI cost pool level or at the individual
utility level for services that it considered not prudent to source from third parties.
456. For the remaining services that PA considered could potentially be sourced from third
parties, the analysis was not transparent and market price cost estimates were based on
254
Exhibit 148.02, AUC-EDTI-15. 255
Exhibit 81.0, Appendix G-5, pages 22-23.

2012 Phase I and II Distribution Tariff 2012 Transmission Facility Owner Tariff EPCOR Distribution & Transmission Inc.
100 • AUC Decision 2012-272 (October 5, 2012)
commercial information gathered from a variety of sources, including recent EPCOR
commercial sourcing activities, existing contract pricing data, and PA market intelligence.256
457. The Commission finds that the submissions made during the proceeding provide
insufficient information to assess whether it would be less expensive for EDTI and EEAI to
provide the same corporate services or seek a different third-party provider on a stand-alone
basis and therefore makes no finding in addressing this question.
7 Other issues
7.1 Phase II cost of service study
7.1.1 Distribution access service cost of service study and rates
458. In its application, EDTI stated that it was requesting approval of its rates for both
distribution access service (DAS) and system access service (SAS). EDTI provided its applied-
for DAS and SAS rates in Schedule DT-A-1257 and Schedule DT-A-2,258 respectively.
459. EDTI also stated that it had not completed a new DAS cost of service study and proposed
to rely on its 2010-2011 DAS cost of service study for the purposes of determining its 2012 DAS
rates. EDTI proposed to calculate its 2012 DAS rates by escalating each rate component of its
2011 DAS rates by a common percentage that, using the 2012 forecast billing determinants,
would recover EDTI‟s 2012 DAS revenue requirement. This approach would result in each
component of each of EDTI‟s 2011 DAS rates being escalated by a factor of 8.6 per cent. In the
application, EDTI noted that its 2011 DAS rates were part of a refiling application currently
before the Commission and thus, at the time the application was submitted, the final 2011 DAS
rates had not yet been approved by the Commission.
460. In its argument, the University expressed concern that EDTI did not provide a full cost
allocation study to support its 2012 distribution rates or a firm commitment on the timing of the
next study. The University stated that, based on EDTI‟s response to UofA-EDTI-01, it appeared
that at least one-third of the requested increase had nothing to do with customers on a customer
specific (CS) rate schedule and that the University considered it unfair to apply the same
percentage increase to all rate classes when some rate classes contribute more than others to the
causes of the increase. The University also stated that EDTI‟s 2012 DAS rates become the
starting point for performance based regulation rates and that the inequity within the 2012 rates
will only compound throughout the five-year PBR period. The University submitted that EDTI
should complete a full cost allocation study either before PBR rates are implemented or very
early in the PBR term.
461. In response to the University‟s submissions, EDTI stated that a cost allocation study
requires considerable time, effort and cost to complete and that, other than the forecast billing
determinants, EDTI considered it highly unlikely that there would be any material changes to the
DAS cost of service study reflected in its 2010-2011 Phase II application. In regards to the
University‟s position that EDTI complete a cost of service study either before PBR rates are
implemented or very early in the PBR term, EDTI stated that the issue of if and when it should
256
Exhibit 81.0, Appendix G-5, page 23. 257
Exhibit 11. 258
Exhibit 12.

2012 Phase I and II Distribution Tariff 2012 Transmission Facility Owner Tariff EPCOR Distribution & Transmission Inc.
AUC Decision 2012-272 (October 5, 2012) • 101
file a Phase II application during the PBR period is irrelevant to this application and should have
been raised by the University in the PBR proceeding.
462. EDTI also noted that the results of its planned geographic information system (GIS)
based rate review should be available in the second quarter of 2014.
Commission findings
463. EDTI stated that, at the time of the filing of the application, its 2011 DAS rates were part
of a refiling application that was before the Commission and had yet to be approved. EDTI‟s
2011 DAS rates were approved in Decision 2011-490.259
464. In EDTI‟s 2010-2011 Phase II distribution tariff application (Application No. 1606833,
Proceeding ID No. 980), EDTI stated that it was working towards completing its Geographical
Information System (GIS) Lifecycle Replacement Project that would allow EDTI to model the
physical flow of electricity between electrical elements (e.g. switches, transformers and meters).
EDTI stated that its next cost of service study would be based on the new GIS and EDTI
considered it likely that rate class allocations resulting from the GIS based cost of service would
be different than the current rate class cost allocations from the 2010-2011 cost of service
study.260
465. The Commission notes EDTI‟s submission that a full Phase II cost of service study takes
considerable time and cost to complete. The Commission also notes EDTI‟s submission that it
considered it highly unlikely that a new cost of service study, prior to the ability to use the data
from the GIS study, would result in any material changes to rate class cost allocations than were
already reflected in the cost of service study filed as part of EDTI‟s its 2010-2011 Phase II
application.
466. The Commission has considered the arguments put forward and does not consider it to be
prudent for EDTI to complete a cost of service study at this time given:
the time and expense required for EDTI to complete a new cost of service study
EDTI did not expect material changes in cost allocations from a new cost of service study
EDTI expected that the results of its planned GIS-based rate review should be available
in the second quarter of 2014
EDTI expected the rate class cost allocations resulting from the GIS-based cost of service
study to be different than the cost allocations based on its 2010-2011 study
467. Accordingly, the Commission will not require EDTI to complete a cost of service study
prior to the results of the GIS-based review being available and accepts EDTI‟s method of
escalating each component of its 2011 DAS rates by a common percentage for the purpose of the
compliance filing.
468. However, with respect to the issue of the completion of a cost of service study during
EDTI‟s PBR term, the Commission stated the following in Decision 2012-237 in respect of the
Rate Regulation Initiative:
259
Decision 2011-490: EPCOR Distribution & Transmission Inc. 2010-2011 Phase II Distribution Tariff Refiling,
Application No. 1607746, Proceeding ID No. 1484, December 14, 2011, paragraph 42. 260
Exhibit 3, Proceeding ID No. 980, paragraphs 12 and 13.

2012 Phase I and II Distribution Tariff 2012 Transmission Facility Owner Tariff EPCOR Distribution & Transmission Inc.
102 • AUC Decision 2012-272 (October 5, 2012)
The Commission considers that PBR is unrelated to the requirement to periodically
update rates through a Phase II process. However, during the PBR term the companies
may file applications for Phase II adjustment to their rate design and cost allocation
methodologies and the Commission will make a determination at the time as to whether
the adjustments are warranted. For purposes of a cost of service study, the companies
shall use the revenue requirement resulting from going-in rates adjusted by the PBR
formula (including the I-X mechanism, K factors, Y factors and Z factors) and the latest
updated billing determinants.
469. The Commission notes that EDTI stated that the results of its planned GIS-based rate
review should be available in the second quarter of 2014. If EDTI determines that the changes in
cost allocation as a result of the implementation of the GIS-based rate review are significant and
files a Phase II application, the Commission will assess the merits of such an application at the
time EDTI files such an application.
7.2 Billing determinants forecast – transmission and distribution
470. EDTI retained Mr. Dana Oikawa to prepare the billing determinants forecast in the
application. In previous applications, EDTI retained Dr. Ernie Stokes, of Stokes Economic
Consulting, to prepare the billing determinants forecast. EDTI stated that Mr. Oikawa has
worked with Dr. Stokes for eight years and used the same methodology to forecast the billing
determinants in this application as Dr. Stokes has used in the past.
471. Mr. Oikawa focused on four areas: energy consumption, number of customers, on-peak
energy and billing demand. Mr. Oikawa provided details of the methodology that he utilized to
develop the billing determinants forecast in Appendix G-6 of the application, including tables
summarizing the billing determinants by rate class. From the data provided by Mr. Oikawa in
Appendix G-6, the Commission has summarized the total number of customers and energy
consumption for 2010 and 2011 in the following table. The comparison of actual to decision
amounts allows for an assessment of the historical reliability of the methodology.
Table 45. Number of customers and energy forecast – forecast accuracy table
2010
actual 2010
decision
Variance (# of
cust. or GWh)
Variance (%)
2011 actual
2011 decision
Variance (# of
cust. or GWh)
Variance (%)
Customers - average 337,885 336,487 (1,398) -0.4% 343,395 341,021 (2,374) -0.7%
Energy sales (GWh) 7,308.8 7,215.0 (93.8) -1.3% 7,393.8 7,304.5 (89.3) -1.2%
472. The following table examines the growth trend in customers and energy sales from 2009
to 2010 and from 2010 to 2011. The forecast growth rate for customers from 2011 to 2012 is
consistent with the actual growth rate from 2009 to 2011. The forecast growth rate for energy
sales for 2011 to 2012 is slightly higher than that experienced from 2009 to 2011. The increase
reflects in part a change in customer mix as shown in Table 47 and Table 48, below.

2012 Phase I and II Distribution Tariff 2012 Transmission Facility Owner Tariff EPCOR Distribution & Transmission Inc.
AUC Decision 2012-272 (October 5, 2012) • 103
Table 46. Number of customers and energy – trend table
2009
actual 2010
actual Growth
(%) 2010
actual 2011
actual Growth
(%) 2011
actual 2012
forecast Growth
(%)
Customers - Average 332,584 337,885 1.6% 337,885 343,395 1.6% 343,395 349,290 1.7%
Energy Sales (GWh) 7,131.6 7,308.8 2.5% 7,308.8 7,393.8 1.2% 7,393.8 7,696.2 4.1%
Table 47. Number of customers – trend table
2009
actual 2010
actual
Growth (# of cust.
or GWh) Growth
(%) 2010
actual 2011
actual
Growth (# of cust.
or GWh) Growth
(%) 2011
actual 2012
forecast
Growth (# of cust.
or GWh) Growth
(%)
Residential, small/medium commercial 328,905 334,213 5,308 1.6% 334,213 339,751 5,538 1.7% 339,751 345,617 5,866 1.7%
Large commercial & industrial (Note 1) 1,813 1,847 34 1.9% 1,847 1,856 8 0.5% 1,856 1,907 51 2.8%
Lighting (Note 2) 1,866 1,825 (41) -2.2% 1,825 1,789 (36) -2.0% 1,789 1,766 (23) -1.3%
Total # of customers 332,584 337,885 5,301 1.6% 337,885 343,395 5,510 1.6% 343,395 349,290 5,895 1.7%
Note 1 – The following rate classes have been included in this grouping: Customer Specific, Customer Specific – totalized, Time of Use, Time of use Primary and Direct Connect. Note 2 – The following rate classes have been included in this grouping: Street Lighting, Lane Lighting, Traffic Lighting and Security Lighting.
Table 48. Energy sales – trend table
2009
actual 2010
actual
Growth (# of cust.
or GWh) Growth
(%) 2010
actual 2011
actual
Growth (# of cust.
or GWh) Growth
(%) 2011
actual 2012
forecast
Growth (# of cust.
or GWh) Growth
(%)
Residential, small/medium commercial 3,275 3,361 86 2.6% 3,361 3,408 47 1.4% 3,408 3,501 92 2.7%
Large commercial & industrial (Note 1) 3,774 3,864 91 2.4% 3.864 3,901 37 0.9% 3,901 4,111 210 5.4%
Lighting (Note 2) 83 83 0 0.5% 83 84 1 1.4% 84 84 0 0.2%
Total # of customers 7,132 7,309 177 2.5% 7,309 7,394 85 1.2% 7,394 7,696 302 4.1%
Note 1 – The following rate classes have been included in this grouping: Customer Specific, CustomerSspecific – totalized, Time of Use, Time of use Primary and Direct Connect. Note 2 – The following rate classes have been included in this grouping: Street Lighting, Lane Lighting, Traffic Lighting and Security Lighting.
473. Tables 47 and 48 above show that the large commercial and industrial rate classes have
only contributed to 0.9 per cent (51 / 5,895) of the total increase in the number of customers from
2011 to 2012 but have contributed to 69 per cent (210 GWh / 302 GWh) of the total increase in
energy sales.
474. Interveners did not directly address EDTI‟s billing determinant forecast methodology in
either argument or reply argument. However, in its argument, the CCA stated that EDTI should
be directed to update its 2012 forecast customer numbers based on 2011 actual customer counts.

2012 Phase I and II Distribution Tariff 2012 Transmission Facility Owner Tariff EPCOR Distribution & Transmission Inc.
104 • AUC Decision 2012-272 (October 5, 2012)
475. While EDTI did not directly address the CCA‟s recommendation respecting use of the
2011 actual customer counts in its reply argument, EDTI did generally address the CCA‟s
recommendations respecting updating the 2012 revenue requirement to reflect 2011 actuals.
EDTI stated that updating its 2012 forecast with 2011 actual information as requested by the
CCA would be inappropriate and would be inconsistent with the Commission‟s previous
determinations respecting similar requests by the CCA in the past.
Commission findings
476. The Commission has reviewed the report developed by Mr. Oikawa and considers the
methodology utilized by Mr. Oikawa and the forecast billing determinants by rate class for 2012
to be reasonable. The Commission has noted in the tables above that the growth in 2012 forecast
energy sales is higher than the growth in the 2012 forecast number of customers, as compared to
2011 actuals. However, the Commission is satisfied that this higher growth in energy sales is due
to an increase in the number of customers in the large commercial and industrial rate classes
relative to previous years.
477. The Commission approves the forecast billing determinants by rate class as filed by
EDTI.
7.3 Inclusion of volume variances in the TCDA
478. EDTI‟s transmission charge deferral account (TCDA) tracks variances in forecast to
actual transmission charges from the AESO and Fortis to EDTI that are caused by variances in
forecast to actual transmission access rates. Balances in this account are periodically trued-up
through the use of TCDA rate riders approved by the Commission.
479. In its 2010-2011 Phase II distribution tariff application, EDTI requested that its TCDA
include forecast-to-actual variances related to both price and volume. In Decision 2011-375,261
the Commission denied EDTI‟s request, as further discussed in this section. In the current
application, EDTI proposed again that the TCDA include forecast to actual variances related to
volume as well as price commencing in the 2012 test period.
480. In support of its request, EDTI restated the reasons provided in the 2010-2011 Phase II
distribution tariff application. Specifically, EDTI pointed to the fact that in Decision 2010-309,262
the Commission approved Fortis‟s request to include variances related to both price and volume
in Fortis‟s AESO charges deferral account (ACDA).263 EDTI restated that because its
circumstances are similar to those of Fortis, and given the approval of the change in Fortis‟s
ACDA, the Commission should extend a similar treatment to EDTI‟s TCDA.264
481. As well, EDTI indicated that in its PBR application, ATCO Electric proposed to include
volume variances in its SAS deferral account (the equivalent of EDTI‟s TCDA). Accordingly,
EDTI observed that all three companies (Fortis, ATCO Electric and EDTI) have a consistent
261
Decision 2011-375: EPCOR Distribution & Transmission Inc. 2010-2011 Phase II Distribution Tariff
Application, Application No. 1606833, Proceeding ID No. 980, September 15, 2011. 262
Decision 2010-309: FortisAlberta Inc. 2010-2011 Distribution Tariff – Phase I, Application No. 1605170,
Proceeding ID. 212, July 6, 2010. 263
Decision 2010-309, paragraphs 340-344. 264
Exhibit 3, application, paragraphs 3065-3066.

2012 Phase I and II Distribution Tariff 2012 Transmission Facility Owner Tariff EPCOR Distribution & Transmission Inc.
AUC Decision 2012-272 (October 5, 2012) • 105
view that their transmission charge deferral accounts must include variances due to volume as
well as price.265
482. In the 2010-2011 Phase II application, EDTI noted that it has seen large dollar variances
over the years related to volume variances. In this application, EDTI updated this information
with 2010 actual amounts and the 2011 year-to-date (YTD) updated forecast.
Table 49. Volume-related variances 2007-2011 ($ millions)266
2007 2008 2009 2010 2011 YTD August
SAS revenue collected 71.39 68.78 32.1 71.64 89.96
SAS expenses incurred 71.91 68.52 31.74 72.59 91.34
Net SAS revenue (expense) (0.52) 0.26 0.36 (0.95) (1.38)
483. In response to the Commission‟s information requests, EDTI provided a breakdown of
the 2010 and 2011 volume-related deficit amounts of ($0.95) million and ($1.38) million,
respectively, by AESO tariff component. EDTI indicated that the largest contributors to the
volume variances were the AESO demand charges (Bulk System-Coincident Peak and Local
System-Billing Demand) and operating reserve charges.267
484. Furthermore, EDTI explained that these deficit amounts cannot be broken down by
customer class, since the AESO and Fortis invoices are broken down by point of delivery (POD)
rather than customer class. Accordingly, EDTI indicated that because rate class volume variances
may be random rather than systematic, the company could not provide any information as to
which customer classes contribute to volume-related variances and if some customer classes
contribute to these variances more than others.268
485. In addition, EDTI noted that it cannot design its system access service rates to more
closely match the AESO‟s rates and charges:
EDTI uses its best efforts to design its SAS rates, having regard to the types of meters
and billing determinants of its customers. The types of meters used by the vast majority
of EDTI‟s customers preclude it from designing its system access service rates to more
closely match those employed by the AESO. While the AESO can base its rate design on
a complete set of 15-minute demand readings for each of its load centers, this is not the
case for EDTI. Indeed, customers representing 36 percent of EDTI‟s 2011 energy volume
were on cumulative meters which provide no demand data at all. Customers representing
an additional 10 percent of EDTI‟s energy volume were on demand meters that record
their highest demand over a given period but say nothing about when that peak was
recorded. Lastly, one percent of EDTI‟s energy volume was completely unmetered and
was billed based on estimated volumes.269
265
Exhibit 3, application, paragraphs 3073-3074. 266
Exhibit 3, application, Table 11.2.6.2.2-1, page 986. 267
Exhibit 167.02, AUC-EDTI-50(a), Table AUC-EDTI-50-2 and Exhibit 186.02, AUC-EDTI-65(a). 268
Exhibit 167.02, AUC-EDTI-50(c). 269
Exhibit 167.02, AUC-EDTI-51(a).
2012 Phase I and II Distribution Tariff 2012 Transmission Facility Owner Tariff EPCOR Distribution & Transmission Inc.
106 • AUC Decision 2012-272 (October 5, 2012)
486. With the absence of detailed demand data for customers representing almost half of the
total 2011 energy volume, EDTI indicated that it bases its rate design on those measures of
customer volumes that are available. Moreover, EDTI stated that the absence of time-of-use data
for such a large block of customers represents a substantial gap in its understanding of the
contribution of each class of customers to the historical demands recorded at each point of
distribution (POD). This represents a substantial impediment to any effort to produce an
accurate, bottom-up forecast for each POD.270
487. EDTI explained that the company allocates the AESO‟s demand-related charges to
customers with limited or no detailed demand data (i.e. residential, small commercial, medium
commercial and the four lighting rate classes) based on the load settlement data or deemed load
shapes. In these circumstances, EDTI submitted that, while it would be possible to develop a
bottom-up forecast for each POD using load shapes for each of the rate classes without demand
data, such an approach would greatly expand the effort required to produce the POD forecast.271
488. In contrast, because actual metered and billing demand data is available on which to base
the demand forecasts for each POD, EDTI‟s preference was to continue using the current
approach to forecasting the AESO demand-related charges on a POD level, not customer level.
EDTI explained that it forecasts the monthly peak demands and the Alberta Interconnected
Electric System (AIES) coincident peaks for each individual POD based on its historical load
factors. The required load factor projections are constructed by using the corresponding load
factor from the same month in the previous year.272
489. Based on the above, EDTI submitted that the historical variances to date demonstrate the
fact that the company cannot reasonably forecast transmission volumes. As such, EDTI argued
that no reasonable efficiencies can be gained by forcing the company to accept the risk on
volume variances. In EDTI‟s view, the imposition of such risk “may simply lead to cost and
efforts at refining forecasting methods with no appreciable results.”273
490. The CCA noted that EDTI‟s request to revisit this matter appeared to have been based on
Decision 2010-309 that allowed Fortis to include volume variance in its ACDA. The CCA also
expressed its view that many of the issues related to volume variance raised by EDTI in the
current proceeding relied on the similar positions advanced by Fortis to warrant approval of
inclusion of volume variances. In that regard, the CCA pointed out that in a more recent
Decision 2012-108,274 dealing with Fortis‟s negotiated settlement agreement in respect of its
2012 Phase I application, the Commission discontinued the volume variance reconciliation in
Fortis‟s ACDA. Accordingly, based on the earlier rejection of EDTI‟s proposed inclusion of
volume variances in Decision 2011-375 and the rejection of volume variance treatment for Fortis
in Decision 2012-108, the CCA submitted that EDTI‟s proposal to revisit this matter in the
context of the current proceeding should be denied.275
270
Exhibit 167.02, AUC-EDTI-51(a). 271
Exhibit 186.02, AUC-EDTI-66(c). 272
Exhibit 186.02, AUC-EDTI-66(a)-(c). 273
Exhibit 108.02, EDTI argument, paragraph 323. 274
Decision 2012-108: FortisAlberta Inc. Application for Approval of a Negotiated Settlement Agreement in
respect of 2012 Phase I Distribution Tariff Application, Application No. 1607159, Proceeding ID No. 1147,
April 18, 2012. 275
Exhibit 191, CCA evidence, pages 27-28 and Exhibit 210, CCA reply argument, paragraphs 16-17.

2012 Phase I and II Distribution Tariff 2012 Transmission Facility Owner Tariff EPCOR Distribution & Transmission Inc.
AUC Decision 2012-272 (October 5, 2012) • 107
Commission findings
491. As observed by the CCA, EDTI‟s original reason for requesting that its TCDA include
variances related to both price and volume was based on the fact that Decision 2010-309 allowed
Fortis to reconcile forecast to actual variances related to volume as well as price in its ACDA.276
However, more recently in Decision 2012-108, the Commission directed Fortis to exclude
variances related to volume from its ACDA.277 As such, the Commission observes that, currently,
true-up differences in the transmission access charge deferral accounts of all electric distribution
companies relate to price only.
492. In support of its proposal, EDTI also relied on ATCO Electric‟s proposal to include
volume variances in its SAS deferral account as part of its PBR application. However, as the
Commission explained in Decision 2012-237,278 the considerations regarding the inclusion of
volume variances under PBR are not the same as under cost of service regulation, because of the
differences in incentives and overall regulatory framework between the two regulatory
regimes.279 In these circumstances, the Commission approved the inclusion of volume variance in
the transmission flow-through accounts of the electric distribution companies (including EDTI)
for the purposes of their PBR plans. The Commission also restated its commitment to regulating
the utilities on a consistent basis with regards to this issue.280
493. EDTI‟s current application is a cost of service application. As such, the Commission
considers that the same reasoning for denying EDTI‟s earlier request to include volume
variances in its TCDA in the 2010-2011 Phase II application, as well as discontinuing volume
variances in Fortis‟s ACDA, applies in this circumstance as well.
494. In Decision 2011-375, the Commission noted EDTI‟s submission that the company‟s
limited ability to undertake seasonal switching of loads and the specifics of the current structure
of the AESO system access rates affected its control over transmission volumes.281 However, in
Decision 2011-375, EDTI‟s request to include volume variance in its transmission charge
deferral account was rejected for two reasons: (i) EDTI has been able to reasonably forecast
transmission volumes, as evidenced by the relatively small volume-related variances in recent
years and (ii) continuation of the price-only deferral account can result in regulatory efficiencies
arising from the more rigorous forecasting of billing determinants.
495. In this proceeding, EDTI indicated that the variances related to volume have been
growing in recent years, as shown in Table 49 above, and are no longer insignificant.
Accordingly, much of the discussion in this proceeding centered on EDTI‟s ability to accurately
forecast its transmission volumes.
496. EDTI indicated that the largest contributors to the volume variances were the AESO
demand charges and operating reserve charges.282 With respect to the latter, EDTI noted that, in
its new tariff effective July 1, 2011, the AESO implemented a new method for recovering the
276
Exhibit 3, application, paragraphs 3063-3066. 277
Decision 2012-108, paragraph 123. 278
Decision 2012-237: Rate Regulation Initiative Distribution Performance-Based Regulation, Application No.
1606029, Proceeding ID No. 566, September 12, 2012. 279
Decision 2012-237, paragraphs 663-664. 280
Decision 2012-237, paragraphs 666-667. 281
Decision 2011-375, paragraph 188. 282
Exhibit 167.02, AUC-EDTI-50(a), Table AUC-EDTI-50-2 and Exhibit 186.02, AUC-EDTI-65(a).

2012 Phase I and II Distribution Tariff 2012 Transmission Facility Owner Tariff EPCOR Distribution & Transmission Inc.
108 • AUC Decision 2012-272 (October 5, 2012)
operating reserve charges from market participants.283 Given this change, EDTI advised that it
did not expect that operating reserve charges will continue to contribute to its volume variance.284
497. With respect to the volume variance arising from the AESO demand charges, the
Commission accepts EDTI‟s evidence that, since 2004, there have been changes to the AESO
rate structure, with the AESO tariff becoming more heavily oriented towards demand-related
charges than energy-related charges.285 This change necessitates that more effort be put in the
forecasting of transmission billing determinants related to demand (i.e. Bulk System-Coincident
Peak and Local System-Billing Demand), as demonstrated by the fact that these types of AESO
charges contribute significantly to EDTI‟s volume variances.
498. The Commission observes that EDTI currently employs a detailed, bottom-up approach
to forecast its transmission energy volumes. For example, EDTI explained that the “POD energy
forecast is developed so that the sum of the projected energy consumption for the substations,
Direct Connect customers, and Annex tie-points for each month is constrained to equal the
monthly forecast of total rate-class energy plus distribution line losses.”286 However, with respect
to forecasting transmission volumes related to demand, EDTI currently employs a “far simpler
approach,” under which the monthly peak demands and the AIES coincident peaks for each
individual POD are forecast based on their historical load factors.287 When asked by the
Commission whether a more detailed bottom-up forecasting method can be applied to project
demand volumes, EDTI explained that due to a number of factors (the main ones being the
absence of detailed demand data for customers representing almost half of EDTI‟s total energy
volume and the absence of a readily available source for a set of economic/demographic drivers
in the PODs service areas within EDTI‟s system),288 such a method would “greatly expand the
effort required to produce the POD forecast.”289
499. In the absence of a cost-benefit analysis on the merits and disadvantages of a more
detailed approach to forecasting EDTI‟s transmission volumes related to demand, the
Commission considers that the question of whether EDTI is able to come up with a more
accurate forecast of its transmission volumes remains open.
500. In this regard, the Commission does not share EDTI‟s view that refining transmission
volume forecasts simply leads to cost and efforts “with no appreciable results.”290 As the
Commission explained in Decision 2012-108, under a cost of service regime, the distribution
revenue requirement established in Phase I applications is divided by the forecast billing
determinants for the test period to design customer rates.291 In addition, EDTI agreed that forecast
billing determinants and distribution revenue requirement may both be partially driven by the
same underlying drivers (such as customer growth, load forecast, etc.), although there is no
strong correlation between the two. Furthermore, under the current regulatory framework,
electric distribution utilities accept the risk related to the difference between the forecast and
283
The AESO‟s operating reserve charges are further discussed in Section 7.4.2 below. 284
Exhibit 186.02, AUC-EDTI-65(b). 285
Exhibit 3, application, paragraph 3071. 286
Exhibit 186.02, AUC-EDTI-66(a). 287
Exhibit 186.02, AUC-EDTI-66(a) and (c). 288
Exhibit 167.02, AUC-EDTI-51(a) and AUC-EDTI-52(b). 289
Exhibit 186.02, AUC-EDTI-66(c). 290
Exhibit 208.02, EDTI argument, paragraph 323. 291
Decision 2012-108, paragraphs 118-119.

2012 Phase I and II Distribution Tariff 2012 Transmission Facility Owner Tariff EPCOR Distribution & Transmission Inc.
AUC Decision 2012-272 (October 5, 2012) • 109
actual billing determinants when recovering their approved distribution revenue requirement.292
As such, the accuracy of customer rates and the companies‟ ability to recover their approved
revenue requirement is highly dependent on the accuracy of the companies‟ billing determinants
forecast.
501. In these circumstances, the Commission determined in Decisions 2011-375 and
Decision 2012-108, that under a cost of service rate making regime, the absence of volume true-
up on transmission charges will provide a stronger financial incentive to the companies to
accurately forecast their billing determinants to ensure reasonable recovery of both the
distribution tariff revenue and transmission access charges.293 As such, the Commission reiterates
its findings that under cost of service rate making, regulatory efficiencies stemming from a more
rigorous billing determinants forecast outweigh the potential disadvantages of EDTI bearing risk
on transmission volumes.
502. In light of the above considerations, EDTI‟s request that its TCDA include forecast to
actual variances related to volume in the 2012 test year is denied.
7.4 2012 system access service (SAS) rates
7.4.1 EDTI’s proposed 2012 SAS rates
503. EDTI‟s SAS revenue requirement is based on charges paid by the company to the AESO
and Fortis for transmission services provided in relation to customers in EDTI‟s service area.
EDTI designs both its SAS revenue requirement calculations and the SAS rates based on a SAS
cost of service study to flow through to its customers the cost of transmission services.
504. EDTI proposed that its 2012 interim SAS rates, approved in Decision 2011-495,294 be
approved as the final SAS rates for 2012. EDTI proposed the following change to the 2012 SAS
rate schedule:
The term “the Transmission Contract Demand (TCD);” has been deleted and replaced
with the term “the Contracted Minimum Demand;” for all rate classes that are charged a
billing demand as to align with the term used in EDTI‟s DCS Terms and Conditions.295
505. EDTI noted that any differences between the revenue collected in 2012 through the SAS
rates and costs paid to the AESO will be trued up through EDTI‟s transmission charge deferral
account (TCDA).
Commission findings
506. With the exception of the University‟s concern with EDTI‟s method of forecasting and
recovering the AESO SAS operating reserve charge from customers, no party objected to EDTI‟s
proposal to approve its 2012 interim SAS rates as final SAS rates for 2012. As set out in the
following section of this decision, the Commission does not share the University‟s concerns with
EDTI‟s approach to dealing with operating reserve charges. The Commission has reviewed the
SAS rate schedules and approves EDTI‟s proposed 2012 final SAS rates as filed.
292
Exhibit 167.02, AUC-EDTI-53(a) and (b). 293
Decision 2011-375, paragraph 191 and Decision 2012-108, paragraphs 120-121. 294
Decision 2011-495 (Errata): EPCOR Distribution & Transmission Inc. Errata to Decision 2011-495, 2012
Interim System Access Service Tariff, Application No. 1607773, Proceeding ID No. 1497, December 21, 2011. 295
Exhibit 113, Appendix J-7, page 5 of 24.
2012 Phase I and II Distribution Tariff 2012 Transmission Facility Owner Tariff EPCOR Distribution & Transmission Inc.
110 • AUC Decision 2012-272 (October 5, 2012)
507. The Commission accepts EDTI‟s change from the term “the Transmission Contract
Demand (TCD)” to the term “the Contracted Minimum Demand” in the 2012 SAS rate schedule
in Appendix J-7.
7.4.2 SAS operating reserve charge
508. The operating reserve charge is a component of the AESO tariff designed to recover costs
associated with procuring reserve generating capacity (i.e. operating reserve) to ensure that
power remains available when required to match supply and demand on the electricity
transmission system.296 In accordance with Section 47 of the Transmission Regulation,
AR 86/2007, the AESO flows through the cost of operating reserves to load market participants,
including EDTI.
509. As outlined in Decision 2011-495, in its 2012 interim SAS tariff application, EDTI
explained in detail that under the AESO‟s new tariff, which took effect on July 1, 2011, the
AESO does not forecast operating reserve costs, but simply flows through these costs to market
participants. Based on an analysis of actual operating reserve charges from the AESO as a
percentage of the actual pool price for the period from July to October 2011, EDTI proposed to
use the 7.25 operating reserve percentage in its interim SAS rates to recover these costs from
customers.297 In this proceeding, EDTI expanded this analysis to include the months of
November and December, 2011. With the inclusion of these months, the average actual operating
reserve rate for EDTI was 7.53 per cent over the period from July to December, 2011.298
EDTI proposed continuing to use the 7.25 operating reserve percentage.
510. The University expressed its concerns that EDTI did not “provide any meaningful
analysis” to support the operating reserve charge component of its final 2012 SAS rates.299 In
particular, the University was concerned that EDTI‟s reply to its information request emphasized
the efficient reconciliation of deferral account balances, while there was “little time spent
understanding how and why operating reserve costs change and how to bill distribution
customers in such a way so as to mitigate large deferral account balances from the outset.”300
511. The University recommended that EDTI be directed to investigate a more efficient way
to recover operating reserve costs that allows minimizing the use of its transmission deferral
account by finding a way to better match current rates to current costs. The University submitted
that its proposed method could be one of the possible solutions.
512. The University proposed recovering operating reserve costs through a charge to
distribution customers based on a charge per megawatt hour ($/MWh) equal to the most recent
three-month rolling average of the actual total operating reserve cost ($/MWh). For example, the
average charge from January to March in any given year would become the starting point for
calculating the operating reserve charge for April. The University submitted that EDTI could
296
In its “Ancillary Services Participant Manual”, the AESO provides the following definition (page 7). Operating
reserve – is available output from a generator that can be dispatched, or load that can be reduced, to maintain
system reliability in the event of an imbalance between supply and demand on the electricity system.
http://www.aeso.ca/downloads/Ancillary_Services_Manual_Edition_2_FINAL.pdf 297
Decision 2011-495 (Errata), paragraphs 12-14. 298
The Commission staff calculations based on data in Exhibit 149.01, Table UofA-EDTI-05-1. 299
Exhibit 205, University argument, PDF page 2. 300
Exhibit 170, UofA-EDTI-6, preamble.
2012 Phase I and II Distribution Tariff 2012 Transmission Facility Owner Tariff EPCOR Distribution & Transmission Inc.
AUC Decision 2012-272 (October 5, 2012) • 111
seek the Commission‟s approval for this calculation and submit monthly filings for information
only, similar to a monthly regulated rate option gas cost recovery rate.301
513. In the University‟s view, the proposed method is preferable to EDTI‟s current approach
of setting a base operating reserve charge rate with subsequent quarterly updates in the TCDA
true-up process. Specifically, the University argued that its proposed method has the following
benefits:302
The distribution charge focuses on actual cost and disregards the pool price that does not
necessarily correlate with operating reserve cost.
The rolling average charge is refreshed frequently to reflect current costs, but is still
developed and disclosed to distribution customers on a prospective basis.
Because the average charge reflects current costs, the monthly surplus/(deficit) tends to
self correct and balance to zero over time, without the need to reconcile deferral accounts.
Even though EDTI‟s costs remain volatile, the rolling average charge is less volatile for
customers, making it easier to forecast for periods of at least one year.
Monthly filings for information are likely to result in lower regulatory cost compared to
quarterly deferral account rider applications.
The deferral account threshold as to when to reconcile deferral account balances may be
able to be increased and perhaps even eliminated.
514. EDTI did not agree that the University‟s proposed approach of recovering operating
reserve charges from the AESO was preferable to the company‟s currently used method. EDTI
explained that because operating reserve is not the sole contributor to TCDA balance
accumulation, there would continue to be a need to reconcile deferral accounts and retain the
established deferral account threshold, as other AESO rate changes impact the TCDA account.
515. With respect to volatility, EDTI submitted that its proposed rate remains constant with
quarterly updates to the TCDA true-up rate rider. In contrast, the University‟s proposal would
change on a monthly basis and still require quarterly updates to the TCDA true-up rate rider.
516. Furthermore, EDTI pointed to costs and practical difficulties associated with the
University‟s proposed approach. EDTI noted that monthly tariff changes from the use of rolling
averages would require substantive systems recoding and testing. Additionally, the fluctuating
monthly rate changes would likely cause confusion to customers other than the University,
potentially resulting in higher call volumes to customer call centres. Finally, EDTI indicated that
monthly rate changes would also add administrative burden for the company in addition to and
not in lieu of the current quarterly TCDA true-up process already designed to true-up operating
reserve charges and other AESO price related variances.303
Commission findings
517. In Decision 2011-495 dealing with EDTI‟s 2012 interim SAS tariff, the Commission
observed that EDTI‟s proposed operating reserve rate of 7.25 per cent closely tracked the
301
Exhibit 170, UofA-EDTI-6, preamble. 302
Exhibit 170, UofA-EDTI-6, preamble. 303
Exhibit 208.02, EDTI argument, paragraphs 436-437.

2012 Phase I and II Distribution Tariff 2012 Transmission Facility Owner Tariff EPCOR Distribution & Transmission Inc.
112 • AUC Decision 2012-272 (October 5, 2012)
operating reserve charges that the company had received from the AESO for the months from
July to October, 2011 and found this operating reserve percentage to be reasonable.304
518. The Commission agrees in principle with the University‟s view that, whenever possible,
it is preferable to design customer rates in such a way as to minimize the use of any deferral
account, or preferably, to dispense with a deferral account. However, as explained in the AESO‟s
information document quoted by EDTI, “the cost of operating reserves varies from hour to hour
based on the availability of reserves, the actual volumes included in dispatches, the volumes each
provider supplies to the system, the pool price, and the competitive offers for each type of
operating reserves procured from providers.”305 Therefore, the Commission agrees with EDTI
that the company cannot predict how the above factors interact and contribute to the trends in the
AESO‟s operating reserve costs for the purposes of an in-depth analysis. EDTI observed that the
AESO itself “is no longer attempting to forecast its operating reserve costs, but is simply passing
actual costs on to EDTI.”306
519. With respect to the alternative method of recovering operating reserve costs proposed by
the University, the Commission agrees with EDTI‟s view that this approach would result in an
unnecessary volatility and complexity of customer bills. Currently, EDTI‟s base SAS operating
reserve rate (e.g., the 7.25 per cent proposed in the application) remains constant with quarterly
updates to this estimate included as part of TCDA true-up rate rider.307 Under the approach
proposed by the University, both EDTI‟s base SAS rate and TCDA rider items on customer bills
would fluctuate. As EDTI explained, even if the operating reserve charges were to flow through
to customers on a monthly basis, there would still be a need for a quarterly TCDA to true-up
other AESO costs. Additionally, the Commission accepts EDTI‟s submission that the
University‟s proposal would require substantive changes to the billing system and additional
costs to the company.308
520. In light of the above, the Commission is not persuaded that the approach to recovering
operating reserve charges put forward by the University represents a better alternative to EDTI‟s
current method of setting a base operating reserve charge rate with subsequent quarterly updates.
521. In the Commission‟s view, the method of recovering operating reserve costs that EDTI
currently uses achieves the same results as the University‟s alternative approach without the
additional costs and practical difficulties associated with the University‟s proposal. As EDTI
explained, the proposed 7.25 base operating reserve percentage tracks closely to the AESO‟s
actual charges and thus captures the bulk of the operating reserve costs over the test period,
minimizing the use of TCDA. Furthermore, this operating reserve percentage forecast is further
refined on a quarterly basis through EDTI‟s quarterly TCDA rider process.
304
Decision 2011-495 (Errata), paragraph 31. 305
Exhibit 149.01, UofA-EDTI-6(a) quoted AESO Information Document No. 2011-004T.
http://www.aeso.ca/downloads/Operating_Reserve_Charge_Information_Document_2011-004T_(2011-10-
07).pdf 306
Exhibit 211.02, EDTI reply argument, paragraph 223. 307
Exhibit 208.02, EDTI argument, paragraph 436. 308
Exhibit 208.02, EDTI argument, paragraph 436.

2012 Phase I and II Distribution Tariff 2012 Transmission Facility Owner Tariff EPCOR Distribution & Transmission Inc.
AUC Decision 2012-272 (October 5, 2012) • 113
522. As outlined in Bulletin 2012-04,309 the Commission initiated a review of the electric
distribution companies‟ transmission quarterly rider mechanisms (Proceeding ID No. 1678). As
part of that review, EDTI and other distribution facility owners proposed to standardize their
respective transmission access charge rider mechanisms. The Commission considers that
Proceeding ID No. 1678 will address the types of issues identified by the University in this
proceeding.
523. In light of the above, the Commission considers that EDTI‟s methodology currently in
use to calculate the AESO operating reserve charges is reasonable. Having reviewed the updated
analysis of the average actual operating reserve rate for EDTI for the period July to December,
2011, the Commission considers that the 7.25 operating reserve percentage remains a reasonable
estimate for the purposes of EDTI‟s final 2012 SAS rates.
7.5 Maximum investment level
524. In its application, EDTI proposed to increase its maximum investment level (MIL) for
underground residential development (URD) from $1,155 to $2,487 per lot.310 EDTI submitted
that its proposed MIL increase is in conformity with the recommended methodology and
principles resulting from the working group led by Fortis to develop a common approach to
MILs, in which other utilities such as ATCO Electric and ENMAX Power Corporation
(ENMAX) participated.311
525. EDTI‟s 2012 URD MIL represents the average cost per lot (or service) for URD in its
distribution area in 2012 dollars and is based upon the average costs for the five years from 2006
to 2010. Details of the calculations used to produce the average costs per URD lot in 2012 were
provided in Appendix K-6 and Appendix K-7 of the application.
526. EDTI submitted that all of EDTI‟s rate classes will be impacted by the proposed increase
in MILs, with the percentage rate impact being 0.28 per cent, which is below the threshold of
0.5 per cent set by the working group led by Fortis.312
527. The UCA expressed concern with EDTI‟s proposal to allocate the increase in revenue
requirement across all rate classes and not just to residential customers. The revenue requirement
was not allocated to different rate classes based on cost causation principles. The UCA
considered this unfair for other rate classes, including small commercial users.313
528. In support of its position, the UCA drew upon two of the guiding principles used in
setting MILs: the consideration of the MILs of surrounding utilities and the principle of gradual
adjustment to the investment level. It stressed that Fortis, a neighbouring utility, has MILs which
are set on the basis of inflation plus 10 per cent in order to reach a target MIL. It also mentioned
ATCO Electric, for which a significant jump in MILs was approved, but noted that the increase
309
Bulletin 2012-04, Commission-initiated electric transmission quarterly rider process review, Proceeding ID
No. 1678, March 29, 2012. 310
Exhibit 168, CCA-EDTI-80. 311
Exhibit 119, Appendix K-6, page 2, paragraph 5. 312
Exhibit 151.01, EDTI rebuttal evidence, page 20. 313
Exhibit 189.02, evidence of Shelley Radway, page 35.

2012 Phase I and II Distribution Tariff 2012 Transmission Facility Owner Tariff EPCOR Distribution & Transmission Inc.
114 • AUC Decision 2012-272 (October 5, 2012)
was limited to just residential customers, unlike EDTI‟s proposal of applying it to all rate
classes.314
529. The UCA argued that a full-year impact, if allocated to residential customers only, would
be 0.64 per cent and will exceed the 0.5 per cent threshold for each rate class.315 Since the
increase is a significant amount, the UCA recommended that the increase in MILs be limited to
inflation plus 10 per cent to transition to target MILs. The UCA submitted that the full impact of
the increase in MILs should be deferred until EDTI is able to provide an updated cost of service
study (COSS), which will not be available until 2014.316
530. EDTI refuted the UCA‟s position arguing that the UCA‟s analysis was based on an
incomplete and selective review of past decisions. It concurred with the principle of taking into
account the MILs of neighbouring utilities such as Fortis. However, it also called upon the need
to balance it with other principles of setting a MIL rate, including, for example, the principle of
starting with the current cost to connect new customers and minimizing intergenerational
inequity. It discussed Decision 2011-134, where a jump from $1,320 per site to $2,590 per site
was approved for 2011 for ATCO Electric. This increase was approved by the Commission
because it was concerned that greater inequities would arise for newer customers if rates were
not better aligned with costs. Similarly, for EDTI without the proposed increase, the MIL would
be disconnected from the current cost to connect new customers and result in significant
intergenerational inequities.317
531. In its rebuttal evidence, EDTI also argued that it would be inappropriate to allocate costs
associated with the MIL increase to only residential customers, because the underground
infrastructure will be used not only by residential customers but EDTI‟s other rate classes as
well, including small commercial, medium commercial, time of use, street light, traffic light and
security light rate class customers. EDTI also stressed that given its current CAR-DCM
approach, all rate classes will be impacted by the proposed MIL increase until 2014, when the
data from the new Geographic Information System (GIS) will be available. The new data will
allow them to identify URD assets specifically and EDTI will then be able to isolate the impact
on residential customers.318
532. Given this situation, the UCA reiterated its position in its final argument that the increase
in MILs be limited to inflation plus 10 per cent for 2012, with the final increment being deferred
until 2014.
533. The CCA submitted that EDTI‟s calculation of URD MIL provides a reasonable
representation of the average cost of investment in URD facilities, however, it was concerned
that the sudden jump in a single year could result in intergenerational inequities between prior-
year customers and 2012 customers. Accordingly, it put forth the recommendation that the
increase in URD MILs should be phased in over a period of three years in equal percentage
increases, commencing in 2012.319
314
Exhibit 189.02. evidence of Shelley Radway, page 34. 315
Exhibit 189.02, evidence of Shelley Radway, page 36. 316
Exhibit 189.02, UCA-EDTI-108. 317
Exhibit 208, EDTI argument, page 152. 318
Exhibit 208, EDTI argument, page 154, paragraph 451. 319
Exhibit 207, CCA argument, page 20, paragraph 20.

2012 Phase I and II Distribution Tariff 2012 Transmission Facility Owner Tariff EPCOR Distribution & Transmission Inc.
AUC Decision 2012-272 (October 5, 2012) • 115
534. In its reply argument, EDTI countered the CCA‟s argument by pointing out that EDTI‟s
proposed MIL would result in less intergenerational inequity compared with phasing in the
increase, as it would ensure that customers bear the costs associated with their connections when
the costs are incurred.320
Commission findings
535. The Commission has reached its determination keeping in mind the guiding principles
and methodology for setting MILs filed as Appendix O in Fortis‟s 2010 and 2011 DTA and
agreed upon in their entirety by the participating utilities, including EDTI. The Commission
recognizes the need to balance the various principles in setting MILs and observes that there is a
large disparity between the current cost of URD and the rates charged to new customers. A
similar increase in URD MILs was approved in Decision 2011-134 for ATCO Electric, where
MILs were increased from $1,320 per site in 2010 to $2,688 per site for 2012, as the
Commission was concerned that the existing MILs were unduly onerous for new customers. The
Commission also agrees with EDTI that, by ensuring that customers bear the cost associated with
their connections when the costs are incurred, EDTI is minimizing intergenerational inequity.
536. The Commission considers that Fortis‟s MIL increase of inflation plus 10 per cent
approved in Decision 2012-108 is not a reasonable comparison because this was approved in the
context of a negotiated settlement. The Commission notes that the CCA found the proposed
MILs to be a reasonable representation of the average costs of investment in URD facilities and
the UCA raised no objection to the calculation of average costs. The Commission has reviewed
and is satisfied with the calculations and therefore finds that the proposed MILs are a reasonable
representation of the current cost of connecting new customers.
537. The Commission accepts EDTI‟s position that the increase in MILs for URD facilities
should not be allocated only to residential customers because all customers use the underground
infrastructure. Further, under EDTI‟s current Capital Asset Review – Direct Cost Method (CAR-
DCM) approach for a COSS, the impact of the URD increase would have been allocated to all
rate classes as explained in UCA-EDTI-108.
538. Moreover, the Commission notes that the application proposed that all rate classes be
impacted by the increase in URD MILs and that the impact is within the threshold of 0.5 per cent
in a single year.321 The Commission considers that this is consistent with the common approach
to managing changes to MILs that was developed for the electric distribution companies, with
the participation of stakeholder groups. This common approach was approved for Fortis, ATCO
Electric and EDTI.322
539. For all of these reasons, the Commission approves the MILs proposed by EDTI.
320
Exhibit 211, EDTI reply argument, page 80, paragraph 227. 321
Exhibit 119, Appendix K-6, page 3, paragraph 6. 322
Decision 2010-309: FortisAlberta Inc., 2010-2011 Distribution Tariff – Phase I, Application No. 1605170,
Proceeding ID No. 212, July 6, 2010.
Decision 2011-134: ATCO Electric Ltd., 2011-2012 Phase I Distribution Tariff, Application No. 1606228,
Proceeding ID No. 650, April 13, 2011.
Decision 2010-505: EPCOR Distribution & Transmission Inc., 2010-2011 Phase I Distribution Tariff,
Application No. 1605759; Proceeding ID No. 437, October 28, 2010.

2012 Phase I and II Distribution Tariff 2012 Transmission Facility Owner Tariff EPCOR Distribution & Transmission Inc.
116 • AUC Decision 2012-272 (October 5, 2012)
7.6 Deferral accounts
540. EDTI requested approval for the continued use of a number of reserve and deferral
accounts for its transmission and distribution business units, including the following:
Distribution reserve or deferral accounts:
hearing cost reserve
self-insurance reserve
AESO load settlement charge deferral account
AUC tariff billing and load settlement initiatives deferral account
transmission charge deferral account
property, business and linear tax deferral account
short-term incentive deferral account
transition to IFRS deferral account
Transmission reserve or deferral accounts:
hearing cost reserve
self-insurance reserve
AESO-directed projects deferral account
property, business and linear tax deferral account
short-term incentive deferral account
transition to IFRS deferral account
Commission findings
541. In Section 3.8 of this decision, the Commission found that the property, business and
linear tax deferral accounts for distribution and transmission were no longer required. In
Section 3.11, the Commission dispensed with the transition to IFRS deferral accounts for
distribution and transmission.
542. With respect to the remaining deferral and reserve accounts, the Commission finds that
EDTI‟s proposal for their continued use in the 2012 test year to be reasonable. The Commission
notes that no objections were raised by interested parties on the continued use of these accounts.

2012 Phase I and II Distribution Tariff 2012 Transmission Facility Owner Tariff EPCOR Distribution & Transmission Inc.
AUC Decision 2012-272 (October 5, 2012) • 117
7.7 Areas not individually addressed
543. The following tables summarize the major components of EDTI‟s proposed 2012
distribution and transmission function revenue requirements as filed in its application:
Table 50. Major components of the 2012 distribution revenue requirement
2012 ($ millions)
Per cent of total (%)
Return on Debt and Equity 43.79 29
Operating Expenses 33.11 22
Depreciation 27.46 18
Corporate 23.24 16
Customer Accounts 7.17 5
Property Taxes 6.70 4
Administrative (net of capitalized amounts) 4.17 3
Deferred and Reserve 3.76 3
Total 149.40 100
Table 51. Major components of the 2012 transmission revenue requirement
2012 ($ millions)
Per cent of total (%)
Return on Debt and Equity 24.55 36
Depreciation 13.91 20
Operating Expenses 13.54 20
Property Taxes 6.89 10
Corporate 6.26 9
Deferred and Reserve 2.04 3
Administrative (net of capitalized amounts) 1.44 2
Total 68.63 100
544. In this decision, the Commission has separately identified and provided comments and
determinations regarding areas in the application where either the Commission or interested
parties raised issues or concerns. The Commission has reviewed information provided by EDTI
in the application and during the proceeding relating to items which were not specifically
addressed by parties, and considers that the information appears reasonable, and accordingly the
Commission approves the revenue requirement subject to the determinations and order set out in
this decision.
545. The Commission notes that areas of concern which were raised by the Commission or
interested parties in this decision may impact other larger category areas such as rate base,
depreciation, and cost of capital, for example. For this reason, EDTI, in its compliance filing, is
directed to update all impacted areas of its revenue requirement for the 2012 test year for all
findings and determinations made within this decision.
7.8 PBR and going-in rates
546. EDTI requested that the 2012 distribution tariff and 2012 TFO tariff when approved on a
final basis related to this application be continued into 2013 as interim rates pending
Commission approval of EDTI‟s first annual rate adjustment filing under its PBR Plan, or any

2012 Phase I and II Distribution Tariff 2012 Transmission Facility Owner Tariff EPCOR Distribution & Transmission Inc.
118 • AUC Decision 2012-272 (October 5, 2012)
further orders with respect to 2013 tariffs. EDTI‟s proposed PBR Plan did not include SAS rates
as it intended to apply for approval of 2013 SAS rates during 2012.323
547. Decision 2012-237 addressed distribution PBR going-in rates as follows:
88. The Commission considers the second alternative is in keeping with the decision
to use 2012 approved rates rather than 2012 actual costs as the basis for going-in rates.
The 2012 rates have been tested and approved by the Commission as just and reasonable
for 2012. Accordingly, the 2012 approved rates are the correct starting point on which to
base going-in rates. The Commission confirms the findings in Decision 2009-035 that
adjustments to going-in rates should not be made to reflect actual results. Further,
adjustments should not be made selectively but, rather, should only be made in the
context of a full rate case. Adjustments may be made in exceptional situations, however,
like the case of the short term incentive plan adjustment approved in the ENMAX
decision.
89. Accordingly, the Commission will consider adjustments that are in the nature of
a correction to the going-in rates, and which are not rate adjustments made after-the-fact
to reflect actual results. This approach is consistent with the Commission‟s finding in
Section 7.4.4 that differences between placeholder amounts and final approved amounts
will be treated as Y factor adjustments or adjustments to rates that will be subject to the I-
X mechanism, depending on the circumstances of the adjustment.
90. The Commission will consider each of the proposals of the companies and
interveners to include adjustments to going-in rates.
91. Given the above findings, the Commission directs the companies to use their
respective approved 2012 distribution rates as the going-in rates for the PBR term,
subject to the specific adjustments allowed below.324
548. Current 2012 interim DAS rates for EDTI were approved initially in Decision
2011-426,325 expiring on March 31, 2012, and then continued until further ordered by Decision
2012-086.326 Current interim SAS rates and TFO tariffs were approved in Decision 2011-495 and
Decision 2011-491327 respectively.
549. EDTI requested revised 2012 interim DAS rates under Proceeding ID No. 1679 which is
currently before the Commission. On March 13, 2012, the Commission issued
Bulletin 2012-03,328 in response to a letter from the Minister of Energy dated March 8, 2012
regarding current electricity rates and charges, including rate riders to collect deferred balances,
requesting “that the AUC ensure these rates or charges do not exceed their current levels.” The
bulletin described the Commission‟s proposed approach to the Minister‟s letter.
323
Exhibit 3, application, page 2, paragraph 4. 324
Decision 2012-237: Rate Regulation Initiative – Distribution Performance-Based Regulation, Application
1606029, Proceeding ID No. 566, September 12, 2012, page 20, paragraphs 88-91. 325
Decision 2011-426: EPCOR Distribution & Transmission Inc., Revised 2011 Interim Rates for Distribution
Access Service, Application No. 1607541, Proceeding ID No. 1372, October 28, 2011. 326
Decision 2012-086: EPCOR Distribution & Transmission Inc., Revised 2012 Interim Distribution Access
Service Rates, Application No. 1608078, Proceeding ID No. 1679, March 26, 2012. 327
Decision 2011-491: EPCOR Distribution & Transmission Inc., 2012 Interim Transmission Facility Owner
Tariff Application No. 1607796, Proceeding ID No. 1516, December 16, 2011. 328
Bulletin 2012-03, Government of Alberta request regarding electricity rates, March 13, 2012.

2012 Phase I and II Distribution Tariff 2012 Transmission Facility Owner Tariff EPCOR Distribution & Transmission Inc.
AUC Decision 2012-272 (October 5, 2012) • 119
550. To minimize unanticipated consequences on EDTI and potential rate shock to customers
the Commission in Decision 2012-086 directed EDTI to continue, on an interim refundable
basis, with its 2012 interim DAS rates, which would otherwise expire on March 31, 2012, until
further ordered.
Commission findings
551. The above quote from Decision 2012-237 indicates that 2012 approved rates shall be
used as the basis for going-in rates for PBR to be effective January 1, 2013. The Commission
finds that going-in rates for PBR as of January 1, 2013 shall be based on the 2012 final DAS
rates if they are available. If 2012 final DAS rates are not available for use as of December 31,
2012, then the proposed rates from the compliance filing application, required in response to this
decision, shall be used as the basis for interim going-in DAS rates as of January 1, 2013. An
adjustment to the PBR going-in rates to reflect final DAS rates, with a subsequent true-up if
necessary, will be made once the final 2012 DAS rates are approved.
8 Order
552. It is hereby ordered that:
(1) EDTI is directed to submit a compliance filing by November 2, 2012, addressing
all of the determinations and directions in this decision, correcting any errors
which it has discovered, and including a summary of all changes made as a result
of this decision.
Dated on October 5, 2012.
The Alberta Utilities Commission
(original signed by)
Mark Kolesar
Vice-Chair
(original signed by)
Kay Holgate
Commission Member

2012 Phase I and II Distribution Tariff 2012 Transmission Facility Owner Tariff EPCOR Distribution & Transmission Inc.
120 • AUC Decision 2012-272 (October 5, 2012)
9 Dissenting reasons of Commission Member Bill Lyttle regarding EDTI’s cost of
debt
553. While I agree with the findings of my colleagues with respect to all other aspects of this
decision, I do not agree with the findings reached with respect to EDTI‟s cost of debt.
554. With respect to approval of the cost of new long-term debt I would direct EDTI in its
compliance filing to determine interest rates for EDTI‟s transmission and distribution function
based upon securing financing from the Alberta Capital Financing Authority (ACFA) for the
current year‟s debt issuance and deem that as the cost of newly issued long-term debt. I would
not apply this rate or any rate reduction to previous years‟ debt issues already approved by the
Commission on a go forward basis contrary to the UCA‟s submission.
Background
555. EUI as the direct parent of EDTI issues debt in the market on its own behalf and provides
debt financing to EDTI, as EDTI does not issue debt directly to investors. In Decision 2010-505
the Commission made the following finding:
EUI has significant investments in the unregulated power generation business through
Capital Power Corporation. EDTI acknowledged that this investment affects EUI‟s credit
rating. EDTI indicated that EUI‟s credit rating may improve if and when EUI‟s
investment in Capital Power Corporation is replaced with investments in utility
businesses. It follows then that an improved credit rating would lower EUI‟s cost of debt,
and that EUI‟s current debt costs may be higher than would be the case if EUI were a
pure play regulated utility.329
556. The Commission must find a way to determine what reasonable rate loans from EUI to
EDTI should occur for assigning a value for revenue requirements, since the debt for EDTI is not
directly observable in the market and is a non-arms length transaction.
557. In Decision 2010-505 the Commission considered both the methodology used and the
costs associated with EDTI‟s debt issuances for 2007, 2008 and 2009 during the period of the
negotiated settlement agreement and for the proposed debt issuances for 2010 and 2011. The
Commission found that “EDTI‟s approach in issuing its long-term debt at year end is not
optimal, because it does not attempt to minimize the cost of borrowing. Indeed, such a strategy
could be imprudent if EDTI consistently overprices its cost of debt relative to EUI.”330 The
Commission‟s concern was further elevated since EDTI also paid an allocated portion of EUI‟s
treasury costs.331 The Commission was also concerned with the bond spread that was applied to
the debt issued in 2007-2009 and directed EDTI to apply the actual indicative corporate bond
spread for Fortis.332 The Commission also used the Fortis bond spread when setting the 2010 and
2011 forecast debt interest rate.333 These directions reduced not only the 2007, 2008 and 2009
debt interest rates but also the 2010 and 2011 forecast debt interest rates.
329
Decision 2010-505 at paragraph 175 (original footnotes omitted). 330
Decision 2010-505 at paragraph 166. 331
Decision 2010-505 at paragraphs 166 and 167. 332
Decision 2010-505 at paragraph 181. 333
Decision 2010-505 at paragraph 185.

2012 Phase I and II Distribution Tariff 2012 Transmission Facility Owner Tariff EPCOR Distribution & Transmission Inc.
AUC Decision 2012-272 (October 5, 2012) • 121
558. In the present proceeding, EDTI proposed to increase that funding spread further to the
detriment of ratepayers by introducing a letter from DBRS that indicated EDTI transmission
would be “downgraded” from A (low) to BBB (high).334 As a result, in AUC-EDTI-54-
Attachment 1, EDTI submitted that EDTI transmission‟s credit risk premium should be 80 basis
points higher than EDTI distribution‟s credit risk premium.335
559. Whether it is the timing issues as noted above, increased applied for spread rates, or
implied credit downgrading, the Commission is thrust into the position of determining the rate
for revenue requirement purposes that EUI can charge EDTI for debt financing.
ACFA funding
560. One method of determining the rate for debt financing that the Commission directed
EDI/ETI (now EDTI) to pursue in the 2006-054 decision was for EDI/ETI to provide a letter to
the City of Edmonton (Edmonton) as detailed in the quote below indicating that EDI/ETI would
appreciate it if Edmonton could provide similar financing through ACFA that The City of
Calgary provided to ENMAX Power Corporation (ENMAX). EDTI is a municipal subsidiary.
By accessing ACFA funding the debt could be flowed from Edmonton to EDTI. The problem of
assigning a just and reasonable rate for EUI to lend EDTI funds could be avoided and the
requirement for EUI to raise debt on behalf of EDTI could be reduced.
561. In Decision 2006-054 the board discussed the issue of ACFA financing; however, no
witness from Edmonton was available to discuss this issue:
The Board notes that not only are the electricity users in Calgary benefiting from this
arrangement, but further, the City of Calgary appears to consider itself to be fully
compensated by the 0.25% loan guarantee and administration charge.
The Board is somewhat surprised, that the City of Edmonton would not provide the same
service to electricity consumers within Edmonton that the City of Calgary provides in
Calgary. However, the Board recognizes that the information above was not available to
the public until the issuance of Decision 2006-002, which was after the close of the
evidentiary record of this proceeding. The Board also notes that it had no witness from
the City of Edmonton to question as to the reason why the City would not provide this
service to its citizens or to question as to whether the City of Edmonton was aware that
the City of Calgary is providing this service to electricity users in the City of Calgary.
The Board has relied solely on the views of EDI/ETI as to why this approach was taken
by the City of Edmonton.
Accordingly, the Board directs EDI/ETI, prior to the next GTA, to provide a letter to the
City of Edmonton indicating that the City of Calgary is providing ACFA based financing
to its electric utility, and that EDI/ETI would appreciate it if the City of Edmonton would
provide similar financing to EDI/ETI in the future. The letter should include reference to
this section of this Decision.
If the City declines to provide such financing, the City should provide its written reasons
for declining to provide the financing and should be prepared to provide a witness to
testify on the policy reasons for declining to provide its citizens with the low cost ACFA
334
Exhibit 150.10, CCA-EDTI-10, Attachment 5. 335
Exhibit 167.02, AUC-EDTI-54.

2012 Phase I and II Distribution Tariff 2012 Transmission Facility Owner Tariff EPCOR Distribution & Transmission Inc.
122 • AUC Decision 2012-272 (October 5, 2012)
financing available for financing such infrastructure projects as electric distribution lines
at the time of EDI/ETI‟s next GRA filing.336
562. In Decision 2010-505 the Commission again directed EDTI “to advise the Commission
on whether Edmonton would make available ACFA financing.”337
563. EDTI filed two letters from Edmonton on the record of this proceeding, one from March
22, 2007 filed as Appendix G-13 of the application and the other dated October 31, 2011 filed as
Appendix G-14 of the application.
564. In the 2007 letter, Edmonton stated that EPCOR (at that time, EDI (EPCOR Distribution
Inc.) and ETI (EPCOR Transmission Inc.)) was established as a corporate entity separate from
Edmonton to allow it to independently manage its own affairs and was to follow the stand-alone
principle, and further that the generation side of EPCOR was to be on a level playing field with
other industry participants. In the 2011 letter, Edmonton submitted that many of the concerns in
2007 remain today and detailed that Edmonton continues to place a strong emphasis on the
governance relationship between Edmonton and EPCOR which is different from the relationship
The City of Calgary has with ENMAX. ACFA funding would require Edmonton to become
more involved in the management activities of EDTI related to capital expenditures.
565. I note that in Decision 2006-054 the board also stated:
The Board does not accept EDI/ETI‟s view that failure to add the fully compensatory
stand-alone premium to the ACFA rate would necessarily result in a misallocation of
civic resources. The Board considers that the ACFA financing exists to provide Albertans
with a lower rate for infrastructure financing thereby benefiting the Albertans and Alberta
businesses that use the infrastructure.338
566. I concur with the views of the board above and elaborate further below as Edmonton‟s
letters are now part of this proceeding, and the policy reasons for declining funding can be
assessed. I find that Edmonton‟s policy reasons are insufficient to justify denying infrastructure
financing advantages to EDTI ratepayers.
567. Edmonton has a 100 per cent direct ownership of EUI and subsequently EDTI. Edmonton
has the ultimate responsibility for EDTI through its ownership structure. To assume that debt
management would create some increasing responsibility other than administrative compliance
would presume that shareholders investments require less stewardship than management of an
entity‟s debt or capital expenditures. Edmonton as the ultimate shareholder has the responsibility
and risk of its equity investment and can direct its administration to facilitate the management of
its investment. Control of EDTI is not a passive investment that Edmonton has an insignificant
stake in; it has a 100 per cent ownership stake in an essential service provider. As the 100 per
cent owner of EUI, I consider that Edmonton should be willing to take on this administrative
burden so as to lower EDTI‟s cost of debt. Coincidentally, The City of Calgary appears to
336
Decision 2006-054 at page 108. 337
Decision 2010-505 at paragraph 189. 338
Decision 2006-054 at page 107.
2012 Phase I and II Distribution Tariff 2012 Transmission Facility Owner Tariff EPCOR Distribution & Transmission Inc.
AUC Decision 2012-272 (October 5, 2012) • 123
consider itself fully compensated by the 0.25 per cent loan guarantee and administration
charge.339
568. Since the board‟s 2006 decision and 2007 letter from Edmonton, EUI has significantly
decreased its ownership of Capital Power Corporation340 so some of those level playing field
issues have dissipated. I consider it possible, through the use of separate accounts, to ensure that
ACFA funds are not available to competitive affiliates. Further, as discussed by the Commission
in Decision 2010-035, I consider that level playing field issues with respect to ACFA financing
could be explored in proceedings dealing specifically with the EPCOR Group‟s Code of
Conduct.341
569. Both the 2007 and 2011 letters from Edmonton refer to the additional debt and effects
upon credit ratings. However, one must question, as the equity owner of EUI, why Edmonton
would not wish to diversify its financing requirements of EUI by flowing through ACFA
financing to EDTI and reduce the private market demands of EUI to raise debt. The debt would
be in Edmonton‟s name; however, Edmonton would have access to an additional and offsetting
source of financing by flowing through this capital. EUI‟s debt demands would be equally
reduced as the pressure to raise funds from some or all of the requirements for EDTI would be
flowed through from the ACFA reserve. It is not readily apparent that this arrangement would
have any negative consequences to EUI‟s ratings. With regard to Edmonton‟s ratings, perhaps
the offsetting reduced requirements of EUI would significantly mitigate this issue of debt and
credit rating concerns. Edmonton in its 2011 letter states that it leverages its capital requirements
with strategic uses of debt on behalf of its taxpayers; the question needs to be asked whether it
should do so on behalf of ratepayers.
570. The UCA proposed to reduce the average cost of debt by 1.50 per cent. I do not agree
with that rate reduction for new debt nor applying it to all outstanding debt as the UCA proposed.
As detailed below I would have directed EDTI in its compliance filing to determine interest rates
for EDTI transmission and EDTI distribution based upon securing financing from ACFA for the
current year‟s debt issuance and deem that as the cost of newly issued long-term debt. The table
below compares the average historical cost of debt between ENMAX Power Corporation,
distribution and transmission and EPCOR Distribution & Transmission Inc. (EDTI distribution
and EDTI transmission) based upon the publicly available AUC Rule 005342 filings with the
Commission. Over time, accessing ACFA financing would have a substantial effect on the costs
that ratepayers pay if funding evolved in a similar manner that is shown for ENMAX below.
339
Decision 2006-054 at page 108. 340
Exhibit 3, application at paragraph 113: “As described in EDTI‟s 2010-2011 Application, on July 9, 2009 the
portion of EUI‟s operations related to power generation and associated services was sold to a newly formed
independent and stand alone company called Capital Power Corp. (“CPC”) (TSX: CPX). Following the
transaction, EUI held approximately 72.2% (through its subsidiary EPCOR Power Development Corporation)
of CPC through units in Capital Power Limited Partnership that are exchangeable on a one for one basis for
common shares of CPC. As a result of the sale of portions of its remaining interest in CPC in December 2010
and November 2011 and issuances of common shares by Capital Power, EUI currently holds approximately
39% of CPC.” 341
Decision 2010-035 at paragraph 53. 342
AUC Rule 005: Annual Reporting Requirements of Financial and Operational Results.

2012 Phase I and II Distribution Tariff 2012 Transmission Facility Owner Tariff EPCOR Distribution & Transmission Inc.
124 • AUC Decision 2012-272 (October 5, 2012)
Table 52. Average historical cost of debt (from AUC Rule 005 filings)
EDTI
distribution EDTI
transmission ENMAX
distribution ENMAX
transmission
2011 6.03%(1) 6.40%(1) 4.926% 4.926%
2010 6.12% 6.32% 5.046% 5.046%
(1) The cost of debt estimate for 2011 has been adjusted to reflect the full year’s carrying cost for ED10010 at 4.37 per cent.
571. EDTI distribution customers paid 1.074 per cent and 1.104 per cent more in interest in
2010 and 2011, respectively, than ENMAX distribution customers paid. EDTI transmission
customers paid 1.274 per cent and 1.474 per cent more in interest in 2010 and 2011, respectively,
than ENMAX transmission customers paid.
572. This 1.104 per cent and 1.474 per cent interest rate difference applied to an EDTI
distribution and EDTI transmission combined debt outstanding balance at 2011 year end of
$341,280,000, would indicate that EDTI ratepayers are remitting $3,767,731 to $5,030,467 more
in interest per year to EUI than they would if they had achieved the same ACFA funding as
ENMAX.
573. In a competitive market there is an expectation that entities will pursue efficiencies on
behalf of customers and shareholders alike. The Commission encourages these efficiencies by
allowing transactions between affiliated entities and has established the Code of Conduct to
guide decisions related to non-arms length transactions and associated conduct. Where ratepayer
efficiency is evident and being used by a similar municipally regulated utility the Commission
should question why that efficiency is not being pursued by EDTI.
The stand-alone principle
574. There are two alternative logical routes to view the stand-alone principle. Both
methodologies lead to the same conclusion that the Commission can deem ACFA funding rates
for debt for EDTI.
Route 1
575. EDTI is a municipal subsidiary in Alberta. Edmonton has access to ACFA financing
because of its standing as a municipality and infrastructure of EDTI is eligible for that financing.
Both the UCA and EDTI argued that there are special circumstances that are created that flow
through to ratepayers because of the happenstance of ownership by a municipality. The two per
cent increase in debt to equity that was awarded to non-tax paying entities in the 2011 Generic
Cost of Capital Decision (Decision 2011-474), as well as the tax free status of the municipality
are effects that result from ownership by a municipality. I view access to ACFA funding as just
another aspect of that happenstance of ownership.
576. Within the stand-alone principle, there is an argument that since Alberta municipalities
have access to ACFA funding then a utility owned by an Alberta municipality will have access to
ACFA funding and therefore be perceived to have access to AAA funding. Debt rates for
revenue requirement purposes could then be set using those rates less administrative costs.

2012 Phase I and II Distribution Tariff 2012 Transmission Facility Owner Tariff EPCOR Distribution & Transmission Inc.
AUC Decision 2012-272 (October 5, 2012) • 125
Route 2
577. The alternative route to applying the stand-alone principle, that I prefer, was expressed
with Commission Member Yahya in our additional comments to Decision 2011-399 which cited
the Court of Appeal. Those findings supported an independence of thought for the Commission
in its assessment of the application of the stand-alone principle and the Commission should not
apply the stand-alone principles by “rote”:
43. For example, in AltaLink Management Ltd., AltaLink sought to have the Alberta
Energy and Utilities Board (board or EUB) calculate an income tax allowance
commensurate with a taxable entity. The City of Calgary objected and argued it was
inappropriate to raise the just and reasonable rate of return under the stand-alone
principle, because the stand-alone principle was developed to shield customers from
absorbing the cost of funds resulting from decisions of consolidated entities. The board
took a middle ground approach and decided to establish a tax allowance by looking at the
tax status of AltaLink‟s partners. The board stated “that in a cost of service jurisdiction
where revenue and costs are forecast on a prospective basis, a cost is recoverable in
customer rates if there is a reasonable expectation that it will be incurred.” Prior to the
hearing, interestingly, one of the partners had a tax free status but later changed it. The
board, however, made no allowance for that partner since there was “no such expectation
with respect to income taxes when the partner is initially structured as non-taxable and
later inexplicably changes its tax status with the result that customers are expected to
provide it with an income tax allowance.”
44. The courts have always affirmed the flexibility of the Commission to examine the
corporate structure of utilities and its parent organization with respect to setting rates. In
ATCO Electric Ltd. v. Alberta (Energy & Utilities Board), the Court of Appeal held that
the EUB “ha[d] the jurisdiction to segregate business functions of an integrated utility –
and determine a notional corporate organizational model – for purposes of evaluating risk
and calculating prudent carrying costs associated therewith.” The Court approved of the
board‟s actions which were in line with evidence of independent financial experts, and
noted with approval that the board followed the advice of the experts that:
… the Board should “not apply the stand-alone principle by rote. Instead the Board
should deal with the reality, utilize independence of thought, question assumptions and
think through whether an approach that has been applied in the past in different
circumstances should be applied now in new circumstances. Such an approach should
lead the Board to deal with reality and decline to apply the stand-alone principle to the
detriment of the customers of the [distribution companies].343
578. I have examined EDTI‟s application in this proceeding and decline to apply the stand-
alone principle as application of this principle in this instance is to the detriment of EDTI‟s
customers.
579. The treatment of AltaLink in Decision 2011-453344by the Commission provides further
analogous support. There, the Commission found “it reasonable to continue the current practice
of determining AltaLink‟s income tax status on a deemed stand alone basis.”345 AltaLink is a
343
Decision 2011-399 at paragraphs 43 and 44 (original footnotes omitted). 344
Decision 2011-453: AltaLink Management Ltd., 2011-2013 General Tariff Application, Application No.
1606895, Proceeding ID No. 1021, November 18, 2011. 345
Decision 2011-453 at paragraph 1079.

2012 Phase I and II Distribution Tariff 2012 Transmission Facility Owner Tariff EPCOR Distribution & Transmission Inc.
126 • AUC Decision 2012-272 (October 5, 2012)
non-tax paying entity and AltaLink‟s owner SNC-Lavalin is the tax paying entity. In the
proceeding, CCA submitted that “this was further evidence supporting the Commission‟s finding
that an entity, such as AltaLink, which does not pay any income taxes, „has little or no incentive
to maximize its tax deductions‟.”346
580. In reaching its findings the Commission considered that certain deductions for income tax
purposes should be taken for the benefit of customers:
The overheads in question have been deducted in the past for income tax purposes and it
would be reasonable for AltaLink to continue to deduct such costs in the future. The
Commission considers this to be a position that AltaLink should take to benefit its
customers. The Commission considers this to be similar to the expectation that AltaLink
will maximize deductions such as the Rainbow type capital maintenance expenditures for
the benefit of its customers.347
581. In its 2011-2012 GTA refiling, AltaLink further argued that this method “represented a
very aggressive position that would likely not be accepted by the Canada Review Agency in its
assessment” and proposed placeholders which were subsequently denied by the Commission.348
In my view, this finding results in the parent ultimately being responsible for the tax
consequences as the tax paying entity. The Commission deemed a revenue requirement treatment
in the subsidiary that required the parent to make the same tax deductions to keep it whole.
However the Commission was willing to consider the impact in a future GTA if any
disallowance occurred. In this instance, the Commission did not mechanically subscribe to the
stand-alone principle in its treatment of AltaLink. The Commission balanced the particular
situation and motivations of the owners with ratepayers‟ interests. I consider that this approach is
particularly relevant when evaluating ACFA financing within EDTI‟s cost of debt.
Conclusion
582. I believe based on the history of prior EDTI GTA decisions as detailed above and EDTI‟s
reluctance to actively pursue ACFA financing opportunities, Edmonton and EUI have a similar
lack of motivation in minimizing debt costs that will ultimately be borne by ratepayers. Based on
these views, with respect to approval of the cost of new long-term debt, I would have directed
EDTI in its compliance filing to determine interest rates for EDTI transmission and EDTI
distribution based upon securing financing from ACFA for the current year‟s debt issuance and
deem that as the cost of newly issued long-term debt.
346
Decision 2011-453 at paragraph 1098. 347
Decision 2011-453 at paragraph 1105. 348
Decision 2012-221 at paragraph 128 and 131.

2012 Phase I and II Distribution Tariff 2012 Transmission Facility Owner Tariff EPCOR Distribution & Transmission Inc.
AUC Decision 2012-272 (October 5, 2012) • 127
583. If for some unforeseen reason, ACFA was not accessible nor financially advantageous in
a future GTA, then I would consider the impact that any cost would have, similar to what the
Commission did in the AltaLink decision referenced above with regard to a future Canada
Revenue Agency assessment. This approach recognizes the particular circumstances within the
confines of this application of not applying the stand-alone principle, which in my view
corresponds with the Commission‟s examination in EDTI‟s 2010-2011 GTA of EDTI‟s
2007-2009 debt.
(original signed by)
Bill Lyttle
Commission Member


2012 Phase I and II Distribution Tariff 2012 Transmission Facility Owner Tariff EPCOR Distribution & Transmission Inc.
AUC Decision 2012-272 (October 5, 2012) • 129
Appendix 1 – Proceeding participants
Name of organization (abbreviation) counsel or representative
EPCOR Distribution & Transmission Inc. (EDTI) J. Liptelo D. Gerke J. Elford D. Tenney
ATCO Electric Ltd. (ATCO Electric) L. Keough W. Wright L. Kizuk E. Gai K. Kerckhof
AltaLink Management Ltd. (AltaLink) Z. Lazic D. Fischbach
Consumers’ Coalition of Alberta (CCA) J. A. Wachowich A. P. Merani R. Retnanandan
ENMAX Power Corporation (ENMAX) K. Hildebrandt H. Johansen J. Schlauch J. Petratur J. Worsick T. Carle
Office of the Utilities Consumer Advocate (UCA) C. R. McCreary T. A. Shipley
University of Alberta (University) P. A. Smith M. Turner A. da Silva T. Nonay

2012 Phase I and II Distribution Tariff 2012 Transmission Facility Owner Tariff EPCOR Distribution & Transmission Inc.
130 • AUC Decision 2012-272 (October 5, 2012)
The Alberta Utilities Commission Commission Panel M. Kolesar, Vice-Chair B. Lyttle, Commission Member K. Holgate, Commission Member Commission Staff S. Ramdin (Commission counsel) D. Cherniwchan J. Olsen N. Mahbub S. McCrady B. Clarke O. Vasetsky P. Dmytruk

2012 Phase I and II Distribution Tariff 2012 Transmission Facility Owner Tariff EPCOR Distribution & Transmission Inc.
AUC Decision 2012-272 (October 5, 2012) • 131
Appendix 2 – Summary of Commission directions
This section is provided for the convenience of readers. In the event of any difference between
the directions in this section and those in the main body of the decision, the wording in the main
body of the decision shall prevail.
1. Upon reviewing the application, the Commission finds that EDTI has complied with the
direction. However, the Commission did not find the presentation of the information in
tables 2.2-1 and 13.2-1 helpful. The Commission asked an information request for
clarification and found the format of the continuity schedules provided as AUC-EDTI-
68(b) attachments 1 and 2 to be much easier to follow. The Commission directs EDTI, in
future filings for its transmission function, to file continuity schedules for at least three
years prior to the forecast test year or years in a format similar to AUC-EDTI-68(b)
attachments 1 and 2, and to continue submitting business cases for capital expenditures
that are greater than $500,000. Further, the Commission reminds EDTI, as per Direction
32 in Decision 2006-054, to continue preparing business cases for capital expenditures
that may last longer than one year and are in excess of $500,000. For EDTI‟s distribution
function, the Commission may request EDTI to provide this information at the end of the
performance-based regulation (PBR) term for each year of the PBR term. .... Paragraph 23
2. The Commission agrees with the UCA that EDTI has not provided sufficient supporting
evidence to justify the use of contractor backfills in its vacancy rate and finds that the
direction has not been complied with. The Commission notes that the number of new
positions created is not considered in the calculation of vacancy rates. The Commission
directs EDTI for its transmission function to develop a system to better track vacancies
which takes into account newly created positions. .......................................... Paragraph 27
3. For distribution, the Commission notes that distribution capital expenditures forecast for
2012 are lower than 2011 actual levels, both in aggregate and for the capital expenditures
life cycle replacement projects. Further, as shown in Table 7 above, generally three
quarters of distribution capital expenditures are constructed using internal resources. As
distribution capital expenditures are forecast to decrease and there is a similar forecast
decrease in the use of contractors, the Commission finds no support for the forecast
increase in distribution capital FTE levels. The Commission is not persuaded that
distribution capital FTE increases beyond 2011 actual levels, as forecast by EDTI, are
required and therefore, the Commission directs that the 2012 distribution capital FTEs be
held to the 2011 actual levels. .......................................................................... Paragraph 52
4. For all of the reasons provided above, the Commission finds that capital FTE levels for
distribution in the 2012 test year shall be reduced by 23.7 FTEs and, instead, be based on
the 2011 actual levels. The Commission directs EDTI to reflect this reduction in
distribution capital FTEs along with all related costs in the compliance application and to
provide a schedule with all resulting adjustments. ......................................... Paragraph 56
5. Accordingly, for distribution, the Commission directs that a gross vacancy rate of 3.4 per
cent is to be applied to the salary – other category, based on calculating the four year
average of the vacancy factors before backfills, as shown in Table 13 above. For
transmission, the Commission directs that no vacancy rate shall be applied to the salary
category for the 2012 test year, because in the Commission‟s view use of a negative
vacancy factor would provide more than 100 per cent of salary for each FTE to which it

2012 Phase I and II Distribution Tariff 2012 Transmission Facility Owner Tariff EPCOR Distribution & Transmission Inc.
132 • AUC Decision 2012-272 (October 5, 2012)
is applied. Additionally, the Commission does not agree with EDTI‟s calculation of its
negative vacancy factor because it fails to take into account FTEs in excess of the
approved forecast amount. .............................................................................. Paragraph 79
6. With regard to Section 2.8 of the application on the tracking of monthly FTE vacancy
data, the Commission disagrees with EDTI‟s position that it has complied with this
direction. Tables 1.4.3-3 and 1.4.3-6 for distribution and transmission vacancy
respectively provide monthly information for salaried employees but do not provide any
information on the labour FTE category, which is the dominant FTE category for both
business units. The Commission finds that EDTI has complied with the directions shown
in sections 2.9, 2.11 and 2.13 of the application. However, EDTI has only partially
complied with directions in sections 2.1 and 2.8 of the application, having only tracked
vacancy rates for salaried employees. For transmission, EDTI is directed to track monthly
data on each FTE category as shown in Table 14 above, and to provide this information
as part of future filings. EDTI is also directed to track new positions that are hired but
were not part of the approved FTE level and to reflect these in the vacancy calculations.
For EDTI‟s distribution function, the Commission may request EDTI to provide this
information at the end of the PBR term for each year of the PBR term. ........ Paragraph 80
7. Accordingly, the Commission directs EDTI transmission to base the financial component
of its STI program for the purposes of its regulatory applications on the net income of
EDTI for 2013 onward. EDTI distribution is not limited or restricted by the Commission
in its compensation practices, during the PBR term, including the terms of its STI
program. Therefore, this direction will not apply to EDTI‟s distribution function as its
distribution function is now under a performance based regulation regime beginning in
2013. However, the direction will still apply to the transmission function and the
Commission directs that the STI program for transmission will be based on the net
income of EDTI at the time of EDTI‟s next transmission general tariff application.
........................................................................................................................ Paragraph 118
8. In respect of the pool B payments, the Commission considers that any actual pool B
payments made to EDTI employees in 2012 and beyond should be treated as disallowed
costs and directs EDTI to deduct any pool B payments from EDTI‟s expenses when
determining EDTI‟s return on equity in 2012 for distribution and transmission, and for
2013 and beyond for transmission. ............................................................... Paragraph 119
9. The Commission is concerned with the structure of the new MTI program proposed by
EDTI. Specifically, because the MTI program is based on assets, and there is no
assurance that the assets will be required for the provision of utility service, the
Commission finds that the MTI program creates an incentive to invest in assets that may
not be required for the provision of utility service. The Commission discusses additional
concerns with EDTI‟s MTI program in Section 6.2.1.3 of this decision. For all of these
reasons, the Commission directs EDTI to remove the MTI costs from its 2012 revenue
requirement in its compliance filing. ............................................................ Paragraph 128
10. Should EDTI choose to implement the MTI program and make incentive payments to
eligible employees in 2012, the Commission directs EDTI to remove the cost of those
payments from its actual 2012 expenses when determining its actual return on equity for
2012. .............................................................................................................. Paragraph 129
11. The Commission accepts EDTI‟s proposal that the credit spread for distribution be 150
basis points, based on its analysis of comparative companies with an A (low) credit

2012 Phase I and II Distribution Tariff 2012 Transmission Facility Owner Tariff EPCOR Distribution & Transmission Inc.
AUC Decision 2012-272 (October 5, 2012) • 133
rating. Given the Commission‟s finding with respect to the credit spread for transmission,
the Commission directs EDTI to use the 150 basis point credit spread for transmission.
........................................................................................................................ Paragraph 152
12. The Commission directs EDTI, in its compliance filing, to calculate the cost of its 2012
debt issues using the Government of Canada long-term bond yield for the month of June
2012 (2.32 per cent) which includes the maturity premium. ........................ Paragraph 155
13. Consistent with the above, EDTI, in its compliance filing, is directed to reflect all
changes to the 2012 revenue requirement consistent with the approach determined in
Decision 2010-505, when the 2011 actual figures are input into EDTI‟s revenue
requirement model. ....................................................................................... Paragraph 212
14. With respect to Table 26 above, the Commission notes a discrepancy between the 2010
actual closing CWIP balance of $16.0 million and the 2011 actual opening CWIP balance
of $15.3 million The Commission directs EDTI in its compliance filing to correct the
discrepancy and to reflect this change in the 2012 opening and closing forecast CWIP
balances. ........................................................................................................ Paragraph 269
15. The Commission has reviewed the analyses of individual project variances provided in
the application including the 30 post implementation reviews provided. The Commission
finds that the capital additions are reasonable and accordingly approves EDTI‟s
transmission function 2012 opening rate base as filed, subject to the following direction
regarding CWIP balances. The Commission directs EDTI to correct the $4.6 million
discrepancy between 2011 actual closing CWIP and 2012 forecast opening CWIP and to
reflect this correction in 2012 opening and closing CWIP balances in the compliance
filing. ............................................................................................................. Paragraph 295
16. Even though EDTI has an AESO-directed projects deferral account, the majority of the
work will not be completed until 2013 and, as such, the Commission finds that EDTI
should not include these projects as capital additions in its 2012 forecast revenue
requirement as filed. Accordingly, the Commission directs EDTI to remove the Genesee
Interface to HVDC Converter Station and the East HVDC Converter Station Interface
from its 2012 revenue requirement. Moreover, the Commission directs EDTI in its
compliance filing to reflect this direction in EDTI‟s transmission capital additions
schedule and all related schedules. ............................................................... Paragraph 334
17. The corporate services costs in the allocated cost category for 2010 were 9.4 per cent less
than the approved amount and for 2011 were 10.9 per cent less than the approved
amount. This suggests a significant amount of discretion in the actual expenditures and
possible forecasting errors. Based on a review of the historical actual information, the
nature of the costs included in the allocated cost category and the lack of persuasive
support for the increases in allocated corporate services costs, the Commission considers
that this forecast is excessive and would result in unreasonable costs being allocated to
EDTI and EEAI. Therefore, for the purpose of allocating costs to EDTI and EEAI, the
Commission directs EDTI to reduce the 2012 forecast corporate services costs in the
allocated category by nine per cent after any other corporate services costs reductions
identified in the application or directed in this decision are applied. The Commission
finds that a nine per cent reduction is reasonable given the reduction in discretionary
expenditures and any forecast errors reflected in the 9.4 per cent and 10.9 per cent
reductions experienced in 2010 and 2011 respectively. ............................... Paragraph 395

2012 Phase I and II Distribution Tariff 2012 Transmission Facility Owner Tariff EPCOR Distribution & Transmission Inc.
134 • AUC Decision 2012-272 (October 5, 2012)
18. In addition to the findings made in Section 3.6, the Commission does not accept that the
forecast 2012 MTI amounts included in the EUI corporate services costs are required to
provide utility service. EDTI identified a net benefit to utility customers from the
increased economies of scale that will be captured through the allocation of costs to new
businesses as it seeks out growth opportunities. While there may be some possible
transitory future benefit, EUI could divest itself of the acquired businesses and leave
utility customers in the position of having paid the costs related to acquisitions and
captured little or none of the benefits. The Commission considers that the MTI program
is designed in a way that any resulting benefits will accrue to the shareholder of EUI. As
the Commission is not convinced that MTI provides any benefit to utility customers, the
Commission finds that this cost should not be approved as an element of the costs to be
allocated to EDTI and EEAI. The Commission directs EDTI to remove all MTI amounts
from the corporate services costs allocated to EDTI and EEAI. .................. Paragraph 404
19. In its evidence the UCA made reference to a number of prior Commission decisions
including Decision 2010-483, Decision 2009-238 and Decision 2011-450 that address the
issue of customer communications and brand development. Each of these decisions
denies costs related to the types of activities identified by EDTI as included in
community relations and the EPCOR community essentials council services. The
Commission acknowledges that EDTI has removed certain costs such as donations from
these costs but finds that the remaining costs are not required for the provision of utility
service and directs EDTI to remove these costs from the 2012 forecast corporate services
costs allocated to EDTI and EEAI. ............................................................... Paragraph 407
20. The Commission directs EDTI to remove $1.15 million ($0.65 million including a 77 per
cent overhead charge) from the 2012 forecast EUI corporate services costs and to remove
the proportionate share of these business development costs from the amounts allocated
to EDTI and EEAI. ....................................................................................... Paragraph 416
21. The Commission accepts the position that fully burdened labour cost is administratively
more complex and as such may not be as clear or stable as headcount as an allocator.
Additionally, given the relatively minor variation in the resulting allocation demonstrated
in the analysis of the alternatives, the Commission finds that the use of headcount for the
labour component in the composite cost causation allocator is acceptable as utilized in the
applied-for allocated corporate services costs. However, given the different mix of
employees in the companies, the Commission considers there should be a review of the
impact of the use of payroll or full-time equivalents (FTEs) rather than headcount. The
Commission therefore directs EDTI and EEAI to include in any future applications that
incorporate the composite cost causation allocator, an analysis of the use of payroll and
FTEs as the labour component. Should the profile of the mix of employees in the EPCOR
businesses be modified, the Commission may determine that headcount no longer results
in the most fair and reasonable allocation. .................................................... Paragraph 426
22. The Commission, having factored in both the availability and transparency of the revenue
components, considers the exclusion of commodity and flow through items, a measure of
margin, is a better reflection of the burden each business segment has on the total
corporate services costs allocated using the composite cost causation allocator. To ensure
each revenue item is only included once in the calculation of the revenue component of
the composite cost causation allocator, the Commission directs EDTI and EEAI to
include revenue net of commodity charges, items that flow through to utility customers,

2012 Phase I and II Distribution Tariff 2012 Transmission Facility Owner Tariff EPCOR Distribution & Transmission Inc.
AUC Decision 2012-272 (October 5, 2012) • 135
and any items eliminated on consolidation as the revenue component of the composite
cost causation allocator. ................................................................................ Paragraph 434
23. For these reasons, the Commission directs EDTI to remove capital expenditures as a
component of the composite cost causation allocator for the purpose of allocating
corporate services costs to EDTI and EEAI. ................................................ Paragraph 440
24. Accordingly, the Commission finds that, for the purposes of allocating costs to EDTI and
EEAI, the composite cost causation allocator should be calculated recognizing EUI‟s
investment in CPC or any other investments held by EUI. The Commission directs EDTI
to include the revenues (including equity income), assets and headcount associated with
EUI‟s investment in CPC and any other assets held by EUI, in the calculation of the
composite cost causation allocator. ............................................................... Paragraph 446
25. The Commission has considered the submissions related to the incorporation of the U.S.
Water operation and finds EDTI has not adequately demonstrated that the governance
related costs allocated by the composite cost causation allocator should not be allocated
to the U.S. Water operation. The assertion that the governance related services will not be
used is unsupported. The three components of the corporate costs assignment include
direct assignment, fees for asset usage and cost allocation. Within cost allocation, there
are functional allocations and allocations for which a causative factor could not be
identified that are allocated using a composite allocator. Specifically, the costs allocated
using the composite cost causation allocator can not be directly assigned or allocated
using a functional allocator and, as such, are remote from the business. It is likely that
any one of the group of companies could make an argument that it did not benefit directly
from certain of the governance cost groups. For the purpose of allocating costs to EDTI
and EEAI, the Commission directs EDTI to abandon the Canadian composite cost
causation allocator. ....................................................................................... Paragraph 450
26. The Commission notes that areas of concern which were raised by the Commission or
interested parties in this decision may impact other larger category areas such as rate
base, depreciation, and cost of capital, for example. For this reason, EDTI, in its
compliance filing, is directed to update all impacted areas of its revenue requirement for
the 2012 test year for all findings and determinations made within this decision.
........................................................................................................................ Paragraph 545