Embed Size (px)
DESCRIPTION
EPA Guidelines for Refinery
Citation preview

United States Office of Air Quality EPA-450/2-78-036Environmental Protection Planning and Standards OAQPS No. 1.2-1 11 Agency Research Triangle Park NC 2771 1 June 1978
Air
Guideline Series
Control of Volatile Organic Compound -
Leaks from ,
Petroleum Refinery %
tquipment


EPA-450/2-78-036 OAQPS NO.1.2-1I I
Control of Volatile Organic Compound
Leaks from Petroleum Refinery Equipment
Emission Standards and Engineering Division Chemical and Petroleum Branch
U.S. ENVIRONMENTAL PROTECTION AGENCY Office of Air, Noise, and Radiation
Office of Air Quality Planning and Standards Research Triangle Park, North Carolina 2771 1
June 1978

OAQPS GUIDELINE SERIES
The guideline series of reports is being issued by the Office of Air Quality Planning and Standards (OAQPS) to provide information to state and 1-1 air pollution control agencies; for example, to provide guidance on the acquisition and processing of air quality data and on the planning and analysis requisite for the maintenance of airquality. Reports published in this serieswill beavailable -as supplies permit -from the Library Services Office (MD-35),U.S. Environmental Protection Agency, Research Triangle Park, North Carolina 27711, or, for a nominal fee, from the National Technical Information Service, 5285 Port Royal Road, Springfield, Virginia 22161.
Publication No. EPA-450/2-78-036 (OAQPS Guideline No. 1.2-111)
TABLE OF CONTENTS
Page
Chapter 1.0 I n t r o d u c t i o n and Summary . . . . . . . . . 1-1
1.1 Need t o Regulate Equipment Leaks from Petroleum Ref iner ies . . . . . . . . . . . . . 1-2
1.2 Mon i to r ing and Main ta in ing Petroleum Ref inery Equipment . . . . . . . . . . . 1-2
Chapter 2.0 Sources and Types o f Ref inery Equipment Leaks . . 2-1
2.1 Sources o f VOC Emissions f rom Equipment Leaks . . 2-1
2.2 Magnitude o f VOC Emissions f rom Equipment Leaks . 2-2
2.3 References . . . . . . . . . . . . . 2-4
Chapter 3.0 Contro l o f Ref inery Equipment Leaks . . . . . 3-1
3.1 Mon i to r ing . . . . . . . . . . . . . 3-1
3.2 Maintenance . . . . . . . . . . . 3-3
3.3 References . . . . . . . . . . . . . 3-8
Chapter 4.0 Cost Analys is . . . . . . . . . . . . 4-1
4.1 I n t r o d u c t i o n . . . . . . . . 4-1
4.2 Contro l o f VOC Leaks from Ref iner ies . . . . 4-4
4.4 References . . . . . . . . . . . . . 4-13
Chapter 5.0 E f f e c t s o f Apply ing t h e Technology . . . . . 5-1
5.1 Impact o f a Mon i to r ing and Maintenance Program on VOC Emissions . . . . . . . . . . . 5-1
5.2 Other Environmental Impacts . . . . . . . 5-2
. . . . . . . . . . . . . 5-25.3 References
Page
Chapter 6.0 Enforcement Aspects . . . . . . . . . . 6-1
6.1 Af fec ted F a c i l i t y . . . . . . . . . . . 6-1
6.2 Format o f Regulat ion . . . . . . . . . . 6-1
6.3 Compl iance and Moni to r ing . . . . . . . . 6-2
Appendix A . Emission Source Test Data . . . A-1
Appendix B . Detec t ion o f VOC Leaks From Petroleum Ref inery Equipment . . . . . . . . B-1
Appendix C . Moni to r ing and Maintenance Manpower Requirements . C-1

Table 2-1
Table 3-1
Table 3-2
Table 4-1
Table 4-2
Table 4-3
Table 4-4
Table A-1
Table A-2
Table A-3
Table A-4
Table A-5
Table B-1
Table C-1
Table C-2
LIST OF TABLES
Page
D i s t r i b u t i o n o f Equipment Leak VOC Emissions f o r a Model Refinery . . . . . . . . . . . . . 2-3
Summary o f EPA and Indus t r y Equipment Leak Source Test Data . . . . . . . . . . . . 3-4
Summary o f Equipment Leak VOC Concentrat ion Versus Leak Rate L inear Regression Analys is . . . . . . 3-5
Technical Parameters Used i n Developing Contro l Costs . 4-3
Cost Parameters Used i n Computing Contro l Costs . . 4-5
Contro l Cost Estimates o f Mon i to r ing and Maintenance Program f o r Model E x i s t i n g Petroleum Ref inery Equipment Leaks . . . . . . . . . . . . . 4-8
Cost Estimates o f Typ ica l Seal O i 1 Reservoir Degassi ng Vent Contro l System . . . , . . . . 4-1 0
Summary o f Results o f Four EPA Tests . . . . . . A-4
Summary o f Ref inery A Tes t ing . . . . . . . . A - 5
Summary o f Ref inery B Tes t ing . . . . . . . . A-6
Summary o f Ref inery C Tes t ing . . . . . . . . A-7
Summary o f Ref inery D Tes t ing . . . . . . . . A-8
Mon i to r ing Instrument Performance C r i t e r i a . . . . B-2
Annual Mon i to r ing Manpower Requirements f o r Model 15,900 Cubic Meter Per Day Ref inery . . . . . . C-3
Annual Mai ntenance Manpower Requi rements f o r Model 15,900 Cubic Meter Per Day Ref inery . . . . . . C-4

LIST OF FIGURES
Page
F igure 3-1 VOC Concentrat ion Versus Leak Rate f o r Refinery Valves . . . ~ . . . . . . . . . . . .3-6
F igure 3-2 VOC Concentrat ion Versus Leak Rate f o r Ref inery Pumps . . . . . . . . . . . . . . . 3-7
F igure 6-1 Example Mon i to r ing Survey Log Sheet . . . . . 6-7
F igure 6-2 Example Refinery Leak Report . . . 6-8
F igure B-1 Zero and C a l i b r a t i o n D r i f t Determinat ion . . . . E-7 Figure B-2 C a l i b r a t i o n E r r o r Determinat ion . . . . . . . B-8
F igure B-3 Response Time Determinat ion . . . . . . . . B-9

ABBREVIATIONS AND CONVERSION FACTORS
EPA p o l i c y i s t o express a l l measurements i n agency documents i n
m e t r i c u n i t s . L i s t e d below a re abbrev ia t ions and convers ion f a c t o r s f o r
B r i t i s h equ iva len ts of m e t r i c u n i t s .
Abbrev ia t ions Conversion Factor
kg - k i logram kg X 2.2 = pound ( l b ) l b X 0 . 4 5 = kg
m3 - cub ic meter m3 X 6.29 = b a r r e l (bb l ) 3
bb l X0 .16 = m
m t o n - m e t r i c ton m t o n X 1.1 = s h o r t t on sho r t t o n X 0.91 = m t on
Mg - megagram Mg = m t on
kg/103rn3 - k i lograms per thousand cub i c meters
m3/day - cub ic meters per day
cm - cent imeters cm X 0.39 = inches
Frequent ly used measurements i n t h i s document
15,900 m3/day 1. 100,000 bbl /day
$100.60/m3 $16.00/bbl
5 cm % 2 inches
61 m 200 f e e t


1.0 INTRODUCTION AND SUMMARY
This document addresses the control of vola t i le organic cornpounds
(VOC) from equipment 1 eaks i n petroleum ref iner ies . Equi prnent considered
includes pump seals , compressor seals , seal oi 1 degassing vents, pi pel ine
valves, flanges and other connections, pressure re1 i ef devices, process
drains, and open ended pipes. VOC emitted from equipment leaks are
primarily Cg through C6 hydrocarbons which are photochemically reactive
(precursors to oxidants).
Methodology described i n t h i s document represents t h e presumptive
norm or reasonably available control technology (RACT) that can be
applied to existing petroleum refineries. RACT i s defined as t h e lowest
emission limit that a particular source is capable of meeting by t h e
application o f control technology that i s reasonably available considering
technological and economic feas ib i l i ty . I t may require technology that
has been applied t o similar, b u t not necessarily identical, source categories.
I t i s not intended tha t extensive research and development be conducted
before a given control technology can be applied t o the source. This does
not, however , preclude requiring a short-term evaluation program t o permit
the appl ica t ion of a given technology to a particular source. The l a t t e r
e f for t i s an appropriate technology-forcing aspect of RACT.

1.1 NEED TO REGULATE EQUIPMENT LEAKS FROM PETROLEUM REFINERIES
Contro l techniques gu ide l i nes are being prepared f o r source ca tegor ies
t h a t emi t s i g n i f i c a n t q u a n t i t i e s of a i r p o l l u t a n t s i n areas of t h e count ry
where Nat iona l Ambient A i r Qua1ity Standards (NAAQS) a re n o t being a t t a ined .
Equipment leaks i n petroleum r e f i n e r i e s a re a s i g n i f i c a n t source o f VOC and
tend t o be concentrated i n areas where t h e ox idan t NAAQS a re l i k e l y t o be
v io la ted .
Nat ionwide VOC emissions f rom equipment leaks i n petroleum r e f i n e r i e s
a r e p resen t l y est imated t o be 170,000 m e t r i c tons per year, o r about one
percent o f t he t o t a l VOC emissions f rom s t a t i o n a r y sources. The emission
f a c t o r s upon which these est imates a re based are p resen t l y being updated.
The t o t a l emission es t imate i s expected t o increase when t h e new f a c t o r s
become ava i lab le .
1.2 MONITORING AND MAINTAINING PETROLEUM REFINERY EQUIPMENT
The approach used i n t h i s document f o r c o n t r o l l i n g VOC leaks from
petroleum r e f i n e r y equipment i s d i c t a t e d by the na ture of t h e emissions.
There a r e many p o t e n t i a l l e a k sources--over 100,000 i n a very l a r g e
re f inery - -and l e a k r a t e s range over s i x orders o f magnitude. Leaks from
most o f t h e sources a r e i n s i g n i f i c a n t ; a smal l percentage o f t he sources
account f o r a m a j o r i t y o f t he t o t a l mass emissions. This s i t u a t i o n makes
i t d i f f i c u l t t o q u a n t i f y t he emissions, and h i g h l i g h t s t he importance o f
a mon i to r ing p lan t o e f f e c t i v e l y l o c a t e leaks so t h a t maintenance can be
performed.
Recent t e s t data show t h a t when a VOC concent ra t ion o f over 10,000
p a r t s per m i l l i o n (ppm) i s found i n p r o x i m i t y t o a p o t e n t i a l leak source,

the source i s leaking from one t o ten kilograms per day depending on the
type of source. If the leak were not located or repaired f o r a year, annual
emissions from th i s single source would be from 0.4 t o 3.7 metric tons of VOC.
The monitoring plan recommended includes annual, quarterly, and weekly
inspections. In the monitoring inspections the refinery operator w i 11 de-
termine the VOC concentration in proximity to each individual potential
leak source with a portable VOC detection instrument. If the VOC concen-
t ra t ion a t the source exceeds 10,000 ppm, the leak should be repaired
within f i f teen (15) days. The recomnended monitoring intervals are:
annual--pump seals , pipeline valves in liquid service, and process drains;
quarterly--compressor seals , pipeline valves in gas service, and pressure
re l ie f valves in gas service; weekly--visual inspection of pump seals;
and no individual monitoring--pipeline flanges and other connections, and
pressure re l ie f valves in liquid service. Whenever a liquid leak from a
pump seal i s observed during the visual inspection and whenever a re l ie f valve
vents t o atmosphere, the operator must immediately monitor the VOC concentration
o f tha t component. If a leak i s detected, the leak should be repaired within
f i f teen days. The manpower required t o perform the inspections i s approximately
1800 manhours per year for a 15,900 cubic meter per day refinery.
A portion of the components with concentrations i n excess of
10,000 ppm will not be able t o be repaired within f i f teen (15) days. The
refinery operator should report quarterly leaks tha t cannot be repaired within
th i s time frame and should make arrangements fo r th i s equipment to be
repaired during the next scheduled turnaround o r , i f unable t o bring a corn-
ponent into compliance, apply fo r a variance on an individual basis.

The approximate manpower required t o perform maintenance on leaking
equipment is 3800 manhours per year for a 15,900 cubic meter per day
refinery.

--
2.0 SOURCES AND TYPES OF REFINERY EQUIPMENT LEAKS
Petroleum refining represents a 1 arge potential source o f vol a t i 1 e
organic compound (VOC) emissions by virtue o f the large quantit ies of
petroleum 1 iquids refined and the intricacy of the refining processes.
The major sources o f refinery VOC emissions tha t have been addressed in
guide1 ine documents include f i xed roof storage tanks; vacuum producing
systems, wastewater separators, and process unit turnarounds; and gasoli
transfer operations. This chapter discusses equipment 1 eaks, another
s ignif icant source of VOC emissions for which controls previously have
been adequately defined.
2.1 SOURCES OF VOC EMISSIONS FROM EQUIPMENT LEAKS I
There are many types of equipment in petroleum ref iner ies tha t can I
develop leaks. Among these are pump seals , compressor seals , pipeline
valves, open-ended valves, flanges and other connections, pressure
r e l i e f devices and process drains. Most of these sources maintain the i r
sea l ing effect through proper mating of two sealing surfaces. These seal i ng
surfaces include compressed packings, gaskets, f inely machined surfaces
(as in mechanical s ea l s ) , and seats (as i n pressure re1 ief devices). If
these seals are not properly designed, constructed, instal led, and mainta .ined, they
can degrade to the point where the i r ab i l i t y t o seal i s reduced. As t h i s process
continues, the leaking equipment becomes a significant source of VOC emis sions. In
addition t o sealing fa i lures , open-ended valves that are not completely
shut off (such as a sample tap or bleed valve) and process drains which
are not properly designed or operated can also emit VOC to atmosphere.
2- 1

1
2.2 MAGNITUDE OF VOC EMISSIONS FROM EQUIPMENT LEAKS
Many studies have been undertaken t o determine t h e magnitude o f VOC
emissions from equipment leaks. About twenty years ago, a J o i n t P ro jec t
was undertaken t o q u a n t i f y a l l emissions from r e f i n e r i e s i n the Los Angeles
a i r basin. The emission f a c t o r s t h a t r e s u l t e d from t h i s study a re c u r r e n t l y
used t o est imate the VOC emissions from re f i ne r ies . Radian Corporat ion
has been contracted by EPA t o update r e f i n e r y emission f a c t o r s t o t h e present
s t a t e o f t h e a r t . This study i s incomplete and thus t h e i r p re l im ina ry data
cannot be c i t ed . Results should be a v a i l a b l e i n l a t e 1978 o r e a r l y 1979.
5L i n i t e d t e s t i n g has been performed by KVB, ~ n c o r ~ o r a t e d ; ~i n d u s t r y;
Meteor01 ogy Research, Incorporated ; 6 y 7 and EPA, b u t none o f these t e s t s have
y ie lded new emission factors.
Recent t e s t s have shown t h a t most r e f i n e r y equipment have low leak
ra tes and t h a t t he small percentage o f equipment w i t h h igh leak r a t e s accounts
f o r a l a rge p a r t of t he t o t a l VOC emitted. Table 2-1 presents p re l im ina ry
data from t h e Radian study t h a t i l l u s t r a t e s t h i s point .8 I n every
case a small percentage o f t h e sources emit about 90 percent
o f the emissions. The t e s t program undertaken by KVB, Incorporated, under
con t rac t w i t h C a l i f o r n i a A i r Resources Board a l so found t h i s t o be the case. 9
This leads t o the conclus ion t h a t t he key t o c o n t r o l l i n g VOC emissions from
equipment leaks i s developing an e f f e c t i v e moni to r ing and maintenance
program t o l oca te t h i s small percentage of t he t o t a l equipment w i t h h igh
leak ra tes so t h a t repa i r s can be scheduled.

TABLE 2-1. DISTRIBUTION OF EQUIPMENT LEAK VOC EMISSIONS FOR
COMPONENTS PERCENT OF NUMBER OF WITH 90% TOTAL REFINERY
COMPONENT COMPONENTS OF EMISSIONS~ LEAK EMISSIONS .
Pump Seals 250 23
Compressor Seals 14 2
P i p e l i n e Valves 25,500 765
Process Drains 1,400 56
Pressure R e l i e f 130 7 Valves
F l anges 64,000 640
a Based on ac tua l sampling o f equipment i n s i x r e f i n e r i e s by Radian Corporat ion (Reference 3 ) and a model 15,900 cubic meter per day r e f i n e r y .
b Ninety percent o f t he t o t a l mass emissions are emit ted by the l i s t e d number of the components.

2.3 REFERENCES
1. " J o i n t D i s t r i c t , Federal and Sta te P r o j e c t f o r t h e Eva lua t ion o f
Ref inery Emissions, " Los Angeles County A i r P o l l u t i o n Contro l D i s t r i c t ,
Nine Reports. 1957 - 1958.
2. "Compi la t ion o f A i r P o l l u t a n t Emission Factors," Second Ed i t i on ,
AP-42, U.S. Environmental P r o t e c t i o n Agency, Ap r i 1, 1973.
3. "Assessment of Environmental Emissions from O i l Ref in ing," Radian
Corporat ion, EPA Contract No. 68-02-2665, i n progress, March, 1976 t o
March, 1979.
4. Personal communication between Harold J. Taback, KVB, Incorporated,
and K.C. Hustvedt, U.S. EPA, memo t o t h e f i l e s dated March 10, 1978.
5. L e t t e r w i t h attachments f rom J.M. Johnson, Exxon Company, U.S.A.
t o Robert T. Walsh, U.S. EPA, ESED, CPB, J u l y 28, 1977.
6. L e t t e r w i t h attachments from B. F. Ba l l a rd , P h i l l i p s Petroleum .
Company, t o W i l l i a m Stewart, Texas A i r Contro l Board, September 8, 1977.
7. Personal communication between Paul Harr ison, Meteorology
Research, Incorporated, and K.C. Hustvedt, U.S. EPA, memo t o James F. Durham,
dated January 18, 1978.
8. "Assessment o f Environmental Emissions f rom O i l Ref ining,"
op c i t .
9. Taback, op c i t .

--
3.0 CONTROL OF REFINERY EQUIPMENT LEAKS
There are two phases t o c o n t r o l l i n g v o l a t i l e organic compound ( V O C )
emissions from equipment leaks; f i r s t , t h e leaks must be loca ted (moni tor ing) ,
and then t h e l eak must be repa i red (maintenance). This chapter discusses
bo th phases. The manhour requirements o f app ly ing the mon i to r ing and
maintenance program a r e presented i n Appendix C, cos ts i n Chapter 4, and
environmental e f f e c t s i n Chapter 5.
3.1 MONITORING
There are many types o f mon i to r ing t h a t may be e f f e c t i v e i n reducing
emissions o f VOC t o atmosphere. These i nc lude i n d i v i d u a l source moni t o r i n g ,
u n i t walkthrough moni tor ing, and mu1 t i p l e f i x e d - p o i n t moni tor ing. Only
i n d i v i d u a l source mon i to r ing has been evaluated s u f f i c i e n t l y t o determine
i t s e f f ec t i veness and w i l l t h e r e f o r e be the on ly technique discussed below.
3.1.1 I n d i v i d u a l Source Mon i to r ing
Each type o f equipment l i s t e d i n Chapter 2 can be monitored f o r leaks
by sampling t h e ambient a i r i n p r o x i m i t y t o t h e p o t e n t i a l l e a k p o i n t w i t h
a po r tab le VOC d e t e c t i o n inst rument . Both the recornended inst rument and
mon i to r ing techniques f o r each type o f equipment are descr ibed i n Appendix B.
Rout ine mon i to r ing o f every p o t e n t i a l leak source i n t h i s manner w i l l ensure
t h a t a l l leaks i n t h e r e f i n e r y a re located, thus a l l ow ing maintenance t o be
scheduled as necessary.
I n o rder t o develop a mon i to r ing p lan f o r equipment leaks, one must
f i r s t def ine what c o n s t i t u t e s an equipment leak. Tests were performed by
Radian Corporat ion i n f o u r r e f i n e r i e s on equipment t h a t had a VOC

1 concen t ra t i on o f over 10,000 p a r t s per m i l l i o n (ppm) a t t h e seal i n t e r f ace .
I n t h e 166 t e s t s Radian performed, t h e average l e a k r a t e was 5.6 k i lograms
pe r day (kg/day) w i t h l e a k r a t e s rang ing f rom 1.0 t o 10.1 kg/day f o r t h e
d i f f e r e n t types o f equipment. Th i s i s a s i g n i f i c a n t l e a k r a t e , averaging
over 2 m e t r i c tons per year per source. I f t h i s l e a k i n g equipment were
l o c a t e d and repa i red , an app rec iab le r e d u c t i o n i n V O C emissions would r e s u l t .
Table 3-1 shows t h e i nc i dence of leaks f o r d i f f e r e n t types of r e f i n e r y
equipment as found i n EPA and i n d u s t r y source t e s t s . Here aga in i t i s
shown t h a t a smal l percentage o f t h e sources leak . Th is t a b l e i s used i n
Appendix C t o determine t h e manpower requi rements f o r r e p a i r i n g l e a k i n g
equipment. I n t h e EPA and i n d u s t r y t e s t s a l e a k i n g component i s de f i ned as one
havincl a VOC concen t ra t i on over 1000 p a r t s p e r m i l l i o n (ppm) a t a d i s tance of - 5
cen t imete rs (cm) from t h e p o t e n t i a l l e a k source. I n t h i s document, however,
a l e a k i n g component has a VOC c o n c e n t r a t i o n of over 10,000 pprn a t t h e p o t e n t i a l
l e a k source ( 0 cm). I t has been shown i n t h e t e s t s performed by Radian
Corpora t ion and Meteoro logy Research t h a t these two va lues are equ i va len t .
Table 3-2 summarizes l o g - l o g l i n e a r r eg ress ion analyses t h a t were performed
by Radian f o r equipment t o t a l l e a k r a t e versus VOC concen t ra t i on a t a g i ven
d i s t a n c e f rom pump seals , compressor sea ls and va lves. F igures 3-1 and 3-2
a r e t h e ac tua l r e l a t i o n s t h a t t h e analyses p r e d i c t s f o r va lves and pumps,
r e s p e c t i v e l y . There a r e fewer sources sampled a t t h e 5 cm d i s t a n c e
because t h i s a n a l y s i s was n o t i n i t i a t e d u n t i l a f t e r t h e sampl ing was underway.
Th i s a n a l y s i s shows t h a t a V O C concen t ra t i on o f 1000 ppm a t 5 cm and 10,000 ppm
a t 0 cm rep resen t e q u i v a l e n t emiss ion r a t e s so t h e l e a k r a t e i nc i dence da ta
shown i n Table 3-1 i s v a l i d f o r bo th l e a k d e f i n i t i o n s .

3.1.2 Visual Inspection
As a supplement to individual source monitoring with a portable VOC
detection device, visual inspections can be performed to detect evidence
o f liquid leakage from pump seals. When visual evidence of liquid leakage
from a pump seal is observed, the operator should immediately obtain a
portable VOC detection instrument and monitor the component as out 1 ined
in Appendix B. If the component is found to be leaking, i .e., a VOC
concentration over 10,000 ppm, maintenance should be scheduled. All liquid
leaks will not necessarily result in a reading greater than 10,000 ppm.
3.2 MAINTENANCE
When leaks are located by either monitoring method described in
Section 3.1, the leaking component must then be repaired or replaced.
Many components can be serviced on-line and this is generally regarded
as routine maintenance to keep operating equipment functioning properly.
Equipment failure, as indicated by a leak which servicing does not
eliminate, requires isolation of the faulty equipment for either
repair or replacement. This will normally result in a temporary increase
in emissions to atmosphere,

c
TABLE 3 - 1 . SUMMARY OF E P A ~AND INDUSTRY~ EQUIPMENT LEAK
SOURCE TEST DATA
Number of percentc Emission Source Sources Tested Leaking
Pump Seals 521 12
Compressor Seals 29 7
P i p e l i n e Valves 1350
Drains 369
Pressure Re l i e f Devices 1 5d
a Four EPA source t e s t s descr ibed i n Appendix A.
b One i n d u s t r y t e s t (Reference 1).
Concentrat ion over 1000 pprn a t 5 cent imeters (equ iva len t 10,000 ppm a t t h e source),
d Not a rep resen ta t i ve sample.
e I n t h e J o i n t P r o j e c t (Reference 3 ) a leak was def ined as a concent ra t ion over t h e lower exp los ive l i m i t i n s i d e the horn and i n t h a t s tudy 20 percent o f t h e sources leaked. Th is va lue i s used i n t h e ana l ys i s i n Appendix C.

- - -
TABLE 3-2. SUMMARY OF EQUIPMENT LEAK V O C CONCENTRATION VERSUS
LEAK RATE LINEAR REGRESSION ANALYSIS a
Emission Source Concentrat ion b Predicted Number of Co r re la t i on ( P P ~ Emissions
(kg/day) Sources Sampled
Coeffic i en t
Pump Seals
Compressor Seal s 10,000 @ 0 cm 0.70 19 0.551 d
1,000 @ 5 crn
Valves 10,000 @ 0 cm 0.19 191 0.635
Based on data from f o u r r e f i n e r y t e s t s by Radian Corporat ion (Reference 4)
The maximum concent ra t ion found a t t he 1 i s t e d d i s tance from t h e p o t e n t i a l l eak source
The emission r a t e p red i c ted by t h e l i n e a r regress ion equat ion f o r a leak a t t h e given concentrat ion. The average emission r a t e f o r a l l leaks greater than t h e given concentrat ion would be approximately one order of magnitude h i gher.
A v a l i d sample o f VOC concentrat ions a t 5 cm from compressor seals was n o t avai 1 able.


'100 1000 10,000
Maximum VOC Concentrat ion ( p a r t s p e r m i 11i o n )
FIGURE 3-2. VOC CONCENTRATION VERSUS LEAK RATE FOR REFINERY PUMP SEALS

3:-3 REFERENCES
1. "Assessment of Environmental Emissions from O i 1 Re f i n ing,"
Radian Corporat ion, EPA Contract No. 68-02-2665, I n t e r i m Report e n t i t l e d ,
"Emission Data - Four Ref iner ies , " November 30, 1977.
2. L e t t e r w i t h attachments f rom J. M. Johnson, Exxon Company, U.S.A.
t o Robert T. Walsh, U.S. EPA, J u l y 28, 7977.
3. " J o i n t D i s t r i c t , Federal and S ta te P r o j e c t f o r t h e Eva lua t ion
o f Ref inery Emissions," Los Angeles County A i r P o l l u t i o n Contro l D i s t r i c t .
Nine Reports. 1957 - 1958.
4. "Assessment o f Environmental Emissions f rom O i l Ref in ing,"
Radian corpora t ion , EPA Cont rac t No. 68-02-2665, I n t e r i m Report e n t i t l e d ,
"Data Analys is and Summaries," January 19, 1978.
5. Personal communication between Paul Harr ison, Meteorology
Research, Incorporated, and K.C. Hustvedt, U.S. EPA, memo t o James F. Durham,
dated January 18, 1978.

4.0 COST ARALYSIS
4.1 INTROCUCTIOE
4.1 .1 Purpose
The purpose of this chapter is to present estimated costs for control of
vclatil e organic compound (VOC) emissicns from equipment leaks at existing
petroleum refineries.
4.1.2 Scope
Estimates of capital and annualized costs are present ed for controlling
emissions from equipment leaks at existing petroleum refineries . The major
sources of VOC emissions that are ccnsidered in this chapter include process
drains; pipe1 i ne valves, flanges, connections and fittings; pump and compres-
sor seals; pressure re1 ief devices; and sampl ing connections. The recommended
control technique to substantially reduce equipment leaks is a monitoring and
maintenance program. Control costs are developed for a model existing medium
size refinery with a throughput of 15,900 m3/day. These costs are based on
the use of two (2) monitoring instruments and the leak detection and mainte-
nance procedures specified in Chapter 6, Costs are also presented for a
typical seal oil reservoir degassing vent control system, which may be re-
quired to bring this source of VOC emissions into compliance. Since emission
reductions are not presently quantifiable, recovered product credits and
cost-effectiveness measures have not been determined. However, a simple
procedure i s presented that may be used to determi~e recovery credits a d
c~st-effectiveness when new refinery emission factors become available.
4.1.3 Use of Model Refinery
Petroleum refineries vary considerably as to size, configuration and
age of facilities, product mix, and degree of control. Because of the v a r i -
ation amcng plants, thSs c a t analysis is based on a model m e d i ~ ms i z e
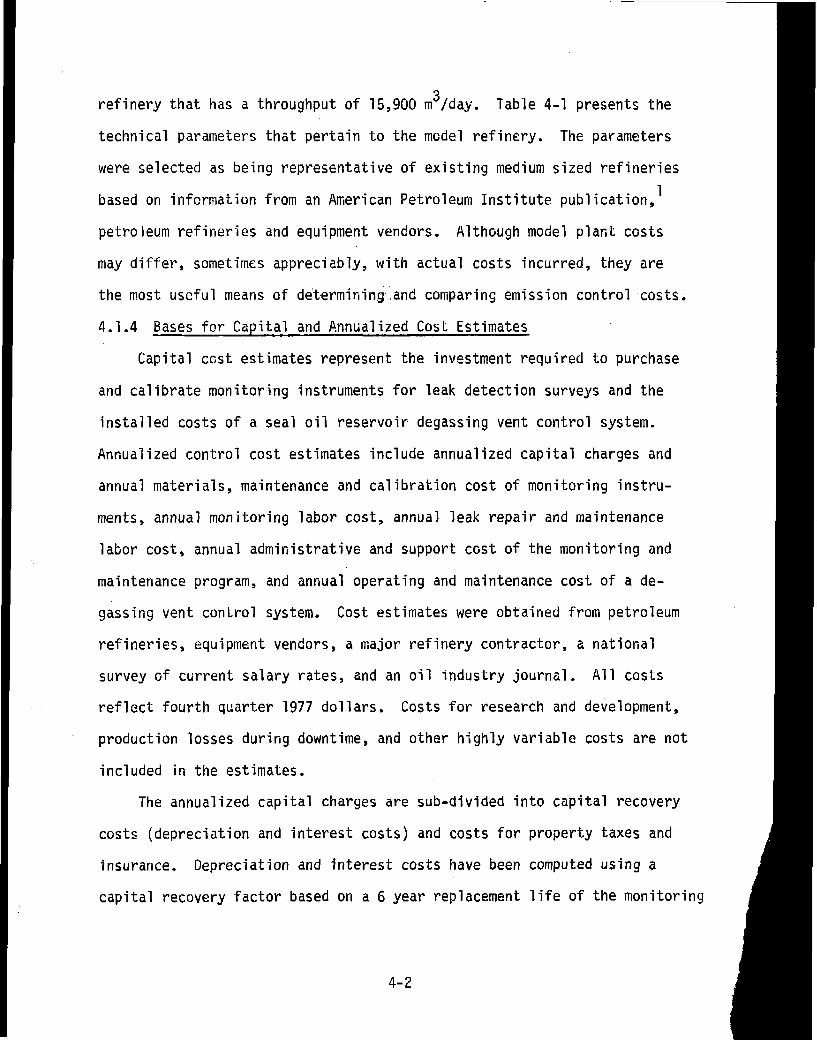
3refinery that has a throughput of 15,900 m /day. Table 4-1 presents the
technical parameters th&t pertain to the mcdel refinery. The parameters
were selected as being representative of existing medium sized refineries
based on information from an Atxerican Petroleum Institute pub1 ication, 1
petroleum refineries and equipment vendors. Alth~ugh model plant cats
may differ, sometimes apprecizbly, with actual costs incurred, they are
the most useful means o f determining, and comparing emission control costs.
4.1.4 Bases far Capital and Annualized Cost Estimates
Capital c ~ s t estimates represent the investment required to purchase
and calibrate monitoring instruments for leak detection surveys and the
installed costs of a seal oil reservoir degassing vent control system.
Annualized control cost estimates include annualized capital charges and
annual materials, maintenance and calibration cost of monitoring instru-
ments, annual monitoring labor cost, annual leak repair and maintenance
labor cost, annual administrative and support c a t of the monitoring and
maintenance program, and annual operating and maintenance cost of a de-
gassing vent control system. Cost estimates were obtained from petroleum
refineries, equipment vendors, a major refinery contractor, a national
survey o f current salary rates, and an oi 1 industry journcil . A11 costs
ref1ect fourth quarter 1977 do1 1ars. Costs for research and development,
production losses during downtime, and other highly variable costs are not
included in the estimates.
The annualized capital charges are sub-divided into capital recovery
costs (depreciation and interest costs) and costs for property taxes and
insurance. Depreciation and interest costs have been computed using a
capital recovery factor based on a 6 year replacement life of the monitoring

Table 4-1. TECHNICAL PARAMETERS USED I N DEVELOPING CONTROL C O S T S ~
I. Refinery Throuqhput:
15,900 m3/day
11. Operating Factor: b
365 days per year
I I I. Monitoring and Maintenance Program:
A, Recommended Emission Monitoring Procedures per Section 6.3 and Appendix B.
0 . Recommended Monitoring Instruments per Appendix B.
C. Number o f Monitoring ~nstruments:~ 2
D.. Estimated Monitoring Manhours per year. .dye 1800
E, Estimated Maintenance and Repair Manhours ;zr year. . d , f 3800
bIV. Seal Oil Reservoir Degassing Vent Control System:
Pipi~g: 61.0 m length, 5.1 cm dia., carbon steel.
Valves: 3 plug type, 5.1 cm dia., cast steel.
Flame Arrestor: One metal gauze type, 5.1 cm dia.
V . Average Density of Recovered product :g
aExcept as noted, parameter values are take^ from Chapters 2 and 3. b~~~ estimate.
'~eference 2; one monitoring instrument needed for the refinery, and one instrument needed for the tank farm and as a back-up instrument.
d ~ e rReference 3 and EPA estimate as discussed in Appendix C. eBased on two person teams (except for the visual pump seal inspection) performing the leak detection surveys.
CI Includes initial leak repair and on-going maintenance.
g~eference4, product that would have leaked but does not escape because the leaks are repaired; saved product assumed to be equivalent to gasol ine.

instruments and a 10 year life of the degassing vent control system and an
interest rate of 10% per annum. Costs for property taxes and insurance
are computed at 4% of the capital costs. All annualized costs are for
one year periods commencing with the first quarter of 1978.
4.2 CONTROL OF VOC LEAKS FROM REFINERIES
4.2.1 Model Cost Parameters
The major sources of VOC leaks from petroleum refinery equipment include
process drains; pipe1 itie valves, f1 anges and other pipe connections; pump
and cmpressor seals; pressure relief devices; and sampling connections.
The recommended control techniques to reduce VOC emissi~ns from equipment
leaks are a monitoring (leak detection) atid maintenance (leak repair) program
and, when necessary, a seal oil reservoir degassing vent control system. Cos
parameters used i n computing emission control costs are shown i n 'rable 4-2.
These parameters pertain to the medium size model refinery and are based on
actual cost/price data from petroleum refineries, 3 a 5 a 6 ~ 7 ~ 8 s 9 equipment ven-
dors, 10311a15,16survey of current salary rates, l2 an oil industry jour- a
nal, l3 a major refinery contractor, l4 and €PA estimates.
4.2.2 Control Costs of Monitoring and Maintenance Program
Table 4-3 presents the estimated costs of controlling VOC leaks from
equipment of the model medium size petroleum refinery. The costs are based
on the use of two (2) portable organic vapor analyzers that are suitably
equipped and calibrated for monitoring VOC emission leaks. These devices
operate on the flame ionization detection principle and are certified safe 1 1
for use in hazardous locations by Factory Mutual Research Corporation.
Except for the visual pump seal inspections, the estimated monitoring labor
costs are calculated assuming two (2) person survey teams. For the purpose
of determining costs, an Instrument Technician and a Junior Chemical

Table 4-2. COST PARAMETERS USED IN COMPUTING CONTROL COSTS
I. Monitorino ~nstruments:~
Purchased Equipment Cost: $8,800
Annual Materials, aintenance, and Calibration Cost: I!? $2,500
Equipment Replacement ~ i f e : ~ 6 years Battery Pack Rep1 acement Life: 1 year
11. Annual ized Capital Charges ~ a c t o r s : ~
Annual Interest Rate: 10%
Property Taxes and Insurance Charge: 4% of Capital Cost
111, Monitoring (Leak Detection) Labor Costs:
Annual Monitoring Manhours: d 1800
Weighted Average Labor ate:@ $14,00/hour
IV. Leak Repair and Maintenance Labor Costs:
Annual Leak Repair and Maintenance Manhours :d 3800
Average Labor Rate: f
V. Annual Administrative and Support Cost o f Monitoring and Maintenance Program: 9
40% of the sum cf 111. and IV. costs.
VI. Seal Oil Reservoir Degassing Vent Control System:
Carbon Steel Piping: h
Installed Capital Cost: $2400
Annual Operating and Maintenance cost:' 5% of Installed Capital Cost
L i f e : 10 years

Table 4-2 (continued)
Plug Type ~alves:~
Specification: WCB ASTM A216-60
Purchase Price: $140 each
Installation cost:' 10 hr each @ $14.00/hr.
Annual Operating and Maintenance Cost: 15% of Installed Capital Cost
Life: 10 years
Metal Gauze Flame ~rrestor:~
Specificaticn: Model 4950; ductile iron with 4.8 mrn stainless steel grid
Purchase Price: $260
Installation Cost: 10 hr @ $14.00/hr
Annual Operating and Maintenance cost: 15% of Installed Capital Cost
Life: 10 years kVII. Recovered Product Value :
$100.60/m3
a~eferences2, 10 and 11; costs based on the use of two (2) Century Systems Corp. Model OVA-108 Portable Organic Vapor Analyzers. b~ased on the following usages per monitoring instrument per year: one (1)battery pack, and two (2) filter packs. '€PA est irnate. d~eference3 and EPA estimate as discussed in Appendix C. e~eferences3, 5, 6, 7, 8, 9 and 12; weighted average labor rate of two (2) persurvey team(s) , consisting of an Instrument Technician and a Junior Chemical Engineer; includes wages and salary plus an additional 40% for labor related costs to refineries. An Instrument Technician and a Junior Chemical Engineer are assumed for cost purposes; the number and types of personnel actually assi the monitoring functions will be determined by the respective refineries.
f~eferences3, 5, 6, 7, 8 and 9; average labor rate of refinery maintenance personnel; includes wages plus an additional 40 percent for labor related costs to refineries.

Table 4-2 (continued)
g~eference3 and EPA estimate; includes costs of data reduction and analysis and report preparation.
h~eference14.
~ e f erence 15.
j ~ e f erence 16.
k~verage gas01 ine value based on price data from Reference 13 and the Wall Street Journal, October 20, 21, and 24, 1977 and February 15, 16, and 17, 1978.

Table 4-3. CONTROL COST ESTIMATES OF MONITORING AND MAINTENANCE PROGRAM FOR MODEL EXISTING PETROLEUM REFINERY EQUIPMENT LEAKS
Throughput
Control Techr~i que Monitoring and Maintenance Program
Instrument Capital Cost ($000)~ 8.8
Annual imed Instrument Capital Charges ($000)b 2.4
Annual Instrument Materials, Maintenance, and Calibration Costs ($000)a~c 2-5
Annual Monitoring Labor Costs ($000)d 25.2
Annual Maintenance Labor Costs ($000)~ 53.2 fAnnual Administrative and Support Costs ($000) 31.7
Total Annualized Costs ($000)~'~ 115.0
a~eferences2, 10 and 11; costs bzsed on the use o f two (2) Century Systems Corp. Model OVA-108 Portable Organic Vapor Analyzers. b~apital recovery costs (using capital recovery factor with 10% anoual interest rate and 6 year instrument life) plus 4% of czpital cost for property taxes and insurance.
'EPA estimate. d~stimated monitoring man-hours per Reference 3 and EPA estimate; weighted average labor rate of two person survey team(s) consisting of an Instrument Technician and a Junior Chemical Engineer per References 3, 5, 6, 7, 8, 9 and 12. e~stirnated leak repair and maintenance man-hours per Reference 3 and EPA estimate; average maintenance labor rate per References 3, 5, 6, 7, 8, and 9.
f~eference3. g~otal Annualized Costs are the sum of Annualized Instrument Capital Charges; An Instrument Materials, Maintenance and Calibration Costs; Annual Monitoring Laba Costs; Annual Maintenance Labor Costs ; and Annual Administrative and Support Co h~redits for recovered (saved) product are not - included in these costs .

Engineer are assumed to perform the recormended monitoring. The number and
types of personnel actually assigned the monitoring functions will be deter-
mined by the respective refineries. The estimated maintenance labor costs
include both initial and on-going leak repair and maintenance.
From Table 4-3, it should be noted that the recommended monitoring and
maintenance program for the model medium size refinery has an estimated
capital cost of $8,800 and a total annualized cost of $115,000, not including
recovery credits from reduced emissions. Recovery credits would, of course,
reduce the total annualized cost of control. Since these estimates are
expected costs'cf typical medium sized refineries, the control costs of actual
refineries may vary from the estimates, depending upon refinery size, con-
figuration, age, condition, and degree of control.
4 .2 .3 Control Costs o f Seal Oil Reservoir Degassing Vent System
Another potential source of VOC emissions are seal oil reservoir de-
gassing vents (refer to Section 6.3.2). In order to bring such a source
into compliance with the concentration lirits, a refinery may be required to
install one or more control systems, Table 4-4 presents the estimated costs
of a typical seal oil reservoir degassirig vent control system. The techriical
parameters and cost parameters of the typical degassing vent control system
are shown in Tables 4-1 and 4-2, respectively. From Table 4-4,it can be seen that t he typical degassing vent contro ' 1
system has an estimated installed capi ta,I cost of $3,700 and a total annua , liied
cost of $1,200. These costs are based on the emissions being piped to an ex-
isting heater fire box with no-rl'redit allowed for the fuel value of the VOC.
Recovered fuel credits would, of course, reduce the total annualized cost of
control. Alternately, the VOC emissions may be piped to an existing flare
system at slightly lower expected contro1 costs; however, there will be no
reccvery of the fuel value.
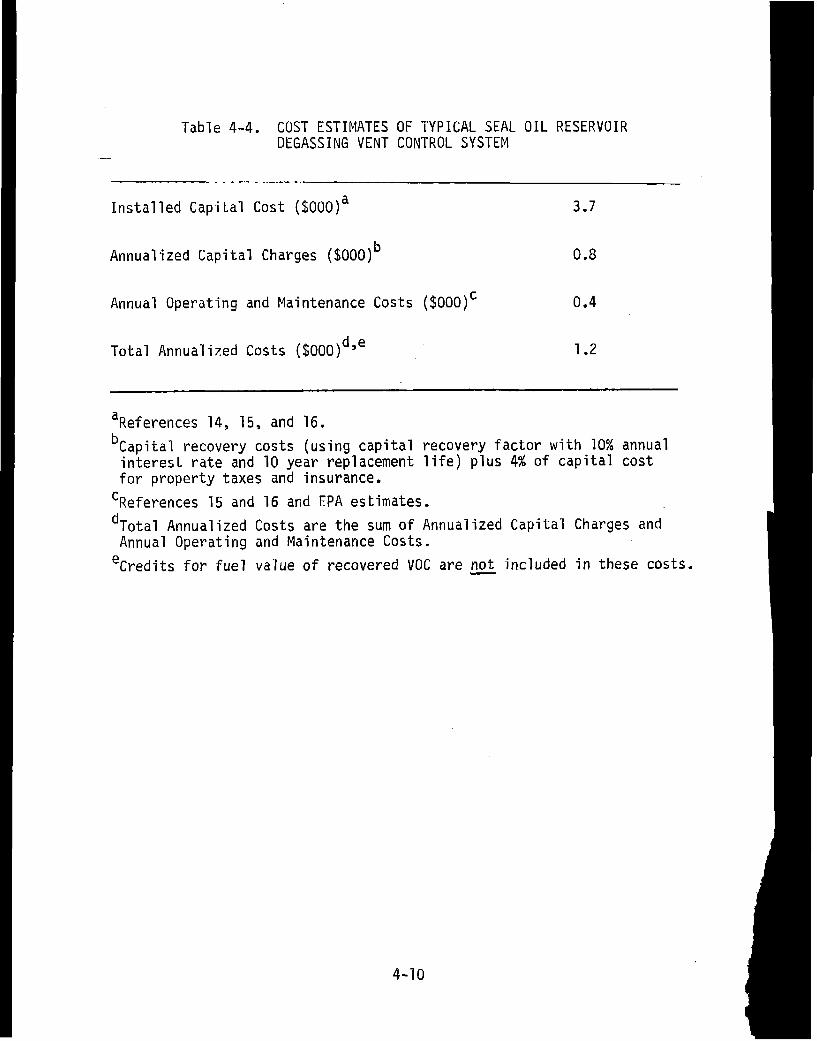
Table 4-4. COST ESTIMATES OF TYPICAL SEAL OIL RESERVOIR DEGASSING VENT CONTROL SYSTEM
Instal led Capital Cost ($000)~ 3 .7
Annualized Capital Charges ($000)b 0.8
Annual Operating and Maintenance Costs ($000)' 0.4
Total Annualized Costs ($000)~~~ 1.2
a~eferences14, 15, and 16. b~apital recovery costs (using capital recovery factor with 10% annual interest rate and 10 year replacement life) plus 4% of capital cost for property taxes and insurance. '~eferences 15 and 16 and EPA estimates. d~otal Annualized Costs are the sum of Annualized Capital Charges and Annual Operating and Maintenance Costs.
note~redits for fuel value of recovered VOC are - included in these costs.

4.3 COST-EFFECTIVENESS
Since emission reduction factors are not presently quantifiable, recovered
product credits (savings) cannot be calculated and cost effectiveness measures,
such -as $ per Mg, have not been determined. However, assuming that the re-
covered (saved) product value is $150/Mg*, it would require an emission reduc-
tion of about 767 Mg per year for the total value of recovered product to be
equal to the total annualized cost of the monitoring and maintenance program.
In this special case, the cost effectiveness would be $0.0 per Mg o f reduced
emissions. Thus, an emission reduction greater than 767 Mg/year will result
in a net credit (szvings) while an emission reduction less than 767 Mglyear
will be a net cost.
A simple three-step procedure is presented below that may be used to
determine recovered product credits and cost effectiveness ratios of the
monitoring and maintenance program when Kew refinery emissio~ factors become
available. This procedure i s illustrated for a hypothetical emissicn reduc-
tion o f 500 Mg/y~ar for the model refinery.
Step 1:
Annual Product Recovery Credits = (Ann~al Emission Reduction) x
(Recovered Product Value) = (500Mg/yr) ($150/Mg) = $75,003/yr.
Step 2:
Total Annualized Cost = $115,000 - (Annual Product Recovery Credits) =
Step 3:
IAnnual tmissionReduciion)-*Cost Effectiveness = Total Annualized Cost - S4O OoO = $ 8 0 / ~ ~

The cost-effectiveness of each seal oil reservoir degassing vent control
system will vary with the particular situation, so quantitative C-E values
cannot be presented in this guideline. But, whether or not such a control
system is used should be based on zn analysis that takes into account the
potential emission reduction and the cost and technical feasfbility of
bringing t he source irito compliance with the concentration limitation.

4,4 REFERENCES FOR CHAPTER 4.0
1. "Hydrocarbon Emissions from Refineries", American Petroleum Institute Pub1 ication No, 928, July, 1973.
2. K. C. Hustvedt, U.S. EPA. Memo to R. A. Quaney, dated March 6, 1978.
3. J. M. Johnson, Exxon Co:, U.S.A. Letter to R. T. Walsh, U.S. EPA, with attached studies of monitoring and maintenance program manpower require- ments, dated July 28, 1977.
4. AP-42, Supplement No. 7, pg. 4.3-7.
5. Personal communication with L. Sturrock, Phillips Petroleum Co., Bartlesville, Okla. Memo to be file b.y R.A. Quaney, U.S. EPA, dated February 24, 1978.
6. Personal communication with F. Roan, Gulf Oil Co., Philadelphia, Penn. Memo to file by R. A. Quaney, U.S. EPA, dated May 24, 1978.
7. Personal communication with P. Thomas, Ashland Oil- Co., Kentucky. Memo to file by R. A. Quaney, U.S. EPA, dated May 24, 1978.
I 8. E. D. Blum, Union Oil Co. of California, Los Angeles, Calif. Letter
to R. A. Quaney, U S . EPA, dated June 8, 1978.
I 9, Personal communication with B. Beyaert, Chevron U.S.A., San Francisco, Calif. Memo to file by R. A. Quaney, U S , EPA, dated June 9, 1978.
10. Personal communication with W. C. Hood, Century Systems Corp., Arkansas City, Kansas. Memo to file by R , H. Schippers dated July 13, 1977. Personal communication with J. Dickey, Century Systems Corp., Arkansas City, Kansas. Memo to file by R , A. Quaney dated February 14, 1978.
11. Organic Vapor Analyzer Specifications (CS-07907217) and Price List (PL-038-7751), Century Systems Corp., Arkansas City, Kansas, 1977.
12, Personal communication with R. Tew, Director of Career Planning and Placement, North Carolina State University, Raleigh, N.C, Memo to file by R. A. Quaney dated February 27, 1978.
13. "Refined-products prices", Oil and Gas Journal, October 17, 1977 and March 6, 1978.
14. Personal communications with W. Shoemaker, Fluor Corporation, Irvine,
I Calif. Memo to file by R. A. Quaney, 9.5. EPA, dated October 4, 1977. Memo to file by R. H. Schippers, U.S. EPA, dated July 18, 1977.
4-13
'
15. Personal corcmunication w i t h T. Norton, U n i ~ nPump Co., B a t t l e Creek, Michigan. Memo t o f i l e by R. A. Quaney, U.S. €PA, dated October 3, 1977.
16, Person21 comrncnication w i t h J. Columbus, P ro tec to Seal Co., Bensenvi l le , I l l i n o i s . Memo t o f i l e by R. A. Quaney, U.S. €PA, dated October 3, 1977.
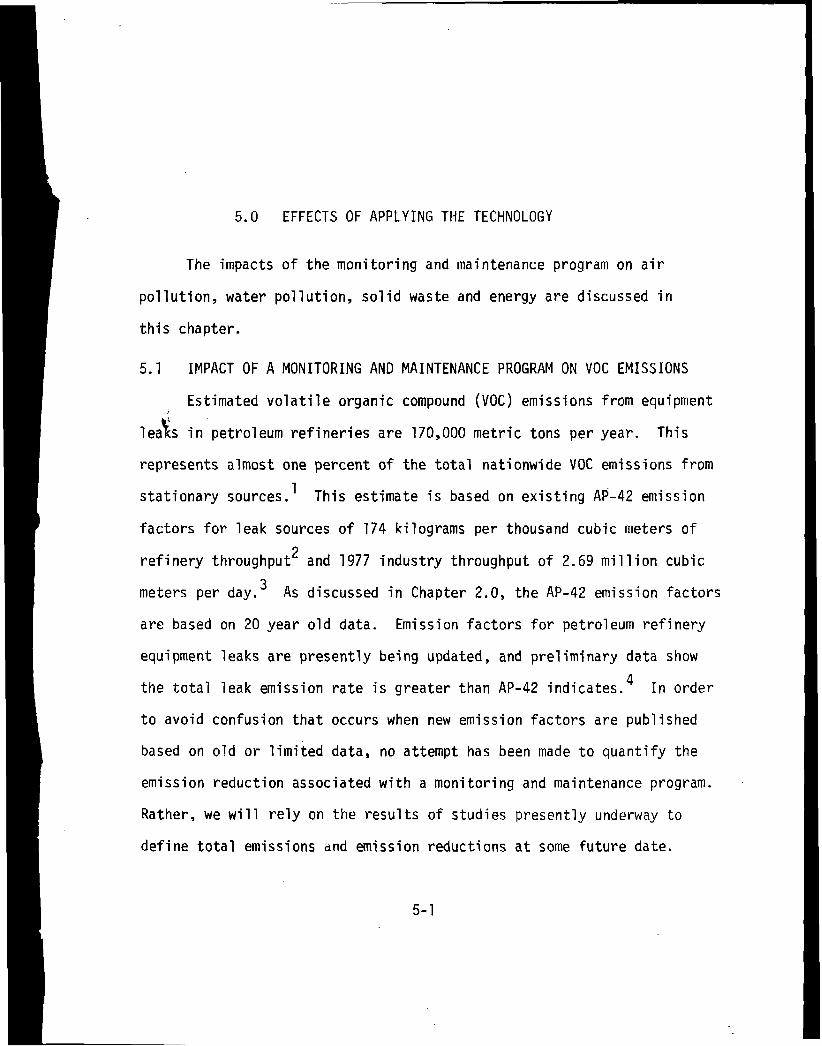
5.0 EFFECTS OF APPLYING THE TECHNOLOGY
The impacts of t h e monitor ing and maintenance program on a i r
p o l l u t i o n , water p o l l u t i o n , s o l i d waste and energy a r e d i scussed i n
t h i s chapter .
5.1 IMPACT OF A MONITORING AND MAINTENANCE PROGRAM ON VOC EMISSIONS
Estimated v o l a t i 1 e organic compound (VOC) emissions from equipment
lea% i n petroleum r e f i n e r i e s a r e 170,000 metric tons per yea r . This
r e p r e s e n t s almost one pe rcen t o f the t o t a l nationwide VOC emissions from
s t a t i o n a r y sources . ' This estimate i s based on e x i s t i n g AP-42 emission
f a c t o r s f o r l eak sources of 174 kilograms per thousand cubic meters of
r e f i n e r y throughput 2 and 1977 indus t ry throughput of 2.69 m i l l i o n cubic
meters per day.3 As discussed i n Chapter 2.0, the AP-42 emission f a c t o r s
a r e based on 20 y e a r o ld data. Emission f a c t o r s f o r petroleum r e f i n e r y
equipment l eaks a r e p re sen t ly being updated, and pre l iminary da t a show
the t o t a l l eak emission r a t e i s g r e a t e r than AP-42 indicate^.^ In o r d e r
t o avoid confusion t h a t occurs when new emission f a c t o r s a r e published
based on 016 o r l im i t ed d a t a , no a t tempt has been made t o quan t i fy t h e
emission reduc t ion a s soc i a t ed with a monitoring and maintenance program.
Rather , we w i l l r e l y on the results of s t u d i e s p re sen t ly underway t o
d e f i n e t o t a l emissions and emission reduc t ions a t some f u t u r e d a t e .

I
5.2 OTHER ENVIRONMENTAL IMPACTS -
EPA has examined the impacts of applying t h e con t ro l technology
t o petroleum r e f i n e r i e s and has determined t h a t t h e r e a r e no s i g n i f i c a n t
adverse e f f e c t s on o t h e r a i r p o l l u t i o n , water p o l l u t i o n , o r s o l i d waste.
There w i l l be a very small energy requirement f o r monitoring instruments
and equipment r e p a i r s . This requirement w i l l be more than o f f s e t by
energy sav ings r e a l i z e d through product recovery when l eaks a r e l oca t ed
and r epa i r ed .
5.3 REFERENCES
1 . "National Ai r Qual i ty and Emission Trends Report 1975."
Environmental P ro t ec t i on Agency, OAQPS, MDAD-MRB, Research Tr i ang le
Park, N . C. , EPA-45011-76-002, November, 1976.
2. "Revis ion of Evaporative Hydrocarbon Emission Fac tors , "
EPA Report No. 45013-76-039, August, 1976.
3. C a n t r e l l , A , Annual Refining Survey. The Oil and Gas Jou rna l ,
75(13): 97-123, March 28, 1977.
4. "Assessment of Environmental Emissions From O i 1 Refining ,"
Radian Corporat ion, EPA Cont rac t No. 68-02-2665, i n progress , March, 1976,
t o March, 1979.

6.0 ENFORCEMENT ASPECTS
The purpose of t h i s chapter i s t o def ine f a c i l i t i e s t o which regu la t i ons
w i l l apply, t o s e l e c t appropr ia te regu la to ry format and t o recomnend compliance
and moni to r ing techniques.
6.1 AFFECTED FACILITY
I n fo rmu la t i ng regu la t i ons i t i s suggested t h a t t he affected f a c i l i t y
be de f ined as each i n d i v i d u a l source w i t h i n a petroleum r e f i n e r y complex.
A petroleum r e f i n e r y complex i s de f ined as any f a c i l i t y engaged i n producing
gas01 ine, aromatics, kerosene, d i s t i l l a t e f u e l o i l s , res idua l f u e l o i l s ,
l ub r i can ts , asphal t , o r o the r products through d i s t i l l a t i o n o f petroleum o r
through r e d i s t i l l a t i o n , crack ing, rearrangement o r reforming of unf in ished
petroleum de r i va t i ves . The a f f e c t e d f a c i 1 i t i e s a r e each i n d i v i d u a l source t h a t
cou ld p o t e n t i a l l y l eak v o l a t i l e organic compounds (VOC) t o atmosphere. These
sources inc lude, b u t a r e n o t l i m i t e d to , pump seals, compressor seals, seal o i l
degassing vents, p i pe l i n e valves, f langes and o ther connections, pressure re1 i e f
devices, process dra ins, and open ended pipes.
6.2 FORMAT OF REGULATION
Regulat ions l i m i t i n g emissions from r e f i n e r y equipment leaks should
s t a t e t h a t when any affected f a c i 1 ity (component) w i t h i n t h e petroleum r e f i n e r y
complex i s found t o be leak ing , the r e f i n e r y operator should make every
reasonable e f f o r t t o r e p a i r t he leak w i t h i n f i f t e e n (15 ) days. A leak ing
component i s def ined as one which has a VOC concent ra t ion exceeding 10,000 par ts
per m i l 1 i o n (ppm) when tes ted i n t h e manner descr ibed i n Appendix 6. Leaks
- -
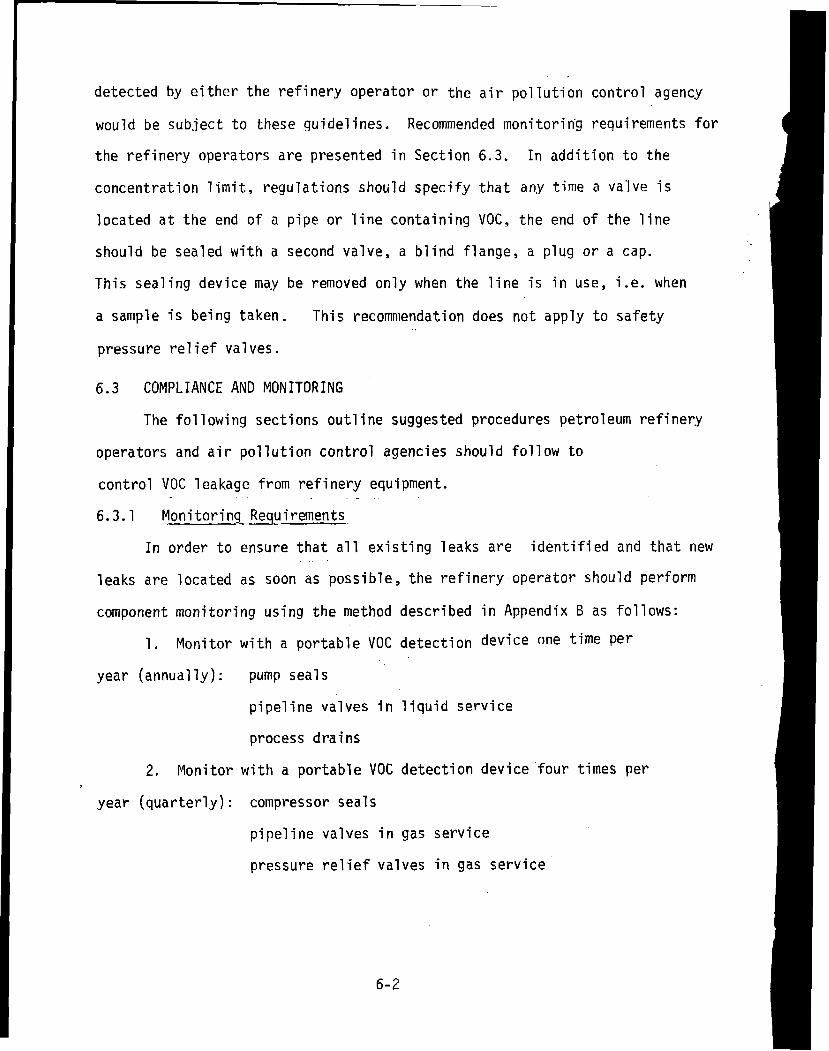
detected by e i ther the refinery operator or the a i r pollution control agency
would be subject t o these guidelines. Recommended monitorin-g requirements for
the refinery operators are presented in Section 6.3. In addition to the
concentration l imi t , regulations should specify that any time a valve i s
located a t the end of a pipe or l ine containing VOC, the end of the l ine
should be sealed with a second valve, a blind flange, a plug o r a cap.
This sea ling device may be removed only when the l ine i s in use, i .e . when
a sample i s being taken. This recommendation does n o t apply to safety
pressureI re l ie f valves.
6.3 COMPLIANCE AND MONITORING
The following sections outline suggested procedures petroleum refinery
operators and a i r pollution control agencies should follow to
control VOC leakage from refinery equipment.
6.3.1 Monitoring Requirements
In order to ensure tha t a l l existing leaks are identified and that new
leaks are located as soon as possible, the refinery operator should perform
component monitoring using the method described in Appendix 6 as follows:
1. Monitor with a portable VOC detection device one time Per
year (annual ly) : pump seals
pipeline valves in liquid service
process drai ns
2. Monitor with a portable VOC detection device four times per 1
year (quarterly): compressor seals
pipeline valves in gas service
pressure r e l i e f valves i n gas service

3 . Mon i t o r v i s u a l l y f i f t y - t w o ( 5 2 ) t imes pe r year (week ly ) :
pump sea l s
4. No i n d i v i d u a l m o n i t o r i n g necessary:
p ipe1 i n e f 1 anges
p ressure r e l i e f va lves i n l i q u i d s e r v i c e
For t h e purposes o f t h i s document, gas s e r v i c e f o r p i p e l i n e va lves
and p ressure r e l i e f va lves i s def ined as t h e VOC be ing gaseous a t
c o n d i t i o n s t h a t p r e v a i 1 i n t h e component d u r i n g normal opera t ions .
These components should be marked o r no ted i n some way so t h a t t h e i r
l o c a t i o n i s r e a d i l y obv ious t o bo th t h e r e f i n e r y ope ra to r per fo rming
t h e m o n i t o r i n g and t h e a i r p o l l u t i o n c o n t r o l o f f i c e r . Whenever 1 i q u i d s
a re observed d r i p p i n g from a pump seal , t h e sea l should be checked
immed ia te ly w i t h a p o r t a b l e VOC d e t e c t o r t o determine ifa leak i s
present , i.e., a concen t ra t i on over 10,000 ppm. I f so, t h e leak should
be r e p a i r e d w i t h i n 15 days. I n a d d i t i o n , whenever a r e l i e f va l ve ven ts
t o atmosphere, t h e o p e r a t o r again has f i f t e e n (15) days t o mon i t o r and
r e p a i r any leak t h a t occurs . F i n a l l y , p ressure r e l i e f dev ices which a re
t i e d i n t o e i t h e r a f l a r e header o r vapor r ecove ry should be exempted from
t h e m o n i t o r i n g requi rements .
6.3.2 Recording Requirements
When a leak i s l oca ted , a weatherproof and r e a d i l y v i s i b l e t a g bea r i ng
an I . D. number and t h e da te t h e l eak i s l o c a t e d should be a f f i x e d t o t h e
l e a k i n g component. The presence o f t h e leak should a l s o be no ted on a survey
l o g s i m i l a r t o t h e one shown i n F i g u r e 6-1. When t h e leak i s r epa i r ed , t h e
rema in ins p o r t i o n s o f t h e survey l o g (F i gu re 6-1) should be completed and
t h e t a g d iscarded. The ope ra to r should r e t a i n t h e survey l o g f o r two yea rs
a f t e r t h e i n s p e c t i o n i s completed.
6.3.3 Reporting Requirements
After each quarterly monitoring has been performed (and the annual),
the refinery operator should submit a report to the air pollution control
officer listing all leaks that were located but not repaired within the
fifteen (15) day limit. A sample report is shown in Fiqure 6-2. In
addition to submitting the report, the refinery operator should submit
a signed statement attesting to the fact that all monitoring has been
performed as stipulated in their control plan.
6.3 .4 Other Considerations
Presently, there is little information available on the amount of
monitoring necessary to ensure that leaks are kept to a reasonable
limit. Considering this shortcoming, regulations that are written
should allow for modifications in the monitorinq schedule where it is
proven to be either inadequate or excessive. If, after over one year
of monitoring, i .e., at least two complete annual checks, the refinery
operator feels t h a t modifications of the requirements are in order, he may
request in writing to the air pollution control officer that a revision
be made. The submittal should include data that have been developed to
justify any modifications in the monitoring schedule. On the other
hand, if the air pollution control officer finds an excessive number of
leaks during an inspection, or if the refinery operator found an excessive
number of leaks in any given area during scheduled monitoring, the air
pollution control officer should increase the frequency of inspections for
that part of the facility.
The refinery operator should not be restra ined from adopting alternative
monitoring methods if these methods are shown to be equivalent to
those presented here. An example would be subst i tuting walkthrough
6-4

moni to r ing (as described i n Appendix B ) f o r t he q u a r t e r l y i n d i v i d u a l gas
se rv i ce va lve moni tor ing. I n order t o apply f o r such a mod i f i ca t ion , the
r e f i n e r y operator should e s t a b l i s h a VOC concent ra t ion " a c t i o n l e v e l "
and document i t s e f fec t iveness a t l o c a t i n g leaks. Other a l t e r n a t i v e
mon i to r ing methods such as us ing soap s o l u t i o n t o de tec t leaks from
"cool " components may be used i f t h e r e f i n e r y operator can develop a
data base t o prove equivalence w i t h the recommended procedure, i .e. a
concentrat ion l i m i t o f 10,000 pprn.
It i s a n t i c i p a t e d t h a t i n most cases,a l eak ing component w i l l be able
t o be brought i n t o compliance w i t h the 10,000 pprn concentrat ion l i m i t
( repa i red) w i t h a minimum of e f fo r t . There are sources, however, t h a t may
need t o be i s o l a t e d from t h e process i n order t o be repai red. This procedure
may be d i f f i c u l t f o r some equipment, e s p e c i a l l y compressors t h a t do no t have
spares and va l ves tha t cannot be i so la ted . For these and poss ib l y o ther
sources, i t may be necessary t o have a p a r t i a l o r complete u n i t shutdown
t o r e p a i r the leak. Since a u n i t shutdown may create more emissions than
the r e p a i r e l iminates, these sources need n o t be repa i red u n t i l t he
necessary shutdown occurs, such as a scheduled u n i t turnaround.
I n c e r t a i n instances, more than simple o r u n i t shutdown r e p a i r s w i l l
be necessary t o b r i n g a leak ing component i n t o compliance. Thi s can
be t r u e f o r some pump o r compressor seals o r f o r d r a i n systems . I t may
be necessary t o modi fy o r rep lace the whole pump o r compressor seal system
o r t o modify t he underground d ra i n p ipes. One example of t h i s i s when a dual
sea l ing system i s used f o r pumps o r compressors. A seal o i l i s f lushed
between the two seals c rea t i ng a p o t e n t i a l f o r VOC emissions i f the seal
o i l r e s e r v o i r i s degassed t o atmosphere. Ifsuch a system i s used, ins tead

of monitorin@ the VOC concentration o f the double seal, the refinery
operator' should monitor the seal oi 1 reservoir degassing vent to
determine if it is over the 10,000 ppm concentration limit. This source
can be controlled by venting to a firebox ar to the flare header.
Sources such as this, where the leak cannot be repaired by maintenance
or equipment changeout, should be addressed individually by the
air pollution control agency, taking into account both the potential
emission reduction and the cost and technical feasibility of brinqing
such a source into compliance with the concentration limit.


i
DATE DATE DATE LEAK STREAM LEAK MAINTENANCE WILL BE REASON REPAIRS F A I L E D
UNIT COMPONENT COMPOSITION LOCATED ATTEMPTED REPAIRED OR POSTPONED
FIGURE 6-2. Example Refinery Leak Report

APPENDIX A - EMISSION SOURCE TEST DATA
The purpose o f Appendix A i s t o summarize and d iscuss source t e s t s
t h a t were conducted by EPA t o d e f i n e the present l eak s ta tus of petroleum
r e f i n e r i e s i n t h e Uni ted States. EPA performed source t e s t s a t two
Los Angeles, C a l i f o r n i a , area r e f i n e r i e s du r ing February 1977; a Houston,
Texas, area r e f i n e r y i n October, 1977; and a New Orleans, Louisiana, area
r e f i n e r y i n November, 1977. Re f i ne r ies A, C and D a re i n teg ra ted
r e f i n e r i e s t h a t produce a wide v a r i e t y of products. Ref inery B i s a
crude topping and aspha l t producing re f i ne ry . The f o l l o w i n g sect ions g i v e
a b r i e f d e s c r i p t i o n o f t h e u n i t s t es ted i n the r e f i n e r i e s and cond i t i ons
t h a t ex i s ted du r ing t h e tes ts . Overa l l r e s u l t s a re summarized i n Table A-1
and the i n d i v i d u a l r e s u l t s a re shown i n Tables A-2 through A-5. The hydro-
carbon concentrat ions t h a t a re repor ted are t h e maximum concentrat ions t h a t
were found a t a d is tance of 5 cent imeters from each i n d i v i d u a l l eak source.
A l l t e s t s were performed w i t h a Century Systems OVA-108 instrument.
A . l REFINERY A
Ref inery A i s a medium s ized i n teg ra ted r e f i n e r y owned by a major o i 1
company. U n i t s surveyed i n Refinery A inc luded a coo l i ng tower, a delayed
coker, t h ree wastewater separators, t h e tank farm, a super f rac t ionat ion
u n i t , an atmospheric d i s t i l l a t i o n u n i t , a vacuum d i s t i l l a t i o n u n i t , a f l u i d
c a t a l y t i c crack ing (FCC) u n i t and t h e FCC gas p lan t . A l l u n i t s were opera t ing
i q r r n a l l y throughout t he t e s t i n g except fo r t h e desa l te r i n the atmospheric 'r

d i s t i l l a t i o n u n i t . Improper. o i l - w a t e r separat ion caused e levated hydrocarbon
concentrat ions i n the process dra ins. I n a few u n i t s t he re was a l a r g e
hydrocarbon c loud downwind from pumps t h a t had mechanical sea l f a i 1 ures . This made i t impossible t o survey the pumps and associated equipment
i n such an area. A summarv of r e s u l t s o f component t e s t i n g a t Ref inery A i s
shown i n able A-2.
A.2 REFINERY B
Refinery B i s a smal l , independently owned crude topping r e f i n e r y . A l l
of t h e operat ing equipment i n t h e r e f i n e r y was surveyed, i n c l u d i n g t h e equipment
associated w i t h t h e i r atmospheric and vacuum d i s t i l l a t i o n u n i t s . Most of the
pumps i n the r e f i n e r y have dual mechanical seals w i t h a b a r r i e r f l u i d so
verv few had detec tab le leaks. u Results o f Ref inery B t e s t i n s a re shown i n
Table A-3.
A.3 REFINERY C
Ref inery C i s a large, major i n teg ra ted petroleum re f i ne ry . Many u n i t s
i n Refinery C were surveyed, i n c l u d i n g two wastewater separators, a d i s t i l l a t e
d e s u l f u r i z e r , an aromatics recovery u n i t , a crude atmospheric and vacuum
d i s t i l l a t i o n u n i t , a f l u i d c a t a l y t i c crack ing u n i t , a hydrocracker, two
reformers and the tank farm. A l l o f t he u n i t s were opera t ing normal ly when
the survevs were oerforrned. The t e s t r e s u l t s a re summarized i n Table A-4.
A .4 REFINERY D
Ref inery D i s a f a i r l y l a r g e i n teg ra ted r e f i n e r y , I t i s a r e c e n t l y
b u i l t s rassroots r e f i n e r v and i s owned by one of the major o i l companies. -.' I
Onlv two units were surveved i n Ref inerv D: the aromatics recovery u n i t and : I

t h e sa tu ra ted gas p l a n t . B o t h u n i t s were o p e r a t i n g normally d u r i n g t e s t i n g .
Ref inery D t e s t r e s u l t s are shown i n Table A-5.

c
TABLE TESTS
. Number o f Emission Source Sources Tested
Pump Seals
Compressor Seals
Block Valves
Control Valves
Open-Ended Val ves C
Drains
Pressure Relief Devices
a Not a representative sample o f refinery units , ,
b VOC concentration over 1000 ppm measured a t 5 centimeters from the source. (Equivalent to 10,000 ppm a t the source - see Chapter-2.)
Including bleed valves and sample connections

I
I TABLE A - 2 SUMMARY OF REFINERY A TESTING
I b
Number o f Percent Emission Source Sources Tested Leaking
Pump Seals 87 7
Sea
1 Block Valves 172 7
1 control valves 26 1 1
Val ves 3 a 100
Drains 59 3
Pressure Relief Devices 15 a 0
a Not a representative sample of refinery units
b VOC concentration over 1000 ppm measured at 5 centimeters from the source. (~quivalentto 10,000 ppm at the source - see Chapter 2.)
Includ leed valves and sample .connections

SUMMARY REF'INERY
.---.
Number o f Percent Emission Source Sources Tested Leaki ng
, -.,. I- -----Compressor Seal
Block Valves
Cont ro l Valves
Open-Ended valves b
Drains
Pressure R e l i e f Devices
a VOC concent ra t ion over 1000 ppm measured a t 5 centimeters f rom t h e source. (Equivalent t o 10,000 ppm a t t he source - see Chapter 2 . )
b I n c l u d i n g bleed valves and sample connections.

1 TABLE A - 4 SUMMARY OF REFINERY C TESTING
I Number o f Percent a
Ernissi-on Source Sources Tested Leaking
I Compressor Seals
Cont ro l Valves
Open-Ended Valves
I Pressure Re1i e f Devices
a VOC concent ra t ion over 1000 ppm measured a t 5 cent imeters from the source. (Equ iva len t t o 10,000 ppm a t t he source - see Chapter 2. )
b I nc lud ing bleed va lves and sample connections

c
TABLE A - 5 SUMMARY OF REFINERY
Number of Percent a Leak i ng
Pump Seals
Compressor Sea
Block Valves
Control Valves
Open-Ended Valves
Drains
Pressure Re1ief Devices
a VOC concentration over 1000 ppm measured at 5 centimeters from the source. (~quivalent to 10,000 ppm at the source - see Chapter 2.)
b Not a representative sample
Incl udi ng bleed valves and sampl e connections.

APPENDIX E
DETECTION OF VOC LEAKS FROM PETROLEUM REFINERY EQUIPMENT
6.1 IETRCCUCTICN
This test method describes the procedures used to detect volatile organic
compound (VOC) leaks from petroleum refinery equipment. A portable test
instrument is used to survey individual equipment leak scurces, The specifi-
cations and performance criteria for the test instrument are included. Also
included is a description of an alternative walkthrough procedure that may
be used if the refinery owner or operator demonstrates that the procedure i s
e f f e c t i v e f o r locatifig individual equipment leaks.
B .2 APPARATUS
B.2.1 Monitoring Instrument
The VOC detection instrument used in this procedure may be of any type
that is designed to respond to total hydrocarbons or combustible gases. The
instrument must incorporate an appropriate range option so that source levels
(10,000ppm) can be measured. The instrument shall be equipped with a pump
so that a continuous sample is provided to the detector. The instrument meter freadout shall be such that the scale can be r6ad to - 5 percent at 10,000 ppmv.
The instrument must be capable of achieving the perfcrmance criteria given
in Table 6.1. The definitions and evaluaticn procedures for each parameter
are given in Section E.4.
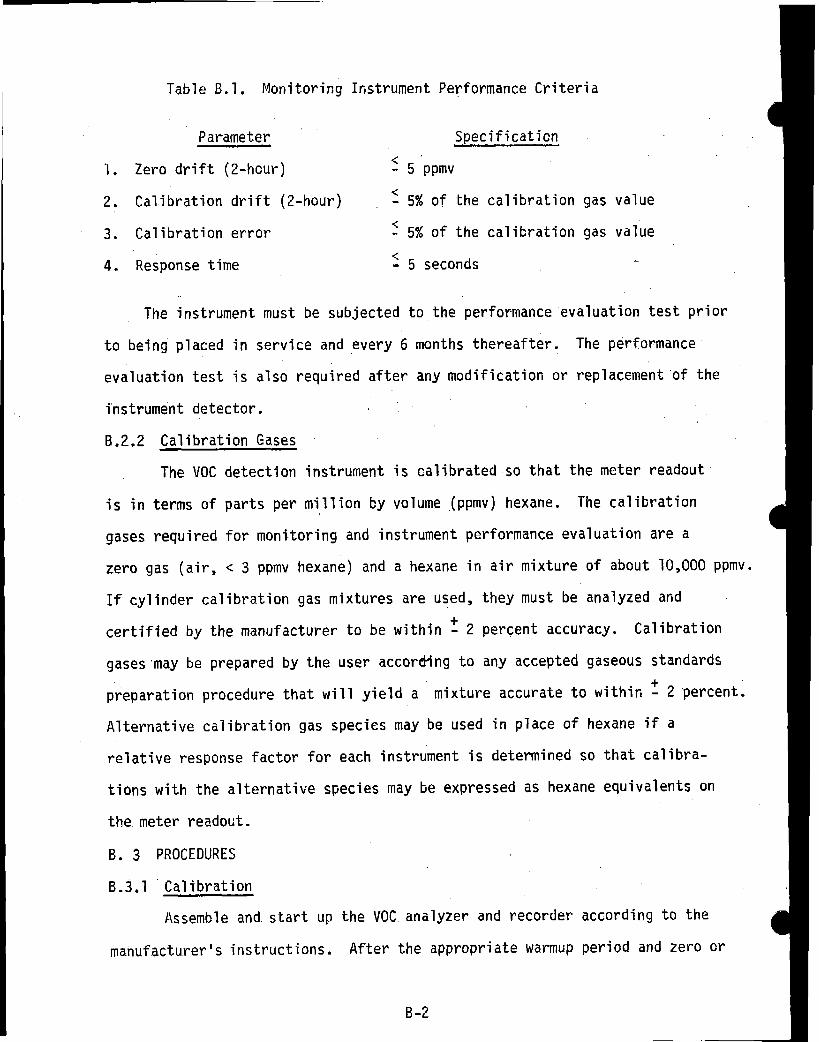
Table 0.1. Monitoring Ifistrument Performanc e Criteri
. .
Parameter Specificaticn
1. Zer,o drift (2-hour) <- 5 ppmv
2. Calibration drift (2-hour) <- 5% of the calibration gas value <
3. Calibration error - 5% of the calibration gas value <4. Response t i m e - 5 seconds
The instrument must be subjected to the performance 'evaluation test prior
to being placed in service and every 6 months thereafter. The performance
evaluation test is also required after any modification or replacement of the
instrument detector.
B.2.2 Calibration Gases
The VOC detection instrument is calibrated so that the meter readout
is in terms of parts per million by volume (ppmv) hexane. The calibration
gases required for monitoring and instrument performance evaluation are a
zero gas (air, < 3 ppmv hexane) and a hexane in air mixture of about 10,000 ppmv.
If cylinder calibration gas mixtures are used, they must be analyzed and +
certified by the manufacturer to be within - 2 percent accuracy. Calibration
gases may be prepared by the user according to any accepted gaseous standards -k
preparation procedure that will yield a mixture accurate to withifi - 2 percent.
Alternative calibration gas species may be used i n place of hexane i f a
relative response factor for each instrument is determined so that calibra-
tions with the alternative species may be expressed as hexane equivalents on
the meter readout.
B. 3 PROCEDURES
Calibration
Assemble and start up the VOC analyzer and recorder according to the
manufactu.rer's instructions. After the appropriate warmup period and zero cr
internal calibration procedure, introduce the 10,000 ppmv hexane or hexane
equivalent calibration gas into the instrument sample probe. Adjust the
instrument meter readout and chart recorder to correspond to the calibraticn
gas value.
B.3.2 Individual Source Surveys
Place the instrument sample probe inlet at the surface of t h e cotrponent
interface where leakage could occur. During sample collection, the probe
should be moved along the interface surface with special emphasis placed on
positioning the probe ifilet at the local upwind and downwi~d side of the
component ifiterface. If a concentration reaaing in excess of 10,COO ppmv
.is observed, reccrd the date, time, and equipment identification. T h i s general
technique is applied to specific types of equipment leak sources as follows:
B.3.2.1 Valves - The most ccmmon scurce of leaks from block (glove, plug,
gate, ball, e tc . ) and control valves is at the seal between the stem and
housing. The probe should be placed at the interface where the stem exits
the seal and sampling should be conducted on all sides of t h e stem. For
valves where the housing is a multipart assembly, or where leaks can occur
from points other than the stem seal, these sources should a.lso be surveyed
with the probe inlet moved along the surface of the interface.
6.2.2.2 Flanges and other connections - For welded flanges, the probe should
be placed at the outer edge of t h e flange-gasket iriterface and samples
collected around the circumference of the flange. For other types of Ron-
permanent joints such as threaded connecti~ns, a similar traverse is conducted
at the component interface.
B.3.2.3 Pumps and compressors - A circumferential traverse i s conducted at
the outer surface of the pump or compressor s h a f t and housing seal interface.
In cases where the instrument probe cannot be placed in ccntact with a

rotating shaft, the probe inlet must be placed within one centimeter of the
shaft-seal interface. In those cases where the housing configuration of the
pump pr compressor prevents the complete traversing of the seal periphery, all
accessible portions of the shaft seal should be probed. All other jo ints where
leakage cculd occur shall also be sampled with t h e probe inlet placed at t he
surface of the interface. Fcr pumps or compressors using seali~g oil , the
vent from the seal oil reservoir shall be samp1ed.b~placing the probc inlet
at approximately the centroid of the vent area to atmosphere.
B.3.2.4 Pressure re1 ief devices - The physical configuraticn of most pressure
relief devices prevents sampling at the sealitig surface interface. However,
most devices zre equipped with an enclosed extension, or horn. For this type
device, the probe inlet is placed at approximately the centroi d of the exhaust
area to atmosphere,
B.3.2.5 Process drains - For open process drains, the samp le probe inlet
shall be placed at approximately the centroid o f the area open to the atmos-
phere. For covered drains, the probe should be placed at the surface o f the
cover interface and a circumferential traverse shall be con ducted.
B.3.2.6 Open-ended valves - Leakage from open-ended valves such as sample
taps or drain lines shall be detected by placifig the probc inlet a t approx
rnately the centroid of the uncapped opening to atmosphere.
B.4 INSTRUMENT PERFORMANCE EVALUATION PROCEDURES
8.4.1 Definiticns
Zero drift - The change i n the instrument meter readout- over a s ta ted
peri~do f time of normal c~ntinuous operaticn when the VOC concentration at
t h e time of neasurement i s zero,

Calibration Drift - The change in the instrument meter readout over a
stated period of time of normal continuous operation when the VOC concentra-
tion at the time of measurement i s the same known upscale value.
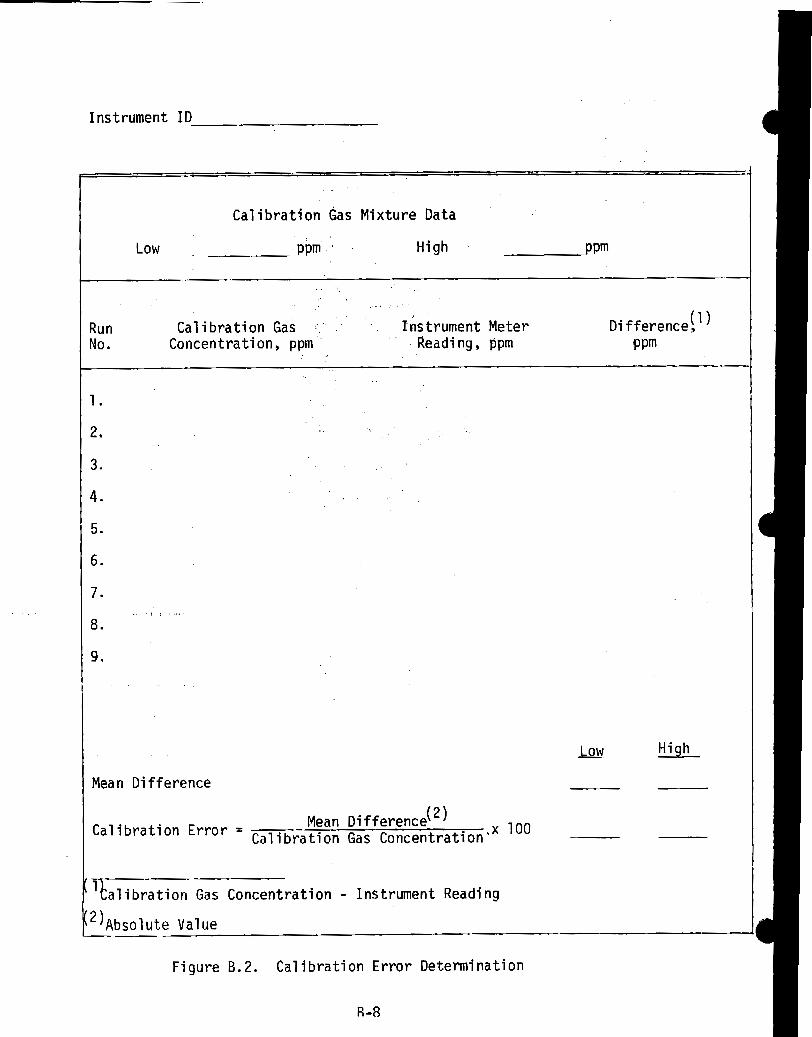
Calibration Error - The difference between the VCC concentration indi -cated by the meter readout and the known concentrati~n of a test gas mixture.
Response Time - The time interval from a step change in VOC concentration
at the input of t he sampling system to the time at which 95 percent of the
corresponding final value is reached as displayed on the instrument readout
meter.
B .4.2 Eva1 uaticn Procedures
A t the beginning of the instrument performance evaluation t e s t , assemble
and start up the instrument according to the manufacturer's instructions for
recommended warmup period and prel imi nary adjustments . 8.4.2.1 Zero and calibration drift test - Calibrate the instrumefit per the
manufacturer's instructions using zero gas and a calibration gas representing
about 10,000 ppmv. Record the time, zero, and calibration gas readi~gs
(example data sheet shown in Figure B. l ) . After 2 hours of continuous opera-
tion, introduce zero and calibration gases to the instrument. Record the
zero and calibration gas meter readings. Repeat for three additicnal 2-hour
peri cds . B.4.2.2 Calibration error test - Make a total of nine measurements by
alternately using zero gas and a calibration gas mixture corresponding to
about 10,000 ppmv. Record the meter readings (example d a t a sheet shown in
Figure B.2).
B.4.2.3 Response time test procedure - Introduce zero gas into the instrument
sample probe. When the meter reading has stabilized, switch quickly to the
10,000 ppmv calibration gas. Measure the time from concentration s w i t c h i n g
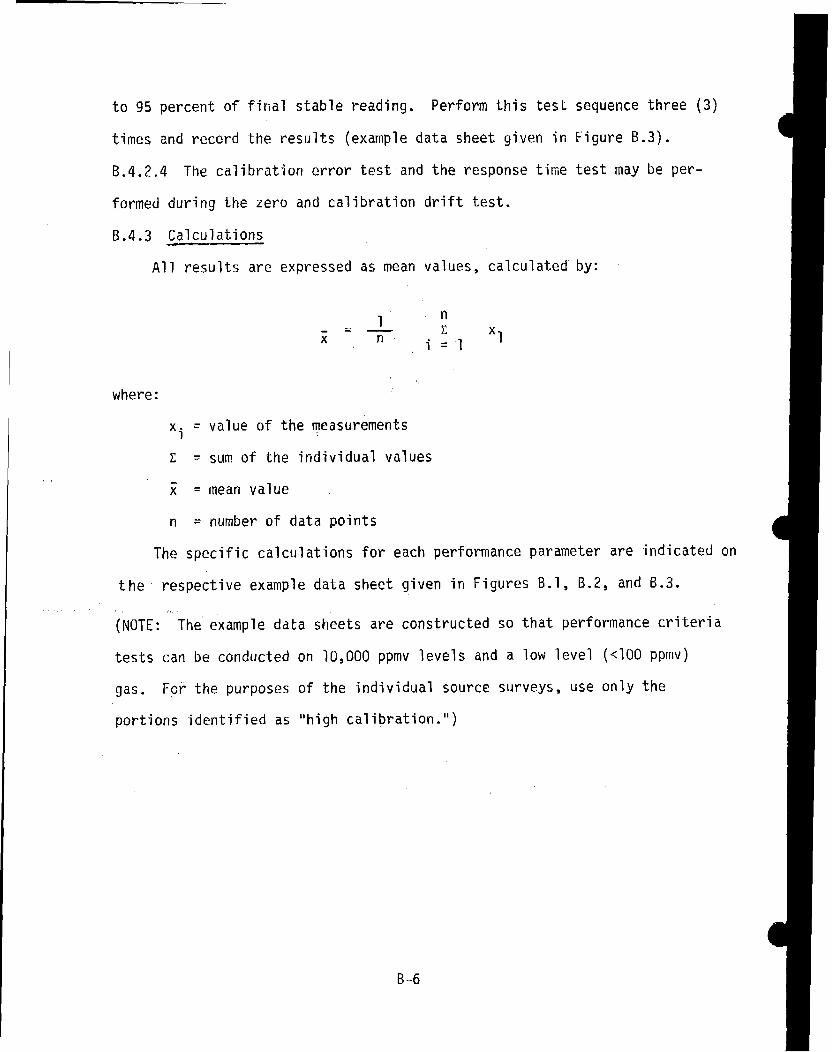
to 95 percent of f ir ial stable reading. Perfcrm this t e s t sequence three (3)
times and reccrd the results (example d a t a sheet given in Figure B.3).
6.4.2.4 The calibration error test and the response time test may be per-
formed during the zero and calibration drift test.
B.4.3 Calculations
All results are expressed as mean values, calculated by:
where:
x = value o f the measurements i
Z = sum of t he individual values -x = mean value
n = number of data points
The specific calculations for each performance parameter are indicated on
the respective example data sheet given in Figures 6.1, B.2, and 6 . 3 .
(NOTE: The example data sheets are constructed so that performance criteria
tests can be conducted on 10,000 ppmv levels and a low level (<I00 pprnv)
gas. Fcr the purposes of the individual source surveys, use only the
portions identified as "high calibration.")

Instrument ID
Cali bration Gas Mixture Data
Low PPm H i g h . ppm
. , .
Run Ca1 ibra t ion Gas c . : . , ~hstrument Meter (11D i f ference , No. Concentration, ppm . Reading, ppm PPm
, .,
HighLow
Mean Difference
Mean Di f ference( 2 ) brati on Error= Gal ibra t i on Gas Conc-ntrati on .x 100
'ha1 i bration Gas Concentration - Instrument Reading
Value
Figure B. 2. Cali bration Error Determination
R-X
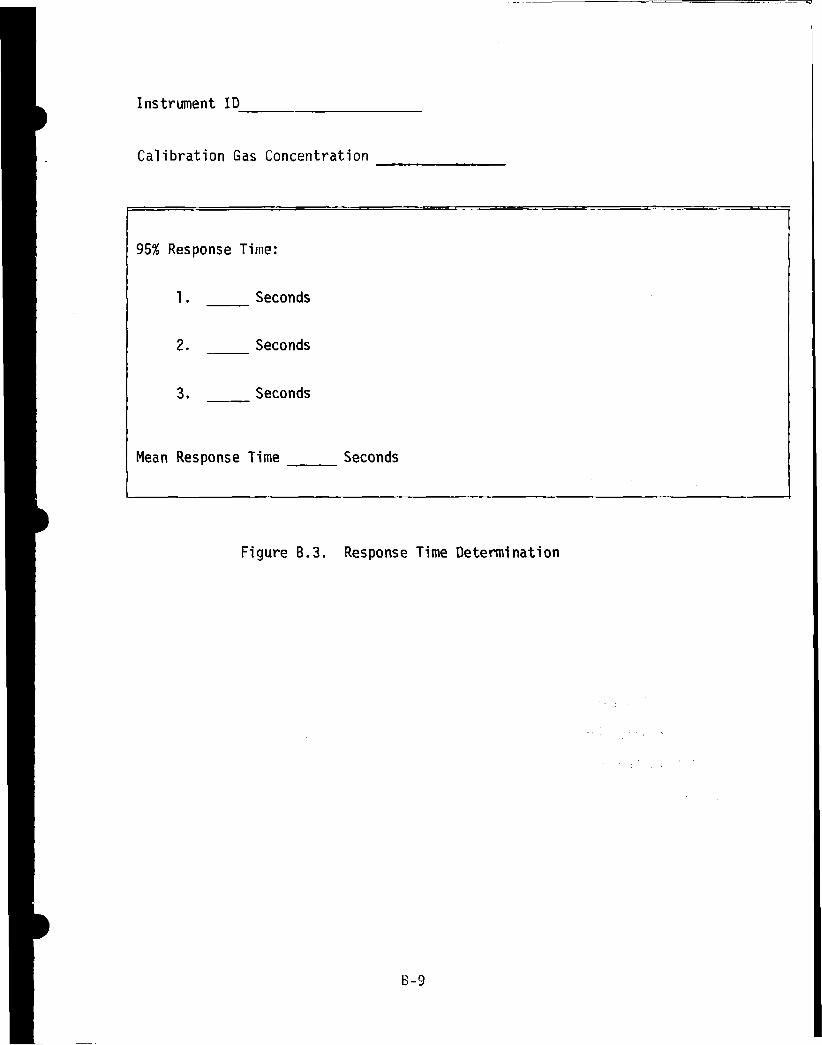
Instrument ID
Cali bration Gas Concentration
95% Response Time:
1. -Seconds
Mean Response Time Seconds
Figure 0 .3 . Response Time Determination

I
6.5 ALTERNATIVE UN'ITAREA SURVEYS
6.5.1 Introduction
In this procedure, a process unit area is surveyed with a portable VOC
detector to determine if there is an increased local ambient VOC concentration
in the equipment area. The unit area walkthrough should be planned so that
the unit perimeter and all ground level equipment is surveyed. The walkthrough
must include ambient VOC measurements at a distance of about one meter upwind
and downwind of all puvp rows and control valves. In order to simplify data
recording and s~hsequent data review, a planned walkthro~gh path with ccdes
for location identification is recommended.
B.5.2 Apparatus
B .5.Z.l Monitoring instrument - The VOC detection instrument used must conform
to the specifications and performance specifications given in B.2.1 except
that a measurement range must be available for accurately ~easuring ambient
VOC levels (usually less than 100 ppmv). The minimum detectable VOC concen-
tration must be 2 ppmv hexane or less. Also, the instrument must be equipped
with a portable strip chart recorder so that a permanent record of the walk-
through survey can be retained.
8.5.2.2 Calibration gases - The specifications for the calibration gases
required are given in B.2.2, except that the calibration mixture must be
approximately the same concentration as the chosen acticn level that indicates
a leak in the area.
-B.5.2.3 Proc~dur~sPrior to the start of the walkthrough, record the date,
time, origination point, and approximate wind speed and direction in the unit
area. Begin the walkthrough and record location identif icaticns during the
course of the survey. Make two complete traversesalong the walkthrough path
to complete the survey. If an elevated VOC concentration is observed,

specifically identify the location on the chart record. After ccmpletion of
the walkthrough survey, record t h e t i ~ e and local wind conditions.
B.5.2.4 Data evaluaticn - Compare the results obtained during each of the
two traverscsthrough the unit area by observifig the strip chart records.
Using the ambient VOC concentration upwind of the unit area as a basis, identify
the locations where elevated VOC concentrations were cbserved on both traverses
Use the prevailing local wind condition information to locate the possible
sources of VOC leakage and use the procedures given in B.3.2 to determine if
a leak is present. For those cases where an increased VOC concentration is
observed in a specific location on one traverse,. but not on the other, repeat
the ambient measurements in that general location. If increased VOC levels
are again observed, use the procedures in E.3.2 to locate the leak source.
If a repetition cf ar; iccreased VOC level cannot' be obtained, or if shifts in
the location of elevated VOC ccncentrati~ns during traverse repetitions can-
not be explained by varyi~g wind directi~n or speed, treat these as transient
conditions and exclude these areas from individual leak source surveys
required above.
B .5.2.5 Instrument performance evaluaticn procedures - The VOC instrument
evaluaticn procedures are the same as those given in 8.4 f o r source level VOC
detection i~struments except that the calibration test concentrations must be
in the range expected during ambient surveys. The example data sheets in
Figures B.l, E.2, and B.3 include provisicns for evaluation of ambient
level VOC detectors. For those cases where a single detector i s used for
both source and ambient (walkthrough) surveys, the perfcrmancf evaluaticns
can be performed at the saKe time.

APPENDIX C
C. 1 MONITORING AND MAINTENANCE MANPOWER REQUIREMENTS
Table C-1 shows est imated annual manpower requirements f o r
mon i to r ing i n t he model 15,900 cubic meter per day r e f i n e r y . These
est imates a re based on data supp l ied by industry, ' €PA estimates, and
t h e mon i to r ing gu ide l ines presented i n Sect ion 6-3. For the purposes
of these est imates only , i t i s assumed t h a t these surveys w i l l genera l l y
be performed by two people--one opera t ing the .VOC de tec t i on instrument
and the o ther record ing the resul ts . ' The v i s u a l inspect ions a r e assumed
t o be performed by. one person. I t i s shown t h a t t h e t o t a l d i r e c t l a b o r
requirement f o r performing mon i to r ing inspect ions i n t he model r e f i n e r y
i s 1800 manhours per year, o f which almost 1000 manhours were spent on
the complete annual inspect ion. Actual complete component t e s t i n g by a
con t rac to r i n a more complex b u t s i m i l a r l y s ized r e f i n e r y took 936 manhours
3t o perform.
When a l eak i s detected dur ing the requ i red moni tor ing, the leak ing
component must then be repa i red t o reduce VOC emissions t o atmosphere.
Table C-2 was developed t o est imate manpower requirements f o r maintenance
us ing t h e percent o f sources t h a t l eak from Table 3-1 and the number o f
sources from i n d u s t r y estimate^.^ I n t h i s ana lys is i t i s assumed t h a t an
a d d i t i o n a l t e n percent o f t he i n i t i a l leaks w i l l be found each qua r te r
du r ing ongoing gas se rv i ce component moni tor ing. Manpower requirements

for maintenance o f each source were approximated by a refining company 5
and the State of California Air Resources ~ o a r d . ~ As shown in Table C-2,
the total annual direct labor requirement for repairing leaks is 3,800
manhours.
It should be noted that this estimate i s for the maximum ma i ntenance
requirements and will probably be realized only during the first year that
the monitoring and maintenance program is in effect. Assuming that
refinery equipment was properly specified and instal led, 1eaks (especially
in valves) are usually the result of insufficient leak detection and
maintenance. Once these leaks are identified and repaired, fewer 1ea ks
will be detected during subsequent inspections. This should result in
much 1ower maintenance manpower requirements for following years.

TABLE C-1. ANNUAL MONITORING MANPOWER REQUIREMENTS FOR MODEL 15 900 CUBIC METER PER DAY REFINERY
Number o f a Type o f Estimated Time Number o f Times Annual To ta l SOURCE Sources Moni t o r i ng Required t o a Moni toredd Manpower
t o Moni tor pe r Year Re uirement ( m i nu tes ) ?hours)
Pump Seal s Instrument 1 Visual 52
Compressor Instrument 4 Sea1s
P i pel ine Valves
L i q u i d Serv ice Instrument 1
Gas Serv ice Instrument 4 0
Process Drains Instrument 1
Pressure R e l i e f Instrument 4 Devices
P ipe l ine Flanges None -TOTAL
a Based on i n d u s t r y (Reference 1) and EPA est imates
b Based on J o i n t Study (Reference 7 ) est imate o f 23.6 percent o f r e f i n e r y valves being i n gas se rv i ce
c P r e s s u r e r e l i e f d e v i c e s i n g a s s e r v i c e v e n t i n g t o a t r n o s p h e r e
d Mon i to r ing requirements from Sect ion 6-3
e In add i t i on , pressure r e l i e f devices w i l l need t o bemon i to red whenever they vent t o atmosphere
f Except as noted, t o t a l manpower requirements for these est imates a r e assumed t o be based on two person teams per formi ng t h e moni toring
g One person performs v i s u a l inspect ions

- - - - - - - - - -
TABLE C-2, ANNUAL MAINTENANCE MANPOWER REQUIREMENTS FOR MODEL 15,900 CUBIC METER PER DAY REFINERY
Number ofa Estimated Number Average Repair a y d Total Annual Sources of Leaks Detected Time ManpowerSource Per Year (hours) Re uirement
?hours)
Pump Seals 250 30 Compressor 14 2 Seals
Pi pel ine 25,500 1640 Valves
Process I , 400 84 Drains
Pressure 130 34 Re1ie f Valves
Pipeline 64,000 -F1anges TOTAL 3800
a Based on industry (Reference 1) and EPA estimates b Based on Table 3-1 and ten percent of initial leak recurrence rate for
quarterly inspections
c - No monitoring performed d This estimate includes time for rechecking the component after maintenance
is performed
e Weighted average repair time w i t h ten percent of leaks isolated and repaired (Reference'.l)a t a cost of 4 manhours, and the remaining 90 percent tightened or greased on-line at a cost o f 0.17 manhours (Reference 6)
f These leaks repaired by routine maintenance at no incremental increase in manpower requirements (Reference 1 )

C. 2 REFERENCES
1. Le t te r with attachments from J.M. Johnson, Exxon Company, U.S.A.,
t o Robert T. Walsh, U.S. EPA, July 28, 1977.
2. Personal conrnunication between Lynn Sturrock, Phil 1 i p s Petroleum
Company, and R.A. Quaney, U.S. EPA, memo t o f i l e s , February 24, 1978.
3. Let te r w i t h attachments from B. Fa Bal l a rd , Phil 1ips Petroleum
Company, t o W i 11 iam Stewart, Texas Air Control Board, September 8 , 1977.
4. Johnson, J.M. Op C i t .
5. Ib id .
6. "Emissions From Leaking Valves, Flanges, Pump and Compressor
Seals, and Other Equipment a t O i 1 Refineries ,"S t a t e of Cal i fo rn ia Air
Resources Board, Report No. LE-78-001, Apri 1 24, 1978.
7. "Hydrocarbon Losses From Valves and Flanges," Robert K. Palmer,
J o i n t D i s t r i c t , Federal and S t a t e Project for the Evaluation of Refinery
Emissions. Report No. 2, March, 1957.


TECHNICAL REPORT DATA (Please read Instructions on the reverse before con feting]
, REPORT NO. 12.-. 3. RECIPIENT'S ACCESSION NO.
EPA-450/2-78-036 T I T L E A N D SUBTITLE 5. REPORT DATE
Control of Volatile Organic Compound Leaks From June, 1978 3. PERFORMING ORGANIZATION CODE Petroleum Refinery Equipment
A U T HORIS) 3. PERFORMING ORGANIZATION REPORT N O
K. C. Hustvedt, ESED R. A. Quaney, SASD W. E. Kelly, ESED OAQPS NO. 1-2-111
PERFORMING ORGANIZATION NAME A N D ADDRESS 10. PROGRAM ELEMENT NO.
U. S. Environmental Protection Agency Office of Air and Waste Management 11. C O N T R A C T K R A N T NO.
Office o f Air Quality Planning and Standards Research Triangle Park, N.C. 2771 1
2. SPONSORING AGENCY N A M E A N D ADDRESS 13. TYPE OF REPORT A N D PERIOD COVERED
-14. SPONSORING AGENCY CODE
5. SUPPLEMENTARY NOTES
5. ABSf RACT
This report provides the necessary guidance for development of regulations t o 1i m i t emissions of volati 1 e organic compounds (VOC) from petroleum refinery equipment 1 eaks. Equipment considered includes pump seals , compressor seals , seal oi 1 degassing vents, p ipel i ne valves , f1 anges and other connections , pressure relief devices, process drains, and open ended pipes. Reasonably available control techno1 ogy (RACT) for these sources consists of a routine monitoring schedule t o locate leaks so tha t maintenance can be performed as possible and emissions of VOC t o atmosphere reduced. An example cost analysis for implementing these controls in a model refinery i s presented along with a methodology for evaluating the cost effectiveness of these controls when updated emission factors become avai 1able.
-. 7. K E Y WORDS A N D DOCUMENT ANALYSIS
DESCRIPTORS b.lDENTIFIERS/OPEN ENDED TERMS
Air Pollution Air -Pollution Control Hydrocarbons Stationary Sources Petroleum Refining Hydrocarbon Emission
Control
I B. DISTRIBUTION STATEMENT 1 19. SECURITY CLASS (This Report) 21 . NO. OF PAGES
Unclassified 72Unl imi ted 20. SECURITY CLASS (This page) 22. PRICE
I Uncl assifi-EDIT ION OBSOLETE