Embed Size (px)
Citation preview
R 150
G 150
B 150
R 200
G 200
B 200
R 69
G 153
B 195
R 0
G 159
B 227
R 196
G 38
B 46
R 107
G 190
B 72
R 209
G 232
B 255
R 153
G 204
B 255
R 94
G 106
B 113
R 0
G 52
B 120
EPA GHG Abatement Testing Protocol and How to Apply it
Joe Van Gompel, Edwards SESHA 36th Annual Symposium, Scottsdale AZ
07 May 2014

R 150
G 150
B 150
R 200
G 200
B 200
R 69
G 153
B 195
R 0
G 159
B 227
R 196
G 38
B 46
R 107
G 190
B 72
R 209
G 232
B 255
R 153
G 204
B 255
R 94
G 106
B 113
R 0
G 52
B 120
Overview
• Mandatory Reporting Rule
• EPA Protocol 430-R-10-003
– Setup, equipment
– TVFin, TVFout
• Considerations for DRE testing
– Method 1, Method 2
– Sample calculations
• Checklists
• Summary
SESHA 36th International Symposium, Scottsdale AZ May 5-9, 2014 2

R 150
G 150
B 150
R 200
G 200
B 200
R 69
G 153
B 195
R 0
G 159
B 227
R 196
G 38
B 46
R 107
G 190
B 72
R 209
G 232
B 255
R 153
G 204
B 255
R 94
G 106
B 113
R 0
G 52
B 120
Background
• Mandatory Reporting Rule for Greenhouse Gases, 10Dec2010
– MRR
• Must monitor and report emissions of greenhouse gases
– Subpart I specific for electronics industry
• CF4, CHF3, CH2F2, C2F6, C3F6, C3F8, C4F6, c-C4F8, C4F8O, C5F8, NF3, SF6, N2O
• Requires purchase records, emission factors, abatement certification
– Credit for reduction of GHGs requires either claiming default values or performing destruction or removal efficiency (DRE) testing
• Other details include certification of abatement devices, uptime reporting, site wide maintenance plan (SWMP), corrective action process (CAP)
SESHA 36th International Symposium, Scottsdale AZ May 5-9, 2014 3
R 150
G 150
B 150
R 200
G 200
B 200
R 69
G 153
B 195
R 0
G 159
B 227
R 196
G 38
B 46
R 107
G 190
B 72
R 209
G 232
B 255
R 153
G 204
B 255
R 94
G 106
B 113
R 0
G 52
B 120
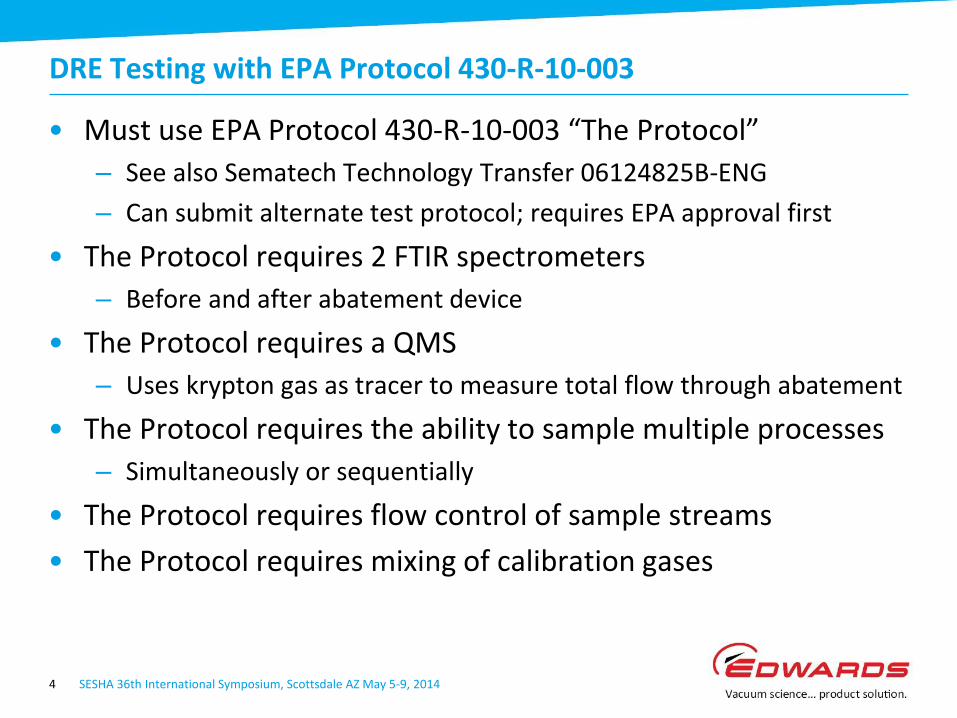
DRE Testing with EPA Protocol 430-R-10-003
• Must use EPA Protocol 430-R-10-003 “The Protocol”
– See also Sematech Technology Transfer 06124825B-ENG
– Can submit alternate test protocol; requires EPA approval first
• The Protocol requires 2 FTIR spectrometers
– Before and after abatement device
• The Protocol requires a QMS
– Uses krypton gas as tracer to measure total flow through abatement
• The Protocol requires the ability to sample multiple processes
– Simultaneously or sequentially
• The Protocol requires flow control of sample streams
• The Protocol requires mixing of calibration gases
SESHA 36th International Symposium, Scottsdale AZ May 5-9, 2014 4

R 150
G 150
B 150
R 200
G 200
B 200
R 69
G 153
B 195
R 0
G 159
B 227
R 196
G 38
B 46
R 107
G 190
B 72
R 209
G 232
B 255
R 153
G 204
B 255
R 94
G 106
B 113
R 0
G 52
B 120
SESHA 36th International Symposium, Scottsdale AZ May 5-9, 2014
EPA 430-R-10-003 “The Protocol”
5
http://www.epa.gov/semiconductor-pfc/documents/dre_protocol.pdf

R 150
G 150
B 150
R 200
G 200
B 200
R 69
G 153
B 195
R 0
G 159
B 227
R 196
G 38
B 46
R 107
G 190
B 72
R 209
G 232
B 255
R 153
G 204
B 255
R 94
G 106
B 113
R 0
G 52
B 120
The Protocol
• Most EPA Methods are very detailed and specific
– Helps to maintain uniformity and reproducibility
• E.g. Method 26A for Determination of Halogens and Halides
• The Protocol is more of a guideline for experienced analysts
– Variety of abatement types and configurations
– Evaluate possibly errant results
• “Do results make sense based on past experience and observations?”
• The Protocol has detailed data workup procedures
– Equations for data analysis and results determination
SESHA 36th International Symposium, Scottsdale AZ May 5-9, 2014 6

R 150
G 150
B 150
R 200
G 200
B 200
R 69
G 153
B 195
R 0
G 159
B 227
R 196
G 38
B 46
R 107
G 190
B 72
R 209
G 232
B 255
R 153
G 204
B 255
R 94
G 106
B 113
R 0
G 52
B 120
SESHA 36th International Symposium, Scottsdale AZ May 5-9, 2014 7
Equipment Setup per The Protocol

R 150
G 150
B 150
R 200
G 200
B 200
R 69
G 153
B 195
R 0
G 159
B 227
R 196
G 38
B 46
R 107
G 190
B 72
R 209
G 232
B 255
R 153
G 204
B 255
R 94
G 106
B 113
R 0
G 52
B 120
Stack Testing
• EPA Protocol 430-R-10-003 is not appropriate for stack testing
– Stack testing described in 40 CFR §98.93(i)
• EPA Method 320 is approved for Stack Testing as described in the most recent EPA Rule for Subpart I
– Or ASTM D6843-03 (listed in Preamble)
– 8-hour collection time
– Must traverse stack for isokinetic testing
– FTIR optimized for ppb-levels of F-GHGs
• Not approved for N2O
– Must have Certificates of Design, Installation, Operation and Maintenance on all POU abatement feeding the stacks
SESHA 36th International Symposium, Scottsdale AZ May 5-9, 2014 8
R 150
G 150
B 150
R 200
G 200
B 200
R 69
G 153
B 195
R 0
G 159
B 227
R 196
G 38
B 46
R 107
G 190
B 72
R 209
G 232
B 255
R 153
G 204
B 255
R 94
G 106
B 113
R 0
G 52
B 120
About Fourier-Transform Infrared Spectrometers (FTIRs)
• FTIRs analyze all gases EXCEPT monatomics and homonuclear diatomics
– Cannot see He, Ar, Ne, Xe, H2, O2, N2, Cl2, F2, Br2
• GHGs are easy (so is water vapor)
• FTIRs use liquid-N2 cooled HgCdTe detectors – fast and sensitive
– 1 scan every second or two (0.5 cm-1 or 1.0 cm-1 resolution)
• Pre-abatement FTIR will have short-path gas cell
– 10 sccm to 40 sccm – concentrations will be high
• Post-abatement FTIR will have long-pathlength gas cell
– Long pathlength needed for ppm-level post-abatement gases
– 5-m folded-path gas cells are common
• FTIRs are self-correcting; a single calibration set can be used for years if sampling parameters remain the same
SESHA 36th International Symposium, Scottsdale AZ May 5-9, 2014 9
R 150
G 150
B 150
R 200
G 200
B 200
R 69
G 153
B 195
R 0
G 159
B 227
R 196
G 38
B 46
R 107
G 190
B 72
R 209
G 232
B 255
R 153
G 204
B 255
R 94
G 106
B 113
R 0
G 52
B 120
About Quadrupole Mass Spectrometers (QMS)
• Mass spectrometry, sample is fragmented into reproducible ions
– Ionized fragments are sorted with a magnetic field based on mass
• CF4 + e- CF3+
+ F-, m/e 69
• All compounds can be observed by MS
– Ar, Kr are also ionized to Ar+, Kr+
• Quadrupole mass spectrometers use 4 parallel electromagnets
– Magnetic field is rapidly varied to direct a range of masses at detector
• Mass spectrometry can be used to identify or quantify
– Calibrations must be performed daily
– Not practical for quantifying complex mixtures over wide concentration ranges
SESHA 36th International Symposium, Scottsdale AZ May 5-9, 2014 10
R 150
G 150
B 150
R 200
G 200
B 200
R 69
G 153
B 195
R 0
G 159
B 227
R 196
G 38
B 46
R 107
G 190
B 72
R 209
G 232
B 255
R 153
G 204
B 255
R 94
G 106
B 113
R 0
G 52
B 120
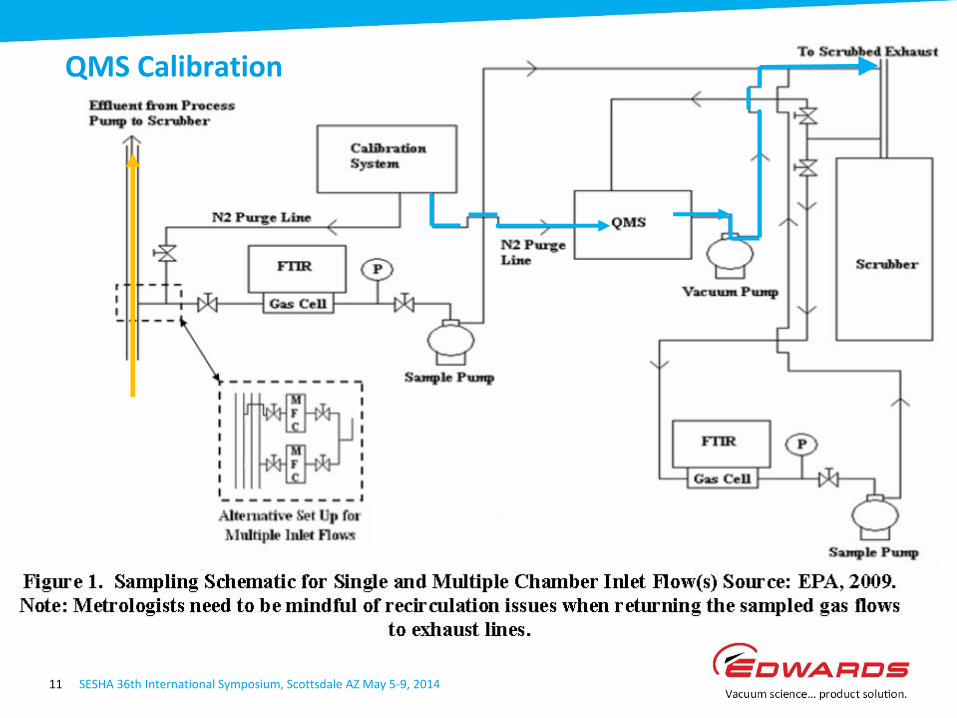
Equipment Setup for The Protocol QMS Calibration
SESHA 36th International Symposium, Scottsdale AZ May 5-9, 2014 11

R 150
G 150
B 150
R 200
G 200
B 200
R 69
G 153
B 195
R 0
G 159
B 227
R 196
G 38
B 46
R 107
G 190
B 72
R 209
G 232
B 255
R 153
G 204
B 255
R 94
G 106
B 113
R 0
G 52
B 120
Determination of Dilution Factor (DF)
• Gases other than GHGs flow into and out of abatement
• Inlet gases include:
– N2 from vacuum pump purge (large)
– Process gases (for Method 2 testing)
– Additional gases, diluents, and purges (e.g. Ar, He, H2, N2O)
• Outlet gases include:
– N2 from vacuum pump purge
– Combustion air (large)
– Combustion byproducts (CO, CO2, NOx, H2O)
– Unabated process gases (these should be in very low concentrations)
– Incombustible purges and process gases (N2, Ar, He)
• DF is typically between 5 and 12 for an Edwards point-of-use (POU) abatement unit
SESHA 36th International Symposium, Scottsdale AZ May 5-9, 2014 12

R 150
G 150
B 150
R 200
G 200
B 200
R 69
G 153
B 195
R 0
G 159
B 227
R 196
G 38
B 46
R 107
G 190
B 72
R 209
G 232
B 255
R 153
G 204
B 255
R 94
G 106
B 113
R 0
G 52
B 120
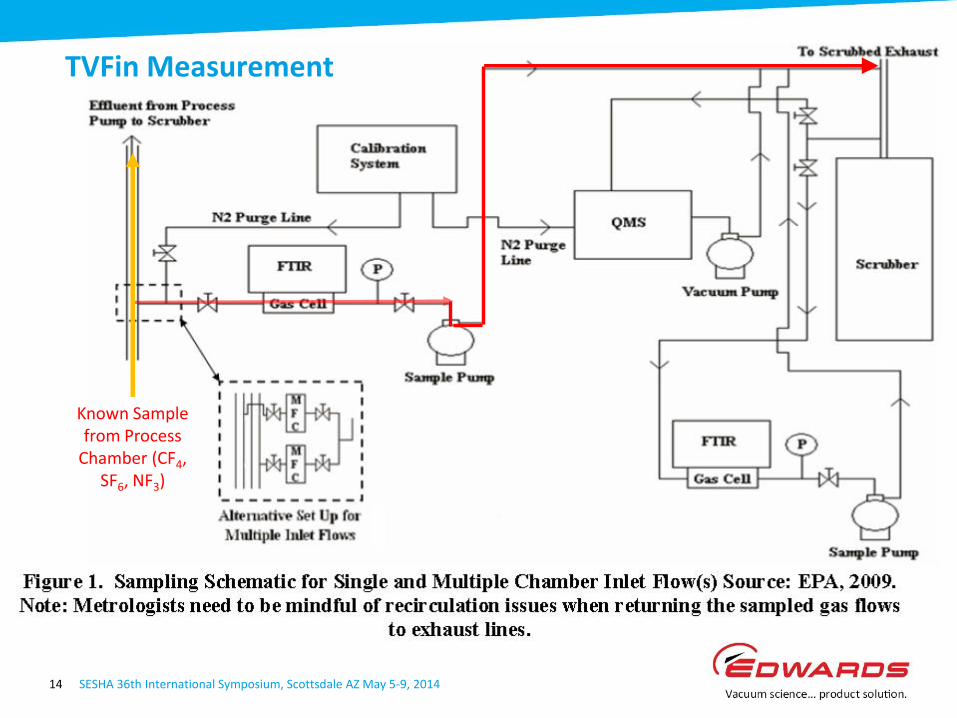
Total Volume Flow In (TVFin) using FTIR
• Known volumes of inert gas (typically NF3, SF6, or CF4) from tool
– Volumes mimic expected flows from process chamber
• 1.5 slm NF3 into chamber might only be 50 sccm out of chamber
• Test all chambers normally in operation
• Known CF4 flow (0.011L) from tool
• Observed CF4 flow out (176 ppm)
– TVFin = 0.011/(176*10E-6)=62.5 slm
SESHA 36th International Symposium, Scottsdale AZ May 5-9, 2014 13
R 150
G 150
B 150
R 200
G 200
B 200
R 69
G 153
B 195
R 0
G 159
B 227
R 196
G 38
B 46
R 107
G 190
B 72
R 209
G 232
B 255
R 153
G 204
B 255
R 94
G 106
B 113
R 0
G 52
B 120
Equipment Setup for The Protocol TVFin Measurement
SESHA 36th International Symposium, Scottsdale AZ May 5-9, 2014 14
Known Sample from Process
Chamber (CF4, SF6, NF3)

R 150
G 150
B 150
R 200
G 200
B 200
R 69
G 153
B 195
R 0
G 159
B 227
R 196
G 38
B 46
R 107
G 190
B 72
R 209
G 232
B 255
R 153
G 204
B 255
R 94
G 106
B 113
R 0
G 52
B 120
Total Volume Flow Out (TVFout) using QMS
• Known volume of noble gas (Ar, Kr) added before abatement
– Theory is that Ar and Kr are not destroyed in abatement
• Lack of abatement should give reliable dilution through abatement device
• Known Kr flow (0.5L) from spike
• Observed Kr flow out (617 ppm)
– TVFout = 0.5/(617*10E-6)=810 slm
SESHA 36th International Symposium, Scottsdale AZ May 5-9, 2014 15

R 150
G 150
B 150
R 200
G 200
B 200
R 69
G 153
B 195
R 0
G 159
B 227
R 196
G 38
B 46
R 107
G 190
B 72
R 209
G 232
B 255
R 153
G 204
B 255
R 94
G 106
B 113
R 0
G 52
B 120
Equipment Setup for The Protocol TVFout Measurement
SESHA 36th International Symposium, Scottsdale AZ May 5-9, 2014 16
Known flows of Kr from
Calibration system through
abatement)
R 150
G 150
B 150
R 200
G 200
B 200
R 69
G 153
B 195
R 0
G 159
B 227
R 196
G 38
B 46
R 107
G 190
B 72
R 209
G 232
B 255
R 153
G 204
B 255
R 94
G 106
B 113
R 0
G 52
B 120
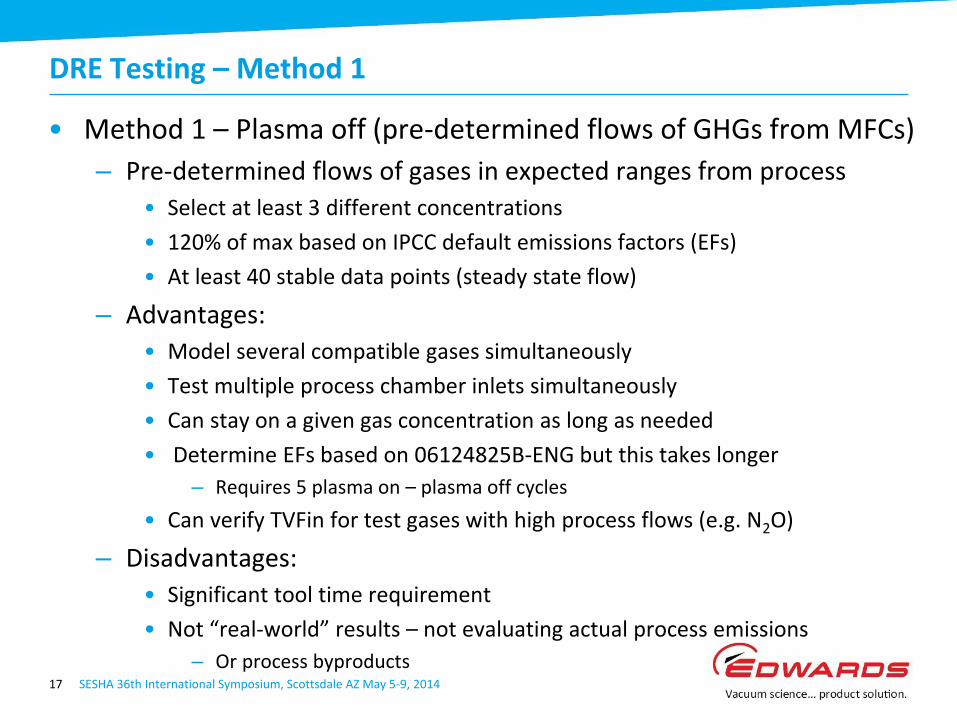
DRE Testing – Method 1
• Method 1 – Plasma off (pre-determined flows of GHGs from MFCs)
– Pre-determined flows of gases in expected ranges from process
• Select at least 3 different concentrations
• 120% of max based on IPCC default emissions factors (EFs)
• At least 40 stable data points (steady state flow)
– Advantages:
• Model several compatible gases simultaneously
• Test multiple process chamber inlets simultaneously
• Can stay on a given gas concentration as long as needed
• Determine EFs based on 06124825B-ENG but this takes longer
– Requires 5 plasma on – plasma off cycles
• Can verify TVFin for test gases with high process flows (e.g. N2O)
– Disadvantages:
• Significant tool time requirement
• Not “real-world” results – not evaluating actual process emissions
– Or process byproducts SESHA 36th International Symposium, Scottsdale AZ May 5-9, 2014 17

R 150
G 150
B 150
R 200
G 200
B 200
R 69
G 153
B 195
R 0
G 159
B 227
R 196
G 38
B 46
R 107
G 190
B 72
R 209
G 232
B 255
R 153
G 204
B 255
R 94
G 106
B 113
R 0
G 52
B 120
Equipment Setup for The Protocol Sample Measurement – Pre-Abatement
SESHA 36th International Symposium, Scottsdale AZ May 5-9, 2014 18
From Process Chamber
(known flows for Method 1, process flows for Method 2)

R 150
G 150
B 150
R 200
G 200
B 200
R 69
G 153
B 195
R 0
G 159
B 227
R 196
G 38
B 46
R 107
G 190
B 72
R 209
G 232
B 255
R 153
G 204
B 255
R 94
G 106
B 113
R 0
G 52
B 120
Equipment Setup for The Protocol
SESHA 36th International Symposium, Scottsdale AZ May 5-9, 2014 19
From Process Chamber
(known flows for Method 1, process flows for Method 2)
Sample Measurement – Post-Abatement
R 150
G 150
B 150
R 200
G 200
B 200
R 69
G 153
B 195
R 0
G 159
B 227
R 196
G 38
B 46
R 107
G 190
B 72
R 209
G 232
B 255
R 153
G 204
B 255
R 94
G 106
B 113
R 0
G 52
B 120
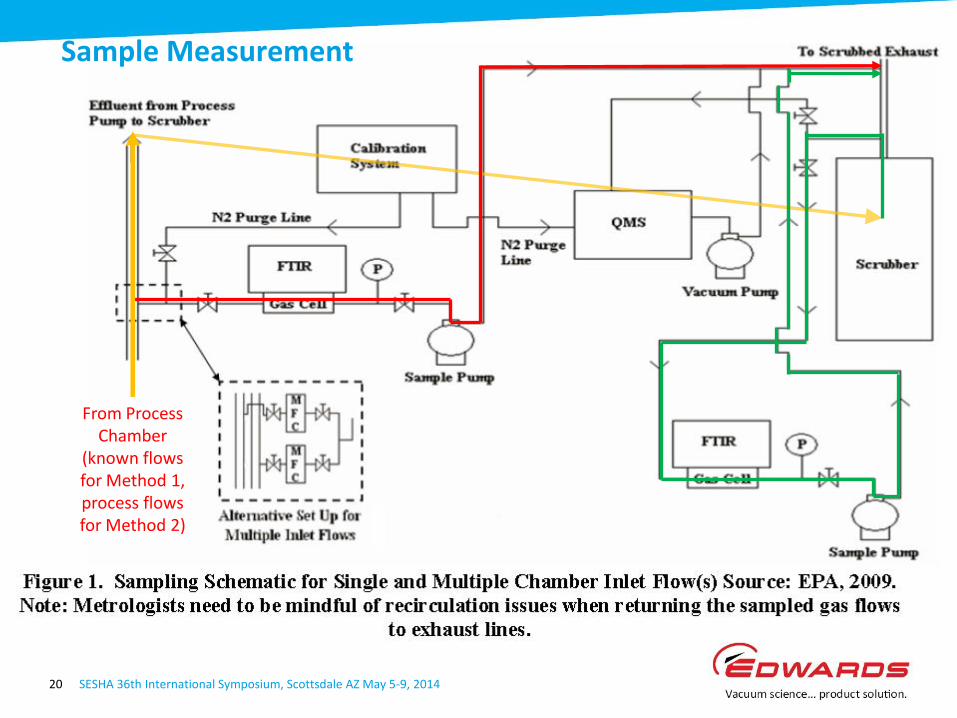
Equipment Setup for The Protocol
SESHA 36th International Symposium, Scottsdale AZ May 5-9, 2014 20
From Process Chamber
(known flows for Method 1, process flows for Method 2)
Sample Measurement

R 150
G 150
B 150
R 200
G 200
B 200
R 69
G 153
B 195
R 0
G 159
B 227
R 196
G 38
B 46
R 107
G 190
B 72
R 209
G 232
B 255
R 153
G 204
B 255
R 94
G 106
B 113
R 0
G 52
B 120
DRE Testing – Method 1
• Flow known quantities of GHGs from MFCs on process chamber; no plasma, no heat, no byproducts
– E.g. 100 sccm, 200 sccm, 300 sccm CF4, SF6, CHF3, etc.
• Gases enter abatement at known concentrations as seen by FTIR
• Gases leave abatement after destruction and are seen by FTIR
– Gases flow for minimum of 40 stable concentration measurements
• Temporal plots typically step functions as seen in previous slides
• Ideally step functions are the same for inlet and outlet results
SESHA 36th International Symposium, Scottsdale AZ May 5-9, 2014 21

R 150
G 150
B 150
R 200
G 200
B 200
R 69
G 153
B 195
R 0
G 159
B 227
R 196
G 38
B 46
R 107
G 190
B 72
R 209
G 232
B 255
R 153
G 204
B 255
R 94
G 106
B 113
R 0
G 52
B 120
DRE Calculations
• DRE calculations are simple in concept:
– But The Protocol requires significant statistical treatment
SESHA 36th International Symposium, Scottsdale AZ May 5-9, 2014 22
DRE = 100% x 1 - ppm out x dilution factor ppm in
Method 1 Method 2

R 150
G 150
B 150
R 200
G 200
B 200
R 69
G 153
B 195
R 0
G 159
B 227
R 196
G 38
B 46
R 107
G 190
B 72
R 209
G 232
B 255
R 153
G 204
B 255
R 94
G 106
B 113
R 0
G 52
B 120
DRE Calculations - Example
• Assume:
– Testing for CF4 from an etch process through a burn-wet abatement device
– TVFin = 44 slm
– TVFout = 515 slm
• DF = 515 / 44 = 11.7
– CF4 pre-abatement = 2341 ppm
– CF4 post-abatement = 7.2 ppm
– DRE = 100% x 1 - ((7.2 ppm x 11.7) / 2341 ppm) = 96.4%
• Statistical treatment addresses noise in the measurements, or for flow variations across the recipe
SESHA 36th International Symposium, Scottsdale AZ May 5-9, 2014 23

R 150
G 150
B 150
R 200
G 200
B 200
R 69
G 153
B 195
R 0
G 159
B 227
R 196
G 38
B 46
R 107
G 190
B 72
R 209
G 232
B 255
R 153
G 204
B 255
R 94
G 106
B 113
R 0
G 52
B 120
DRE Testing – Method 2
• Emissions from live wafers
– Emissions data collected from several sequential wafer sets
• Data from actual process recipes
• Can observe process byproducts as well as precursor gases
– Significant levels of CF4 may be seen as primary recombination product
• May see endpoint during chamber clean step
– Advantages:
• Actual data, not contrived
• Can account for byproducts that may not be abated (CF4, NO2, etc.)
– May be important for evaluation of Criterion Pollutant emissions
– Disadvantages:
• Difficult to control – if gas-on steps are short, quantitation can be difficult
• Total volume flow in (TVFin) may be significantly different from originally-measured TVFin (e.g. a CVD or diffusion process with 40 slm H2 or 20 slm N2O)
• Potential to disrupt Production (e.g. if abatement is accidentally switched off)
SESHA 36th International Symposium, Scottsdale AZ May 5-9, 2014 24

R 150
G 150
B 150
R 200
G 200
B 200
R 69
G 153
B 195
R 0
G 159
B 227
R 196
G 38
B 46
R 107
G 190
B 72
R 209
G 232
B 255
R 153
G 204
B 255
R 94
G 106
B 113
R 0
G 52
B 120
DRE Testing – Method 2
• Measure effluent concentrations from actual process wafers
– Emissions from process tool reflect process gas recipes TO A POINT
• Some gases, such as CH2F2, are largely destroyed in the chamber
• CF4 emission may be similar to or greater than CF4 in process recipe
– CxFy + O2 + plasma carbon + fluorine + oxygen atoms CF4 + COF2
• CF4 is difficult to abate
– Susceptible to changes in Production schedule (no wafers in queue)
SESHA 36th International Symposium, Scottsdale AZ May 5-9, 2014 25
R 150
G 150
B 150
R 200
G 200
B 200
R 69
G 153
B 195
R 0
G 159
B 227
R 196
G 38
B 46
R 107
G 190
B 72
R 209
G 232
B 255
R 153
G 204
B 255
R 94
G 106
B 113
R 0
G 52
B 120
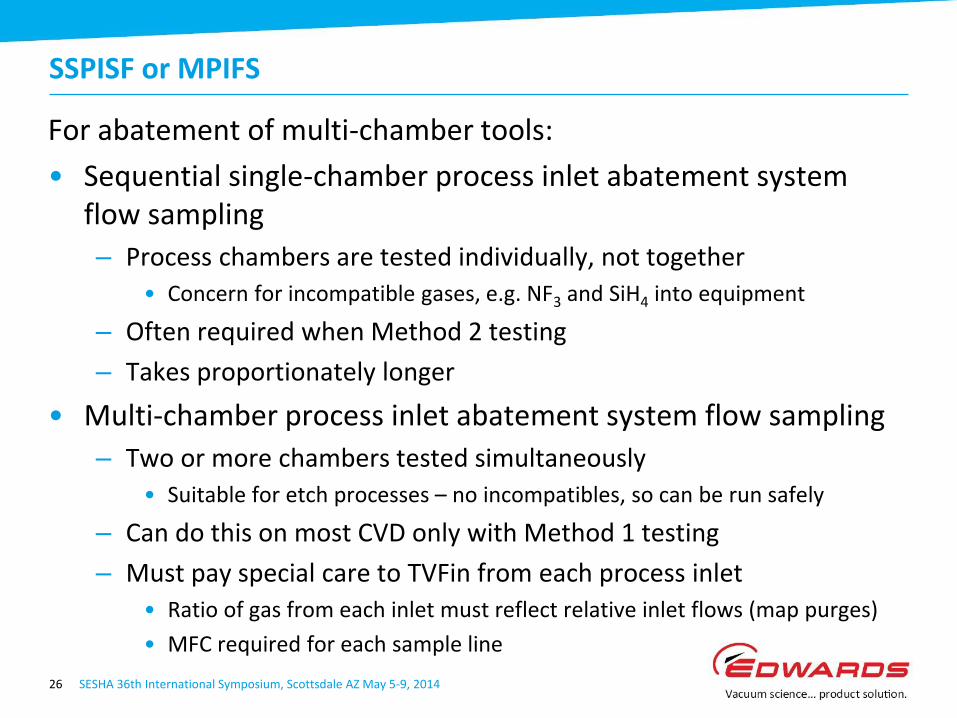
SSPISF or MPIFS
For abatement of multi-chamber tools:
• Sequential single-chamber process inlet abatement system flow sampling
– Process chambers are tested individually, not together
• Concern for incompatible gases, e.g. NF3 and SiH4 into equipment
– Often required when Method 2 testing
– Takes proportionately longer
• Multi-chamber process inlet abatement system flow sampling
– Two or more chambers tested simultaneously
• Suitable for etch processes – no incompatibles, so can be run safely
– Can do this on most CVD only with Method 1 testing
– Must pay special care to TVFin from each process inlet
• Ratio of gas from each inlet must reflect relative inlet flows (map purges)
• MFC required for each sample line
SESHA 36th International Symposium, Scottsdale AZ May 5-9, 2014 26

R 150
G 150
B 150
R 200
G 200
B 200
R 69
G 153
B 195
R 0
G 159
B 227
R 196
G 38
B 46
R 107
G 190
B 72
R 209
G 232
B 255
R 153
G 204
B 255
R 94
G 106
B 113
R 0
G 52
B 120
Minimum Detection Limits
• Concentration of upstream gases of interest are generally high enough for ready detection
– Downstream gases after abatement may be <MDL
• The Protocol suggests a minimum concentration of 10ppm-m
– For typical gas cell 5.11m long, 10ppm-m / 5.11m = 1.96 ppm
– Designated C*
• This is above actual MDL
– The Protocol suggests measurement of MDL for each set of tests by asking tool operator to flow very low flows
• Impractical and time-consuming use of tool time
– Use of artificially high MDL of 1.96 ppm leads to suppressed DREs for undetectable gases
– MDL values for different gases should be determined in the lab
• In the range given in Table 3, Column 2 of The Protocol
SESHA 36th International Symposium, Scottsdale AZ May 5-9, 2014 27
R 150
G 150
B 150
R 200
G 200
B 200
R 69
G 153
B 195
R 0
G 159
B 227
R 196
G 38
B 46
R 107
G 190
B 72
R 209
G 232
B 255
R 153
G 204
B 255
R 94
G 106
B 113
R 0
G 52
B 120
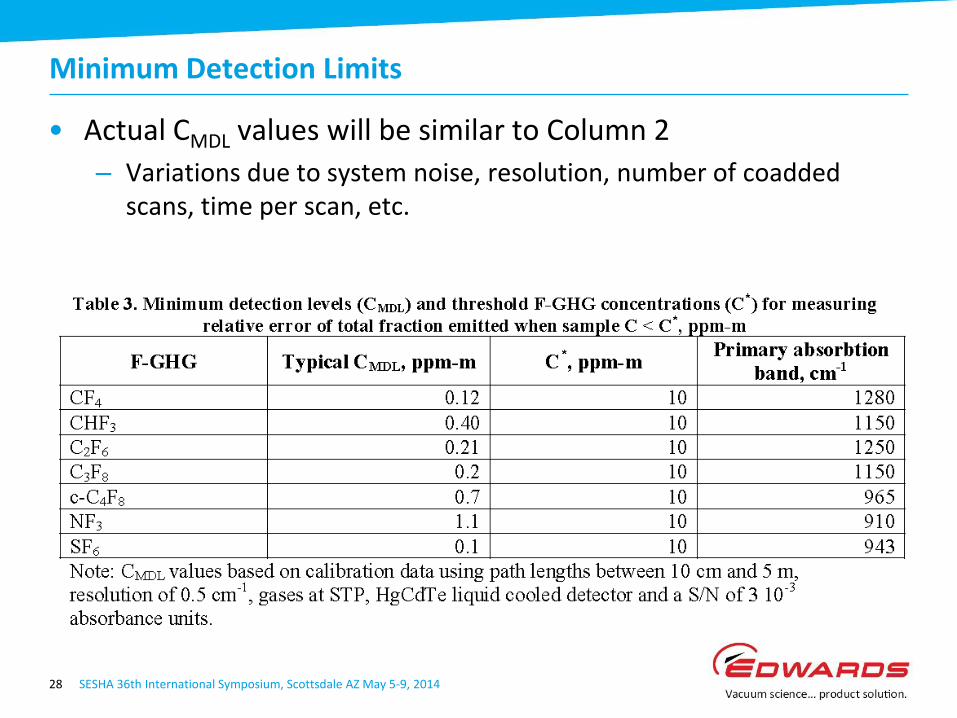
Minimum Detection Limits
• Actual CMDL values will be similar to Column 2
– Variations due to system noise, resolution, number of coadded scans, time per scan, etc.
SESHA 36th International Symposium, Scottsdale AZ May 5-9, 2014 28

R 150
G 150
B 150
R 200
G 200
B 200
R 69
G 153
B 195
R 0
G 159
B 227
R 196
G 38
B 46
R 107
G 190
B 72
R 209
G 232
B 255
R 153
G 204
B 255
R 94
G 106
B 113
R 0
G 52
B 120
Considerations for DRE Testing
• Testing seldom goes as planned
– “No plan survives contact with the enemy “– 19th Century Prussian Field
Marshall Helmuth Karl Bernhard Graf von Moltke
• Request twice as much tool time as you will need if everything goes perfectly
– Unexpected things happen: equipment fails, pumps leak, sample lines plug, Production changes plans, operators go on break, communication between software and hardware stops, abatement isn’t set up properly, can’t find the sample ports, etc.
• Plan several DRE tests in a week; 2 per day is very reasonable
– 3 / day is really pushing it
– Keep a half day in your back pocket if needed
SESHA 36th International Symposium, Scottsdale AZ May 5-9, 2014 29

R 150
G 150
B 150
R 200
G 200
B 200
R 69
G 153
B 195
R 0
G 159
B 227
R 196
G 38
B 46
R 107
G 190
B 72
R 209
G 232
B 255
R 153
G 204
B 255
R 94
G 106
B 113
R 0
G 52
B 120
Typical Schedule for DRE Testing - 1
• Equipment setup several hours early for warm-up and vacuum stabilization
• Add liquid N2 to FTIR detectors
• Establish connection points for sample lines between vacuum pump and abatement
• Establish exhaust ports for sample stream
– Upstream sample should be returned to pre-abatement line if possible
– Fab Support should make and break connections
• Verify abatement combustor configuration and flows
– “Low Fire” or “High Fire” as needed for GHG abatement
– Record all settings, make diagrams, take photos of setup
• Run mass calibration of QMS
SESHA 36th International Symposium, Scottsdale AZ May 5-9, 2014 30

R 150
G 150
B 150
R 200
G 200
B 200
R 69
G 153
B 195
R 0
G 159
B 227
R 196
G 38
B 46
R 107
G 190
B 72
R 209
G 232
B 255
R 153
G 204
B 255
R 94
G 106
B 113
R 0
G 52
B 120
Typical Schedule for DRE Testing - 2
• Measure TVFout using Kr and QMS in appropriate combustor configuration
• Determine TVFin for each sample inlet – Contact tool operator
• These must be done individually for each process line with 3 flow rates each
• Adjust sample slip streams based on TVFin values
• Collect DRE data
– This can take anywhere from 45 minutes to 3 hours
• Purge sample lines back into pipework (not into room)
– Contact Abatement Support to break sample lines
• Shut down, pack up, and set up for next test or secure equipment for storage
SESHA 36th International Symposium, Scottsdale AZ May 5-9, 2014 31

R 150
G 150
B 150
R 200
G 200
B 200
R 69
G 153
B 195
R 0
G 159
B 227
R 196
G 38
B 46
R 107
G 190
B 72
R 209
G 232
B 255
R 153
G 204
B 255
R 94
G 106
B 113
R 0
G 52
B 120
Partial Checklist for Analyst
• Equipment:
– FTIRs (2); short path for pre-abatement and long for post-abatement
– QMS
– Gas calibration system for QMS
– Supply of calibration gases for QMS
– MFCs for sampling multiple inlets
– Sampling pumps for both FTIRs
– Heated sample lines (at temperature of gas cells; typically 120o-150oC)
– Independent exhaust lines for pre- and post-abatement gas streams
– Carts and extension cords
– Laptops (adequate to drive all analytical equipment)
– Recipes from Fab sponsor 2 weeks in advance
– Extra tubing and cutter, zip ties, tape (extension cords to floor), hand tools, etc.
SESHA 36th International Symposium, Scottsdale AZ May 5-9, 2014 32

R 150
G 150
B 150
R 200
G 200
B 200
R 69
G 153
B 195
R 0
G 159
B 227
R 196
G 38
B 46
R 107
G 190
B 72
R 209
G 232
B 255
R 153
G 204
B 255
R 94
G 106
B 113
R 0
G 52
B 120
Partial Checklist for Fab Sponsor
• Verify scope with analyst 3 weeks in advance
– Cost, type and number of tests, format and due date of reports, etc.
• Verify tool time with tool owner and Production 1 week in advance
– Ask for 8 hours; 4 hours is adequate in most cases
• Arrange badging for analysts
• Arrange for secure storage of analytical equipment
• Find liquid N2 for FTIR detectors, house N2 for FTIR purge and air bearing
• Establish lines of communication between analyst and tool operator
• Obtain and verify (in advance) process recipe to be used for test (Method 2)
• Identify tool operator to be available for duration of test
• Re-verify tool time with tool owner and Production 1 – 2 days before testing
• Identify alternate tools when Production says “No”
• Assist analyst with setup – Warning tape, locating outlets, Safety, etc.
• Assist analyst communicating with tool operator
SESHA 36th International Symposium, Scottsdale AZ May 5-9, 2014 33

R 150
G 150
B 150
R 200
G 200
B 200
R 69
G 153
B 195
R 0
G 159
B 227
R 196
G 38
B 46
R 107
G 190
B 72
R 209
G 232
B 255
R 153
G 204
B 255
R 94
G 106
B 113
R 0
G 52
B 120
Partial Checklist for Abatement Support
• Identify sample ports 4 weeks in advance
• Perform cleaning and maintenance before DRE testing
• Verify combustor configuration and setup details are correct for the GHGs present on that tool
– Verify with Abatement Applications personnel that the appropriate configuration was set up on that abatement in the first place
• Verify total inlet flows do not exceed specifications (N2 purge from pump)
– Verify additional purges don’t exceed spec or that they shut off during clean step
• Verify interface and communication with process tool (if any)
• Verify that abatement can be manually switched into “Low Fire” or “High Fire” if necessary
– Verify that this will not cause the tool to abort if interfaced
• Connect and disconnect sample ports, house N2 lines
– For safety and tool uptime considerations, 3rd party analyst should not be allowed to make / break connections
SESHA 36th International Symposium, Scottsdale AZ May 5-9, 2014 34
R 150
G 150
B 150
R 200
G 200
B 200
R 69
G 153
B 195
R 0
G 159
B 227
R 196
G 38
B 46
R 107
G 190
B 72
R 209
G 232
B 255
R 153
G 204
B 255
R 94
G 106
B 113
R 0
G 52
B 120
Summary
• EPA Protocol 430-R-10-003 describes how to test POU abatement for DRE of GHGs
– FTIR is used for detection of F-GHGs
• Detailed attention is given to dilution before and after abatement
• Method 1 – Testing pure gases
– Less complicated, but simulations only
• Method 2 – Testing live wafers
– Real-life data, but more complicated
• DRE testing is very involved
– Partial checklists are provided for all participants
• The devil is in the details !!!
SESHA 36th International Symposium, Scottsdale AZ May 5-9, 2014 35