Embed Size (px)
Citation preview

Environmental Values 2016 Public Environmental Report
1
environmental values 2016
public environmental report
Chevron North Sea Limited

Environmental Values 2016 Public Environmental Report
2
Contents
Introduction ........................................................................................................................................ 3
About Chevron .................................................................................................................................. 4
Chevron 2016 Activities - UK ......................................................................................................... 5
Operational Excellence ................................................................................................................... 6
OE Policy - Corporate Major Accident Prevention Policy (CMAPP) ........................................ 7
Environmental Stewardship ............................................................................................................ 8
2016 Environmental Performance Summary ............................................................................... 9
Performance Metrics ........................................................................................................................ 9
Environmental Stewardship Improvement Program ................................................................. 10
Emissions ........................................................................................................................................ 11
Energy Efficiency ............................................................................................................................ 13
Oil in Produced Water ................................................................................................................... 14
Chemicals ........................................................................................................................................ 16
Oil and Chemical Releases/Spills to Sea ................................................................................... 19
Wastes ............................................................................................................................................. 20
Glossary ........................................................................................................................................... 22
Environmental Values 2016 Public Environmental Report
3
Introduction Pursuant to OSPAR Recommendations 2003/5, operators on the UK Continental Shelf (UKCS) should produce an annual environmental statement and make it available to the public and the Department of Business, Energy and Industrial Strategy (DBEIS). This environmental report is intended to fulfil this requirement. This document covers Chevron North Sea Limited’s (CNSL) operations and activities in the United Kingdom (UK), shares our offshore environmental performance data for 2016, highlights how we demonstrate our values and reinforces our mission to continually improve our performance and reduce any potential impacts from our operations. Ingrained in The Chevron Way is our commitment to protecting people and the environment, which includes developing energy safely, reliably and responsibly. We place the highest priority on the health and safety of our workforce and protection of our assets, communities and the environment. We deliver world-class performance with a focus on preventing high-consequence incidents. We have four environmental principles that define our commitment to operating in an environmentally responsible manner: these are 1) to include environmental considerations in decision making, 2) to minimise our environmental footprint, 3) to operate responsibly and 4) to steward our sites. We incorporate these principles into our business through our Operational Excellence Management System (OEMS). This systematic management system includes provision to identify and manage potentially significant environmental impacts and assess our activities, with the aim of improving performance. At Chevron, Operational Excellence (OE) is integral to how we run our business to achieve our vision of success. At Chevron, we are committed to achieving our goal of zero incidents and will continue to focus on achieving world-class performance in all measures of safety and environmental stewardship. We hope you find the information in this report to be informative and useful.

Environmental Values 2016 Public Environmental Report
4
About Chevron
Chevron Corporation is one of the world's leading integrated energy companies. Through its
subsidiaries that conduct business worldwide, the company is involved in virtually every facet of the
energy industry. Chevron explores for, produces and transports crude oil and natural gas; refines,
markets and distributes transportation fuels and lubricants; manufactures and sells petrochemicals
and additives; generates power; and develops and deploys technologies that enhance business value
in every aspect of the company's operations.
At Chevron, we conduct our business in a socially responsible and ethical manner. We respect the law, support universal human rights, protect the environment and benefit the communities in which we work. Our Corporate Responsibility Report Highlights summarises some of these focus areas, which include environmental management, climate change and energy efficiency. Our managing climate change risks: a perspective for investors, addresses the topic of climate change risk by providing the Company’s views on long-term fundamentals of the energy industry, the processes by which we manage risks and the significant steps we have taken to manage greenhouse gases (GHGs).

Environmental Values 2016 Public Environmental Report
5
Chevron 2016 Activities - UK Existing Assets
CNSL has working interests in 11 offshore producing fields, including four operated fields (Alba, 23.4
percent; Captain, 85 percent; Erskine, 50 percent; and Alder, 73.7 percent) and seven non-operated
fields (Britannia, 32.4 percent; Brodgar, 25 percent; Callanish, 16.5 percent; Clair, 19.4 percent;
Elgin/Franklin, 3.9 percent; Enochdhu, 50 percent; and Jade, 19.9 percent).
Drilling
During 2016 drilling operations were undertaken using the Blackford Dolphin Mobile Offshore Drilling
Unit (MODU). A single production well was safely and successfully completed in the Alder field,
bringing a new stream of natural gas to Chevron’s production portfolio and the United Kingdom. In
addition to the Alder well, two well re-drills were also undertaken at the Captain Field.
Ongoing / Future Projects
CNSL continues to implement projects designed to sustain production and maximise the recovery
from the United Kingdom Continental Shelf. Key projects include:
Captain Enhanced Oil Recovery (EOR)
The Captain EOR Project is the next development phase of the Captain Field and is designed to
increase field recovery by injecting a polymer/water mixture into the Captain reservoir. Front End
Engineering and Design (FEED) activities continued to progress in 2016 and included a polymer
injection pilot. The company also began an expansion of the existing polymer injection system on the
wellhead production platform. The scope includes six new polymer injection wells and modifications to
platform facilities. Produced water is re-injected into the oil reservoir on the Captain Field. Therefore,
there is no discharge to sea of produced water or polymer. At the end of 2016, proved reserves had
not been recognized for this project.
Rosebank
The Rosebank Field is 80 miles (129 km) northwest of the Shetland Islands in 3,700 feet (1,115 m) of
water. Chevron operates and holds a 40 percent interest in the project. FEED activities continued to
progress in 2016, with a focus on engineering to improve predictability in execution cost and
schedule. The selected design is a 17-well subsea development tied back to a Floating Production
Storage and Offloading (FPSO) vessel, with natural gas exported via pipeline. The design capacity of
the project is 100,000 barrels of crude oil and 80 million cubic feet of natural gas per day. The
potential recoverable volumes at Rosebank are expected to be more than 300 million barrels. At the
end of 2016, proved reserves had not been recognized for this project.
Clair Ridge
The Clair Ridge Project, located 47 miles (75 km) west of the Shetland Islands, is the second
development phase of the Clair Field. Chevron holds a 19.4 percent non-operated working interest in
the project. Installation and hook-up activities progressed during 2016. The design capacity of the
project is 120,000 barrels of crude oil and 100 million cubic feet of natural gas per day. First
production is expected in 2018. The project is estimated to provide incremental potentially
recoverable oil-equivalent resources in excess of 600 million barrels. Proved reserves have been
recognized for the Clair Ridge Project. The Clair Field has an estimated production life until 2050.
Environmental Values 2016 Public Environmental Report
6
Operational Excellence Operational Excellence (OE) is the systematic management of safety, health, environment, reliability and efficiency to achieve world class performance. CNSL (and Chevron globally) place the highest importance on OE – it is fundamental to the company’s success and supports our commitment to protecting people and the environment. Chevron’s OE objectives are to:
Achieve an incident and injury-free work place;
Promote a healthy workforce and mitigate significant workplace health risks;
Identify and mitigate environmental and process safety risks;
Operate incident-free with industry leading asset integrity and reliability; and
Efficiently use natural resources and assets.
The OEMS is Chevron’s standard approach for achieving world-class performance and is applied by CNSL. The OEMS consists of three parts: Leadership Accountability Leadership is the single largest factor for success in OE. Our leaders establish the vision and set objectives that challenge the organisation to achieve world-class results. They direct the Management System Process (MSP), setting priorities and monitoring progress on plans that focus on the highest-impact items. Leaders visibly demonstrate their commitment through personal engagement with the workforce, showing concern and care for the health and safety of every individual. Management System Process We employ a systematic approach that drives progress toward world-class performance. The MSP is linked to the business planning process, and begins with defining a vision of success and setting objectives. Gaps between current performance and these objectives are uncovered during the assessment phase, then plans are developed to close the gaps, the plan is implemented and a review of plan implementation and performance is completed. OE Expectations Our corporate expectations for OE are detailed under 13 Elements. The expectations are met through processes and programmes put in place by local management. Many expectations are supported by corporate standard OE processes. Environmental issues are covered under Element 7: Environmental Stewardship, the objective of which is to strive to continually improve environmental performance and reduce impacts from our operations. OE Assurance is covered under Element 12 and includes assurance of process safety, personal safety and health, environment, reliability and efficiency. This process establishes a requirement to put in place a comprehensive internal OE Audit program. In addition to this, CNSL are audited as part of a corporate-level OE Audit program. In support of CNSL’s strong commitment to compliance, all employees and contractors are encouraged to use the Chevron Hotline to report any activities that may involve violations of the law, Chevron’s Business Conduct and Ethics Code, or company policies. The Hotline provides a direct, effective and risk-free way to report such suspected violations.
Chevron’s OE Vision is to be recognised and admired by industry and the communities in which we operate as world class in process safety, personal safety & health, environment, reliability and efficiency delivering incident free operations. CNSL vision is reflected in the following OE Policy which meets the requirements of The Corporate Major Accident Prevention Policy (CMAPP) required by The Offshore Installations (Offshore Safety Directive) (Safety Case etc) Regulations 2015; The Safety Policy required by the Health & safety at Work etc. Act 1974; and The Environmental Policy required by ISO 14001 environmental management standard. The OE Policy demonstrates endorsement of the OE Policy by the President and Managing Director; a commitment to assess and manage the risks and impacts associated with our operations; and a commitment to comply with legislative requirements and corporate policies.

Environmental Values 2016 Public Environmental Report
7
OE Policy - Corporate Major Accident Prevention Policy (CMAPP)

Environmental Values 2016 Public Environmental Report
8
Environmental Stewardship The expectation of Chevron’s Environmental Stewardship (ES) process is to strive to continually improve environmental performance and reduce impacts from our operations. It is applied across the life cycle of an asset and is used to identify, assess and manage potential environmental impacts and benefits. To achieve this, Chevron has implemented a step-wise process to be followed on an annual basis. First, an inventory of all emissions, releases, wastes and potentially impacted natural resources is prepared. This is followed by a procedure to identify, assess, mitigate and manage any significant risks and impacts to the environment associated with operations, emissions, releases and wastes. The outcome is an annually updated ES plan. CNSL have been preparing plans using the ES process since 2010. The management system is independently certified to the international standard (ISO) 14001 and requires CNSL to engage independent auditors who verify that our onshore and offshore operations meet requirements. The ES plan includes objectives and targets for environmental performance, details of improvement implementation programmes and the process for tracking progress in meeting environmental objectives. The ES plan is approved by senior management and is aligned with other business and OE plans. All CNSL operations and projects have the potential to impact on the environment and they are all subject to strict environmental regulatory controls which require CNSL to prepare and submit regulatory applications to gain approval before activities begin and during the ongoing operational activities. We monitor and report our ongoing emissions, discharges and waste streams to ensure we meet regulatory requirements and do not cause significant impact on the environment. In the event of an unplanned release/spill to sea, or a non-compliance with regulatory requirements, notification would be made to the appropriate regulatory authorities and action taken to respond to any threat of or actual pollution. Investigations of incidents are conducted to gain any learnings or actions to prevent recurrence. The ES process is used to help provide assurance that we are protecting the environment and meeting our internal and regulatory requirements and obligations.

Environmental Values 2016 Public Environmental Report
9
2016 Environmental Performance Summary
Performance Metrics CNSL is committed to continually improving environmental performance. This is achieved by integrating environmental objectives and targets into the ES plan and regularly evaluating progress to adjust if required. CNSL sets performance targets annually for key environmental aspects (produced water, oil releases/spills, waste and air emissions) to achieve our OE objectives. CNSL’s performance against targets for key 2016 environmental focus areas is summarised in the table below: Table 1 - CNSL 2016 Performance Metrics
CNSL
Units Result Target
Oil spill volume rate bbls/MMbbls produced
0.08 0.5
Energy efficiency Chevron energy intensity1
312 371
Greenhouse gas emission rate tonnes CO2 equivalent (tCO2e)/MBOE
20 32
CO2 emissions tonnes 374,1162 N/A
Oil-in-produced water mass tonnes 73.67 N/A
ISO 14001 certification maintained yes/no Yes Maintain
Environmental audits completed percent 1003 100
Production operations waste recycling/reuse
percent 764 70
1 The Chevron Energy Intensity metric is the ratio of current energy use (MMBTU/D) per unit of production (MBOE/D). Lower actual figures are better.
2 For the 2016 period, CNSL surrendered a total of 373,571 tonnes of CO2 in allowances and credits under the EU Emission Trading System (ETS). The total represented here includes relatively small additional emissions from Erskine and fugitive, oil loading and venting emissions from Alba and Captain, all of which are out of scope for the EU ETS.
3 Planned audits completed on Captain, Alba, Blackford Dolphin and Erskine.
4 This metric relates to the proportion of waste from UK production operations for which waste recycling is possible. The figure excludes drilling-related wastes and waste generated from occasional operations for which there is no current alternative but disposal in accordance with applicable law. Such disposed waste streams are tracked and reported. The metric is set this way to allow meaningful comparison of year on year performance in managing our routine waste streams.
Environmental Values 2016 Public Environmental Report
10
Environmental Stewardship Improvement Program As part of the preparation of the annual Environmental Stewardship plan, improvement opportunities
were identified by CNSL. These actions were grouped into improvement plans for CNSL’s UK
producing assets (Alba, Captain, and Erskine) and for activities associated with drilling including the
use of mobile offshore drilling unit (MODU). Alder was not in scope during this review period as it was
not in production.
The improvement opportunities centred around strengthening arrangements associated with
prevention of, and response to, incidents and releases; produced water management; reduction of air
emissions and management of waste. Progress in completing these actions was tracked throughout
the year and was used as a leading measure of continual environmental performance improvement.
By 2016, year-end, CNSL achieved 100% completion of its environmental stewardship high priority
opportunities.
In addition to improvement opportunities raised directly via the ES process there are also
arrangements in place to drive continual improvement in response to compliance audits; regulatory
inspections/changes; and/or ongoing OE and asset work scopes.

Environmental Values 2016 Public Environmental Report
11
Emissions The potential environmental impacts of atmospheric emissions from oil and gas exploration and
production operations include acid rain formation from oxides of nitrogen and sulphur, photochemical
smog from the reaction of sunlight with nitrogen oxides and volatile organic compounds (VOCs), and
the potential for climate change associated with greenhouse gases from combustion of fossil fuels.
In the UK, CNSL monitor and measure the atmospheric emissions arising from all our major sources
and report these annually as part of our engagement in the European Union (EU) Emissions Trading
System (ETS), in our detailed annual atmospheric reports submitted to the regulator, and additionally
to our head office as part of our global Chevron corporate reporting requirements.
Figure 1: CNSL Annual CO2 Emissions 2012 – 20165
Emissions of carbon dioxide (CO2) from CNSL activities are mainly as a result of hydrocarbon
combustion in power generation and some gas flaring from our Captain and Alba installations, and
from the Alder Field via the Conoco Philips operated Britannia platform. Emissions reported as tonnes
CO2 are shown in figure 1. Other gaseous emissions, such as N2O, SO2 and CO, are also shown
(figure 2). In 2016, CNSL continued to strive to reduce emissions arising from our operations. The
increase in emissions from 2014 to 2016 shown in figures 1 and 2, corresponds with production
increases.
5 Includes emissions from Chevron operated fields (Alba, Captain and Erskine) with atmospheric emissions only.
0
50,000
100,000
150,000
200,000
250,000
300,000
350,000
400,000
450,000
2012 2013 2014 2015 2016
Ton
ne
s C
O2
Total Atmospheric Emissions by Source
F-Gases
Venting, incl oil loading
Flaring
Fuel Gas
Fugitives
Diesel
Environmental Values 2016 Public Environmental Report
12
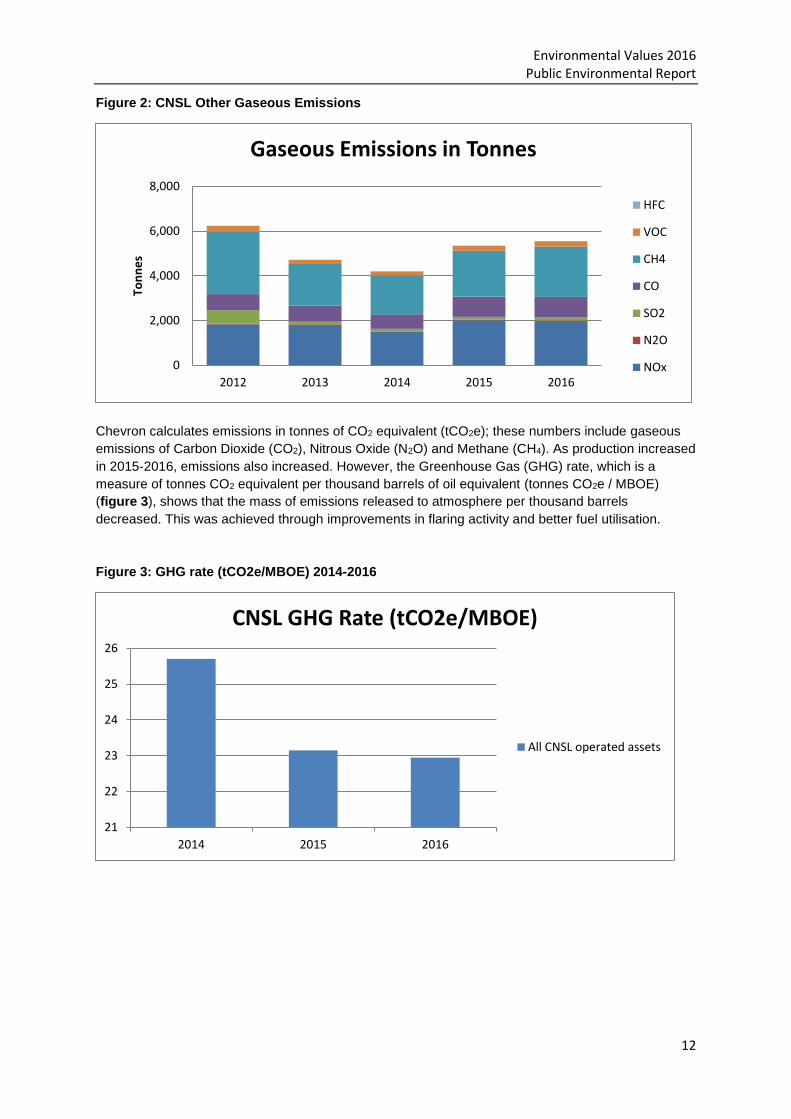
Figure 2: CNSL Other Gaseous Emissions
Chevron calculates emissions in tonnes of CO2 equivalent (tCO2e); these numbers include gaseous
emissions of Carbon Dioxide (CO2), Nitrous Oxide (N2O) and Methane (CH4). As production increased
in 2015-2016, emissions also increased. However, the Greenhouse Gas (GHG) rate, which is a
measure of tonnes CO2 equivalent per thousand barrels of oil equivalent (tonnes CO2e / MBOE)
(figure 3), shows that the mass of emissions released to atmosphere per thousand barrels
decreased. This was achieved through improvements in flaring activity and better fuel utilisation.
Figure 3: GHG rate (tCO2e/MBOE) 2014-2016
0
2,000
4,000
6,000
8,000
2012 2013 2014 2015 2016
Ton
ne
sGaseous Emissions in Tonnes
HFC
VOC
CH4
CO
SO2
N2O
NOx
21
22
23
24
25
26
2014 2015 2016
CNSL GHG Rate (tCO2e/MBOE)
All CNSL operated assets
Environmental Values 2016 Public Environmental Report
13
Energy Efficiency As a significant amount of energy is required to power installations and will result in various
atmospheric emissions, improving energy efficiency is good environmental and business practice.
The Chevron Upstream Energy Intensity (UEI) metric is a measure of total actual energy used
(MMBTU/D) divided by actual gross operated production (MBOE/D).
Continuous improvement requires constant focus on energy efficiency opportunities, such as
designing energy efficiency into capital projects, keeping existing equipment efficient through proper
maintenance and upgrading and auditing and benchmarking progress. Energy efficiency and
conservation are the most immediate and cost-effective sources of ‘new’ greenhouse gas-free energy.
Chevron undertakes a variety of actions to reduce emissions and improve the energy efficiency of its
operations. In the UK during 2016, CNSL’s improvement projects continued to focus on maximising
facility uptime, increasing compressor reliability and maximising use of gas turbines for power
generation, thus reducing our diesel consumption. The focus areas continue to be those installations
regulated under the European Union (EU) Emissions Trading Scheme (ETS).
In 2016, the CNSL Upstream Energy Intensity (UEI) was 312 against a target value of 371. This
value reflects continued improved compressor performance at Captain, and ongoing optimisation of
the import gas system at Alba to reduce diesel use.
Environmental Values 2016 Public Environmental Report
14
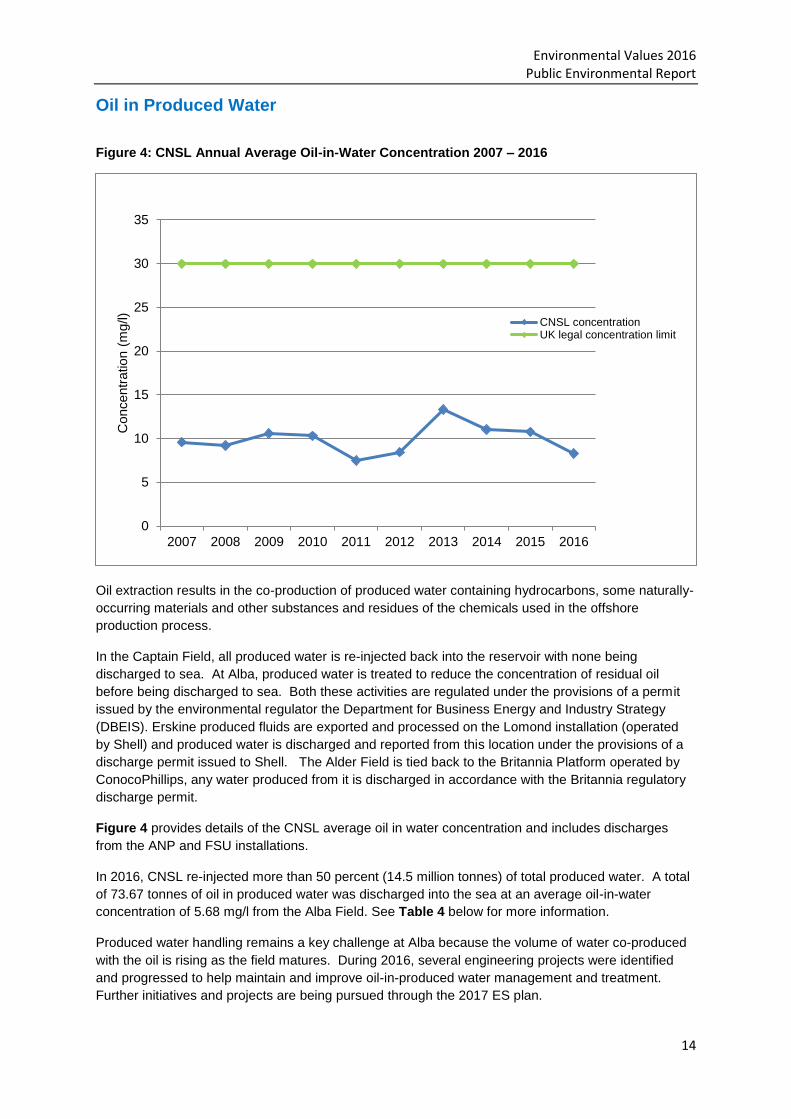
Oil in Produced Water
Figure 4: CNSL Annual Average Oil-in-Water Concentration 2007 – 2016
Oil extraction results in the co-production of produced water containing hydrocarbons, some naturally-
occurring materials and other substances and residues of the chemicals used in the offshore
production process.
In the Captain Field, all produced water is re-injected back into the reservoir with none being
discharged to sea. At Alba, produced water is treated to reduce the concentration of residual oil
before being discharged to sea. Both these activities are regulated under the provisions of a permit
issued by the environmental regulator the Department for Business Energy and Industry Strategy
(DBEIS). Erskine produced fluids are exported and processed on the Lomond installation (operated
by Shell) and produced water is discharged and reported from this location under the provisions of a
discharge permit issued to Shell. The Alder Field is tied back to the Britannia Platform operated by
ConocoPhillips, any water produced from it is discharged in accordance with the Britannia regulatory
discharge permit.
Figure 4 provides details of the CNSL average oil in water concentration and includes discharges
from the ANP and FSU installations.
In 2016, CNSL re-injected more than 50 percent (14.5 million tonnes) of total produced water. A total
of 73.67 tonnes of oil in produced water was discharged into the sea at an average oil-in-water
concentration of 5.68 mg/l from the Alba Field. See Table 4 below for more information.
Produced water handling remains a key challenge at Alba because the volume of water co-produced
with the oil is rising as the field matures. During 2016, several engineering projects were identified
and progressed to help maintain and improve oil-in-produced water management and treatment.
Further initiatives and projects are being pursued through the 2017 ES plan.
0
5
10
15
20
25
30
35
2007 2008 2009 2010 2011 2012 2013 2014 2015 2016
Concentr
ation (
mg/l)
CNSL concentrationUK legal concentration limit

Environmental Values 2016 Public Environmental Report
15
In addition to managing oil-in-water concentrations and discharge, quantities of sand are also
produced with the water at Alba. Sand management is required to maintain optimal oil-in-produced
water operations. In 2016, 161 tonnes of sand were removed by online washing activities.
Table 4 – CNSL 2016 Oil-in-Produced Water Data
Facility Oil-in produced water discharge concentration
(mg/l)
Oil discharged
(tonnes)
Water discharged
(tonnes)
Water injected (tonnes)
Captain Wellhead Protector Platform (WPP)
N/A N/A N/A 14,614,825
Alba Floating Storage Unit (FSU)
14.67 0.393 26,721 N/A
Alba Northern Platform (ANP)
5.69 73.28 13,202,235 N/A
Total 5.686 73.67 13,228,956 14,614,825
6 This figure is not the direct average of the FSU and ANP discharge concentrations, but is weighted to capture the fact that there is relatively much more produced water discharge on ANP than on the FSU. Hence, the overall figure closely matches that of the ANP individually.

Environmental Values 2016 Public Environmental Report
16
Chemicals Figure 5 – CNSL Annual Mass of Production Chemicals Discharged 2007 – 20167
Many different types of chemical are used and are an essential requirement in drilling and production
operations – primarily to control corrosion, inhibit bacterial growth, assist with the production process,
and assist with the drilling process. Due to the nature of these processes some discharge of
chemicals to the sea will occur. Chemical use and discharge is strictly regulated and a permit is
required before any use or discharge to sea of a production or drilling chemical can take place.
In 2016, approximately 35 percent of the production chemicals used were discharged to sea, most of
which were low hazard - that is chemicals classed E or banded Gold under the regulated Offshore
Chemical Notification Scheme. A breakdown of CNSL chemical use by operation is provided in Table
5 below, with a breakdown of discharge by chemical type provided in Table 6 below.
CNSL continues to focus on replacement of higher hazard chemicals with less hazardous substitutes
where this is technically feasible. Discharge of chemicals is affected significantly by increased water
production at CNSL’s Alba Field as it matures. Since 1998, all water produced from CNSL’s Captain
Field reservoir has been used either as reinjection water for reservoir pressure maintenance or as
power water for downhole hydraulic pumps; chemical discharges at this field are therefore already
minimal.
CNSL discharged 1520 tonnes of chemicals from our drilling operations during 2016, approximately
15 percent of the total chemicals used in these activities. Most of these chemicals were low hazard
chemicals.
7 Graph shows production chemicals discharged only. Drilling activity varies considerably from year to year so inclusion of this data does not allow meaningful comparison of data.
0
1000000
2000000
3000000
4000000
5000000
6000000
7000000
2007 2008 2009 2010 2011 2012 2013 2014 2015 2016
Mass o
f pro
duction c
hem
icals
dis
charg
ed (
kg)
CNSL
Environmental Values 2016 Public Environmental Report
17
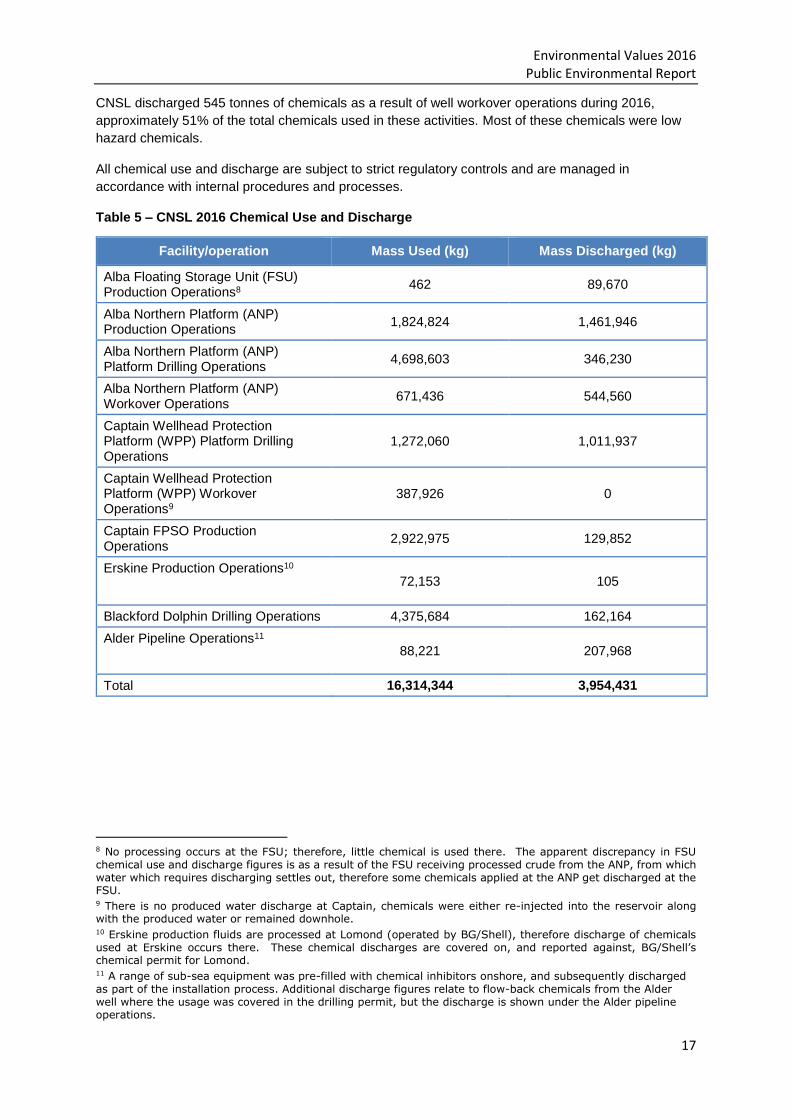
CNSL discharged 545 tonnes of chemicals as a result of well workover operations during 2016,
approximately 51% of the total chemicals used in these activities. Most of these chemicals were low
hazard chemicals.
All chemical use and discharge are subject to strict regulatory controls and are managed in
accordance with internal procedures and processes.
Table 5 – CNSL 2016 Chemical Use and Discharge
Facility/operation Mass Used (kg) Mass Discharged (kg)
Alba Floating Storage Unit (FSU) Production Operations8
462 89,670
Alba Northern Platform (ANP) Production Operations
1,824,824 1,461,946
Alba Northern Platform (ANP) Platform Drilling Operations
4,698,603 346,230
Alba Northern Platform (ANP) Workover Operations
671,436 544,560
Captain Wellhead Protection Platform (WPP) Platform Drilling Operations
1,272,060 1,011,937
Captain Wellhead Protection Platform (WPP) Workover Operations9
387,926 0
Captain FPSO Production Operations
2,922,975 129,852
Erskine Production Operations10 72,153 105
Blackford Dolphin Drilling Operations 4,375,684 162,164
Alder Pipeline Operations11 88,221 207,968
Total 16,314,344 3,954,431
8 No processing occurs at the FSU; therefore, little chemical is used there. The apparent discrepancy in FSU chemical use and discharge figures is as a result of the FSU receiving processed crude from the ANP, from which water which requires discharging settles out, therefore some chemicals applied at the ANP get discharged at the FSU. 9 There is no produced water discharge at Captain, chemicals were either re-injected into the reservoir along with the produced water or remained downhole. 10 Erskine production fluids are processed at Lomond (operated by BG/Shell), therefore discharge of chemicals used at Erskine occurs there. These chemical discharges are covered on, and reported against, BG/Shell’s chemical permit for Lomond. 11 A range of sub-sea equipment was pre-filled with chemical inhibitors onshore, and subsequently discharged as part of the installation process. Additional discharge figures relate to flow-back chemicals from the Alder well where the usage was covered in the drilling permit, but the discharge is shown under the Alder pipeline operations.
Environmental Values 2016 Public Environmental Report
18
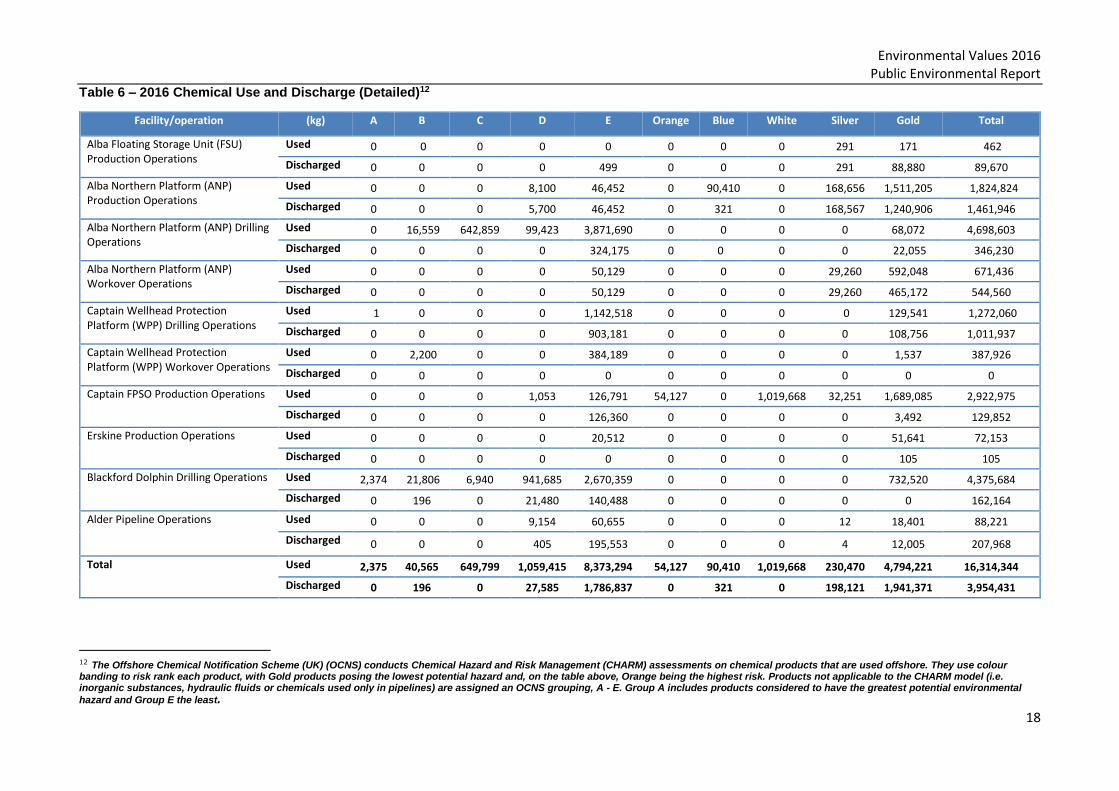
Table 6 – 2016 Chemical Use and Discharge (Detailed)12
Facility/operation (kg) A B C D E Orange Blue White Silver Gold Total
Alba Floating Storage Unit (FSU) Production Operations
Used 0 0 0 0 0 0 0 0 291 171 462
Discharged 0 0 0 0 499 0 0 0 291 88,880 89,670
Alba Northern Platform (ANP) Production Operations
Used 0 0 0 8,100 46,452 0 90,410 0 168,656 1,511,205 1,824,824
Discharged 0 0 0 5,700 46,452 0 321 0 168,567 1,240,906 1,461,946
Alba Northern Platform (ANP) Drilling Operations
Used 0 16,559 642,859 99,423 3,871,690 0 0 0 0 68,072 4,698,603
Discharged 0 0 0 0 324,175 0 0 0 0 22,055 346,230
Alba Northern Platform (ANP) Workover Operations
Used 0 0 0 0 50,129 0 0 0 29,260 592,048 671,436
Discharged 0 0 0 0 50,129 0 0 0 29,260 465,172 544,560
Captain Wellhead Protection Platform (WPP) Drilling Operations
Used 1 0 0 0 1,142,518 0 0 0 0 129,541 1,272,060
Discharged 0 0 0 0 903,181 0 0 0 0 108,756 1,011,937
Captain Wellhead Protection Platform (WPP) Workover Operations
Used 0 2,200 0 0 384,189 0 0 0 0 1,537 387,926
Discharged 0 0 0 0 0 0 0 0 0 0 0
Captain FPSO Production Operations Used 0 0 0 1,053 126,791 54,127 0 1,019,668 32,251 1,689,085 2,922,975
Discharged 0 0 0 0 126,360 0 0 0 0 3,492 129,852
Erskine Production Operations Used 0 0 0 0 20,512 0 0 0 0 51,641 72,153
Discharged 0 0 0 0 0 0 0 0 0 105 105
Blackford Dolphin Drilling Operations Used 2,374 21,806 6,940 941,685 2,670,359 0 0 0 0 732,520 4,375,684
Discharged 0 196 0 21,480 140,488 0 0 0 0 0 162,164
Alder Pipeline Operations
Used 0 0 0 9,154 60,655 0 0 0 12 18,401 88,221
Discharged 0 0 0 405 195,553 0 0 0 4 12,005 207,968
Total Used 2,375 40,565 649,799 1,059,415 8,373,294 54,127 90,410 1,019,668 230,470 4,794,221 16,314,344
Discharged 0 196 0 27,585 1,786,837 0 321 0 198,121 1,941,371 3,954,431
12 The Offshore Chemical Notification Scheme (UK) (OCNS) conducts Chemical Hazard and Risk Management (CHARM) assessments on chemical products that are used offshore. They use colour banding to risk rank each product, with Gold products posing the lowest potential hazard and, on the table above, Orange being the highest risk. Products not applicable to the CHARM model (i.e. inorganic substances, hydraulic fluids or chemicals used only in pipelines) are assigned an OCNS grouping, A - E. Group A includes products considered to have the greatest potential environmental
hazard and Group E the least.

Environmental Values 2016 Public Environmental Report
19
Oil and Chemical Releases/Spills to Sea Table 7 – CNSL 2016 Oil and Chemical Releases to Sea13
Facility Number of PON1s
Oil Released (tonnes)
Chemical Released (kg)
Captain Floating Production Storage & Offloading (FPSO) 2 0.0000043 0
Captain Wellhead Protector Platform (WPP) 5 0.0000101 23.50
Alba Northern Platform (ANP) 0 0 0
Alba Floating Storage Unit (FSU) 0 0 0
Erskine 2 0.2860000 1.644
Alder 2 0.0000250 449.82
Blackford Dolphin (MODU) 10 0.0000130 2708.495
Amundsen Spirit (vessel) 1 0.0000050 0
Deep Arctic DSV (vessel) 1 0.0000003 0
Total 23 0.2860576 3183.459
In accordance with regulatory requirements all unplanned accidental releases of oil or chemical to sea,
regardless of quantity, must be reported on a Petroleum Operations Notice No.1 (PON1). A summary of the
CNSL PON1 notifications for 2016 is provided in Table 7. The total number and volume of oil and chemical
notifications by asset are detailed. The largest single release of 1651 kg of chemical was because of an
ongoing release of hydraulic control fluid. Internal investigations were conducted to determine the root
cause and actions taken to prevent recurrence of any release. The hydraulic control fluid is permitted for
discharge to sea during normal planned operations.
Figure 6 – CNSL Annual Quantity of Oil Released to Sea 2007 – 201614
13 CNSL data only includes accidental releases of oil and chemicals to sea. No Permitted Oil Discharge notifications were submitted in 2016. Three third party oil release notifications were submitted to regulatory authorities but details are not included in table 7 as these events were not associated with CNSL operated l activities.
14 2007 – 2016 CNSL data includes the maximum reported quantity released, i.e. a worst-case scenario. Since 2007, PON1
reports have required a maximum and minimum release quantity to be reported.
0
1
2
3
4
5
6
7
8
2007 2008 2009 2010 2011 2012 2013 2014 2015 2016
Tonnes o
il spilt
to s
ea
CNSL
Environmental Values 2016 Public Environmental Report
20
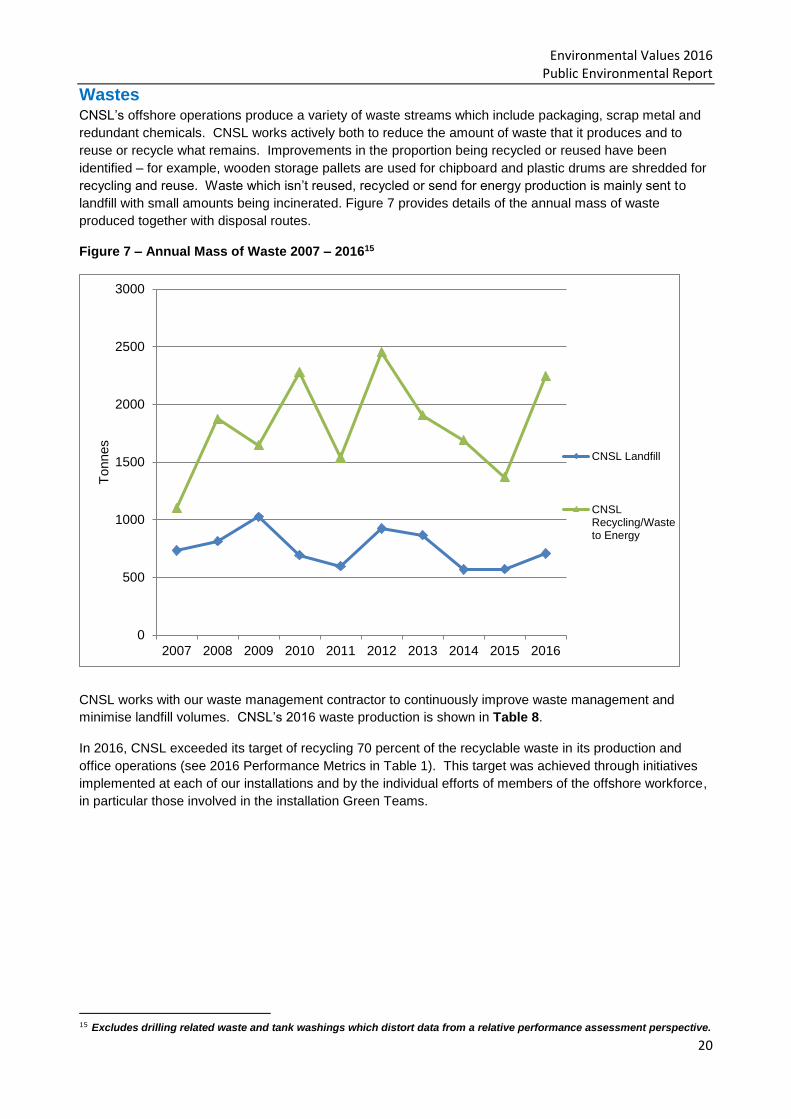
Wastes CNSL’s offshore operations produce a variety of waste streams which include packaging, scrap metal and
redundant chemicals. CNSL works actively both to reduce the amount of waste that it produces and to
reuse or recycle what remains. Improvements in the proportion being recycled or reused have been
identified – for example, wooden storage pallets are used for chipboard and plastic drums are shredded for
recycling and reuse. Waste which isn’t reused, recycled or send for energy production is mainly sent to
landfill with small amounts being incinerated. Figure 7 provides details of the annual mass of waste
produced together with disposal routes.
Figure 7 – Annual Mass of Waste 2007 – 201615
CNSL works with our waste management contractor to continuously improve waste management and
minimise landfill volumes. CNSL’s 2016 waste production is shown in Table 8.
In 2016, CNSL exceeded its target of recycling 70 percent of the recyclable waste in its production and
office operations (see 2016 Performance Metrics in Table 1). This target was achieved through initiatives
implemented at each of our installations and by the individual efforts of members of the offshore workforce,
in particular those involved in the installation Green Teams.
15 Excludes drilling related waste and tank washings which distort data from a relative performance assessment perspective.
0
500
1000
1500
2000
2500
3000
2007 2008 2009 2010 2011 2012 2013 2014 2015 2016
Tonnes
CNSL Landfill
CNSLRecycling/Wasteto Energy

Environmental Values 2016 Public Environmental Report
21
Table 8 – 2016 Reported Total Waste Data
Category Recycle/Waste to Energy (tonnes)
Landfill/Incinerate (tonnes)
Total (tonnes)
Special/Hazardous Waste
739.7 310.6 1050.3
Non-Hazardous Waste
1505.2 395.6 1900.8
Total 2245 706.2 2951.1
For the purpose of relative annual performance tracking, we do not include the drilling-related and tank
washings waste streams in our target as they are extremely variable and operationally dependent, and their
inclusion therefore would not allow for long-term performance tracking. These are often the largest CNSL
contributor to landfill volumes and consequently we are working to reduce the quantities and potential
hazards of these wastes too. The use of non-aqueous (oily) drilling fluids can be necessary when drilling in
certain reservoirs or long horizontal wells.
Environmental Values 2016 Public Environmental Report
22
Glossary ANP Alba Northern Platform
bbl Barrel
BOE Barrels of Oil Equivalent
BTU British Thermal Units
CH4 Methane
CNSL Chevron North Sea Limited
CO Carbon monoxide
CO2 Carbon dioxide
CO2e Carbon dioxide equivalent
DBEIS Department for Business Energy and Industrial Strategy
ES Environmental Stewardship
ETS Emissions Trading System
EU European Union
FPSO Floating, Production, Storage and Offloading
FSU Floating Storage Unit
GHG Greenhouse Gas
HFC Hydroflurocarbon
MBOE Thousands of Barrels of Oil Equivalent
MODU Mobile Offshore Drilling Unit
MSP Management System Process
N2O Nitrous oxide
NOx Oxides of nitrogen
OE Operational Excellence
OEMS Operational Excellence Management System
OPEP Oil Pollution and Emergency Plans
OSPRAG Oil Spill Prevention and Response Advisory Group
SO2 Sulphur dioxide
SOSREP Secretary of States Representative for Maritime Salvage and Intervention
t tonnes
UEI Upstream Energy Intensity
UK United Kingdom
VOCs Volatile Organic Compounds
WPP Wellhead Protector Platform