Embed Size (px)
Citation preview
Draft environmental values and water quality guidelines:
Burdekin River Basin fresh and estuarine waters
Draft for consultation - March 2017

ii
Prepared by
Science Delivery Division Department of Science, Information Technology and Innovation PO Box 5078 Brisbane QLD 4001
© The State of Queensland (Department of Science, Information Technology and Innovation) 2017
The Queensland Government supports and encourages the dissemination and exchange of its information. The copyright in this publication is licensed under a Creative Commons Attribution 3.0 Australia (CC BY) licence
Under this licence you are free, without having to seek permission from DSITI, to use this publication in accordance with the licence terms. You must keep intact the copyright notice and attribute the State of Queensland, Department of Science, Information Technology and Innovation as the source of the publication. For more information on this licence visit http://creativecommons.org/licenses/by/3.0/au/deed.en
Disclaimer
This document has been prepared with all due diligence and care, based on the best available information at the time of publication. The department holds no responsibility for any errors or omissions within this document. Any decisions made by other parties based on this document are solely the responsibility of those parties. Information contained in this document is from a number of sources and, as such, does not necessarily represent government or departmental policy.
If you need to access this document in a language other than English, please call the Translating and Interpreting Service (TIS National) on 131 450 and ask them to telephone Library Services on +61 7 3170 5725
Citation
Newham, M., Moss, A., Moulton, D., Thames, D. Department of Science, Information Technology and Innovation, Queensland (2017). Draft environmental values and water quality guidelines: Burdekin River Basin fresh and estuarine waters.
Acknowledgements
This report has been prepared by the Department of Science, Information Technology and Innovation with input from DEHP (David Thames: GIS/mapping). In particular, we thank those parties who provided water quality information used in this report.
March 2017
Cover photo courtesy of Queensland Government. Burdekin River estuary.

iii
Contents
1 Introduction ................................................................................................................................ 2
1.1 This report 2
1.2 Reef planning policies and actions 3
1.3 Burdekin Basin: scope of review 4
1.3.1 Environmental Values (EVs) 4
1.3.2 Water quality guidelines to protect aquatic ecosystem 5
2 Study area, waterway uses and environmental values ........................................................... 6
2.1 Study area 6
2.2 Landuse and condition summary 6
2.3 Environmental values and management intent 7
3 Deriving local water quality guidelines for aquatic ecosystem protection ......................... 20
3.1 Default Australian Water Quality Guidelines regions and water types 20
3.2 National framework – the need for local water quality guidelines 21
3.3 Developing local water quality guidelines in Queensland 21
3.4 Management intent/level of protection 22
4 Approach used to derive aquatic ecosystem guidelines ..................................................... 24
4.1 Burdekin Basin fresh waters 24
4.1.1 Use of referential approach to derive water quality guidelines 24
4.1.2 Data sources, quality control and review 25
4.1.3 Sub-basin scale of draft water quality guidelines 27
4.1.4 Flow separation 27
4.1.5 Derivation of freshwater water quality guidelines for moderately disturbed waters 27
4.2 Burdekin estuarine waters 29
4.3 Water Quality Guideline Indicators 29
4.3.1 Fresh waters 29
4.3.2 Mid estuarine waters 30
5 Water quality guidelines to protect aquatic ecosystems ..................................................... 32
5.1 Water Quality Guidelines tables information 32
5.2 Monitoring condition relative to aquatic ecosystem water quality guidelines 32
5.3 Planning and management links 58
5.3.1 Riparian Vegetation 58
5.3.2 Wetlands 58

iv
5.3.3 Marine plants (including mangroves) 58
5.3.4 State Planning Policy (state interest – water quality) 59
6 References ................................................................................................................................ 61
7 Appendix 1 Flow condition assessment and water quality data sources ........................... 63
7.1 Flow condition separation and exceedance probability curves 63
7.2 Fresh water data sources 70
8 Appendix 2 Human use EV water quality guidelines ............................................................ 74

v
List of tables
Table 1 Belyando River sub-basin water quality guidelines: baseflow and event ............................ 34
Table 2 Bowen-Broken-Bogie River sub-basin water quality guidelines: baseflow and event ......... 39
Table 3 Upper Burdekin River sub-basin water quality guidelines: baseflow and event .................. 43
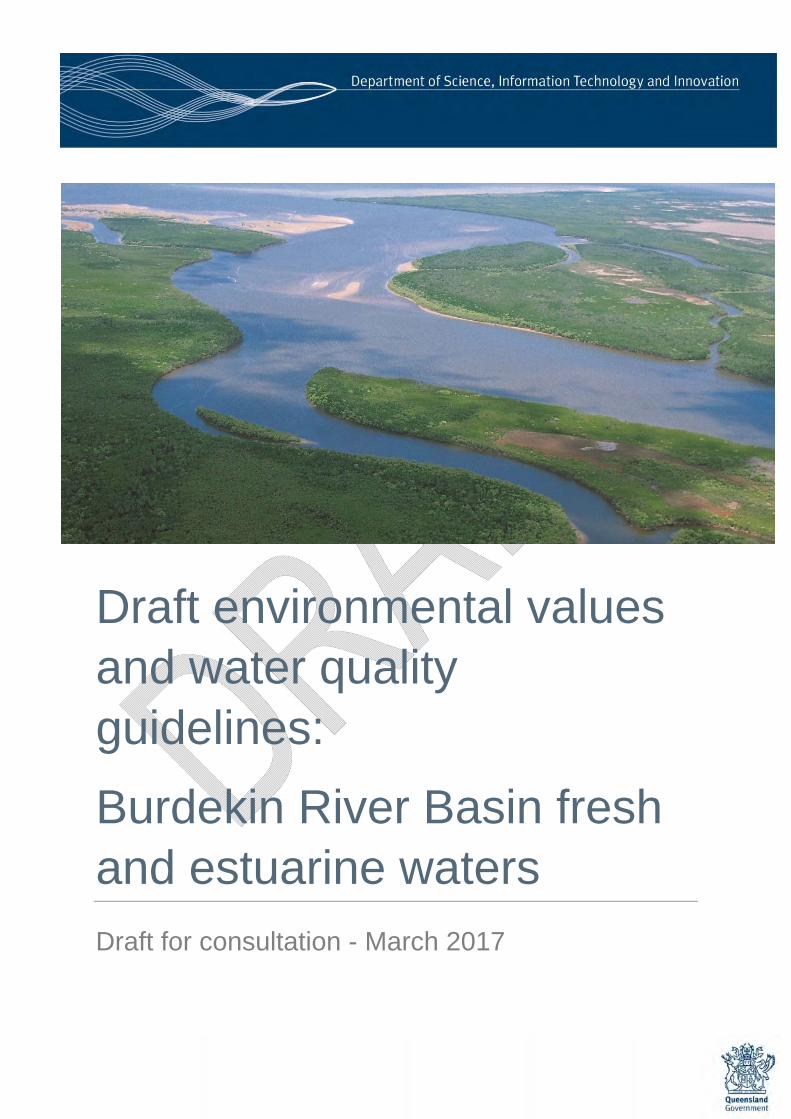
Table 4 Lower Burdekin River sub-basin water quality guidelines – fresh water and mid estuary: baseflow and event ............................................................................................................ 48
Table 5 Cape-Campaspe River sub-basin water quality guidelines: baseflow and event ................ 53
Table 6 Suttor River sub-basin water quality guidelines: baseflow and event ................................. 55
Table 7 Burdekin Basin gauge stations and Flow Condition for high and low flow split. Data available from the Water Monitoring Information Portal (https://water-monitoring.information.qld.gov.au/). ................................................................................................. 65
Table 8 Fresh water data sources by sub-basin and flow condition, used for derivation of draft water quality guidelines ........................................................................................................... 71
Table 9 Human use EVs – summary and guideline sources ........................................................... 74
Table 10 Drinking water EV: Priority water quality guidelines for drinking water supply in the vicinity of off-takes, including groundwater, before treatment .......................................................... 77
Table 11 Aquaculture EV: Water quality guidelines for tropical aquaculture ................................... 78
Table 12 Aquaculture EV: Water quality guidelines for optimal growth of particular species in fresh water ....................................................................................................................................... 79
Table 13 Aquaculture EV: Water quality guidelines for optimal growth of particular marine species ............................................................................................................................................. 80
Table 14 Irrigation EV: Water quality guidelines for thermotolerant (faecal) coliforms in irrigation waters used for food and non-food crops .......................................................................... 81
Table 15 Irrigation EV: Water quality guidelines for heavy metals and metalloids in agricultural irrigation water— soil cumulative contamination loading limit (CCL), long-term trigger value (LTV) and short-term trigger value (STV)1 .................................................................. 82
Table 16 Stock watering EV: Water quality guidelines for tolerances of livestock to salinity, as total dissolved solids, in drinking water ....................................................................................... 83
Table 17 Stock watering EV: Water quality guidelines (low risk trigger values) for heavy metals and metalloids in livestock drinking water ............................................................................ 84
Table 18 Recreational waters: Alert levels and corresponding actions for management of cyanobacteria ................................................................................................................................... 85

Department of Science Information Technology and Innovation
vi
List of figures
Figure 1 Burdekin River Basin ........................................................................................................... 9
Figure 2 Burdekin Basin landuse (source: QLUMP, 2009) .............................................................. 10
Figure 3 Burdekin Basin protected estate ........................................................................................ 11
Figure 4 Burdekin Basin wetland types ............................................................................................ 12
Figure 5 Environmental Values icons and definitions ...................................................................... 13
Figure 6 Belyando sub-basin environmental values, water type and management intent ............... 14
Figure 7 Bowen-Broken-Bogie sub-basin environmental values, water type and management intent ................................................................................................................................................ 15
Figure 8 Upper Burdekin sub-basin environmental values, water type and management intent ................................................................................................................................................ 16
Figure 9 Lower Burdekin sub-basin environmental values, water type and management intent ................................................................................................................................................ 17
Figure 10 Cape-Campaspe sub-basin environmental values, water type and management intent ................................................................................................................................................ 18
Figure 11 Suttor sub-basin environmental values, water type and management intent .................. 19
Figure 12 ANZECC water type regions (Coordinate system GCS GDA 1994. Datum GDA 1994) ................................................................................................................................................ 20
Figure 13 Burdekin River Basin fresh water quality monitoring sites ............................................... 31
Figure 14 Flow exceedance probability curves for A) Burdekin River at Blue Range (120107B) in the Upper Burdekin sub-basin showing 90th percentile flow (equal to 10% exceedance probability) for high flows at 43 cumecs and (B) Burdekin River at Clare (120006B) in the Lower Burdekin sub-basin showing the 80th percentile flow (equal to 20% exceedance probability) for high flows at 417 cumecs. ................................................................... 64

Draft Environmental Values and Water Quality Guidelines for Burdekin River Basin fresh and estuarine waters
vii
Definitions and abbreviations
AIMS Australian Institute of Marine Science
ANZECC; ARMCANZ Australian and New Zealand Environment and Conservation Council; Agriculture and Resources Management Council of Australia and New Zealand
AWQG Australian water quality guidelines
DEHP Department of Environment and Heritage Protection
DNRM Department of Natural Resources and Mines
DO Dissolved oxygen
DSITI Department of Science, Information Technology and Innovation
EC Electrical conductivity: is the measure of the ability of a solution to conduct an electric current.
EPP (Water) Environmental Protection Policy (Water)
EV Environmental value: the qualities of water that make it suitable for supporting aquatic ecosystems and human water uses, e.g. stock water, irrigation, recreation, and cultural and spiritual values. EVs need to be protected from the effects of habitat alteration, waste releases, contaminated runoff and changed flows to ensure healthy aquatic ecosystems and waterways that are safe and healthy for human use.
FHA Fish habitat area
GBR, GBRMP, GBRMPA Great Barrier Reef; Great Barrier Reef Marine Park, Great Barrier Reef Marine Park Authority
Guideline – water quality Technically derived guideline to protect a stated EV. Quantitative measures or statements for indicators, including contaminant concentrations or sustainable load measures of water.
HD
HEV
Highly disturbed waters
High ecological value (effectively unmodified) waters
MD Moderately disturbed waters
mg/L Milligrams per Litre
NP National Park
NQ Dry Tropics NQ Dry Tropics Regional Natural Resource Management Body Ltd
PAR Photosynthetic available radiation. Used in relation to light availability for photosynthesis by primary producers such as seagrass. Insufficient PAR can lead to loss of seagrass.
Percentile This is the value of a variable below which a certain percent of observations fall. So the 75th percentile is the value (or score) below which 75 percent of the observations may be found.
pH A measure of the acidity or basicity of a solution, commonly ranging from 0 (acid) to 14 (basic).
Queensland Waters All waters that are within the limits of the State, including coastal/marine waters to 3 nautical miles.
QWQG Queensland water quality guidelines
SD; SMD Slightly disturbed waters; slightly-moderately disturbed waters
SF State Forest
SS Suspended solids
µg/L Micrograms per Litre
WQG Water quality guideline. Refer to full definition under ‘guideline’
WQIP Water quality improvement plan
WQO Water quality objective: the set of water quality guidelines for all indicators that will protect all environmental values selected for the water.


Draft Environmental Values and Water Quality Guidelines for Burdekin River Basin fresh and estuarine waters
1
Summary
This report presents environmental values and water quality guidelines for Burdekin River Basin fresh and estuarine surface waters. Water quality guidelines are provided in this report for both aquatic ecosystems and human uses (e.g. recreation, irrigation, stock watering), based on relevant sources. A key component of this report is the development of draft aquatic ecosystem water quality guidelines from local monitoring.
The report forms part of the water quality planning process under the Environmental Protection Policy (Water) 2009 [EPP Water]. Water quality guidelines in this report form a technical basis for water quality objectives under schedule 1 of the EPP Water. To date, there are no locally developed water quality objectives for Burdekin basin waters scheduled under the EPP Water.
The Reef Water Quality Protection Plan, Reef 2050 Long-Term Sustainability Plan and related policies provide a further impetus to the development of water quality guidelines in this area, and are briefly outlined. Further work is being undertaken to develop basin-specific load targets for Great Barrier Reef catchments, including the Burdekin. When available, results of this work will be reviewed and addressed in the finalisation of EPP Water materials, including water quality objectives.
Information on waterway uses and values (‘environmental values’) has been obtained from information in or supporting the Burdekin Basin water quality improvement plan (WQIP), and other relevant mapping layers including protected estate layers and landuse mapping.
Draft water quality guidelines to protect the aquatic ecosystem environmental value are provided in Section 5 of the report, by main sub-basin (e.g. Belyando-Suttor, Bowen-Broken-Bogie, lower and upper Burdekin, and Cape-Campaspe). Water quality data for developing locally derived guidelines was obtained from a range of sources including government, research institute, university and private sector sources, and information in the Burdekin water quality improvement plan (WQIP). Guidelines are primarily focussed on physico-chemical indicators; nutrients, dissolved oxygen, pH, conductivity, water clarity parameters, and chlorophyll-a. Seagrass light guidelines have also been included for estuarine waters. Guidelines have been derived for annual application, low flow conditions and, where sufficient information is available, high flow conditions. State or national guidelines have been applied for parameters where insufficient local data was available to derive local guidelines, or where biological effect guidelines are used (e.g. toxicants).
Guidelines for human use environmental values (e.g. recreation, irrigation, stock watering) are derived from relevant sources (e.g. National Health and Medical Research Council, AWQGs), and are provided in Appendix 2.
Environmental values and management intent of waters presented in this report may be revised in response to stakeholder comments. Water quality guidelines may be revised on the basis of additional water quality data or improved methodology. Following consultation and any amendment, a final set of water quality objectives, based on agreed environmental values and the water quality guidelines, will be prepared for consideration by Government for inclusion in schedule 1 of the EPP Water.

2
1 Introduction
1.1 This report
The report forms part of the process to localise water quality guidelines (WQGs) throughout Queensland, in accordance with recommendations in the Australian and New Zealand Water Quality Guidelines (ANZECC & ARMCANZ 2000).
The first step of this process in Queensland was the complementary development of the Queensland Water Quality Guidelines (QWQG 2009) and the Water quality guidelines for the Great Barrier Reef Marine Park (GBRMPA 2010). Under the ANZECC and ARMCANZ (2000) water quality framework and the Environmental Protection Policy (Water) 2009, properly developed and approved local guidelines hold higher precedence over state or national guidelines, and form a technical basis for development of water quality objectives (WQOs) under the EPP Water.
A ‘water quality guideline’ is a defined guideline of concentration, value or statement, which will protect or enhance a specific environmental value of a waterway. An ‘Environmental Value’ (EV) is a use or value held for a waterway which requires protection. EVs include aquatic ecosystem protection and human uses and values. A ‘water quality objective’ is a set of water quality guidelines which will protect all stated EVs of a waterway.
This report provides proposed EVs for surface waters of the Burdekin Basin and updated draft local water quality guidelines (WQGs) for the protection of the ‘aquatic ecosystem’ environmental value in:
Burdekin Basin fresh waters (Belyando-Suttor, Bowen-Broken-Bogie, lower and upper Burdekin, and Cape-Campaspe sub-basins)
Estuarine reaches.
Marine guidelines are provided in a separate DSITI report ‘Draft environmental values and water quality guidelines: Don and Haughton river basins, Mackay-Whitsunday estuaries, and coastal/marine waters’ (draft, 2017 available from the EHP website).
This report does not include environmental values or numerical water quality guidelines for groundwaters. These will be provided in a future report.
Guidelines for human uses (e.g. recreation, irrigation, stock watering) are based on relevant technical sources (e.g. National Health and Medical Research Council, ANZECC). These guidelines and sources are listed in Appendix 2.
Environmental values and management intent of waters presented in this report may be revised in response to stakeholder comments. Water quality guidelines may be revised on the basis of additional water quality data or improved methodology. Following consultation and any amendment, a final set of water quality objectives, based on agreed environmental values and the water quality guidelines, will be prepared for consideration by Government for inclusion in schedule 1 of the EPP Water.

Draft Environmental Values and Water Quality Guidelines for Burdekin River Basin fresh and estuarine waters
3
1.2 Reef planning policies and actions
The Burdekin Basin is the second largest river basin draining to the Great Barrier Reef lagoon but has the largest mean annual discharge and contributes significant volumes of runoff and sediment. The Reef 2050 Long-Term Sustainability Plan, prepared by Australian and Queensland governments, is the overarching framework for protecting and managing the Great Barrier Reef from 2015 to 2050. The Plan is a key component of the Australian Government’s response to the recommendations of the United Nations Educational, Scientific and Cultural Organization (UNESCO) World Heritage Committee. At the core of the Plan is an outcomes framework that will drive progress towards an overarching vision:
‘To ensure the Great Barrier Reef continues to improve on its Outstanding Universal Value every decade between now and 2050 to be a natural wonder for each successive generation to come.’
The Reef 2050 Plan and supporting information is available from http://www.environment.gov.au/marine/gbr/long-term-sustainability-plan.
The Reef 2050 Plan was drafted with government, community, industry and science and presents an opportunity for everyone involved with the Reef to take part in building its resilience. It sets out shared targets, objectives and outcomes across seven different themes – ecosystem health, biodiversity, water quality, heritage, community benefits, economic benefits and governance. A summary of Reef 2050 Plan priorities and actions as they relate to water quality guidelines for the Burdekin is provided below.
Localising water quality guidelines
Water quality action (WQA) 7: Finalise and implement plans (e.g. Water Quality Improvement Plans and Healthy Waters Management Plans) for Reef catchments and key coastal areas, identifying implementation priorities for protection of the Reef.
WQA9: Review and update water quality objectives and Great Barrier Reef Marine Park Authority Water Quality Guidelines at Reef-wide and regionally relevant scales based on scientifically verified monitoring and research.
These commitments build upon the ANZECC framework for localising guidelines as outlined in section 3 of this document. The Burdekin water quality improvement plan (WQIP) and supporting water quality atlas (prepared by NQ Dry Tropics) are directly relevant to these actions.
Note: In response to recommendations of the Great Barrier Reef Water Science taskforce in May 2016 (http://www.gbr.qld.gov.au/taskforce/ ), further work is being undertaken to develop basin specific load targets for the 35 basins of the Great Barrier Reef catchment. Results of this work will be reviewed and addressed in the finalisation of EPP Water materials, including water quality objectives.
Water quality condition
Water quality target (WQT) 4: Water quality in the Great Barrier Reef has a stable or positive trend.
Water quality objective (WQO) 1: Over successive decades the quality of water entering the Reef from broadscale land use has no detrimental impact on the health and resilience of the Great Barrier Reef.

4
WQO2: Over successive decades the quality of water in or entering the Reef from all sources including industrial, aquaculture, port (including dredging), urban waste and stormwater sources has no detrimental impact on the health and resilience of the Great Barrier Reef.
2050 outcome: Reef water quality sustains the Outstanding Universal Value, builds resilience and improves ecosystem health over each successive decade.
These commitments identify the overall intent for water quality entering and within the reef.
Community and economic benefit
Community benefit objective (CBO) 3: Community benefits provided by the Reef, including its superlative natural beauty and the sense of place, are maintained for current and future generations.
Economic benefit objective (EBO) 4: Reef-dependent industries are productive and profitable based on a healthy Reef and are ecologically sustainable.
These recognise how a healthy reef supports reef-dependent economic and community activities such as tourism and recreation.
1.3 Burdekin Basin: scope of review
1.3.1 Environmental Values (EVs)
Environmental values (EVs) reflect the uses and values of water. EVs for Burdekin Basin waters were identified through consultation activities and research managed by Burdekin Dry Tropics (refer Lankester et al. 2007; NQ Dry Tropics, 2013), and reported in the Burdekin water quality improvement plan. More details on EVs are provided in Section 2.
Most fresh waters in the Burdekin River Basin include EVs for stock watering, farm supply, recreation, aquatic ecosystems and cultural and spiritual values. Industrial use, irrigation, aquaculture, human consumption (e.g. of fish) and drinking water are also identified in some locations.
EVs for coastal waters adjacent to the Burdekin Estuary were reported and mapped in Figure 4.3 of the Burdekin water quality improvement plan. EVs and water quality guidelines for these waters are reported separately in the DSITI report ‘Draft environmental values and water quality guidelines: Don and Haughton river basins, Mackay-Whitsunday estuaries, and coastal/marine waters (draft, 2017)’.
As part of the current review process, the project team has reviewed management intent of waters considering:
landuse mapping (e.g. QLUMP) protected estate and other conservation designations Updates based on advice from stakeholders Reef 2050 Long-Term Sustainability Plan commitments Feedback received to the Burdekin WQIP (which included EVs mapping and tables
based on Lankester et al. 2007; NQ Dry Tropics, 2013)
Water quality guidelines included in Section 5 of this report are derived to protect the aquatic ecosystem environmental value.

Draft Environmental Values and Water Quality Guidelines for Burdekin River Basin fresh and estuarine waters
5
1.3.2 Water quality guidelines to protect aquatic ecosystem
Water quality guidelines developed from local water quality data have not previously been developed for waters of the Burdekin Basin. Water quality guidelines included in the original Burdekin WQIP (Dight 2009) were based on relevant Queensland, AWQG and GBRMPA sources. The Draft 2016 Burdekin WQIP updated these guidelines based on the most recent versions of these same sources. It also included draft WQGs for the Don and Haughton basins and coastal waters, which were derived from local data by DSITI and GBRMPA Latest coastal/marine water WQGs are contained in the DSITI report ‘Draft environmental values and water quality guidelines: Don and Haughton river basins, Mackay-Whitsunday estuaries, and coastal/marine waters’ (draft, 2017, available from the EHP website).
This report provides updated water quality guidelines to protect the aquatic ecosystem EV for Burdekin Basin waters based on review of available datasets. Details on the data sources, indicators and analysis procedures are provided in Section 4. The derived draft WQGs for fresh and estuarine waters are provided in Section 5 and accompanying mapping for each sub-basin are included in Section 2, Figures 6-11. State or national guidelines have been applied for parameters where insufficient local data was available to derive local guidelines, or where biological effect guidelines are used (e.g. toxicants).

6
2 Study area, waterway uses and environmental values
2.1 Study area
Queensland waters covered by this report are shown in Figure 1 and comprise:
Surface fresh waters of the Burdekin River Basin (basin 1201), including the following main sub-basins, listed alphabetically:
o Belyando
o Bowen-Broken-Bogie
o Burdekin - upper
o Burdekin - lower
o Cape-Campaspe
o Suttor
Burdekin mid estuarine waters.
2.2 Landuse and condition summary
A comprehensive review of current landuse, condition and trends, and actions to manage water quality is provided in the recently published Burdekin WQIP and Burdekin catchment atlas prepared by NQ Dry Tropics (available at: http://www.nqdrytropics.com.au/wqip2016/ ).
The Burdekin WQIP and the catchment atlas also give considerable attention to the source of pollutants by catchment, landuse and erosion type (gully, hillslope, streambank).
Therefore this report provides only a brief overview of landuse and catchment features.
Figure 2 shows landuse across the Burdekin River Basin (based on Queensland landuse mapping program – QLUMP, 2009). The largest category of landuse identified by QLUMP is grazing from native vegetation. This landuse comprises 92 % of total landuse across the entire basin, and ranges from 88% of total landuse in the upper Burdekin, to 96% in the Belyando and Cape-Campaspe sub-basins.
The second largest landuse contribution varies across sub-basins and includes irrigated sugarcane in the lower Burdekin (6%), cropping (including cereals) in the Suttor basin (6%), and nature conservation in the Bowen-Broken-Bogie sub-basin (3%).
Figure 3 shows the main conservation and protected estate throughout the Burdekin River Basin. The area includes national parks (NPs), regional parks, state forests (SFs), and
1 Queensland Drainage Division number and river basin names are published at Geoscience Australia’s website www.ga.gov.au. Refer Australia’s River Basins 1997—Product User Guide. Published by Geoscience Australia. Canberra, ACT (3rd edition, 2004).

Draft Environmental Values and Water Quality Guidelines for Burdekin River Basin fresh and estuarine waters
7
nature refuges. In several locations parks adjoin each other, thus creating larger contiguous areas of protection. Most of the areas are in upper catchment headwaters of the basin.
The largest areas are:
Girringun National Park (708 sq km, in Upper Burdekin sub-basin - adjacent to Girringun Regional Park)
Mount Zero-Taravale Nature Refuge (589 sq km, in Upper Burdekin sub-basin - adjacent to Paluma Range National Park, 371 sq km, and Paluma State Forest)
Toomba Nature Refuge (479 sq km), and Great Basalt Wall National Park (351 sq km) in Upper Burdekin sub-basin
Blair Athol State Forest (385 sq km, in Belyando sub-basin) Eungella National Park (374 sq km, in Bowen-Broken-Bogie sub-basin – adjacent to
Macartney and Cathu State Forests, and Crediton Forest Reserve) White Mountains National Park (316 sq km, in Cape Campaspe Basin - adjacent to
White Mountains Regional Park 116 sq km)
Wetlands extent is shown in Figure 4. Substantially more detail on wetlands, including wetland mapping, is available from the Wetlandinfo web page at: http://wetlandinfo.ehp.qld.gov.au/wetlands/facts-maps/. Additional information on marine waters is provided in report cards under Reefplan at the website: http://www.reefplan.qld.gov.au/measuring-success/report-cards/2014/assets/gbr-2014report-card.pdf.
2.3 Environmental values and management intent
Draft environmental values (EVs) and management intent/level of protection mapping for Burdekin River Basin waters are derived from work undertaken for the Burdekin WQIP, including Lankester et al. (2007), and NQ Dry Tropics (Kerr, 2013). Environmental values include aquatic ecosystems and human use values (e.g. irrigation, stock watering, recreation). These have been complemented by review of spatial datasets, including protected estate. Figure 5 shows the icons and definitions for environmental values used in the following figures.
The AWQG, QWQG and EPP Water outline the management framework applying to different aquatic ecosystems. The framework provides threshold levels of change that are acceptable for each of the different aquatic ecosystem conditions. The main categories are listed below and further detail on these is provided in section 3.
High ecological value (HEV) – maintain natural condition Slightly disturbed (SD) – maintain/improve to natural condition Moderately disturbed (MD) – maintain/achieve the relevant water quality guidelines Highly disturbed (HD) – improve progressively over time
The following have been applied in identifying HEV and SD management intent/level of protection levels, but may vary according to local information:
National parks (high ecological value – HEV) Wet Tropics World Heritage Area zones A, B (high ecological value – HEV) High ecological significance wetlands/wetland protection areas (HEV or SD) Ramsar (HEV or SD) Fish habitat areas (A) (SD) Dugong protection areas (A) (SD) Conservation parks (SD) State forests (SD)

8
Nature refuges (SD) Additional decision rules have been applied in coastal/marine waters, which are covered by the separate the DSITI report ‘Draft environmental values and water quality guidelines: Don and Haughton river basins, Mackay-Whitsunday estuaries, and coastal/marine waters (draft, 2017, available from the EHP website).
Figures 6-11 display the draft environmental values, management intent/level of protection and water types proposed for each sub-basin of the Burdekin Basin for surface fresh and estuarine waters. These are draft and may change following feedback or further information:
Figure 6: Belyando sub-basin
Figure 7: Bowen-Broken-Bogie sub-basin
Figure 8: Burdekin - upper sub-basin
Figure 9: Burdekin - lower sub-basin
Figure 10: Cape-Campaspe sub-basin
Figure 11: Suttor sub-basin

Draft Environmental Values and Water Quality Guidelines for Burdekin River Basin fresh and estuarine waters
9
Figure 1 Burdekin River Basin

10
Figure 2 Burdekin Basin landuse (source: QLUMP, 2009)

Draft Environmental Values and Water Quality Guidelines for Burdekin River Basin fresh and estuarine waters
11
Figure 3 Burdekin Basin protected estate

12
Figure 4 Burdekin Basin wetland types

Draft Environmental Values and Water Quality Guidelines for Burdekin River Basin fresh and estuarine waters
13
Figure 5 Environmental Values icons and definitions
Aquatic ecosystem
•The intrinsic value of aquatic ecosystems, habitat and wildlife in waterways, waterholes and riparian areas, for example, biodiversity, ecological interations, plants, animals, key species (such as turtles, yellowbelly, cod and yabbies) and their habitat, food and drinking water.
Irrigation
•Suitability of water supply for irrigation, for example, irrigation of crops, pastures, parks, gardens and recreational areas.
Farm water supply/use
•Suitability of domestic farm water supply, other than drinking water. For example, water used for laundry and produce preparation.
Stock watering
•Suitability of water supply for production of healthy livestock.
Aquaculture
•Health of aquaculture species and humans consuming aquatic foods (such as fish and prawns) from commercial ventures.
Human consumers of aquatic foods
•Health of humans consuming aquatic foods, such as fish and prawns, from natural waterways.
Primary recreation
•Health of humans during recreation which involves direct contact and a high probability of water being swallowed, for example, swimming, diving and water‐skiing.
Secondary recreation
•Health of humans during recreation which involves indirect contact and a low probability of water being swallowed, for example, wading, boating, rowing and fishing.
Visual recreation
•Amenity of waterways for recreation which does not involve contact with water. For example, walking and picnicking adjacent to a waterway.
Drinking water supply
•Suitability of raw drinking water supply. This assumes minimal treatment of water is required, for example, coarse screening and/or disinfection.
Industrial use
•Suitability of water supply for industrial use, for example, food, beverage, paper, petroleum and power industries, mining and minerals refining/processing. Industries usually treat water supplies to meet their needs.
Cultural, spiritual and ceremonial values
•Cultural, spiritual and ceremonial values of water means its aesthetic, historical, scientific, social or other significance, to the past, present or future generations.

14
Figure 6 Belyando sub-basin environmental values, water type and management intent

Draft Environmental Values and Water Quality Guidelines for Burdekin River Basin fresh and estuarine waters
15
Figure 7 Bowen-Broken-Bogie sub-basin environmental values, water type and management intent

16
Figure 8 Upper Burdekin sub-basin environmental values, water type and management intent

Draft Environmental Values and Water Quality Guidelines for Burdekin River Basin fresh and estuarine waters
17
Figure 9 Lower Burdekin sub-basin environmental values, water type and management intent

18
Figure 10 Cape-Campaspe sub-basin environmental values, water type and management intent

Draft Environmental Values and Water Quality Guidelines for Burdekin River Basin fresh and estuarine waters
19
Figure 11 Suttor sub-basin environmental values, water type and management intent

Department of Science Information Technology and Innovation
20
3 Deriving local water quality guidelines for aquatic ecosystem protection
3.1 Default Australian Water Quality Guidelines regions and water types
The Australian and New Zealand Water Quality Guidelines (ANZECC & ARMCANZ 2000) refer to four large regions of Australia (Figure 12), and derive ‘default’ WQGs for water types in each region.
Queensland waters are split into two regions based on their location relative to the Tropic of Capricorn. The Tropical region includes all Queensland waters north of the Tropic of Capricorn and extends to waters of the Northern Territory and north Western Australia. The South-East region includes southern Queensland, New South Wales, Victoria and Tasmania. The Burdekin Basin falls primarily within the Tropical region, with a small southern component of the Belyando sub-basin extending into the South-East region.
The default water types outlined in the ANZECC guidelines are also ‘generic’ in their characterisation. For example, in ANZECC there is a single ‘estuarine’ water type and only two broad marine water types (inshore, offshore).
Consequently, the direct application of the default ANZECC values may not necessarily reflect local water types or water quality characteristics, and potentially offers insufficient protection or imposes excessive constraints relative to the local characteristics of the water – particularly for physico-chemical indicators.
Figure 12 ANZECC water type regions (Coordinate system GCS GDA 1994. Datum GDA 1994)

Draft Environmental Values and Water Quality Guidelines for Burdekin River Basin fresh and estuarine waters
21
3.2 National framework – the need for local water quality guidelines
While the ANZECC water quality guidelines provide default aquatic ecosystem water quality guideline values for a range of broad water types and indicators, they strongly emphasise the need to develop more locally relevant guidelines:
“It is not possible to develop a universal set of specific guidelines that apply equally to the very wide range of ecosystem types or production systems, in varying degrees of health, in Australia and New Zealand. Environmental factors can reduce or increase the effects of physical and chemical parameters at a site and these factors can vary considerably across the two countries. A framework is provided that allows the user to move beyond single-number, necessarily conservative values, to guidelines that can be refined according to local environmental conditions — that is, to developing site-specific guidelines. This is a key message of the Water Quality Guidelines….”
“This can produce values more appropriate to a particular water resource. Although tailoring guidelines to local conditions requires more work in some cases, it results in much more realistic management goals. It therefore has the potential to reduce costs for industry.” (ANZECC & ARMCANZ, 2000 Introduction to the guidelines, 8 - 9)
Under the ANZECC water quality framework and the Environmental Protection Policy (Water), properly developed and approved local guidelines hold higher precedence over state or national guidelines. State (or national) guidelines apply when local guidelines do not exist, and are used for any parameters that are not included in the most locally relevant guidelines.
The ANZECC guidelines set out the policy framework for water quality guideline and management. Core to this is the concept of ‘continual improvement’, where management of waters should always be aiming towards better water quality and ecological health:
“Continual improvement should be a fundamental principle guiding water quality management. In badly polluted waters, managers may need to set several intermediate levels of water quality to be achieved in well-defined stages, until the required water quality objective is finally met.
In waters whose quality is higher than the level specified in set water quality objectives, attention should be given to preventing contamination from all sources, particularly for highly modified water resources. Wherever possible, managers are encouraged to aim to improve the quality of natural and semi-natural water resources rather than allow it to degrade.” (ANZECC and ARMCANZ, 2000, Introduction to the guidelines, p6).
3.3 Developing local water quality guidelines in Queensland
The first step towards developing local water quality guidelines for Queensland waters was taken with the development of the Queensland Water Quality Guidelines (QWQG) (DEHP 2009) and the corresponding Water Quality Guidelines for the Great Barrier Reef Marine Park (GBRMPA 2010). The QWQG divides Queensland’s river basins into a number of regions and water types, and then defines WQGs for each water type within each region. Under the QWQG framework, waters in the Burdekin study area fall within the ‘central coast’ region, applying to river basins from the Burnett River near Bundaberg to the Black River near Townsville.
The QWQG also identifies water types in a more detailed level of disaggregation within each region. For example, ‘estuary’ is sub divided into lower, middle and upper estuary sub-types (with different WQGs). The QWQG also adopts a more detailed split of coastal waters based

Department of Science Information Technology and Innovation
22
on the GBRMPA guidelines, including open coastal, midshelf and offshore waters within State limits. Guideline values are provided for each of these water types.
While the QWQG and GBRMPA guidelines provide a regional level of water quality guidelines, there is still the opportunity to review local water quality data and, if sufficient data exists, to further refine guideline values at the local level.
For these reasons, and in accord with the recommendations of the ANZECC guidelines, this report derives local aquatic ecosystem water quality guidelines for the study area where sufficient information exists to do so. The guidelines are primarily focused on physico-chemical indicators. Where there is insufficient information to derive local guidelines for particular indicators, reference will be made back to the relevant Queensland or ANZECC water quality guidelines.
For toxicants (metals, pesticides etc.) the intent is to use the WQGs from relevant over-arching guideline sources (e.g. ANZECC), using their recommended species protection guideline values. This means that all waters with ‘slightly disturbed’ or ‘high ecological value’ levels of protection have a species protection level of 99% of species. MD waters have a species protection level of 95% of species. Where ANZECC advises bioaccumulation risk occurs, the 99% of species protection level is used.
Some toxicant guidelines are currently under review as part of the ANZECC water quality guidelines review process. Pending approval under this process, updated values would subsequently apply.
Similarly, for human use environmental values (recreation, irrigation, etc.) the intent is to use the most appropriate guidelines (e.g. NHMRC, ANZECC; refer Appendix 2).
3.4 Management intent/level of protection
The AWQG, QWQG and EPP Water outline the management framework applying to different aquatic ecosystems. The framework provides threshold levels of change that are acceptable for each of the different aquatic ecosystem conditions. In summary this involves maintaining the condition of waters in good condition and seeking to sustainably manage water quality in modified waters.
High conservation/ecological value systems (HEV) are defined as:
“effectively unmodified or other highly valued systems, typically (but not always) occurring in national parks, conservation reserves or in remote and/or inaccessible locations... The ecological integrity of high conservation/ecological value systems is regarded as intact.” (ANZECC 2000; 3.1-10)
According to the AWQG:
“…these (HEV) waters are afforded a high degree of protection by ensuring that there is no reduction in the existing water quality, irrespective of the water quality guidelines.”
“Where there are few biological assessment data available for the system, the management objective should be to ensure no change in the concentrations of the physical and chemical water quality variables beyond natural variation” (ANZECC 2000;3.1-11)
The ANZECC Guidelines does not specify how “no change” should be assessed but a statistical method is presented in the Queensland Water Quality Guidelines (2009), available

Draft Environmental Values and Water Quality Guidelines for Burdekin River Basin fresh and estuarine waters
23
from the EHP website. This proposes that “no change” should be assessed as no change to the 20/50/80th percentiles of existing water quality.
For modified systems, the concept of ‘continual improvement’ is relevant, where management of waters should aim towards better water quality and ecological health:
“An overriding principle that should guide management should be continual improvement. This is more obvious where water or sediment quality does not match the water quality objectives. In badly polluted waters it might even be necessary to set intermediate levels of water quality to be achieved in well-defined stages, each subsequent target closer to the required water quality objective, until it is finally met.” (ANZECC & ARMCANZ 2000, Section 2.2.1.7, p2 16).
For slightly disturbed systems (‘waters that have the biological integrity of high ecological value waters with slightly modified physical or chemical indicators but effectively unmodified biological indicators’: EPPW), the management intent is to improve their physico-chemical water quality back towards HEV levels.
For moderately disturbed systems disturbed waters (‘waters in which the biological integrity of the water is adversely affected by human activity to a relatively small but measurable degree’ EPPW), the intent is to achieve specified water quality objectives.
For highly disturbed waters (‘significantly degraded by human activity and have lower ecological value than high ecological value waters or slightly or moderately disturbed waters’: EPPW), the framework recognises that progressive improvement will be required.
Further details on the approach used to derive guidelines in Burdekin Basin waters are provided in section 4.

Department of Science Information Technology and Innovation
24
4 Approach used to derive aquatic ecosystem guidelines
This section summarises the approach used in developing draft water quality guidelines to protect the aquatic ecosystem environmental value for the Burdekin Basin. Main water types, management intent and water type sub-regions for which WQGs have been developed are shown in Figures 6 to 11. Further details are provided in Appendix 1.
Note: In response to recommendations of the Great Barrier Reef Water Science taskforce in May 2016 (http://www.gbr.qld.gov.au/taskforce/ ), further work is being undertaken to develop basin specific load targets for the 35 basins of the Great Barrier Reef catchment. Results of this work will be reviewed and addressed in the finalisation of EPP Water materials, including water quality objectives.Water types
The study team has used water type definitions described in the Queensland Water Quality Guidelines for this project. The following water types occur within the study area, and are the starting point for development of water quality guidelines in the tables:
freshwaters mid-estuarine waters wetlands groundwaters (outside scope of this report)
Spatial separation of waters into upland and lowland regions based on 150m altitude was not applied as it is in the QWQG. Previous work in the Fitzroy Basin, a similar large central Queensland basin, has shown larger variation in water quality between sub-basins than rather than by altitude separation. Therefore, altitude was not used in defining water types in this case.
4.1 Burdekin Basin fresh waters
Water quality guidelines for freshwaters derived from local data have not yet been developed for the Burdekin Basin. In the past, default guidelines from the QWQG and AWQG would be applied. The project team have collated available data from multiple sources to develop locally based guidelines for the first time. The method used to derive these local guidelines is outlined in this section.
4.1.1 Use of referential approach to derive water quality guidelines
A reference site is a site whose condition is considered to be a suitable baseline or benchmark for assessment and management of sites in similar water bodies. Most commonly reference condition refers to sites that are subject to minimal disturbance. The QWQG includes a list of criteria for reference sites to make them suitable for physico-chemical indicators (QWQG 2009, Table 4.4.1). The criteria seek that sites have minimal impact from human activities such as intensive agriculture and wastewater discharges. The QWQG notes however that:
‘Although the criteria…are recommended, there are some regions and some water types where it may be difficult to find any sites that fully comply with these criteria. In this situation it may be necessary to use lesser quality or best available sites’ (QWQG 2009, Section 4.4.2, available from the DEHP website).

Draft Environmental Values and Water Quality Guidelines for Burdekin River Basin fresh and estuarine waters
25
The Burdekin basin has a history of agricultural and grazing use, resulting in almost the entire catchment area being impacted by land clearing and agriculture to some degree. (The Burdekin WQIP and atlas contain more detailed analysis of catchment and sub-catchment condition, including pollutant sources by landuse.) Hence there is limited information available from minimally impacted reference sites, with most water quality information coming from moderately disturbed locations. Despite this, much of the catchment has relatively clear and low nutrient water ways during ambient conditions. To develop these draft water quality guidelines for aquatic ecosystems, the use of moderately disturbed sites as best available sites allows for a comprehensive dataset to be used for guideline development. However, this necessitates an alternative percentile approach, rather than using 20th or 80th percentiles of reference sites, to set guideline values as would be used for minimally impacted reference sites.
The proposed alternative percentile approach is to use the 40th percentile of data from moderately disturbed, best available sites to set water quality guidelines for similar moderately disturbed waters. The traditional referential method uses an 80th percentile of data from minimally impacted sites, and a median of data from test sites in moderately disturbed areas is tested against this. This allows moderately disturbed sites to deviate from the reference condition within limits that should protect the aquatic ecosystem EV at the moderately disturbed level of protection. The proposed alternative percentile approach uses a percentile less than the median of best available moderately disturbed site data, aiming to both protect the aquatic ecosystem EV and guide improvements in water quality towards an uncertain reference condition. The 40th percentile is suggested as a modest goal for improvement in condition where no specific management goals are defined which may require more ambitious guidelines.
There is little guidance available in the national and state water quality frameworks for developing guidelines in catchments with limited reference (undisturbed) water quality data. This alternative percentile approach has the potential to be widely applied in moderately disturbed catchments, and can be methodically repeated to review guidelines as improvements in water quality progress through management actions. The steps used in the development and review of water quality guidelines in the Fitzroy Basin, using the alternative percentile method, are further explained below.
4.1.2 Data sources, quality control and review
For Burdekin Basin riverine fresh waters, DSITI reviewed available data from the following main data sources:
Queensland Government water quality data Industry sourced monitoring data provided under terms of datashare agreement for water
quality guideline development purposes
Further details are provided below and in Appendix 1. Figure 13 shows locations of water quality monitoring sites in the Burdekin Basin. These sites comprise a range of programs as outlined below.
4.1.2.1 Queensland Government water quality data
The Queensland Government water quality data includes:
Hydstra data: together, the Hydstra databases provide data from 165 sites: o Hydstra (gauging station) data, available through the Water Monitoring
Information Portal website (https://water-monitoring.information.qld.gov.au/host.htm). Data from 1958-2013 has been assessed for this project. Nutrient data only used from 1997 onwards.

Department of Science Information Technology and Innovation
26
o Project Hydstra data, available by request from DNRM. Data for 1964-2015 has been assessed for this review.
Great Barrier Reef Catchment Loads Monitoring Program data (measured at gauging stations) under both baseline and event conditions, for 2 sites from 2006-2014, 1 site from 2006-2013, 2 sites from 2007-2013 and 1 site from 2012-2014.
DSITI data collected between 1981 and 2001 from 5 sites, monitoring data stored in the Queensland Waterways Database.
Monitoring, collection and analysis tasks under these government programs are all subject to quality assurance protocols as per the Queensland monitoring and sampling manual, available from https://www.ehp.qld.gov.au/water/monitoring/monitoring_and_sampling_manual.html. Data undergoes quality assurance procedures before being entered to the Hydstra, Project Hydstra and Queensland Waterways databases.
4.1.2.2 Other datasets
The project team sourced data from a number of university and industry providers as input to the development of regionally specific water quality guidelines, including:
James Cook University Desert Channels NRM AMCI Adani
Data assurance review
These externally sourced datasets underwent data screening and quality assurance process to ensure compatibility with the Queensland Government dataset. Following quality assurance and data interrogation, the external datasets in total yielded approximately 8200 sample points each with records for up to 12 water quality parameters, collected from 84 sites of the Burdekin River Basin spanning years 2005-2015.
Screening processes applied to the dataset to remove impacted site data and dubious samples included:
removal of sites evidently used for monitoring of mine discharge waters – identified by those sites with very high conductivity and sulfate concentrations, and often very low turbidity
separation of event monitoring sites from low flow consideration (Event monitoring sites were used in the derivation of high flow WQGs – see discussion below).
duplicates: rationalisation to remove records where multiple samples showed the same results for same location/data/time (e.g. where different site codes yielded the same results)
duplicates: removal of Qld Government data from external datasets, as QG data was assessed separately as outlined above
removal of apparent ‘blank’ or ‘control’ samples where all nutrients were recorded as below detection
for sites subject to continuous or multiple monitoring events on a single day, rationalising results to be based on the mean value of results per day
removal of samples where pH was recorded outside a 0-14 range standardisation of units between different monitoring datasets (e.g. mg/L, μg/L)

Draft Environmental Values and Water Quality Guidelines for Burdekin River Basin fresh and estuarine waters
27
4.1.3 Sub-basin scale of draft water quality guidelines
For this project, water quality data has been separated in to sub-basin scale at which to develop water quality guidelines. These sub-basins are the same used for the Burdekin WQIP 2009. Refer to Figure 1 for map of sub-basins.
4.1.4 Flow separation
Certain indicators, including electrical conductivity and suspended solids, can vary considerably with flow regime (Jones & Moss 2011) and therefore separate guidelines are ideal to account for these differences between flow conditions. High flows and also very low and nil flow conditions can produce highly variable water quality, dependent on the time since the last flow and the amount of water in the system.
After quality assurance and data screening, samples from both the Queensland government and external datasets were categorised by flow condition using historical discharge data for local gauges. Discharge data was accessed from the DNRM online water monitoring information portal. Discharge was reported at a daily timestep as Daily Mean Discharge (m3 second-1, cumecs). This enabled separation of ‘high flow’ samples from ‘low/no flow’ samples, and the opportunity to establish guidelines under both these main flow characteristics, where sufficient data existed.
For each gauge in the catchment, a flow exceedance curve was plotted from the historical data. This was used to review the flow characteristics of the sub-basins. The approximate ‘inflection point’ for each curve was identified and used as an indicator to separate ‘high flow’ and ‘low flow’. For most sub-basins, high flow was identified as discharges above the 90th percentile of daily mean discharge (i.e. the 10% of recorded days with the greatest daily mean discharge). Low flow was defined as discharges below the 90th percentile of daily mean discharge. In the Lower Burdekin sub-basin the threshold was identified as closer to the 80th percentile of daily mean discharge. These lower reaches receive flows from the greatest area and are closer to the coast in higher rainfall areas, thus they receive more frequent high flows and the inflection point of the flow exceedance curves reflect these conditions. Conversely, some gauges high in the catchment, the flow exceedance curves had inflection points closer to the 95th percentile of daily mean flow, reflecting their small area and relatively dry conditions. Refer to Appendix 1, Figure 14 and Table 8 for more detail on flow exceedance curves and flow condition separation.
Discharge (cumecs) at each sample site was estimated from discharge reported at the nearest gauge, and attributed to ‘low flow’ or ‘high flow’ conditions if below or above the calculated high flow threshold for that gauge.
A review was undertaken to determine any variation in water quality results between ‘no flow’ and ‘low flow’ condition datasets. There was limited data attributed to no flow conditions and there was no observable difference for potentially sensitive indicators (e.g. conductivity, pH) between no flow and low flow groups. Therefore ‘no flow’ and ‘low flow’ were retained as a single group. WQGs derived from this process are nevertheless primarily based on ‘low flow conditions’ and accordingly caution is advised in application under ‘no flow’ conditions.
4.1.5 Derivation of freshwater water quality guidelines for moderately disturbed waters
These water quality guidelines are derived to protect or enhance the aquatic ecosystem environmental value. This protection is related to general goals of protecting integrity of ecosystem functions and general biological health. These goals can be achieved by maintaining the water quality of moderately disturbed reaches, or in some cases aiming for

Department of Science Information Technology and Innovation
28
improvements where necessary. More specific management intent, such as related to protection of a specific species, may require stricter water quality guidelines.
The aim in deriving these water quality guidelines was to protect aquatic ecosystems by maintaining or improving current water quality. Freshwater WQGs reported in the Burdekin WQIP have been based on the QWQG 2009 for the Central Coast region, which in turn are largely based on ANZECC guidelines. These WQGs may be inconsistent with the systems of the Burdekin River Basin, and may either not provide sufficient protection or impose inappropriate limits on water quality. The guideline values derived in this report are, depending on location and indicator, higher or lower than the current applicable water quality guidelines. Using the process outlined below they nonetheless provide for maintenance of, or an improvement on, current water quality.
4.1.5.1 Method of WQG review:
1. Sample sites and data were reviewed as outlined in section 4.2.2. 2. Data points were separated at sub-basin scale as outlined in section 4.2.3. 3. Flow condition was applied to samples as outlined in section 4.2.4. 4. A range of percentiles of the data for each parameter were calculated for each sub-
basin and flow condition. 5. The median of the recorded data was compared to the Central Coast guidelines from
the QWQG. a. Where the median of the recorded data represented a better water quality
than the Central Coast guideline, the median of the data was adopted as the updated WQG. The 20th and 80th percentiles are also defined to provide the water quality range. This method seeks to at least maintain water quality at current condition.
b. Where the median of the recorded data represented a poorer water quality than the Central Coast guideline, a lower percentile (representing an improvement of current water quality) of the recorded data was adopted as the updated WQG. The 40th percentile of recorded data was chosen as the updated WQG. The 20th and 70th percentiles are also defined to provide the water quality range. This method seeks an improvement over current water quality, but within a practicable range.
c. From part b), if the 40th percentile of recorded data represents a better water quality than the Central Coast guideline (where the Central Coast guideline is between the median and 40th percentile) the Central Coast guideline is retained, as this still provides a goal of improved water quality. The 20th and 70th percentiles of recorded data are also defined to provide the water quality range.
This method is adjusted taking into consideration management priorities outlined in the Burdekin WQIP. For each sub-basin, where the WQIP identifies a specific management target for improved water quality through reduced sediment or nutrient loads, the water quality guidelines were adjusted to a lower percentile, representing improved water quality and targeting towards achieving the management intent.
To assess against these water quality guidelines, the median of test data would be assessed against the guideline, and 20th and 80th percentiles of test data compared to the provided water quality range. For more information on monitoring condition relative to water quality guidelines, see Section 5 of this report and the QWQG 2009, Section 5.
The methods outlined above for developing and reviewing the water quality guidelines for the Burdekin basin poses a methodical and repeatable process. The updated WQGs seek

Draft Environmental Values and Water Quality Guidelines for Burdekin River Basin fresh and estuarine waters
29
to protect the aquatic ecosystem EV by, at a minimum, maintaining water quality, and improving water quality in impacted catchments.
This review provides for the first time in the Burdekin Basin many sub-basin specific water quality guidelines for a range of parameters derived from locally collected data. In some areas, this has resulted in higher guideline values than the earlier QWQG values which are derived largely from the AWQG. In other areas, guideline values are lower. As these guidelines are now based on local data, and the policy framework aims for continual improvement in water quality to protect EVs, future reviews of the guidelines should only seek to maintain or improve on the water quality values provided here.
4.2 Burdekin estuarine waters
The Burdekin estuary is relatively short compared to the large area of the basin. The estuary flows through a landscape dominated by sugarcane production with extensive wetlands on the coastal fringe. No regular monitoring of water quality occurs in the Burdekin estuary and therefore no data available for developing locally based water quality guidelines. Central Coast guidelines from the QWQG will apply for the mid-estuary reaches. Lower estuary, enclosed coastal, open coastal and marine WQGs are addressed in the separate DSITI report ‘Draft environmental values and water quality guidelines: Don and Haughton river basins, Mackay-Whitsunday estuaries, and coastal/marine waters’ (draft, 2017).
4.3 Water Quality Guideline Indicators
The study team reviewed potential indicators against content of the Burdekin WQIP, available water quality data and the parameters currently used in QWQG (2009).
The indicators for which guidelines have been developed are listed below. These indicators are important and often there is at least some data on which guidelines can be based.
At present there is limited data available for biological indicators. However, seagrass light guidelines have been included for estuarine waters and macroinvertebrate guidelines are under consideration, pending adequacy of data. In the longer term it is considered desirable to include guidelines for additional biological indicators. Toxicant guidelines (e.g. metals, pesticides) are sourced from AWQG trigger values (except where otherwise noted, e.g. Aluminium).
Cold water pollution from water storages is a serious ecological issue associated with impacts on aquatic communities. Temperature guidelines for protecting aquatic ecosystems values should be derived at a local scale based on background readings or nearby reference sites not affected by cold water pollution. This fine scale required for effective temperature guidelines is beyond the scope of this review.
4.3.1 Fresh waters
Freshwater indicators for which WQGs have been derived are:
ammonia nitrogen (μg/L) oxidised nitrogen (μg/L) total nitrogen (μg/L) filterable reactive phosphorus (μg/L) total phosphorus (μg/L) chlorophyll-a (μg/L)

Department of Science Information Technology and Innovation
30
dissolved oxygen (% saturation) turbidity (NTU) suspended solids (mg/L) pH conductivity (µS/cm at 25oC)
toxicants (µg/L or as specified)
Refer to Appendix 1 for further details on indicators and source datasets.
4.3.2 Mid estuarine waters
WQG indicators used for estuarine waters are as per fresh waters above but with the addition of Secchi depth (m), which is another water clarity indicator, and the removal of conductivity. There is limited water quality data available for the mid Burdekin estuary, therefore, QWQG 2009 Central Coast region guidelines will be applied. The default QWQG guidelines may be suitable for the mid estuary waters, as the guideline values are generally within the ranges set between the Lower Burdekin freshwater guidelines and nearby lower estuary and marine water guidelines developed for the Don-Haughton basins coastal waters.

Draft Environmental Values and Water Quality Guidelines for Burdekin River Basin fresh and estuarine waters
31
Figure 13 Burdekin River Basin fresh water quality monitoring sites

Department of Science Information Technology and Innovation
32
5 Water quality guidelines to protect aquatic ecosystems
This section outlines WQGs for Burdekin River Basin fresh waters and mid estuary.
5.1 Water Quality Guidelines tables information
The aquatic ecosystem water quality guidelines are presented in:
Table 1: Belyando River sub-basin Table 2: Bowen-Broken-Bogie rivers sub-basin Table 3: Upper Burdekin River sub-basin Table 4: Lower Burdekin River sub-basin Table 5: Cape-Campaspe rivers sub-basin Table 6: Suttor River sub-basin
Water quality guidelines are specified for low flow conditions and, where indicated, event flows along with event flow discharge thresholds at nearby gauges.
Each table provides first, a sub-basin scale of water quality guidelines. This is followed by more localised guidelines at the sub-catchment scale where there was sufficient data for their derivation. Not all sub-catchments had enough data for guideline development, or only did for some parameters. Where sub-catchment scale guidelines are not provided, the sub-basin scale guidelines will apply.
For tables 1–6, columns of each table identify:
1st column: water type (e.g. freshwater) or water type sub-region (e.g. Belyando floodplain), and data source for the guideline development.
2nd column: management intent/level of protection for that water (HEV – high ecological value; SD – slightly disturbed; MD – moderately disturbed). For more information about management intent of waters, refer to the EPP Water.
Other columns: these identify the water quality guideline values proposed to achieve the management intent for specified indicators (TN, TP, pH, etc.).
Data sources, references and notes are listed after the tables, and further details are provided in appendices.
5.2 Monitoring condition relative to aquatic ecosystem water quality guidelines
The following protocols are recommended for monitoring condition (at a ‘test’ site) relative to the aquatic ecosystem water quality guidelines. More details are provided in the QWQG (section 5, Appendix D) and the AWQG (ANZECC & ARMCANZ, 2000). In general (e.g. for nutrients) the intent is for test site water quality to be less than or equal to the stated guidelines:
HEV waters (and SD waters): The management intent is no change from natural condition (HEV waters) and to achieve HEV condition (SD waters). Where a range of

Draft Environmental Values and Water Quality Guidelines for Burdekin River Basin fresh and estuarine waters
33
three values is provided for waters identified for HEV level of protection (e.g. Total N:65-100-125), the 75 percent confidence intervals around sampled 20th-50th-80th percentile distributions of the test data should meet the specified range of values. The sample number is a minimum of 24 test values over the relevant period (12 months if a continuous activity or alternatively a shorter period for activities where discharge occurs for only part of the year). For DO and pH, a range of two values typically applies, and the test sample values should fall within the specified range.
For the comparison of test site monitoring data against single value guidelines with an MD level of protection, the median water quality value (e.g. concentration) of a number (preferably five or more) of independent samples at a particular monitoring ('test') site should be compared against the applicable water quality guideline/objective.
Where a range of three values is provided for waters with an MD level of protection (e.g. Total N: 165-200-225) the median water quality value of test samples is compared with the middle value of the stated range. The 20th and 80th percentiles are compared with the outside values of the range provided, which are the desired 20th – median – 80th percentile range of test values.
Where a range of two values is provided for water with an MD level of protection, as for parameters DO and pH, the median water quality values of test samples should fall within this range.
Coastal/marine waters: additional advice on marine water monitoring is provided in the DSITI report ‘Draft environmental values and water quality guidelines: Don and Haughton river basins, Mackay-Whitsunday estuaries, and coastal/marine waters’ (draft, 2017).
For assessing monitoring data against toxicant guidelines/objectives (in waters and sediments), the QWQG refers to the AWQG protocols (e.g. AWQG vol. 1 sections 3.5.5, 7.4.4.2 and 7.4.4.4). For toxicants in water, the AWQG recommends the comparison of the 95th percentile of monitoring data against the default toxicant trigger values.

Department of Science Information Technology and Innovation
34
Table 1 Belyando River sub-basin water quality guidelines: baseflow and event
Water area/type (Source: s1–s3)
Management intent /Level of
protection
Table 1: BELYANDO RIVER SUB‐BASIN ‐ fresh waters: Water quality guidelines1– 2
Note: WQGs for indicators are shown as a range of 20th, 50th and 80th percentiles to be achieved (e.g. 3–4–5), lower and upper limits (e.g. pH: 7.2–8.2), or as a single value (e.g. <15). For single value guidelines, medians of test data are compared against the draft guideline (refer text for more details). HEV: high ecological value; SD: slightly disturbed; MD: moderately disturbed – refer accompanying maps for details Sources: S1: Local datasets (e.g. DSITI, key stakeholder); S2: QWQG guidelines and /or data; S3: ANZECC (2000) AWQG
Ammonium N (μg/L)
Oxidised N (μg/L)
Total N (μg/L)
Filterable Reactive P (μg/L)
Total P (μg/L)
Chlorophyll‐a (μg/L)
Dissolved Oxygen
(% saturation)
Turbidity (NTU)
Suspended Solids (mg/L)
pH Conductivity (µS/cm)
Sulfate (mg/L as SO4
2‐)
BELYANDO RIVER SUB‐BASIN FRESH WATERS (refer to map Figure 6)
PHYSICO‐CHEMICAL
HEV and SD waters (national parks, etc)
HEV Maintain/achieve effectively unmodified water quality (20th, 50th and 80th percentiles of HEV waters), habitat, biota, flow and riparian areas. Note: there is insufficient information available to establish effectively unmodified water quality for these waters. Refer to QWQG for details on how to establish a minimum water quality data set for deriving local 20th, 50th and 80th percentiles.
Belyando River sub‐basin waters ‐all sub‐basin
waters not named below
(s1, s2)
MD
BASEFLOW <36 m3/s (cumecs) at gauge 120301B – Belyando River at Gregory Development Road
10–20–60 (s1)
10–30–100 (s1)
600–855–1265(s1)
5‐10‐40 (s1)
70–130–270 (s1)
6‐8‐20 (s1)
85–110 (s2)
55–105–265 (s1)
25–60–205 (s1)
6.5–8.5 (s2)
190‐305‐550 (s1)
2‐4‐8 (s1)
EVENT FLOW >36 m3/s (cumecs) at gauge 120301B – Belyando River at Gregory Development Road
7‐10‐20 (s1)
<5‐10‐25 (s1)
705‐790‐980 (s1)
20‐45‐70 (s1)
160‐195‐270 (s1)
id id 100‐165‐370
(s1) 40‐110‐250
(s1) 6.5–8.5 (s2)
95‐135‐240 (s1)
1–2–3 (s1)
Belyando Floodplain
sub‐catchment waters
(s1, s2)
MD
BASEFLOW <36 m3/s (cumecs) at gauge 120301B – Belyando River at Gregory Development Road
10‐15‐20 (s1)
10‐40‐110 (s1)
730‐950‐1255(s1)
10‐20‐30 (s1)
120‐200‐300 (s1)
<5 (s2)
85–110 (s2)
70‐165‐300 (s1)
55‐100‐325 (s1)
6.5–8.5 (s2)
185‐275‐325 (s1)
2‐3‐7 (s1)

Draft Environmental Values and Water Quality Guidelines for Burdekin River Basin fresh and estuarine waters
35
Water area/type (Source: s1–s3)
Management intent /Level of
protection
Table 1: BELYANDO RIVER SUB‐BASIN ‐ fresh waters: Water quality guidelines1– 2
Note: WQGs for indicators are shown as a range of 20th, 50th and 80th percentiles to be achieved (e.g. 3–4–5), lower and upper limits (e.g. pH: 7.2–8.2), or as a single value (e.g. <15). For single value guidelines, medians of test data are compared against the draft guideline (refer text for more details). HEV: high ecological value; SD: slightly disturbed; MD: moderately disturbed – refer accompanying maps for details Sources: S1: Local datasets (e.g. DSITI, key stakeholder); S2: QWQG guidelines and /or data; S3: ANZECC (2000) AWQG
Ammonium N (μg/L)
Oxidised N (μg/L)
Total N (μg/L)
Filterable Reactive P (μg/L)
Total P (μg/L)
Chlorophyll‐a (μg/L)
Dissolved Oxygen
(% saturation)
Turbidity (NTU)
Suspended Solids (mg/L)
pH Conductivity (µS/cm)
Sulfate (mg/L as SO4
2‐)
EVENT FLOW >36 m3/s (cumecs) at gauge 120301B – Belyando River at Gregory Development Road
7‐10‐25 (s1)
<5‐10‐25 (s1)
700‐775‐930 (s1)
id 160‐195‐265
(s1) id id
110‐165‐300 (s1)
35‐95‐225 (s1)
6.5–8.5 (s2)
80‐110‐145 (s1)
1–1–3 (s1)
Carmichael River sub‐catchment
waters
(s1, s2)
MD
BASEFLOW <36 m3/s (cumecs) at gauge 120301B – Belyando River at Gregory Development Road
15‐55‐80 (s1)
10‐30‐100 (s1)
580‐870‐1400(s1)
5‐10‐100 (s1)
45‐110‐270 (s1)
<5 (s2)
85–110 (s2)
15‐110‐260 (s1)
20‐45‐200 (s1)
6.5–8.5 (s2)
270‐515‐1045(s1)
1‐5‐12 (s1)
EVENT FLOW >36 m3/s (cumecs) at gauge 120301B – Belyando River at Gregory Development Road
id id id id id id id 115‐290‐760
(s1) id
6.5–8.5 (s2)
115‐170‐325 (s1)
id
Mistake Creek sub‐catchment
waters
(s1, s2)
MD
BASEFLOW <3.8 m3/s (cumecs) at gauge 120309A – Mistake Creek at Twin Hills
id id id id id id id 30‐60‐130
(s1) 20‐35‐125
(s1) 6.5–8.5 (s2)
105‐130‐180 (s1)
2‐4‐8 (s1)
EVENT FLOW >3.8 m3/s (cumecs) at gauge 120309A – Mistake Creek at Twin Hills
id id id id id id id id id 6.5–8.5 (s2)
id id

Department of Science Information Technology and Innovation
36
Water area/type (Source: s1–s3)
Management intent /Level of
protection
Table 1: BELYANDO RIVER SUB‐BASIN ‐ fresh waters: Water quality guidelines1– 2
Note: WQGs for indicators are shown as a range of 20th, 50th and 80th percentiles to be achieved (e.g. 3–4–5), lower and upper limits (e.g. pH: 7.2–8.2), or as a single value (e.g. <15). For single value guidelines, medians of test data are compared against the draft guideline (refer text for more details). HEV: high ecological value; SD: slightly disturbed; MD: moderately disturbed – refer accompanying maps for details Sources: S1: Local datasets (e.g. DSITI, key stakeholder); S2: QWQG guidelines and /or data; S3: ANZECC (2000) AWQG
Ammonium N (μg/L)
Oxidised N (μg/L)
Total N (μg/L)
Filterable Reactive P (μg/L)
Total P (μg/L)
Chlorophyll‐a (μg/L)
Dissolved Oxygen
(% saturation)
Turbidity (NTU)
Suspended Solids (mg/L)
pH Conductivity (µS/cm)
Sulfate (mg/L as SO4
2‐)
Native Companion Creek
sub‐catchment waters
(s1, s2)
MD
BASEFLOW <0.8 m3/s (cumecs) at gauge 120305A – Native Companion Creek at Violet Grove
10‐25‐50 (s1)
3‐15‐80 (s1)
520‐660‐865 (s1)
5‐10‐20 (s1)
50‐80‐170 (s1)
id 85‐110 (s2)
25‐55‐125 (s1)
15‐35‐105 (s1)
6.5–8.5 (s2)
190‐230‐385 (s1)
1‐2‐2 (s1)
EVENT FLOW <0.8 m3/s (cumecs) at gauge 120305A – Native Companion Creek at Violet Grove
id id id id id id id 85‐140‐285
(s1) id
6.5–8.8 (s1, s2)
100‐185‐260 (s1)
id
Lakes, reservoirs MD Note: there is insufficient information available to establish local guidelines for lakes/reservoirs. Refer to QWQG for details on how to establish a minimum water quality data set for deriving local 20th, 50th and 80th percentiles. The following are sourced from the QWQG (Central region) regional guidelines).
10 (s2)
10 (s2)
350 (s2)
5 (s2)
10 (s2)
5 (s2)
90–110 (s2)
1–20 (s2)
nd (s2)
6.5–8.0 (s2)
Refer QWQG Appendix G
id
Fresh waters: Toxicants (s3)
HEV and SD
WQGs for all toxicants and pesticides in these waters as per AWQG, to protect species at the HEV level of protection.
Toxicants in water: refer to AWQG volume 1 section 3.4—‘water quality guidelines for toxicants’ (including tables 3.4.1, 3.4.2, and Figure 3.4.1), and AWQG volume 2 (section 8). AWQG values for the HEV level of protection typically correspond to protection of 99% of species.
Toxicants in sediments: refer to AWQG volume 1 section 3.5—‘sediment quality guidelines’ (including Table 3.5.1, Figure 3.5.1), and AWQG volume 2 (section 8) 8)

Draft Environmental Values and Water Quality Guidelines for Burdekin River Basin fresh and estuarine waters
37
Water area/type (Source: s1–s3)
Management intent /Level of
protection
Table 1: BELYANDO RIVER SUB‐BASIN ‐ fresh waters: Water quality guidelines1– 2
Note: WQGs for indicators are shown as a range of 20th, 50th and 80th percentiles to be achieved (e.g. 3–4–5), lower and upper limits (e.g. pH: 7.2–8.2), or as a single value (e.g. <15). For single value guidelines, medians of test data are compared against the draft guideline (refer text for more details). HEV: high ecological value; SD: slightly disturbed; MD: moderately disturbed – refer accompanying maps for details Sources: S1: Local datasets (e.g. DSITI, key stakeholder); S2: QWQG guidelines and /or data; S3: ANZECC (2000) AWQG
Ammonium N (μg/L)
Oxidised N (μg/L)
Total N (μg/L)
Filterable Reactive P (μg/L)
Total P (μg/L)
Chlorophyll‐a (μg/L)
Dissolved Oxygen
(% saturation)
Turbidity (NTU)
Suspended Solids (mg/L)
pH Conductivity (µS/cm)
Sulfate (mg/L as SO4
2‐)
Fresh waters: Toxicants (s3)
MD
WQGs for all toxicants and pesticides in these waters as per AWQG, to protect species at the MD level of protection (except where noted).
Toxicants in water: refer to AWQG volume 1 section 3.4—‘water quality guidelines for toxicants’ (including tables 3.4.1, 3.4.2, and Figure 3.4.1), and AWQG volume 2 (section 8). AWQG values for the MD level of protection typically correspond to protection of 95% species (in a small number of cases where bioaccumulation may occur, the AWQG recommends 99% species protection level).
Toxicants in sediments: refer to AWQG volume 1 section 3.5—‘sediment quality guidelines’ (including Table 3.5.1, Figure 3.5.1), and AWQG volume 2 (section 8)
TEMPERATURE
Fresh waters All Temperature varies daily and seasonally, is depth‐dependent and highly site specific. Refer to QWQG for details on how to establish a range (20th – 80th %iles) of temperature. From an ecological effects perspective, daily maximum temperature and daily variation in temperature are key indicators, and seasonal variations also need to be identified.
STATE PLANNING POLICY, RIPARIAN, WETLANDS, GROUNDWATERS State Planning
Policy all Refer to section 5.3
Riparian all Refer to section 5.3
Wetlands all
Refer to section 5.3
Note: there is insufficient information available to establish local guidelines for wetlands. Refer to QWQG for details on how to establish a minimum water quality data set for deriving local 20th, 50th and 80th percentiles. In the absence of local information, the AWQG provides default values for wetlands.
Groundwaters (s2)
HEV Groundwaters to be addressed in detail in a separate report. The AWQG recommends that the highest level of protection should be provided to underground aquatic ecosystems, given their high conservation value. Where groundwaters are in good condition the management intent is to maintain existing water quality. Where groundwaters interact with surface waters, groundwater quality should not compromise identified EVs and WQGs for those waters.
Abbreviations: id: insufficient data; na: not applicable
Notes to Tables 1–6 (where applicable):
For monitoring condition relative to WQGs in the table, refer to section 5.2 and QWQG (section 5 and Appendix D) for further information on applying guidelines.
1. Nutrients:
Oxidised N = NO2 + NO3. Dissolved inorganic N (DIN) = Amm N + Oxidised N.
Except where specified for event conditions, nutrient guidelines do not apply during high flow events in fresh and estuarine waters. During periods of low flow and particularly in smaller creeks, build‐up of organic matter derived from natural sources (e.g. leaf litter) can result in increased organic N levels (generally in the range of 400 to 800µg/L). This may lead to total N values exceeding the WQGs. Provided that levels of

Department of Science Information Technology and Innovation
38
inorganic N (i.e. NH3 + oxidised N) remain low, then the elevated levels of organic N should not be seen as a breach of the WQGs, provided this is due to natural causes. See QWQG (section 5 and Appendix D) for more information on applying guidelines under high flow conditions.
2. Dissolved oxygen (DO): Dissolved Oxygen (DO) guidelines apply to daytime conditions. Lower values will occur at night in most waters. In estuaries, reductions should only be in the region of 10–15 per cent saturation below daytime values. In freshwaters, night‐time reductions are more variable. Following significant rainfall events, reduced DO values may occur due to the influx of organic material. In estuaries post‐event values as low as 40 per cent saturation may occur naturally for short periods but values well below this would indicate some anthropogenic effect. In freshwaters, post‐event DO reductions are again more variable. In general, DO values consistently less than 50 per cent are likely to impact on the ongoing ability of fish to persist in a water body while short term DO values less than 30 per cent saturation are toxic to some fish species. Very high DO (supersaturation) values can be toxic to some fish as they cause gas bubble disease. DO values for fresh waters should only be applied to flowing waters. Stagnant pools in intermittent streams naturally experience values of DO below 50 per cent saturation.
References:
ANZECC & ARMCANZ (2000) Australian and New Zealand Guidelines for Fresh and Marine Water Quality (AWQG).
Queensland Government (DEHP 2009, as amended) Queensland Water Quality Guidelines. (Refer to section 5 and Appendix D of the QWQG for more detail on compliance assessment protocols.)

Draft Environmental Values and Water Quality Guidelines for Burdekin River Basin fresh and estuarine waters
39
Table 2 Bowen-Broken-Bogie River sub-basin water quality guidelines: baseflow and event
Water area/type (Source: s1–s3)
Management intent /Level of
protection
Table 2: BOWEN‐BROKEN‐BOGIE RIVER SUB‐BASIN ‐ fresh waters: Water quality guidelines1– 2
Note: WQGs for indicators are shown as a range of 20th, 50th and 80th percentiles to be achieved (e.g. 3–4–5), lower and upper limits (e.g. pH: 7.2–8.2), or as a single value (e.g. <15). For single value guidelines, medians of test data are compared against the draft guideline (refer text for more details). HEV: high ecological value; SD: slightly disturbed; MD: moderately disturbed – refer accompanying maps for details Sources: S1: Local datasets (e.g. DSITI, key stakeholder); S2: QWQG guidelines and /or data; S3: ANZECC (2000) AWQG
Ammonium N (μg/L)
Oxidised N (μg/L)
Total N (μg/L)
Filterable Reactive P (μg/L)
Total P (μg/L)
Chlorophyll‐a (μg/L)
Dissolved Oxygen
(% saturation)
Turbidity (NTU)
Suspended Solids (mg/L)
pH Conductivity (µS/cm)
Sulfate (mg/L as SO4
2‐)
BOWEN‐BROKEN‐BOGIE RIVER SUB‐BASIN FRESH WATERS (refer to map Figure 7)
PHYSICO‐CHEMICAL
HEV and SD waters (national parks, etc)
HEV Maintain/achieve effectively unmodified water quality (20th, 50th and 80th percentiles of HEV waters), habitat, biota, flow and riparian areas. There is insufficient information available to establish effectively unmodified water quality guidelines for these waters. Refer to QWQG for details on how to establish a minimum water quality data set for deriving local 20th, 50th and 80th percentiles.
Bowen, Broken and Bogie Rivers
sub‐basin waters ‐all sub‐basin
waters not named below
(s1, s2)
MD
BASEFLOW <33 m3/s (cumecs) at gauge 120205A – Bowen River at Myuna
6‐10‐45 (s1)
<5‐15‐90 (s1)
155‐265‐550 (s1)
<5‐5‐25 (s1)
20‐30‐70 (s1)
3‐7‐15 (s1)
85–110 (s2)
<5‐5‐15 (s1, s2)
5‐10‐15 (s1)
6.5–8.5 (s2)
115‐160‐370 (s1)
2‐3‐10 (s1)
EVENT FLOW >33 m3/s (cumecs) at gauge 120205A – Bowen River at Myuna
<5‐20‐40 (s1)
25‐75‐195 (s1)
270‐550‐1500(s1)
20‐50‐80 (s1)
60‐120‐400 (s1)
id id 7‐25‐100
(s1) 15‐50‐285
(s1) 6.5–8.5 (s2)
110‐175‐460 (s1)
2‐5‐30 (s1)
Bowen River sub‐catchment
waters (s1,s2)
MD
BASEFLOW <33 m3/s (cumecs) at gauge 120205A – Bowen River at Myuna
10‐30‐70 (s1)
<5‐<5‐15 (s1)
170‐250‐450 (s1)
5‐15‐25 (s1)
20‐35‐60 (s1)
<5 (s2)
85–110 (s2)
<5‐10‐35 (s1)
5‐10‐25 (s1)
6.5–8.5 (s2)
160‐220‐345 (s1)
2‐4‐9 (s1)

Department of Science Information Technology and Innovation
40
Water area/type (Source: s1–s3)
Management intent /Level of
protection
Table 2: BOWEN‐BROKEN‐BOGIE RIVER SUB‐BASIN ‐ fresh waters: Water quality guidelines1– 2
Note: WQGs for indicators are shown as a range of 20th, 50th and 80th percentiles to be achieved (e.g. 3–4–5), lower and upper limits (e.g. pH: 7.2–8.2), or as a single value (e.g. <15). For single value guidelines, medians of test data are compared against the draft guideline (refer text for more details). HEV: high ecological value; SD: slightly disturbed; MD: moderately disturbed – refer accompanying maps for details Sources: S1: Local datasets (e.g. DSITI, key stakeholder); S2: QWQG guidelines and /or data; S3: ANZECC (2000) AWQG
Ammonium N (μg/L)
Oxidised N (μg/L)
Total N (μg/L)
Filterable Reactive P (μg/L)
Total P (μg/L)
Chlorophyll‐a (μg/L)
Dissolved Oxygen
(% saturation)
Turbidity (NTU)
Suspended Solids (mg/L)
pH Conductivity (µS/cm)
Sulfate (mg/L as SO4
2‐)
EVENT FLOW >33 m3/s (cumecs) at gauge 120205A – Bowen River at Myuna
<5‐20‐40 (s1)
25‐60‐175 (s1)
270‐515‐1470(s1)
20‐30‐60 (s1)
85‐130‐550 (s1)
id id id 70‐140‐390
(s1) 6.5–8.5 (s2)
120‐160‐215 (s1)
4‐4‐6 (s1)
Broken River sub‐catchment
waters
(s1, s2)
MD
BASEFLOW <17 m3/s (cumecs) at gauge 120207A – Broken River at Urannah
10‐30‐70 (s1)
15‐25‐110 (s1)
100‐210‐340 (s1)
<5‐5‐10 (s1)
10‐20‐65 (s1)
3‐7‐15 (s1)
85–110 (s2)
<5‐<5‐5 (s1)
5‐10‐10 (s1)
6.5–8.5 (s2)
105‐130‐165 (s1)
2‐2‐4 (s1)
EVENT FLOW >17 m3/s (cumecs) at gauge 120207A – Broken River at Urannah
id id id id id id id id 10‐15‐35
(s1) 6.5–8.5 (s2)
100‐120‐165 (s1)
1–2–2 (s1)
Little Bowen River sub‐catchment
waters (s1,s2)
MD
BASEFLOW <33 m3/s (cumecs) at gauge 120205A – Bowen River at Myuna
(<2.5 m3/s (cumecs) at gauge 120210A – Bowen River at Exmoor CLOSED)
id id id id id <5 (s2)
85–110 (s2)
id 10‐15‐30
(s1) 6.5–8.5 (s2)
350‐490‐1000(s1)
10‐22‐58 (s1)
EVENT FLOW >33 m3/s (cumecs) at gauge 120205A – Bowen River at Myuna
(>2.5 m3/s (cumecs) at gauge 120210A – Bowen River at Exmoor CLOSED)
id id id id id id id id id 6.5–8.5 (s2)
id id

Draft Environmental Values and Water Quality Guidelines for Burdekin River Basin fresh and estuarine waters
41
Water area/type (Source: s1–s3)
Management intent /Level of
protection
Table 2: BOWEN‐BROKEN‐BOGIE RIVER SUB‐BASIN ‐ fresh waters: Water quality guidelines1– 2
Note: WQGs for indicators are shown as a range of 20th, 50th and 80th percentiles to be achieved (e.g. 3–4–5), lower and upper limits (e.g. pH: 7.2–8.2), or as a single value (e.g. <15). For single value guidelines, medians of test data are compared against the draft guideline (refer text for more details). HEV: high ecological value; SD: slightly disturbed; MD: moderately disturbed – refer accompanying maps for details Sources: S1: Local datasets (e.g. DSITI, key stakeholder); S2: QWQG guidelines and /or data; S3: ANZECC (2000) AWQG
Ammonium N (μg/L)
Oxidised N (μg/L)
Total N (μg/L)
Filterable Reactive P (μg/L)
Total P (μg/L)
Chlorophyll‐a (μg/L)
Dissolved Oxygen
(% saturation)
Turbidity (NTU)
Suspended Solids (mg/L)
pH Conductivity (µS/cm)
Sulfate (mg/L as SO4
2‐)
Pelican Creek sub‐catchment
waters
(s1, s2)
MD
BASEFLOW <33 m3/s (cumecs) at gauge 120205A – Bowen River at Myuna
(<1.1 m3/s (cumecs) at gauge 120220A Pelican Creek at Kerale CLOSED)
id id 380‐580‐830
(s1) id
35‐60‐80 (s1)
<5 (s2)
85–110 (s2)
<5‐15‐25 (s1)
5‐10‐25 (s1)
6.5–8.5 (s2)
810‐1090‐1800(s1)
35‐120‐300 (s1)
EVENT FLOW >33 m3/s (cumecs) at gauge 120205A – Bowen River at Myuna (>1.1 m3/s (cumecs) at gauge 120220A Pelican Creek at Kerale CLOSED)
id id id id id id id id i.d 6.5–8.5 (s2)
305‐700‐950 (s1)
25‐50‐90 (s1)
Lakes, reservoirs MD Note: there is insufficient information available to establish local guidelines for lakes/reservoirs. Refer to QWQG for details on how to establish a minimum water quality data set for deriving local 20th, 50th and 80th percentiles. The following are sourced from the QWQG (Central region) regional guidelines).
10 (s2)
10 (s2)
350 (s2)
5 (s2)
10 (s2)
5 (s2)
90–110 (s2)
1–20 (s2)
nd (s2)
6.5–8.0 (s2)
Refer QWQG Appendix G
id

Department of Science Information Technology and Innovation
42
Water area/type (Source: s1–s3)
Management intent /Level of
protection
Table 2: BOWEN‐BROKEN‐BOGIE RIVER SUB‐BASIN ‐ fresh waters: Water quality guidelines1– 2
Note: WQGs for indicators are shown as a range of 20th, 50th and 80th percentiles to be achieved (e.g. 3–4–5), lower and upper limits (e.g. pH: 7.2–8.2), or as a single value (e.g. <15). For single value guidelines, medians of test data are compared against the draft guideline (refer text for more details). HEV: high ecological value; SD: slightly disturbed; MD: moderately disturbed – refer accompanying maps for details Sources: S1: Local datasets (e.g. DSITI, key stakeholder); S2: QWQG guidelines and /or data; S3: ANZECC (2000) AWQG
Ammonium N (μg/L)
Oxidised N (μg/L)
Total N (μg/L)
Filterable Reactive P (μg/L)
Total P (μg/L)
Chlorophyll‐a (μg/L)
Dissolved Oxygen
(% saturation)
Turbidity (NTU)
Suspended Solids (mg/L)
pH Conductivity (µS/cm)
Sulfate (mg/L as SO4
2‐)
Fresh waters: Toxicants (s3)
HEV and SD
WQGs for all toxicants and pesticides in these waters as per AWQG, to protect species at the HEV level of protection.
Toxicants in water: refer to AWQG volume 1 section 3.4—‘water quality guidelines for toxicants’ (including tables 3.4.1, 3.4.2, and Figure 3.4.1), and AWQG volume 2 (section 8). AWQG values for the HEV level of protection typically correspond to protection of 99% of species.
Toxicants in sediments: refer to AWQG volume 1 section 3.5—‘sediment quality guidelines’ (including Table 3.5.1, Figure 3.5.1), and AWQG volume 2 (section 8)
Fresh waters: Toxicants (s3)
MD
WQGs for all toxicants and pesticides in these waters as per AWQG, to protect species at the MD level of protection (except where noted).
Toxicants in water: refer to AWQG volume 1 section 3.4—‘water quality guidelines for toxicants’ (including tables 3.4.1, 3.4.2, and Figure 3.4.1), and AWQG volume 2 (section 8). AWQG values for the MD level of protection typically correspond to protection of 95% species (in a small number of cases where bioaccumulation may occur, the AWQG recommends 99% species protection level).
Toxicants in sediments: refer to AWQG volume 1 section 3.5—‘sediment quality guidelines’ (including Table 3.5.1, Figure 3.5.1), and AWQG volume 2 (section 8)
TEMPERATURE
Fresh waters All Temperature varies daily and seasonally, is depth‐dependent and highly site specific. Refer to QWQG for details on how to establish a range (20th – 80th %iles) of temperature. From an ecological effects perspective, daily maximum temperature and daily variation in temperature are key indicators, and seasonal variations also need to be identified.
STATE PLANNING POLICY, RIPARIAN, WETLANDS, GROUNDWATERS State Planning
Policy all Refer to section 5.3
Riparian all Refer to section 5.3
Wetlands all
Refer to section 5.3
Note: there is insufficient information available to establish local guidelines for wetlands. Refer to QWQG for details on how to establish a minimum water quality data set for deriving local 20th, 50th and 80th percentiles. In the absence of local information, the AWQG provides default values for wetlands.
Groundwaters (s2)
HEV Groundwaters to be addressed in detail in a separate report. The AWQG recommends that the highest level of protection should be provided to underground aquatic ecosystems, given their high conservation value. Where groundwaters are in good condition the management intent is to maintain existing water quality. Where groundwaters interact with surface waters, groundwater quality should not compromise identified EVs and WQGs for those waters.
Abbreviations: id: insufficient data; na: not applicable
Notes: refer notes after Table 1

Draft Environmental Values and Water Quality Guidelines for Burdekin River Basin fresh and estuarine waters
43
Table 3 Upper Burdekin River sub-basin water quality guidelines: baseflow and event
Water area/type (Source: s1–s3)
Management intent /Level of
protection
Table 3: UPPER BURDEKIN RIVER SUB‐BASIN ‐ fresh waters: Water quality guidelines1– 2
Note: WQGs for indicators are shown as a range of 20th, 50th and 80th percentiles to be achieved (e.g. 3–4–5), lower and upper limits (e.g. pH: 7.2–8.2), or as a single value (e.g. <15). For single value guidelines, medians of test data are compared against the draft guideline (refer text for more details). HEV: high ecological value; SD: slightly disturbed; MD: moderately disturbed – refer accompanying maps for details Sources: S1: Local datasets (e.g. DSITI, key stakeholder); S2: QWQG guidelines and /or data; S3: ANZECC (2000) AWQG
Ammonium N (μg/L)
Oxidised N (μg/L)
Total N (μg/L)
Filterable Reactive P (μg/L)
Total P (μg/L)
Chlorophyll‐a (μg/L)
Dissolved Oxygen
(% saturation)
Turbidity (NTU)
Suspended Solids (mg/L)
pH Conductivity (µS/cm)
Sulfate (mg/L as SO4
2‐)
UPPER BURDEKIN RIVER SUB‐BASIN FRESH WATERS (refer to map Figure 8)
PHYSICO‐CHEMICAL
HEV and SD waters (national parks, etc)
HEV Maintain/achieve effectively unmodified water quality (20th, 50th and 80th percentiles of HEV waters), habitat, biota, flow and riparian areas. There is insufficient information available to establish effectively unmodified water quality guidelines for these waters. Refer to QWQG for details on how to establish a minimum water quality data set for deriving local 20th, 50th and 80th percentiles.
Upper Burdekin sub‐basin waters ‐ all sub‐basin
waters not named below
(s1, s2)
MD
BASEFLOW <121 m3/s (cumecs) at gauge 120002C – Burdekin River at Sellheim
<5–5–15 (s1)
<5–5–35 (s1)
160–250–365(s1)
5–10–30 (s1)
20–35–65 (s1)
<5 (s2)
85–110 (s2)
5–10–25 (s1)
5–10–20 (s1)
6.5–8.5 (s2)
130‐320‐550 (s1)
1–2–3 (s1)
EVENT FLOW >121 m3/s (cumecs) at gauge 120002C – Burdekin River at Sellheim
<5‐5‐10 (s1)
20‐40‐85 (s1)
530‐755‐1220(s1)
20‐25‐35 (s1)
120‐190‐390 (s1)
id id 30‐140‐250
(s1) 50‐180‐620
(s1) 6.5‐8.5 (s2)
70‐100‐150 (s1)
1‐2‐3 (s1)
Burdekin Above Dam sub‐catchment
waters (s1, s2)
MD
BASEFLOW <121 m3/s (cumecs) at gauge 120002C – Burdekin River at Sellheim
5‐5‐15 (s1)
5‐10‐50 (s1)
180‐270‐430 (s1)
5‐15‐25 (s1)
20‐35‐65 (s1)
<5 (s2)
85–110 (s2)
5‐10‐30 (s1)
5‐10‐30 (s1)
6.5–8.5 (s2)
230‐310‐385 (s1)
1‐2‐3 (s1)

Department of Science Information Technology and Innovation
44
Water area/type (Source: s1–s3)
Management intent /Level of
protection
Table 3: UPPER BURDEKIN RIVER SUB‐BASIN ‐ fresh waters: Water quality guidelines1– 2
Note: WQGs for indicators are shown as a range of 20th, 50th and 80th percentiles to be achieved (e.g. 3–4–5), lower and upper limits (e.g. pH: 7.2–8.2), or as a single value (e.g. <15). For single value guidelines, medians of test data are compared against the draft guideline (refer text for more details). HEV: high ecological value; SD: slightly disturbed; MD: moderately disturbed – refer accompanying maps for details Sources: S1: Local datasets (e.g. DSITI, key stakeholder); S2: QWQG guidelines and /or data; S3: ANZECC (2000) AWQG
Ammonium N (μg/L)
Oxidised N (μg/L)
Total N (μg/L)
Filterable Reactive P (μg/L)
Total P (μg/L)
Chlorophyll‐a (μg/L)
Dissolved Oxygen
(% saturation)
Turbidity (NTU)
Suspended Solids (mg/L)
pH Conductivity (µS/cm)
Sulfate (mg/L as SO4
2‐)
EVENT FLOW >121 m3/s (cumecs) at gauge 120002C – Burdekin River at Sellheim
5‐5‐8 (s1)
20‐35‐70 (s1)
530‐800‐1200(s1)
id 150‐220‐400
(s1) id id
150‐210‐250 (s1)
175‐425‐810 (s1)
6.5‐8.5 (s2)
80‐100‐150 (s1)
1‐1‐2 (s1)
Burdekin Blue Range
sub‐catchment waters
(s1, s2)
MD
BASEFLOW <43 m3/s (cumecs) at gauge 120107B – Burdekin River at Blue Range
5‐5‐6 (s1)
5‐5‐7 (s1)
140‐190‐280 (s1)
id 15‐35‐60
(s1) <5 (s2)
85–110 (s2)
5‐10‐30 (s1)
5‐10‐25 (s1)
6.5–8.5 (s2)
280‐420‐540 (s1)
1‐1‐2 (s1)
EVENT FLOW >43 m3/s (cumecs) at gauge 120107B – Burdekin River at Blue Range
id id id id id id id id id 6.5‐8.5 (s2)
id id
Upper Burdekin River
sub‐catchment waters
(s1, s2)
MD
BASEFLOW <8.3 m3/s (cumecs) at gauge 120123A – Burdekin River at Valley of Lagoons
id id 150‐195‐370
(s1) id
20‐45‐70 (s1)
<5 (s2)
85–110 (s2)
5‐20‐25 (s1)
5‐15‐25 (s1)
6.5‐8.5 (s2)
105‐295‐540 (s1)
1‐2‐3 (s1)
EVENT FLOW >8.3 m3/s (cumecs) at gauge 120123A – Burdekin River at Valley of Lagoons
id id id id id id id id id id id id

Draft Environmental Values and Water Quality Guidelines for Burdekin River Basin fresh and estuarine waters
45
Water area/type (Source: s1–s3)
Management intent /Level of
protection
Table 3: UPPER BURDEKIN RIVER SUB‐BASIN ‐ fresh waters: Water quality guidelines1– 2
Note: WQGs for indicators are shown as a range of 20th, 50th and 80th percentiles to be achieved (e.g. 3–4–5), lower and upper limits (e.g. pH: 7.2–8.2), or as a single value (e.g. <15). For single value guidelines, medians of test data are compared against the draft guideline (refer text for more details). HEV: high ecological value; SD: slightly disturbed; MD: moderately disturbed – refer accompanying maps for details Sources: S1: Local datasets (e.g. DSITI, key stakeholder); S2: QWQG guidelines and /or data; S3: ANZECC (2000) AWQG
Ammonium N (μg/L)
Oxidised N (μg/L)
Total N (μg/L)
Filterable Reactive P (μg/L)
Total P (μg/L)
Chlorophyll‐a (μg/L)
Dissolved Oxygen
(% saturation)
Turbidity (NTU)
Suspended Solids (mg/L)
pH Conductivity (µS/cm)
Sulfate (mg/L as SO4
2‐)
Basalt River sub‐catchment
waters
(s1, s2)
MD
BASEFLOW <1.6 m3/s (cumecs) at gauge 120106B – Basalt River at Bluff Downs
id id 255‐310‐360
(s1) id
30‐50‐70 (s1)
<5 (s2)
85–110 (s2)
5‐5‐15 (s1)
5‐10‐15 (s1)
6.5‐8.7 (s1,s2)
500‐730‐935 (s1)
1‐1‐3 (s1)
EVENT FLOW >1.6 m3/s (cumecs) at gauge 120106B – Basalt River at Bluff Downs
id id id id id id id id id id id id
Clark River sub‐catchment
waters
(s1, s2)
MD
BASEFLOW <67 m3/s (cumecs) at gauge 120110A – Burdekin River at Mount Fullstop
(<9.5 m3/s (cumecs) at gauge 120113A – Clarke River at Wandovale CLOSED)
id id id id id <5 (s2)
85–110 (s2)
id id 6.5‐8.5 (s2)
Clark River225‐365‐450
Maryvale Creek
1070‐1115‐1150 (s1)
1‐1‐3 (s1)
EVENT FLOW >67 m3/s (cumecs) at gauge 120110A – Burdekin River at Mount Fullstop (>9.5 m3/s (cumecs) at gauge 120113A – Clarke River at Wandovale CLOSED)
Insufficient Data

Department of Science Information Technology and Innovation
46
Water area/type (Source: s1–s3)
Management intent /Level of
protection
Table 3: UPPER BURDEKIN RIVER SUB‐BASIN ‐ fresh waters: Water quality guidelines1– 2
Note: WQGs for indicators are shown as a range of 20th, 50th and 80th percentiles to be achieved (e.g. 3–4–5), lower and upper limits (e.g. pH: 7.2–8.2), or as a single value (e.g. <15). For single value guidelines, medians of test data are compared against the draft guideline (refer text for more details). HEV: high ecological value; SD: slightly disturbed; MD: moderately disturbed – refer accompanying maps for details Sources: S1: Local datasets (e.g. DSITI, key stakeholder); S2: QWQG guidelines and /or data; S3: ANZECC (2000) AWQG
Ammonium N (μg/L)
Oxidised N (μg/L)
Total N (μg/L)
Filterable Reactive P (μg/L)
Total P (μg/L)
Chlorophyll‐a (μg/L)
Dissolved Oxygen
(% saturation)
Turbidity (NTU)
Suspended Solids (mg/L)
pH Conductivity (µS/cm)
Sulfate (mg/L as SO4
2‐)
Running River, Star River, Keelbottom Creek and Fanning
River sub‐catchment
waters
(s1, s2)
MD
BASEFLOW <7.9 m3/s (cumecs) at gauge 120120A – Running River at Mount Bradley
<11 m3/s (cumecs) at gauge 120112A – Star River at Laroona
<3.7 m3/s (cumecs) at gauge 120102A – Keelbottom Creek at Keelbottom
(<1.9 m3/s (cumecs) at gauge 120119A – Fanning River at Fanning River CLOSED)
id id id id id <5 (s2)
85–110 (s2)
<5‐5‐10 (s1)
<5‐5‐10 (s1)
6.5‐8.5 (s2)
55‐85‐115
Fanning River: 155‐200‐375
(s1)
2‐2‐3 (s1)
EVENT FLOW >7.9 m3/s (cumecs) at gauge 120120A – Running River at Mount Bradley
>11 m3/s (cumecs) at gauge 120112A – Star River at Laroona
>3.7 m3/s (cumecs) at gauge 120102A – Keelbottom Creek at Keelbottom
(>1.9 m3/s (cumecs) at gauge 120119A – Fanning River at Fanning River CLOSED)
Insufficient Data
Lakes, reservoirs MD Note: there is insufficient information available to establish local guidelines for lakes/reservoirs. Refer to QWQG for details on how to establish a minimum water quality data set for deriving local 20th, 50th and 80th percentiles. The following are sourced from the QWQG (Central region) regional guidelines).
10 (s2)
10 (s2)
350 (s2)
5 (s2)
10 (s2)
5 (s2)
90–110 (s2)
1–20 (s2)
nd (s2)
6.5–8.0 (s2)
Refer QWQG Appendix G
id

Draft Environmental Values and Water Quality Guidelines for Burdekin River Basin fresh and estuarine waters
47
Water area/type (Source: s1–s3)
Management intent /Level of
protection
Table 3: UPPER BURDEKIN RIVER SUB‐BASIN ‐ fresh waters: Water quality guidelines1– 2
Note: WQGs for indicators are shown as a range of 20th, 50th and 80th percentiles to be achieved (e.g. 3–4–5), lower and upper limits (e.g. pH: 7.2–8.2), or as a single value (e.g. <15). For single value guidelines, medians of test data are compared against the draft guideline (refer text for more details). HEV: high ecological value; SD: slightly disturbed; MD: moderately disturbed – refer accompanying maps for details Sources: S1: Local datasets (e.g. DSITI, key stakeholder); S2: QWQG guidelines and /or data; S3: ANZECC (2000) AWQG
Ammonium N (μg/L)
Oxidised N (μg/L)
Total N (μg/L)
Filterable Reactive P (μg/L)
Total P (μg/L)
Chlorophyll‐a (μg/L)
Dissolved Oxygen
(% saturation)
Turbidity (NTU)
Suspended Solids (mg/L)
pH Conductivity (µS/cm)
Sulfate (mg/L as SO4
2‐)
Fresh waters: Toxicants (s3)
HEV and SD
WQGs for all toxicants and pesticides in these waters as per AWQG, to protect species at the HEV level of protection.
Toxicants in water: refer to AWQG volume 1 section 3.4—‘water quality guidelines for toxicants’ (including tables 3.4.1, 3.4.2, and Figure 3.4.1), and AWQG volume 2 (section 8). AWQG values for the HEV level of protection typically correspond to protection of 99% of species.
Toxicants in sediments: refer to AWQG volume 1 section 3.5—‘sediment quality guidelines’ (including Table 3.5.1, Figure 3.5.1), and AWQG volume 2 (section 8)
Fresh waters: Toxicants (s3)
MD
WQGs for all toxicants and pesticides in these waters as per AWQG, to protect species at the MD level of protection (except where noted).
Toxicants in water: refer to AWQG volume 1 section 3.4—‘water quality guidelines for toxicants’ (including tables 3.4.1, 3.4.2, and Figure 3.4.1), and AWQG volume 2 (section 8). AWQG values for the MD level of protection typically correspond to protection of 95% species (in a small number of cases where bioaccumulation may occur, the AWQG recommends 99% species protection level).
Toxicants in sediments: refer to AWQG volume 1 section 3.5—‘sediment quality guidelines’ (including Table 3.5.1, Figure 3.5.1), and AWQG volume 2 (section 8)
TEMPERATURE
Fresh waters All Temperature varies daily and seasonally, is depth‐dependent and highly site specific. Refer to QWQG for details on how to establish a range (20th – 80th %iles) of temperature. From an ecological effects perspective, daily maximum temperature and daily variation in temperature are key indicators, and seasonal variations also need to be identified.
STATE PLANNING POLICY, RIPARIAN, WETLANDS, GROUNDWATERS State Planning
Policy all Refer to section 5.3
Riparian all Refer to section 5.3
Wetlands all
Refer to section 5.3
Note: there is insufficient information available to establish local guidelines for wetlands. Refer to QWQG for details on how to establish a minimum water quality data set for deriving local 20th, 50th and 80th percentiles. In the absence of local information, the AWQG provides default values for wetlands.
Groundwaters (s2)
HEV Groundwaters to be addressed in detail in a separate report. The AWQG recommends that the highest level of protection should be provided to underground aquatic ecosystems, given their high conservation value. Where groundwaters are in good condition the management intent is to maintain existing water quality. Where groundwaters interact with surface waters, groundwater quality should not compromise identified EVs and WQGs for those waters.
Abbreviations: id: insufficient data; na: not applicable
Notes: refer notes after Table 1

Department of Science Information Technology and Innovation
48
Table 4 Lower Burdekin River sub-basin water quality guidelines – fresh water and mid estuary: baseflow and event
Water area/type (Source: s1–s3)
Management intent /Level of
protection
Table 4: LOWER BURDEKIN RIVER SUB‐BASIN ‐ fresh waters, mid estuary: Water quality guidelines1– 3
Note: WQGs for indicators are shown as a range of 20th, 50th and 80th percentiles to be achieved (e.g. 3–4–5), lower and upper limits (e.g. pH: 7.2–8.2), or as a single value (e.g. <15). For single value guidelines, medians of test data are compared against the draft guideline (refer text for more details). HEV: high ecological value; SD: slightly disturbed; MD: moderately disturbed – refer accompanying maps for details Sources: S1: Local datasets (e.g. DSITI, key stakeholder); S2: QWQG guidelines and /or data; S3: ANZECC (2000) AWQG
Ammonium N (μg/L)
Oxidised N (μg/L)
Total N (μg/L)
Filterable Reactive P (μg/L)
Total P (μg/L)
Chlorophyll‐a (μg/L)
Dissolved Oxygen
(% saturation)
Turbidity (NTU)
Suspended Solids (mg/L)
pH
Conductivity (µS/cm)
Sulfate (mg/L as SO4
2‐)
LOWER BURDEKIN RIVER SUB‐BASIN FRESH WATERS (refer to map Figure 9)
PHYSICO‐CHEMICAL
HEV and SD waters (national parks, etc)
HEV Maintain/achieve effectively unmodified water quality (20th, 50th and 80th percentiles of HEV waters), habitat, biota, flow and riparian areas. There is insufficient information available to establish effectively unmodified water quality guidelines for these waters. Refer to QWQG for details on how to establish a minimum water quality data set for deriving local 20th, 50th and 80th percentiles.
Lower Burdekin River
main channel (s1, s2)
MD
BASEFLOW <109 m3/s (cumecs) at gauge 120006B – Burdekin River at Clare
<5‐5‐10 (s1)
<5‐20‐90 (s1)
275‐320‐430 (s1)
<5‐6‐10 (s1)
25‐35‐55 (s1)
3‐4‐7 (s2)
85–110 (s2)
20‐45‐85 (s1, s2)
10‐15‐55 (s1)
6.5–8.5 (s2)
155‐195‐265 (s1)
2‐2‐5 (s1)
EVENT FLOW >109 m3/s (cumecs) at gauge 120006B – Burdekin River at Clare
<5‐7‐15 (s1)
60‐80‐125 (s1)
470‐590‐780 (s1)
20‐25‐35 (s1)
100‐130‐210 (s1)
id id 115‐160‐280
(s1) 60‐115‐280
(s1) 6.5–8.5 (s2)
100‐125‐160 (s1)
2‐2‐3 (s1)
Lower Burdekin sub‐basin fresh
waters Excluding main
channel
MD
BASEFLOW <109 m3/s (cumecs) at gauge 120006B – Burdekin River at Clare
7‐10‐20 (s1)
2‐10‐55 (s1)
340‐395‐650 (s1)
5‐10‐20 (s1)
20‐30‐60 (s1)
1‐2‐4 (s2)
85–110 (s2)
8‐55‐100 (s1, s2)
5‐10‐40 (s1)
6.5–8.5 (s2)
170‐200‐300 (s1)
2‐5‐37 (s1)

Draft Environmental Values and Water Quality Guidelines for Burdekin River Basin fresh and estuarine waters
49
Water area/type (Source: s1–s3)
Management intent /Level of
protection
Table 4: LOWER BURDEKIN RIVER SUB‐BASIN ‐ fresh waters, mid estuary: Water quality guidelines1– 3
Note: WQGs for indicators are shown as a range of 20th, 50th and 80th percentiles to be achieved (e.g. 3–4–5), lower and upper limits (e.g. pH: 7.2–8.2), or as a single value (e.g. <15). For single value guidelines, medians of test data are compared against the draft guideline (refer text for more details). HEV: high ecological value; SD: slightly disturbed; MD: moderately disturbed – refer accompanying maps for details Sources: S1: Local datasets (e.g. DSITI, key stakeholder); S2: QWQG guidelines and /or data; S3: ANZECC (2000) AWQG
Ammonium N (μg/L)
Oxidised N (μg/L)
Total N (μg/L)
Filterable Reactive P (μg/L)
Total P (μg/L)
Chlorophyll‐a (μg/L)
Dissolved Oxygen
(% saturation)
Turbidity (NTU)
Suspended Solids (mg/L)
pH
Conductivity (µS/cm)
Sulfate (mg/L as SO4
2‐)
EVENT FLOW >109 m3/s (cumecs) at gauge 120006B – Burdekin River at Clare
id id id id id id id 140‐265‐555
(s1) 45‐50‐140
(s1) 6.5–8.5 (s2)
110‐130‐160 (s1)
id
Lakes, reservoirs MD Note: there is insufficient information available to establish local guidelines for lakes/reservoirs. Refer to QWQG for details on how to establish a minimum water quality data set for deriving local 20th, 50th and 80th percentiles. The following are sourced from the QWQG (Central region) regional guidelines).
10 (s2)
10 (s2)
350 (s2)
5 (s2)
10 (s2)
5 (s2)
90–110 (s2)
1–20 (s2)
nd (s2)
6.5–8.0 (s2)
Refer QWQG Appendix G
id
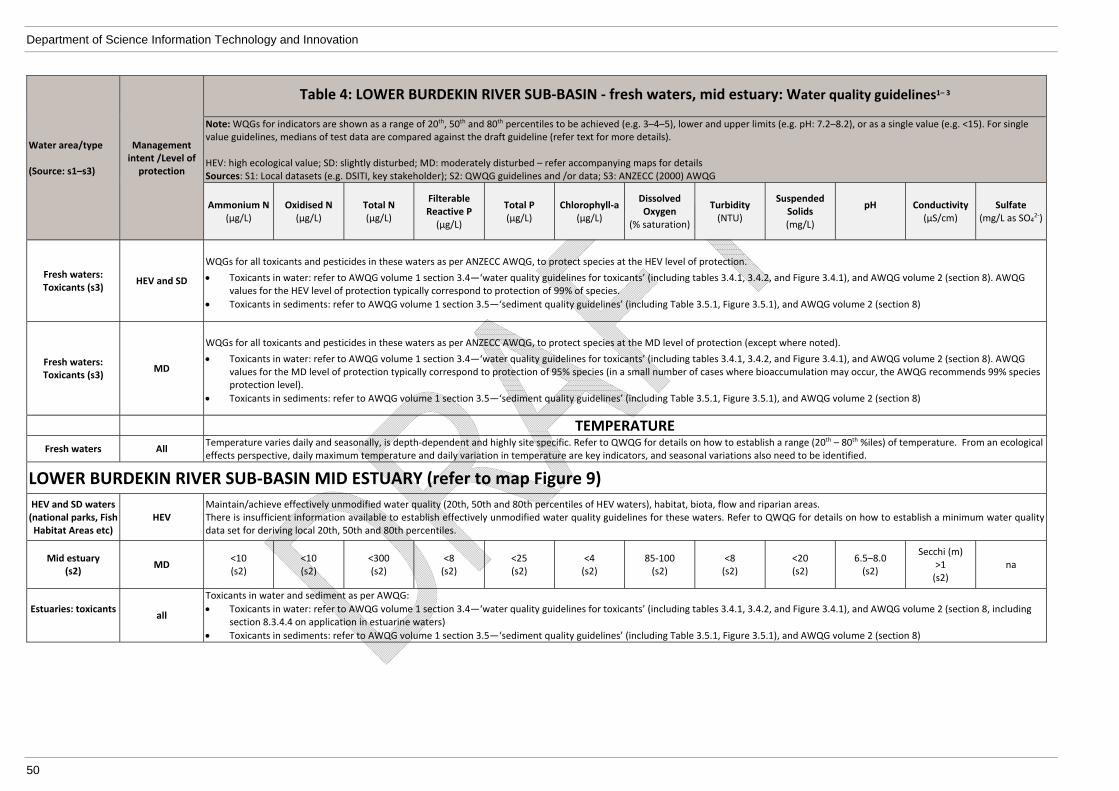
Department of Science Information Technology and Innovation
50
Water area/type (Source: s1–s3)
Management intent /Level of
protection
Table 4: LOWER BURDEKIN RIVER SUB‐BASIN ‐ fresh waters, mid estuary: Water quality guidelines1– 3
Note: WQGs for indicators are shown as a range of 20th, 50th and 80th percentiles to be achieved (e.g. 3–4–5), lower and upper limits (e.g. pH: 7.2–8.2), or as a single value (e.g. <15). For single value guidelines, medians of test data are compared against the draft guideline (refer text for more details). HEV: high ecological value; SD: slightly disturbed; MD: moderately disturbed – refer accompanying maps for details Sources: S1: Local datasets (e.g. DSITI, key stakeholder); S2: QWQG guidelines and /or data; S3: ANZECC (2000) AWQG
Ammonium N (μg/L)
Oxidised N (μg/L)
Total N (μg/L)
Filterable Reactive P (μg/L)
Total P (μg/L)
Chlorophyll‐a (μg/L)
Dissolved Oxygen
(% saturation)
Turbidity (NTU)
Suspended Solids (mg/L)
pH
Conductivity (µS/cm)
Sulfate (mg/L as SO4
2‐)
Fresh waters: Toxicants (s3)
HEV and SD
WQGs for all toxicants and pesticides in these waters as per ANZECC AWQG, to protect species at the HEV level of protection.
Toxicants in water: refer to AWQG volume 1 section 3.4—‘water quality guidelines for toxicants’ (including tables 3.4.1, 3.4.2, and Figure 3.4.1), and AWQG volume 2 (section 8). AWQG values for the HEV level of protection typically correspond to protection of 99% of species.
Toxicants in sediments: refer to AWQG volume 1 section 3.5—‘sediment quality guidelines’ (including Table 3.5.1, Figure 3.5.1), and AWQG volume 2 (section 8)
Fresh waters: Toxicants (s3)
MD
WQGs for all toxicants and pesticides in these waters as per ANZECC AWQG, to protect species at the MD level of protection (except where noted).
Toxicants in water: refer to AWQG volume 1 section 3.4—‘water quality guidelines for toxicants’ (including tables 3.4.1, 3.4.2, and Figure 3.4.1), and AWQG volume 2 (section 8). AWQG values for the MD level of protection typically correspond to protection of 95% species (in a small number of cases where bioaccumulation may occur, the AWQG recommends 99% species protection level).
Toxicants in sediments: refer to AWQG volume 1 section 3.5—‘sediment quality guidelines’ (including Table 3.5.1, Figure 3.5.1), and AWQG volume 2 (section 8)
TEMPERATURE
Fresh waters All Temperature varies daily and seasonally, is depth‐dependent and highly site specific. Refer to QWQG for details on how to establish a range (20th – 80th %iles) of temperature. From an ecological effects perspective, daily maximum temperature and daily variation in temperature are key indicators, and seasonal variations also need to be identified.
LOWER BURDEKIN RIVER SUB‐BASIN MID ESTUARY (refer to map Figure 9)
HEV and SD waters (national parks, Fish Habitat Areas etc)
HEV Maintain/achieve effectively unmodified water quality (20th, 50th and 80th percentiles of HEV waters), habitat, biota, flow and riparian areas. There is insufficient information available to establish effectively unmodified water quality guidelines for these waters. Refer to QWQG for details on how to establish a minimum water quality data set for deriving local 20th, 50th and 80th percentiles.
Mid estuary (s2)
MD <10 (s2)
<10 (s2)
<300 (s2)
<8 (s2)
<25 (s2)
<4 (s2)
85‐100 (s2)
<8 (s2)
<20 (s2)
6.5–8.0 (s2)
Secchi (m) >1 (s2)
na
Estuaries: toxicants
all
Toxicants in water and sediment as per AWQG:
Toxicants in water: refer to AWQG volume 1 section 3.4—‘water quality guidelines for toxicants’ (including tables 3.4.1, 3.4.2, and Figure 3.4.1), and AWQG volume 2 (section 8, including section 8.3.4.4 on application in estuarine waters)
Toxicants in sediments: refer to AWQG volume 1 section 3.5—‘sediment quality guidelines’ (including Table 3.5.1, Figure 3.5.1), and AWQG volume 2 (section 8)

Draft Environmental Values and Water Quality Guidelines for Burdekin River Basin fresh and estuarine waters
51
Water area/type (Source: s1–s3)
Management intent /Level of
protection
Table 4: LOWER BURDEKIN RIVER SUB‐BASIN ‐ fresh waters, mid estuary: Water quality guidelines1– 3
Note: WQGs for indicators are shown as a range of 20th, 50th and 80th percentiles to be achieved (e.g. 3–4–5), lower and upper limits (e.g. pH: 7.2–8.2), or as a single value (e.g. <15). For single value guidelines, medians of test data are compared against the draft guideline (refer text for more details). HEV: high ecological value; SD: slightly disturbed; MD: moderately disturbed – refer accompanying maps for details Sources: S1: Local datasets (e.g. DSITI, key stakeholder); S2: QWQG guidelines and /or data; S3: ANZECC (2000) AWQG
Ammonium N (μg/L)
Oxidised N (μg/L)
Total N (μg/L)
Filterable Reactive P (μg/L)
Total P (μg/L)
Chlorophyll‐a (μg/L)
Dissolved Oxygen
(% saturation)
Turbidity (NTU)
Suspended Solids (mg/L)
pH
Conductivity (µS/cm)
Sulfate (mg/L as SO4
2‐)
Estuaries: biological all
Seagrass:
Light requirements are specified as a photosynthetic active radiation (PAR) moving average, depending on seagrass species. Levels specified here are derived to support the health of all species present either as the dominant species or as one of a suite of species that are known to occur in the region, based on Chartrand et al (2012, 2014). It does not reflect requirements for macroalgae or other organisms.
Deep water areas (>10m): 2.5 mol m‐2 day‐1 over a rolling 7 day average # (Collier et al 2016; Chartrand et al 2014; Rasheed et al 2014; York et al 2015)
Shallow inshore areas (<10m): 6 mol m‐2 day‐1 over a rolling 14 day average # (Collier et al 2016; Chartrand et al, 2012) Note: # Absolute light requirements for seagrass may vary between sites. Values described here provide a conservative guide to the levels of light likely to support seagrass growth from acute water quality impacts. Locally derived absolute thresholds ideally should be obtained for management of specific activities likely to impact on the light environment. Higher light requirements may be needed for the management of longer term chronic impacts. Also see rows below.
STATE PLANNING POLICY, RIPARIAN, WETLANDS, GROUNDWATERS State Planning
Policy all Refer to section 5.3
Riparian all Refer to section 5.3
Wetlands, mangroves
all
Refer to section 5.3
Mangroves: No loss of mangrove area (refer section 5.3).
Note: there is insufficient information available to establish local guidelines for wetlands. Refer to QWQG for details on how to establish a minimum water quality data set for deriving local 20th, 50th and 80th percentiles. In the absence of local information, the AWQG provides default values for wetlands.
Groundwaters (s2)
HEV Groundwaters to be addressed in detail in a separate report. The AWQG recommends that the highest level of protection should be provided to underground aquatic ecosystems, given their high conservation value. Where groundwaters are in good condition the management intent is to maintain existing water quality. Where groundwaters interact with surface waters, groundwater quality should not compromise identified EVs and WQGs for those waters.
Abbreviations: id: insufficient data; na: not applicable
Notes:
1. Nutrients:
Oxidised N = NO2 + NO3. Dissolved inorganic N (DIN) = Amm N + Oxidised N.

Department of Science Information Technology and Innovation
52
Except where specified for event conditions, nutrient guidelines do not apply during high flow events in fresh and estuarine waters. During periods of low flow and particularly in smaller creeks, build‐up of organic matter derived from natural sources (e.g. leaf litter) can result in increased organic N levels (generally in the range of 400 to 800µg/L). This may lead to total N values exceeding the WQGs. Provided that levels of inorganic N (i.e. NH3 + oxidised N) remain low, then the elevated levels of organic N should not be seen as a breach of the WQGs, provided this is due to natural causes. See QWQG (section 5 and Appendix D) for more information on applying guidelines under high flow conditions.
2. Dissolved oxygen (DO): Dissolved Oxygen (DO) guidelines apply to daytime conditions. Lower values will occur at night in most waters. In estuaries, reductions should only be in the region of 10–15 per cent saturation below daytime values. In freshwaters, night‐time reductions are more variable. Following significant rainfall events, reduced DO values may occur due to the influx of organic material. In estuaries post‐event values as low as 40 per cent saturation may occur naturally for short periods but values well below this would indicate some anthropogenic effect. In freshwaters, post‐event DO reductions are again more variable. In general, DO values consistently less than 50 per cent are likely to impact on the ongoing ability of fish to persist in a water body while short term DO values less than 30 per cent saturation are toxic to some fish species. Very high DO (supersaturation) values can be toxic to some fish as they cause gas bubble disease. DO values for fresh waters should only be applied to flowing waters. Stagnant pools in intermittent streams naturally experience values of DO below 50 per cent saturation.
3. Suspended solids: Suspended solids (and hence turbidity and Secchi depth) levels in coastal and tidal estuarine waters are naturally highly variable depending on wind speed/wave height and in some cases on tidal cycles. The values in this table provide guidance on what the long term values of turbidity, Secchi depth or TSS should comply with. However, these values will often be naturally exceeded in the short term during windy weather or spring tides. They therefore should not be used for comparison with short term data sets. Where assessable coastal developments are proposed, proponents should carry out site specific intensive monitoring of these indicators (or equivalent light penetration indicators) and use these as a baseline for deriving local guidelines and for comparison with post development conditions.

Draft Environmental Values and Water Quality Guidelines for Burdekin River Basin fresh and estuarine waters
53
Table 5 Cape-Campaspe River sub-basin water quality guidelines: baseflow and event
Water area/type (Source: s1–s3)
Management intent /Level of
protection
Table 5: CAPE‐CAMPASPE RIVER SUB‐BASIN ‐ fresh waters: Water quality guidelines1– 2
Note: WQGs for indicators are shown as a range of 20th, 50th and 80th percentiles to be achieved (e.g. 3–4–5), lower and upper limits (e.g. pH: 7.2–8.2), or as a single value (e.g. <15). For single value guidelines, medians of test data are compared against the draft guideline (refer text for more details). HEV: high ecological value; SD: slightly disturbed; MD: moderately disturbed – refer accompanying maps for details Sources: S1: Local datasets (e.g. DSITI, key stakeholder); S2: QWQG guidelines and /or data; S3: ANZECC (2000) AWQG
Ammonium N (μg/L)
Oxidised N (μg/L)
Total N (μg/L)
Filterable Reactive P (μg/L)
Total P (μg/L)
Chlorophyll‐a (μg/L)
Dissolved Oxygen
(% saturation)
Turbidity (NTU)
Suspended Solids (mg/L)
pH
Conductivity (µS/cm)
Sulfate (mg/L as SO4
2‐)
CAPE‐CAMPASPE RIVER SUB‐BASIN FRESH WATERS (refer to map Figure 10)
PHYSICO‐CHEMICAL
HEV and SD waters (national parks, etc)
HEV Maintain/achieve effectively unmodified water quality (20th, 50th and 80th percentiles of HEV waters), habitat, biota, flow and riparian areas. There is insufficient information available to establish effectively unmodified water quality guidelines for these waters. Refer to QWQG for details on how to establish a minimum water quality data set for deriving local 20th, 50th and 80th percentiles.
Cape‐Campaspe sub‐basin waters
(s1, s2)
MD
BASEFLOW <14 m3/s (cumecs) at gauge 120302B – Cape River at Taemas
<5‐6‐8 (s1)
<5‐5‐8 (s1)
240‐380‐590 (s1)
1‐5‐10 (s1)
20‐40‐60 (s1)
<5 (s2)
85–110 (s2)
10‐15‐50 (s1)
10‐15‐25 (s1)
6.5–8.5 (s2)
110‐135‐175 (s1)
1–2‐4 (s1)
EVENT FLOW >14 m3/s (cumecs) at gauge 120302B – Cape River at Taemas
<5‐7‐9 (s1)
<5‐9‐35 (s1)
540‐640‐810 (s1)
5‐9‐12 (s1)
60‐80‐135 (s1)
id id 95‐120‐200
(s1) 60‐100‐240
(s1) 6.5–8.5 (s2)
50‐75‐105 (s1)
1–2–5 (s1)
Lakes, reservoirs MD Note: there is insufficient information available to establish local guidelines for lakes/reservoirs. Refer to QWQG for details on how to establish a minimum water quality data set for deriving local 20th, 50th and 80th percentiles. The following are sourced from the QWQG (Central region) regional guidelines).
10 (s2)
10 (s2)
350 (s2)
5 (s2)
10 (s2)
5 (s2)
90–110 (s2)
1–20 (s2)
nd (s2)
6.5–8.0 (s2)
Refer QWQG Appendix G
id

Department of Science Information Technology and Innovation
54
Water area/type (Source: s1–s3)
Management intent /Level of
protection
Table 5: CAPE‐CAMPASPE RIVER SUB‐BASIN ‐ fresh waters: Water quality guidelines1– 2
Note: WQGs for indicators are shown as a range of 20th, 50th and 80th percentiles to be achieved (e.g. 3–4–5), lower and upper limits (e.g. pH: 7.2–8.2), or as a single value (e.g. <15). For single value guidelines, medians of test data are compared against the draft guideline (refer text for more details). HEV: high ecological value; SD: slightly disturbed; MD: moderately disturbed – refer accompanying maps for details Sources: S1: Local datasets (e.g. DSITI, key stakeholder); S2: QWQG guidelines and /or data; S3: ANZECC (2000) AWQG
Ammonium N (μg/L)
Oxidised N (μg/L)
Total N (μg/L)
Filterable Reactive P (μg/L)
Total P (μg/L)
Chlorophyll‐a (μg/L)
Dissolved Oxygen
(% saturation)
Turbidity (NTU)
Suspended Solids (mg/L)
pH
Conductivity (µS/cm)
Sulfate (mg/L as SO4
2‐)
Fresh waters: Toxicants (s3)
HEV and SD
WQGs for all toxicants and pesticides in these waters as per AWQG, to protect species at the HEV level of protection.
Toxicants in water: refer to AWQG volume 1 section 3.4—‘water quality guidelines for toxicants’ (including tables 3.4.1, 3.4.2, and Figure 3.4.1), and AWQG volume 2 (section 8). AWQG values for the HEV level of protection typically correspond to protection of 99% of species.
Toxicants in sediments: refer to AWQG volume 1 section 3.5—‘sediment quality guidelines’ (including Table 3.5.1, Figure 3.5.1), and AWQG volume 2 (section 8)
Fresh waters: Toxicants (s3)
MD
WQGs for all toxicants and pesticides in these waters as per AWQG, to protect species at the MD level of protection (except where noted).
Toxicants in water: refer to AWQG volume 1 section 3.4—‘water quality guidelines for toxicants’ (including tables 3.4.1, 3.4.2, and Figure 3.4.1), and AWQG volume 2 (section 8). AWQG values for the MD level of protection typically correspond to protection of 95% species (in a small number of cases where bioaccumulation may occur, the AWQG recommends 99% species protection level).
Toxicants in sediments: refer to AWQG volume 1 section 3.5—‘sediment quality guidelines’ (including Table 3.5.1, Figure 3.5.1), and AWQG volume 2 (section 8)
TEMPERATURE
Fresh waters All Temperature varies daily and seasonally, is depth‐dependent and highly site specific. Refer to QWQG for details on how to establish a range (20th – 80th %iles) of temperature. From an ecological effects perspective, daily maximum temperature and daily variation in temperature are key indicators, and seasonal variations also need to be identified.
STATE PLANNING POLICY, RIPARIAN, WETLANDS, GROUNDWATERS State Planning
Policy all Refer to section 5.3
Riparian all Refer to section 5.3
Wetlands all
Refer to section 5.3
Note: there is insufficient information available to establish local guidelines for wetlands. Refer to QWQG for details on how to establish a minimum water quality data set for deriving local 20th, 50th and 80th percentiles. In the absence of local information, the AWQG provides default values for wetlands.
Groundwaters (s2)
HEV Groundwaters to be addressed in detail in a separate report. The AWQG recommends that the highest level of protection should be provided to underground aquatic ecosystems, given their high conservation value. Where groundwaters are in good condition the management intent is to maintain existing water quality. Where groundwaters interact with surface waters, groundwater quality should not compromise identified EVs and WQGs for those waters.
Abbreviations: id: insufficient data; na: not applicable
Notes: refer notes after Table 1

Draft Environmental Values and Water Quality Guidelines for Burdekin River Basin fresh and estuarine waters
55
Table 6 Suttor River sub-basin water quality guidelines: baseflow and event
Water area/type (Source: s1–s3)
Management intent /Level of
protection
Table 6: SUTTOR RIVER SUB‐BASIN ‐ fresh waters: Water quality guidelines1– 2
Note: WQGs for indicators are shown as a range of 20th, 50th and 80th percentiles to be achieved (e.g. 3–4–5), lower and upper limits (e.g. pH: 7.2–8.2), or as a single value (e.g. <15). For single value guidelines, medians of test data are compared against the draft guideline (refer text for more details). HEV: high ecological value; SD: slightly disturbed; MD: moderately disturbed – refer accompanying maps for details Sources: S1: Local datasets (e.g. DSITI, key stakeholder); S2: QWQG guidelines and /or data; S3: ANZECC (2000) AWQG
Ammonium N (μg/L)
Oxidised N (μg/L)
Total N (μg/L)
Filterable Reactive P (μg/L)
Total P (μg/L)
Chlorophyll‐a (μg/L)
Dissolved Oxygen
(% saturation)
Turbidity (NTU)
Suspended Solids (mg/L)
pH
Conductivity (µS/cm)
Sulfate (mg/L as SO4
2‐)
SUTTOR RIVER SUB‐BASIN FRESH WATERS (refer to map Figure 11)
PHYSICO‐CHEMICAL
HEV and SD waters (national parks, etc)
HEV Maintain/achieve effectively unmodified water quality (20th, 50th and 80th percentiles of HEV waters), habitat, biota, flow and riparian areas. There is insufficient information available to establish effectively unmodified water quality guidelines for these waters. Refer to QWQG for details on how to establish a minimum water quality data set for deriving local 20th, 50th and 80th percentiles.
Suttor sub‐basin waters
‐all sub‐basin waters not named
below
(s1, s2)
MD
BASEFLOW <55 m3/s (cumecs) at gauge 120303A –Suttor River at St Anns
7‐15‐30 (s1)
8‐40‐165 (s1)
630‐850‐1090(s1)
<5‐20‐35 (s1)
80‐120‐220 (s1)
<5 (s2)
85–110 (s2)
45‐135‐340 (s1)
30‐60‐145 (s1)
6.5–8.5 (s2)
120‐170‐270 (s1)
2‐4‐6 (s1)
EVENT FLOW >55 m3/s (cumecs) at gauge 120303A –Suttor River at St Anns
8‐15‐20 (s1)
6‐25‐65 (s1)
690‐870‐1120(s1)
20‐35‐45 (s1)
120‐180‐270 (s1)
id id 180‐305‐440
(s1) 70‐125‐225
(s1) 6.5–8.5 (s2)
100‐125‐175 (s1)
2‐3‐4 (s1)
Lower Suttor sub‐catchment
waters MD
BASEFLOW <55 m3/s (cumecs) at gauge 120303A –Suttor River at St Anns
id id 710‐810‐1030
(s1) id
90‐150‐225 (s1)
<5 (s2)
85–110 (s2)
120‐210‐380 (s1)
40‐70‐145 (s1)
6.5–8.5 (s2)
125‐155‐205 (s1)
2‐3‐5 (s1)
Department of Science Information Technology and Innovation
56
Water area/type (Source: s1–s3)
Management intent /Level of
protection
Table 6: SUTTOR RIVER SUB‐BASIN ‐ fresh waters: Water quality guidelines1– 2
Note: WQGs for indicators are shown as a range of 20th, 50th and 80th percentiles to be achieved (e.g. 3–4–5), lower and upper limits (e.g. pH: 7.2–8.2), or as a single value (e.g. <15). For single value guidelines, medians of test data are compared against the draft guideline (refer text for more details). HEV: high ecological value; SD: slightly disturbed; MD: moderately disturbed – refer accompanying maps for details Sources: S1: Local datasets (e.g. DSITI, key stakeholder); S2: QWQG guidelines and /or data; S3: ANZECC (2000) AWQG
Ammonium N (μg/L)
Oxidised N (μg/L)
Total N (μg/L)
Filterable Reactive P (μg/L)
Total P (μg/L)
Chlorophyll‐a (μg/L)
Dissolved Oxygen
(% saturation)
Turbidity (NTU)
Suspended Solids (mg/L)
pH
Conductivity (µS/cm)
Sulfate (mg/L as SO4
2‐)
EVENT FLOW >55 m3/s (cumecs) at gauge 120303A –Suttor River at St Anns
id id id id id id id id id id id id
Upper Suttor sub‐catchment
waters
(s1, s2)
MD
BASEFLOW <1.6 m3/s (cumecs) at gauge 120304A – Suttor River at Eaglefield
6‐15‐40 (s1)
6‐30‐180 (s1)
520‐910‐1180(s1)
<5‐20‐25 (s1)
65‐105‐210 (s1)
<5 (s2)
85–110 (s2)
25‐60‐215 (s1)
30‐60‐150 (s1)
6.5–8.5 (s2)
110‐185‐340 (s1)
2‐3‐5 (s1)
EVENT FLOW >1.6 m3/s (cumecs) at gauge 120304A – Suttor River at Eaglefield
9‐15‐20 (s1)
5‐20‐55 (s1)
700‐870‐1200(s1)
20‐35‐45 (s1)
120‐160‐260 (s1)
id id 180‐280‐430
(s1) 60‐110‐215
(s1) 6.5–8.5 (s2)
105‐130‐180 (s1)
id
Lakes, reservoirs MD Note: there is insufficient information available to establish local guidelines for lakes/reservoirs. Refer to QWQG for details on how to establish a minimum water quality data set for deriving local 20th, 50th and 80th percentiles. The following are sourced from the QWQG (Central region) regional guidelines).
10 (s2)
10 (s2)
350 (s2)
5 (s2)
10 (s2)
5 (s2)
90–110 (s2)
1–20 (s2)
nd (s2)
6.5–8.0 (s2)
Refer QWQG Appendix G
id

Draft Environmental Values and Water Quality Guidelines for Burdekin River Basin fresh and estuarine waters
57
Water area/type (Source: s1–s3)
Management intent /Level of
protection
Table 6: SUTTOR RIVER SUB‐BASIN ‐ fresh waters: Water quality guidelines1– 2
Note: WQGs for indicators are shown as a range of 20th, 50th and 80th percentiles to be achieved (e.g. 3–4–5), lower and upper limits (e.g. pH: 7.2–8.2), or as a single value (e.g. <15). For single value guidelines, medians of test data are compared against the draft guideline (refer text for more details). HEV: high ecological value; SD: slightly disturbed; MD: moderately disturbed – refer accompanying maps for details Sources: S1: Local datasets (e.g. DSITI, key stakeholder); S2: QWQG guidelines and /or data; S3: ANZECC (2000) AWQG
Ammonium N (μg/L)
Oxidised N (μg/L)
Total N (μg/L)
Filterable Reactive P (μg/L)
Total P (μg/L)
Chlorophyll‐a (μg/L)
Dissolved Oxygen
(% saturation)
Turbidity (NTU)
Suspended Solids (mg/L)
pH
Conductivity (µS/cm)
Sulfate (mg/L as SO4
2‐)
Fresh waters: Toxicants (s3)
HEV and SD
WQGs for all toxicants and pesticides in these waters as per AWQG, to protect species at the HEV level of protection.
Toxicants in water: refer to AWQG volume 1 section 3.4—‘water quality guidelines for toxicants’ (including tables 3.4.1, 3.4.2, and Figure 3.4.1), and AWQG volume 2 (section 8). AWQG values for the HEV level of protection typically correspond to protection of 99% of species.
Toxicants in sediments: refer to AWQG volume 1 section 3.5—‘sediment quality guidelines’ (including Table 3.5.1, Figure 3.5.1), and AWQG volume 2 (section 8)
Fresh waters: Toxicants (s3)
MD
WQGs for all toxicants and pesticides in these waters as per AWQG, to protect species at the MD level of protection (except where noted).
Toxicants in water: refer to AWQG volume 1 section 3.4—‘water quality guidelines for toxicants’ (including tables 3.4.1, 3.4.2, and Figure 3.4.1), and AWQG volume 2 (section 8). AWQG values for the MD level of protection typically correspond to protection of 95% species (in a small number of cases where bioaccumulation may occur, the AWQG recommends 99% species protection level).
Toxicants in sediments: refer to AWQG volume 1 section 3.5—‘sediment quality guidelines’ (including Table 3.5.1, Figure 3.5.1), and AWQG volume 2 (section 8)
TEMPERATURE
Fresh waters All Temperature varies daily and seasonally, is depth‐dependent and highly site specific. Refer to QWQG for details on how to establish a range (20th – 80th %iles) of temperature. From an ecological effects perspective, daily maximum temperature and daily variation in temperature are key indicators, and seasonal variations also need to be identified.
STATE PLANNING POLICY, RIPARIAN, WETLANDS, GROUNDWATERS State Planning
Policy all Refer to section 5.3
Riparian all Refer to section 5.3
Wetlands all
Refer to section 5.3
Note: there is insufficient information available to establish local guidelines for wetlands. Refer to QWQG for details on how to establish a minimum water quality data set for deriving local 20th, 50th and 80th percentiles. In the absence of local information, the AWQG provides default values for wetlands.
Groundwaters (s2)
HEV Groundwaters to be addressed in detail in a separate report. The AWQG recommends that the highest level of protection should be provided to underground aquatic ecosystems, given their high conservation value. Where groundwaters are in good condition the management intent is to maintain existing water quality. Where groundwaters interact with surface waters, groundwater quality should not compromise identified EVs and WQGs for those waters.
Abbreviations: id: insufficient data; na: not applicable
Notes: refer notes after Table 1

Department of Science Information Technology and Innovation
58
5.3 Planning and management links
5.3.1 Riparian Vegetation
The clearing of native vegetation in Queensland is regulated by the Vegetation Management Act 1999, the Sustainable Planning Act 2009 and associated policies and codes. This includes the regulation of clearing in water and drainage lines.
For vegetation management relating to waterways, reference should be made to:
State Development Assessment Provisions (SDAP) Module 8: Native vegetation clearing. This module includes performance requirements relating to clearing of native vegetation and a table relating to watercourse buffer areas and stream order. To review the SDAP Modules, refer to the Department of Infrastructure Local Government and Planning website http://www.dilgp.qld.gov.au/planning/development-assessment/state-development-assessment-provisions.html .
SDAP Module 11: Wetland protection area relevant self-assessable codes under the Vegetation Management Act 1999. These codes
are activity based, some applying to different regions, and include performance requirements relating to watercourses and wetlands, aimed at maintaining water quality, bank stability, aquatic and terrestrial habitat. Codes include vegetation clearing controls that vary according to stream order. To review the latest applicable self-assessable code (and other explanatory information), view the Department of Natural Resources and Mines website. https://www.dnrm.qld.gov.au/
To review the current vegetation management laws refer to the Queensland Government website or Department of Natural Resources and Mines website.
Local Government Planning schemes under the Sustainable Planning Act may also specify riparian buffers (for example under catchment protection or waterway codes). Refer to the Department of Infrastructure, Local Government and Planning website and relevant local government websites for further information about planning schemes.
5.3.2 Wetlands
The Environmental Protection Regulation section 81A defines environmental values for wetlands.
The State assesses impacts from earth works that may have impacts on freshwater wetlands of High Ecological Significance in Great Barrier Reef Catchments against State Development Assessment Provisions (SDAP) Module 11: Wetland protection area.
This module includes performance requirements to ensure:
adverse effects on hydrology, water quality and ecological processes of a wetland are avoided or minimised
any significant adverse impacts on matters of state environmental significance and on riparian areas or wildlife corridors in strategic environmental areas are avoided.
5.3.3 Marine plants (including mangroves)
Marine plants grow on or adjacent to tidal lands. They include mangroves, seagrass, saltcouch, algae, samphire (succulent) vegetation and adjacent plants, such as melaleuca (paper barks) and casuarina (coastal she-oaks).
Marine plants support local fish populations, fish catches and general aquatic health, and for this reason they are protected under the Fisheries Act 1994. The destruction, damage or disturbance of marine plants without prior approval from Fisheries Queensland is prohibited.

Draft Environmental Values and Water Quality Guidelines for Burdekin River Basin fresh and estuarine waters
59
Activities that disturb fish habitats may require fisheries development approval under the Sustainable Planning Act 2009 (SPA). A resource allocation authority (a form of resource entitlement) may also be required under the Fisheries Act 1994. The Department of Agriculture and Fisheries website contains further information on approvals, self-assessable codes and other aspects relating to marine plants. Refer to link below for more details. https://www.daf.qld.gov.au/fisheries/habitats/fisheries-development/approvals-required
5.3.4 State Planning Policy (state interest – water quality)
Note: As part of Queensland’s planning reform process, the new Planning Act 2016 is planned to commence in July 2017. The State Planning Policy (SPP) and State Development Assessment Procedures (SDAP) modules are currently being updated. Please refer to the DILGP website for the most current information http://dilgp.qld.gov.au/planning-reform.html
The State Planning Policy (SPP) defines the Queensland Government’s policies about matters of state interest in land use planning and development (a state interest is defined under the Sustainable Planning Act 2009).
Water quality is a state interest. The SPP (state interest – water quality) seeks to ensure that ‘the environmental values and quality of Queensland waters are protected and enhanced’. It includes provisions relating to receiving waters, acid sulfate soils and water supply buffer areas.
The provisions of the SPP are operationalised through their ‘integration’ into local government planning schemes. Planning schemes adopt measures prescribed in the SPP including the SPP code – water quality (Appendix 3 of the SPP) or alternative measures considered more locally appropriate. The purpose of the code is to ‘ensure development is planned, designed, constructed and operated to manage stormwater and wastewater in ways that support the protection of environmental values identified in the Environmental Protection (Water) Policy 2009’.
The code contains detailed performance objectives for planning schemes, development and land use activities to implement the code’s purpose. These include stormwater management design objectives for the construction phase (Table A of the code) and the post-construction phase of development (Table B). The stormwater quality design objectives for the post-construction phase include minimum percentage pollution load reductions (compared with unmitigated development) for key pollutants by climatic region.
The SPP (state interest – water quality) is supported by the State Planning Policy—state interest guideline – water quality. The SPP (including SPP code) and supporting guideline are available from the Department of Infrastructure Local Government and Planning website http://www.dilgp.qld.gov.au/planning/state-planning-instruments/state-planning-policy.html
The State Planning Policy (SPP) defines the Queensland Government’s policies about matters of state interest in land use planning and development (a state interest is defined under the Sustainable Planning Act 2009).
Water quality is a state interest. The SPP (state interest – water quality) seeks to ensure that ‘the environmental values and quality of Queensland waters are protected and enhanced’. It includes provisions relating to planning schemes, acid sulfate soils and water supply buffer areas.
The provisions of the SPP are operationalised through the SPP code – water quality (Appendix 3 of the SPP). The purpose of the code is to ‘ensure development is planned, designed, constructed and operated to manage stormwater and wastewater in ways that support the protection of environmental values identified in the Environmental Protection (Water) Policy 2009’. The code contains detailed performance objectives for planning schemes, development and land use

Department of Science Information Technology and Innovation
60
activities to implement the code’s purpose. These include stormwater management design objectives by climatic region (construction and post-construction phases).
The SPP (state interest – water quality) is supported by the State Planning Policy—state interest guideline – water quality. The SPP (including SPP code) and supporting guideline are available from the Department of Infrastructure Local Government and Planning website http://www.dilgp.qld.gov.au/planning/state-planning-instruments/state-planning-policy.html .

Draft Environmental Values and Water Quality Guidelines for Burdekin River Basin fresh and estuarine waters
61
6 References
Australian and New Zealand Environment and Conservation Council; Agriculture and Resources Management Council of Australia and New Zealand (2000) An Introduction to the Australian and New Zealand Guidelines for Fresh and Marine Water Quality. Paper 4a of the National Water Quality Management Strategy (AWQG).
Australian and New Zealand Environment and Conservation Council; Agriculture and Resources Management Council of Australia and New Zealand (2000) Australian and New Zealand Guidelines for Fresh and Marine Water Quality (AWQG). Paper 4 of the National Water Quality Management Strategy.
Chartrand, K., Sinutok, S., Szabo, M., Norman, L., Rasheed, M.A. and Ralph, P.J. (2014), ‘Final Report: Deepwater Seagrass Dynamics - Laboratory-Based Assessments of Light and Temperature Thresholds for Halophila spp.’, Centre for Tropical Water & Aquatic Ecosystem Research (TropWATER) Publication, James Cook University, Cairns, 26 pp.
Chartrand, K.M., Ralph, P.J., Petrou, K. and Rasheed, M.A. (2012) Development of a Light-Based Seagrass Management Approach for the Gladstone Western Basin Dredging Program. DAFF Publication. Fisheries Queensland, Cairns 126 pp.
Collier, C.J., Chartrand, K., Honchin, C., Fletcher, A. Rasheed, M. (2016). Light thresholds for seagrasses of the GBR: a synthesis and guiding document. Including knowledge gaps and future priorities. Report to the National Environmental Science Programme. Reef and Rainforest Research Centre Limited, Cairns 41pp.
Department of Environment and Heritage Protection (2009) Queensland Water Quality Guidelines, Version 3, ISBN 978-0-9806986-0-2. Re-published July 2013.
Dight, I. (2009) Burdekin water quality improvement plan 2009. ISBN 978-1-921584-11-4
Environment Australia (2001) A Directory of Important Wetlands in Australia, Third Edition, Environment Australia, Canberra. http://www.environment.gov.au/water/wetlands
GBRMPA (2010) Water quality guidelines for the Great Barrier Reef Marine Park. Available from www.gbrmpa.gov.au
Lankester, A., Dight, I., Brodie, J., Bainbridge, Z. and Lewis, S. (2007) Environmental Values and Water Quality Objectives for the Estuarine and Coastal areas of the Lower Burdekin Region. Australian Centre for Tropical Freshwater Research James Cook University) and Burdekin Dry Tropics NRM, July.
McKenna, S.A., Chartrand, K.M., Jarvis, J.C., Carter, A.B., Davies, J.N. and Rasheed, M.A. (2015) Initial light thresholds for modelling impacts to seagrass from the Abbot Point growth gateway project. James Cook University, Centre for Tropical Water & Aquatic Ecosystem Research, Report No 15/23.
McKenna, S.A. and Rasheed, M.A. (2014) ‘Port of Abbot Point Long-Term Seagrass Monitoring: Annual Report 2012-2013’, JCU Publication, Centre for Tropical Water & Aquatic Ecosystem Research, Cairns, 45 pp.
McKenna, S.A. and Rasheed, M.A. (2013) ‘Port of Abbot Point Long-Term Seagrass Monitoring: Annual Report 2011-2012’, JCU Publication, Centre for Tropical Water & Aquatic Ecosystem Research, Cairns.

Department of Science Information Technology and Innovation
62
McKenna, S.A. and Rasheed, M.A. (2011) Port of Abbot Point Long-Term Seagrass Monitoring: Update Report 2008-2011. DEEDI Publication. Fisheries Queensland: Cairns.
McKenna, S.A., Rasheed, M.A., Unsworth, R.K.F. and Chartrand, K.M. (2008) Port of Abbot Point seagrass baseline surveys – wet & dry season 2008. DPI&F Publication PR08-4140 (DPI&F, Cairns), 51pp
NQ Dry Tropics 2016, Burdekin Region Water Quality Improvement Plan 2016 Catchment Atlas, NQ Dry Tropics, Townsville https://drive.google.com/file/d/0B2eYGb5_l-adSGplUWFncmpLN2c/view NQ Dry Tropics 2016, Burdekin Region Water Quality Improvement Plan 2016, NQ Dry Tropics, Townsville. http://www.nqdrytropics.com.au/wqip2016/
NQ Dry Tropics NRM (2013) Community Draft Environmental Values for the Waters of the Burdekin Dry Tropics Region. (Ed. Rodd Kerr).
Rasheed, M.A., McKenna, S.A., Carter, A.B. and Coles, R.G. (2014) Contrasting recovery of shallow and deep water seagrass communities following climate associated losses in tropical north Queensland, Australia. Marine Pollution Bulletin 83: 491–499.
Rasheed, M.A., Thomas, R. and McKenna, S.A. (2005) Port of Abbot Point seagrass, algae and benthic macro-invertebrate community survey March 2005. DPI&F Information Series QI05044. DPI&F: Cairns.
WetlandInfo: http://wetlandinfo.ehp.qld.gov.au/wetlands/
York, P. H., Carter, A.B., Chartrand, K., Sankey, T., Wells, L. and Rasheed, M.A. (2015) Dynamics of a deep-water seagrass population on the Great Barrier Reef: annual occurrence and response to a major dredging program. Scientific Reports 5: 13167.

Draft Environmental Values and Water Quality Guidelines for Burdekin River Basin fresh and estuarine waters
63
7 Appendix 1 Flow condition assessment and water quality data sources
7.1 Flow condition separation and exceedance probability curves
Certain indicators, including electrical conductivity and suspended solids, can vary considerably with flow regime (Jones & Moss 2011). Therefore separate guidelines are ideal to account for these differences between flow conditions. Two flow conditions are defined for guideline development, these are ‘low flow’, including zero flow conditions, and ‘high flow’, which is defined as a daily mean flow over the 90th (or 80th or 95th depending on catchment) percentile of historical records.
Flow records for gauge stations in the Burdekin Basin were accessed from the Water Monitoring Information Portal (https://water-monitoring.information.qld.gov.au/host.htm). Daily Mean Flow was downloaded for each gauge where available. For each gauge, flow condition was assessed as ‘low flow’ or ‘high flow’ based on the 90th percentile of daily mean flows, representing the 10% of days with the highest recorded flows.
For the more downstream and coastal sub-basins of the Lower Burdekin, ‘high flows’ were defined as being greater than the 80th percentile of daily mean flow. Having a larger catchment area, and nearer the high rainfall coastal zone, these catchments have a higher chance of receiving high flows. This is reflected in the flow exceedance probability curves, which show inflection points closer to the 80th percentile than the 90th
percentile (refer to Figure 14 for an example). Also, some very small catchment were assigned the 95th percentile of daily mean flow to define ‘high flow’. Details on gauge stations location, sub-basin and sub-catchment assigned, and flow condition is provided below in Table 7.

Department of Science Information Technology and Innovation
64
A
B
Figure 14 Flow exceedance probability curves for A) Burdekin River at Blue Range (120107B) in the Upper Burdekin sub-basin showing 90th percentile flow (equal to 10% exceedance probability) for high flows at 43 cumecs and (B) Burdekin River at Clare (120006B) in the Lower Burdekin sub-basin showing the 80th percentile flow (equal to 20% exceedance probability) for high flows at 417 cumecs.

Draft Environmental Values and Water Quality Guidelines for Burdekin River Basin fresh and estuarine waters
65
Table 7 Burdekin Basin gauge stations and Flow Condition for high and low flow split. Data available from the Water Monitoring Information Portal (https://water-monitoring.information.qld.gov.au/).
Gauge Number
Gauge Name
Open/ Closed
Sub-basin Sub-
catchment Latitude/
Longitude
Flow Condition for High/Low Flows Split
Daily Mean
Discharge Percentile
Daily Mean
Discharge (cumecs)
120002C Burdekin River at Sellheim
Open Upper
Burdekin
Burdekin River
Above Dam
20°00'22.6"S/ 146°26'20.6"E
90 121
120006B Burdekin River at Clare
Open Lower
Burdekin Burdekin
Below Dam 19°45'30.8"S/ 147°14'37.0"E
80 109
120015A Burdekin River at
Hydro Site Open
Lower Burdekin
Burdekin River
Below Dam
20°37'37.2"S/ 147°09'55.0"E
80 73
120102A Keelbottom
Creek at Keelbottom
Open Upper
Burdekin Keelbottom
Creek 19°22'17.2"S/ 146°21'40.3"E
90 3.7
120106B
Basalt River at
Bluff Downs
Open Upper
Burdekin Basalt River
19°40'52.7"S/ 145°32'25.1"E
90 1.6
120107B Burdekin River at
Blue Range Open
Upper Burdekin
Burdekin Blue Range
19°09'53.0"S/ 145°25'18.6"E
90 43
120110A
Burdekin River at Mount
Fullstop
Open Upper
Burdekin Burdekin
Blue Range19°12'26.4"S/ 145°29'42.1"E
90 67
120112A Star River at Laroona
Open Upper
Burdekin Star River
19°22'40.0"S/ 146°02'54.5"E
90 11
120120A
Running River at Mount
Bradley
Open Upper
Burdekin Running
River 19°07'52.4"S/ 145°54'35.3"E
90 7.9
120122A Burdekin River at
Gainsford Open
Upper Burdekin
Burdekin Blue Range
19°48'43.2"S/ 146°01'27.7"E
90 130

Department of Science Information Technology and Innovation
66
Gauge Number
Gauge Name
Open/ Closed
Sub-basin Sub-
catchment Latitude/
Longitude
Flow Condition for High/Low Flows Split
Daily Mean
Discharge Percentile
Daily Mean
Discharge (cumecs)
120123A
Burdekin River at Valley of Lagoons
Open Upper
Burdekin
Upper Burdekin
River
18°39'51.2"S/ 145°05'32.9"E
90 8.3
120205A Bowen River at Myuna
Open Bowen Broken Bogie
Bowen River
20°34'55.5"S/ 147°35'53.2"E
90 33
120207A Broken River at Urannah
Open Bowen Broken Bogie
Broken River
20°55'03.3"S/ 148°19'28.9"E
90 17
120209B
Bowen River at Jacks Creek
Open Bowen Broken Bogie
Bowen River
20°45'08.8"S/ 147°52'54.7"E
90 33
120216A Broken
River at Old Racecourse
Open Bowen Broken Bogie
Broken River
21°11'39.3"S/ 148°26'52.2"E
90 2.4
120301B
Belyando River at Gregory
Development Road
Open Belyando Carmichael
River 21°31'59.2"S/ 146°51'34.7"E
90 36
120302B Cape River at Taemas
Open Cape
Campaspe Lower
Cape River 20°59'58.4"S/ 146°25'37.6"E
90 14
120303A Suttor River at St Anns
Open Suttor Lower Suttor
21°13'44.6"S/ 146°54'48.2"E
90 55
120304A Suttor River
at Eaglefield
Open Suttor Upper Suttor
21°27'01.3"S/ 147°42'51.5"E
90 1.6
120305A
Native Companion
Creek at Violet Grove
Open Belyando Native
Companion Creek
23°34'32.5"S/ 146°40'27.7"E
90 0.8
120307A Cape River at Pentland
Open Cape
Campaspe Cape River
20°28'34.1"S/ 145°28'30.0"E
90 1.7

Draft Environmental Values and Water Quality Guidelines for Burdekin River Basin fresh and estuarine waters
67
Gauge Number
Gauge Name
Open/ Closed
Sub-basin Sub-
catchment Latitude/
Longitude
Flow Condition for High/Low Flows Split
Daily Mean
Discharge Percentile
Daily Mean
Discharge (cumecs)
120309A Mistake Creek at Twin Hills
Open Belyando Mistake Creek
21°57'23.5"S/ 146°56'31.9"E
90 3.8
120310A
Suttor River at Bowen
Development Road
Open Suttor Upper Suttor
21°32'14.8"S/ 147°02'32.5"E
90 13
120004A
Burdekin River at Burdekin Falls Dam
Closed Lower
Burdekin Burdekin
Below Dam 20°38'27.5"S/ 147°08'28.5"E
80 113
120005B Bogie River
at Strathbogie
Closed Bowen Broken Bogie
Bogie 20°09'11.4"S/ 147°32'34.0"E
90 2.7
120008B Burdekin River at Dalbeg
Closed Lower
Burdekin Burdekin
Below Dam 20°17'50.6"S/ 147°18'06.7"E
80 103
120014A
Broughton River at
Oak Meadows
Closed Upper
Burdekin
Burdekin River
Above Dam
20°10'37.4"S/ 146°19'18.0"E
95 0.8
120016A Burdekin Falls Dam
Closed Lower
Burdekin Burdekin Falls Dam
20°38'52.0"S/ 147°08'13.0"E
80 62
120108C Fletcher Creek at
Fletchervale Closed
Upper Burdekin
Lolworth Creek
19°48'18.5"S/ 145°51'23.0"E
90 4.3
120111A
Burdekin River at Lucky Downs
Closed Upper
Burdekin
Upper Burdekin
River
18°52'38.5"S/ 144°58'28.0"E
90 25
120113A Clarke River at
Wandovale Closed
Upper Burdekin
Clarke River
19°35'04.5"S/ 144°49'24.1"E
90 9.5
120114A
Douglas Creek at Kangaroo
Hills
Closed Upper
Burdekin Douglas Creek
18°55'54.4"S/ 145°40'01.0"E
90 5.6

Department of Science Information Technology and Innovation
68
Gauge Number
Gauge Name
Open/ Closed
Sub-basin Sub-
catchment Latitude/
Longitude
Flow Condition for High/Low Flows Split
Daily Mean
Discharge Percentile
Daily Mean
Discharge (cumecs)
120115A Gray Creek at Carters
Mill Closed
Upper Burdekin
Gray Creek 19°01'18.4"S/ 144°58'47.0"E
90 3.3
120116A Maryvale Creek at Maryvale
Closed Upper
Burdekin Clarke River
19°35'12.4"S/ 145°13'11.0"E
95 1
120117A Wyandotte Creek at
Wyandotte Closed
Upper Burdekin
Dry River 18°44'44.4"S/ 144°50'00.0"E
90 0.6
120118A
Burdekin River at
Lake Lucy Station
Closed Upper
Burdekin
Upper Burdekin
River
18°30'02.4"S/ 145°14'45.0"E
90 10.2
120119A
Fanning River at Fanning
River
Closed Upper
Burdekin Fanning
River 19°42'53.4"S/ 146°26'21.0"E
90 1.9
120121A Burdekin River at
Lake Lucy Closed
Upper Burdekin
Upper Burdekin
River
18°30'50.0"S/ 145°11'06.3"E
90 12.8
120204B Broken River at Crediton
Closed Bowen Broken Bogie
Broken River
21°10'08.0"S/ 148°30'18.0"E
90 1.7
120206A
Pelican Creek at Mount Jimmy
Closed Bowen Broken Bogie
Pelican Creek
20°36'01.4"S/ 147°41'23.0"E
90 0.9
120210A Bowen River at Exmoor
Closed Bowen Broken Bogie
Little Bowen River
20°59'12.0"S/ 148°08'07.0"E
90 2.5
120211A
Broken River at Eungella
Dam
Closed Bowen Broken Bogie
Broken River
21°08'09.2"S/ 148°23'14.6"E
90 2.1

Draft Environmental Values and Water Quality Guidelines for Burdekin River Basin fresh and estuarine waters
69
Gauge Number
Gauge Name
Open/ Closed
Sub-basin Sub-
catchment Latitude/
Longitude
Flow Condition for High/Low Flows Split
Daily Mean
Discharge Percentile
Daily Mean
Discharge (cumecs)
120212A Emu Creek
at The Saddle
Closed Bowen Broken Bogie
Broken River
20°48'03.0"S/ 148°09'49.0"E
90 1.2
120213A
Grant Creek at
Grass Humpy
Closed Bowen Broken Bogie
Broken River
20°49'12.0"S/ 148°18'32.0"E
90 2.3
120214A
Broken River at Mount
Sugarloaf
Closed Bowen Broken Bogie
Broken River
20°49'59.5"S/ 148°08'17.2"E
90 21
120215A
Broken River at Eugella
Dam T/M
Closed Bowen Broken Bogie
Broken River
21°07'52.0"S/ 148°23'18.6"E
90 4.4
120217A Three Mile Creek at Scottville
Closed Bowen Broken Bogie
Pelican Creek
20°34'41.4"S/ 147°47'09.9"E
95 0.2
120218A Kangaroo Creek at Byerwen
Closed Bowen Broken Bogie
Rosella Creek
21°06'46.8"S/ 147°55'29.8"E
95 0.8
120219A
Bowen River at Red Hill Creek
Closed Bowen Broken Bogie
Bowen River
20°31'32.4"S/ 147°32'59.0"E
90 22
120220A
Pelican Creek at Kerale Closed
Closed Bowen Broken Bogie
Pelican Creek
20°35'40.4"S/ 147°42'15.9"E
95 1.1
120299A
Bowen River at Pump Station
Closed Bowen Broken Bogie
Bowen River
20°44'25.4"S/ 147°56'56.9"E
90 26
120306A Mistake Creek at Charlton
Closed Belyando Mistake Creek
22°30'19.4"S/ 147°05'56.0"E
90 1.2
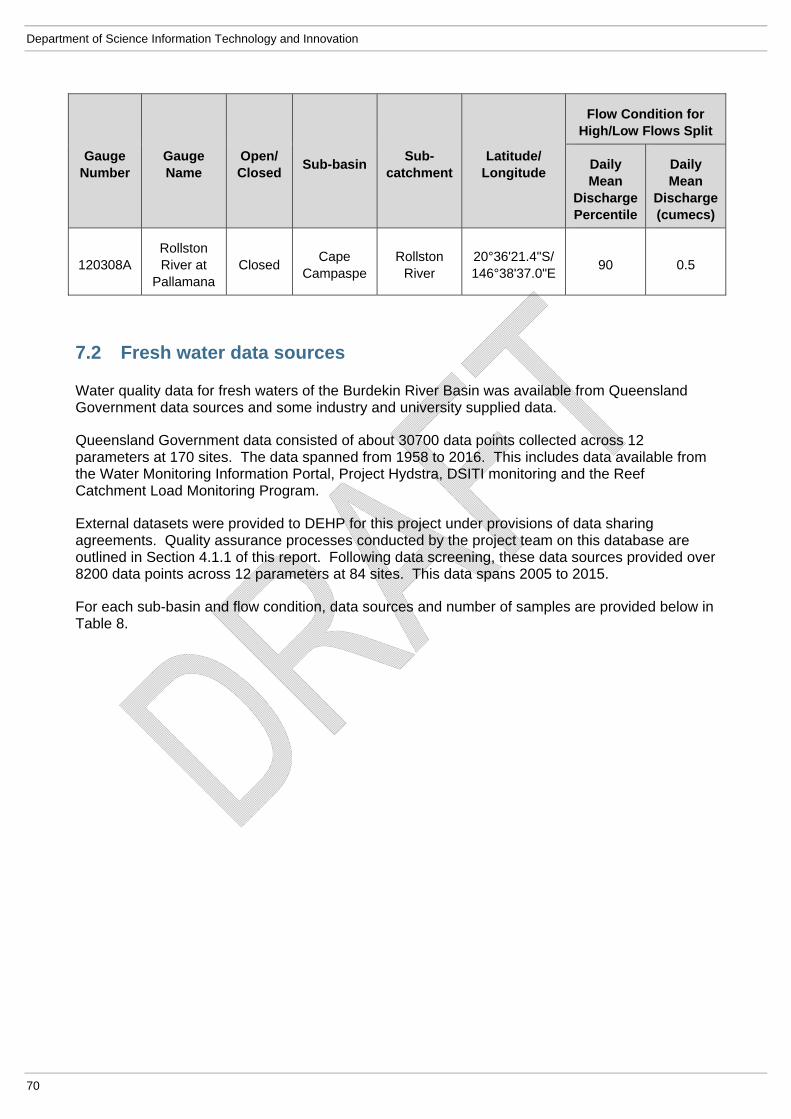
Department of Science Information Technology and Innovation
70
Gauge Number
Gauge Name
Open/ Closed
Sub-basin Sub-
catchment Latitude/
Longitude
Flow Condition for High/Low Flows Split
Daily Mean
Discharge Percentile
Daily Mean
Discharge (cumecs)
120308A Rollston River at
Pallamana Closed
Cape Campaspe
Rollston River
20°36'21.4"S/ 146°38'37.0"E
90 0.5
7.2 Fresh water data sources
Water quality data for fresh waters of the Burdekin River Basin was available from Queensland Government data sources and some industry and university supplied data.
Queensland Government data consisted of about 30700 data points collected across 12 parameters at 170 sites. The data spanned from 1958 to 2016. This includes data available from the Water Monitoring Information Portal, Project Hydstra, DSITI monitoring and the Reef Catchment Load Monitoring Program.
External datasets were provided to DEHP for this project under provisions of data sharing agreements. Quality assurance processes conducted by the project team on this database are outlined in Section 4.1.1 of this report. Following data screening, these data sources provided over 8200 data points across 12 parameters at 84 sites. This data spans 2005 to 2015.
For each sub-basin and flow condition, data sources and number of samples are provided below in Table 8.

Draft Environmental Values and Water Quality Guidelines for Burdekin River Basin fresh and estuarine waters
71
Table 8 Fresh water data sources by sub-basin and flow condition, used for derivation of draft water quality guidelines
Sub‐basins (refer Figures
1, 6‐11)
Flow Condition (see Table 7 for details)
Indicators Sources Number of samples
Dates (years) of samples
1. Belyando fresh waters
Low Flow
Ammonia N Oxidised N Total N FRP Total P Turbidity Suspended solidsChl‐a Conductivity DO pH Sulfate
AMCIAdani Desert Channels JCU Project Hydstra Hydstra
N=25‐2038 depending on parameter, 1171 different sample dates.
1970‐2015
High Flow
Ammonia N Oxidised N Total N FRP Total P Turbidity Suspended solidsConductivity DO pH Sulfate
AMCIAdani Desert Channels JCU Hydstra Project Hydstra
N=19‐483 depending on parameter, 364 different sample dates.
1970‐2015
2. Bowen‐Broken‐Bogie fresh waters
Low Flow
Ammonia N Oxidised N Total N FRP Total P Turbidity Suspended solidsChl‐a Conductivity DO pH Sulfate
JCUHydstra Project Hydstra
N=39‐1045 depending on parameter, 759 different sample dates.
1961‐2015
High Flow
Ammonia N Oxidised N Total N FRP Total P Turbidity Suspended solidsConductivity pH Sulfate
JCUHydstra Project Hydstra
N=28‐113 depending on parameter, 127 different sample dates.
1972‐2014

Department of Science Information Technology and Innovation
72
Sub‐basins (refer Figures
1, 6‐11)
Flow Condition (see Table 7 for details)
Indicators Sources Number of samples
Dates (years) of samples
3. Upper Burdekin fresh waters
Low Flow
Ammonia N Oxidised N Total N FRP Total P Turbidity Suspended solidsConductivity pH Sulfate
Desert Channels Hydstra Project Hydstra JCU DSITI
N=123‐1080 depending on parameter, 903 different sample dates.
1967‐2015
High Flow
Ammonia N Oxidised N Total N FRP Total P Turbidity Suspended solidsConductivity pH Sulfate
HydstraProject Hydstra JCU DSITI
N=37‐230 depending on parameter, 187 different sample dates.
1971‐2014
4. Lower Burdekin fresh waters
Low Flow
Ammonia N Oxidised N Total N FRP Total P Turbidity Suspended solidsChl‐a Conductivity DO pH Sulfate
HydstraProject Hydstra JCU DSITI
N=90‐1059 depending on parameter, 1398 different sample dates.
1958‐2015
High Flow
Ammonia N Oxidised N Total N FRP Total P Turbidity Suspended solidsChl‐a Conductivity DO pH Sulfate
HydstraProject Hydstra JCU DSITI
N=24‐499 depending on parameter, 607 different sample dates.
1961‐2014

Draft Environmental Values and Water Quality Guidelines for Burdekin River Basin fresh and estuarine waters
73
Sub‐basins (refer Figures
1, 6‐11)
Flow Condition (see Table 7 for details)
Indicators Sources Number of samples
Dates (years) of samples
5. Cape‐Campaspe fresh waters
Low Flow
Ammonia N Oxidised N Total N FRP Total P Turbidity Suspended solidsConductivity pH Sulfate
Desert Channels Hydstra Project Hydstra JCU
N=29‐138 depending on parameter, 157 different sample dates.
1968‐2015
High Flow
Ammonia N Oxidised N Total N FRP Total P Turbidity Suspended solidsConductivity pH Sulfate
HydstraProject Hydstra JCU
N=24‐176 depending on parameter, 179 different sample dates
1970‐2012
6. Suttor fresh waters
Low Flow
Ammonia N Oxidised N Total N FRP Total P Turbidity Suspended solidsConductivity pH Sulfate
HydstraProject Hydstra JCU
N=40‐164 depending on parameter, 178 different sample dates
1968‐2015
High Flow
Ammonia N Oxidised N Total N FRP Total P Turbidity Suspended solidsConductivity pH Sulfate
HydstraProject Hydstra JCU
N=15‐79depending on parameter, 86 different sample dates.
1969‐2013

Department of Science Information Technology and Innovation
74
8 Appendix 2 Human use EV water quality guidelines
This section outlines WQGs to protect human use EVs, which comprise EVs other than the aquatic ecosystem EV, such as recreation, stock watering, aquaculture and crop irrigation. Where a human use EV has been identified, the following tables can be used to identify the WQGs to support that EV. Where more than one EV applies to a given water (for example aquatic ecosystem and recreational use), the adoption of the most stringent WQG for each water quality indicator will then protect all identified EVs.
WQGs in this section are, unless otherwise specified, based on relevant national water quality guidelines including AWQG and the ADWG. Reference to those national guidelines or codes is necessary to obtain comprehensive listings of all indicators and corresponding WQGs. Table 9 outlines human use EVs, applicable water types, and a selection of more commonly used WQGs to support those EVs. Tables 10 to 18 provide further guidelines to protect particular human use EVs (based on national guidelines or other more local studies).
Table 9 Human use EVs – summary and guideline sources
Environmental value
Water type/area
Water quality guideline to protect EV (refer to specified codes and guidelines for full details)
Suitability for drinking water supply
All fresh waters including groundwaters
Quality of raw water (prior to treatment) to meet requirements of water supply operators. Local WQGs for drinking water supply are provided in Table 10.
Note: For water quality after treatment or at point of use refer to legislation and guidelines, including:
Public Health Act 2005 and Regulation
Water Supply (Safety and Reliability) Act 2008, including any approved drinking water quality management plan under the Act
Water Fluoridation Act 2008 and Regulation
Australian Drinking Water Guidelines (ADWG) 2011, updated 2016.
Protection of the human consumer for oystering
Estuarine and coastal waters
As per AWQG and Australia New Zealand Food Standards Code2, Food Standards Australia New Zealand, as amended.
Protection of the human consumer
Fresh waters, estuarine and coastal waters
As per AWQG and Australia New Zealand Food Standards Code, Food Standards Australia New Zealand, as amended.
Protection of cultural and spiritual values
Fresh waters (including groundwaters), estuarine and coastal waters
Protect or restore indigenous and non-indigenous cultural heritage consistent with relevant policies and plans.
Suitability for industrial use
Fresh waters, estuarine and coastal waters
None provided. Water quality requirements for industry vary within and between industries. The AWQG do not provide guidelines to protect industries, and indicate that industrial water quality requirements need to be considered on a case-by-case basis. This EV is usually protected by other values, such as the aquatic ecosystem EV.
2 Information on the Australia New Zealand Food Standards Code is available on the Food Standards Australia and New Zealand website.

Draft Environmental Values and Water Quality Guidelines for Burdekin River Basin fresh and estuarine waters
75
Environmental value
Water type/area
Water quality guideline to protect EV (refer to specified codes and guidelines for full details)
Suitability for aquaculture
Fresh waters, estuarine and coastal waters
As per:
Tables 11–13
AWQG and Australia New Zealand Food Standards Code, Food Standards Australia New Zealand, 2007 and updates.
Suitability for irrigation
All fresh waters including groundwaters
AWQG values for pathogens and metals are provided in Tables 14 and 15. For other indicators, such as salinity, sodicity and herbicides, see AWQG.
Suitability for stock watering
All fresh waters including groundwaters
As per AWQG, including median faecal coliforms <100 organisms per 100 mL.
For total dissolved solids and metals, refer to Tables 16 and 17, based on AWQG.
For other indicators, such as cyanobacteria and pathogens, see AWQG.
Suitability for farm supply/use
All fresh waters including groundwaters
As per AWQG.
Suitability for primary contact recreation
Fresh waters, estuarine and coastal waters
As per NHMRC (2008)3, including:
water free of physical (floating and submerged) hazards
temperature range: 16–34°C
pH range: 6.5–8.5
DO: >80%
faecal contamination: designated recreational waters are protected against direct contamination with fresh faecal material, particularly of human or domesticated animal origin. Two principal components are required for assessing faecal contamination:
- assessment of evidence for the likely influence of faecal material
- counts of suitable faecal indicator bacteria (usually enterococci)
These two components are combined to produce an overall microbial classification of the recreational water body.
direct contact with venomous or dangerous aquatic organisms should be avoided. Recreational water bodies should be reasonably free of, or protected from, venomous organisms (e.g. box jellyfish and bluebottles)
waters contaminated with chemicals that are either toxic or irritating to the skin or mucous membranes are unsuitable for recreational purposes.
Suitability for primary contact recreation
Fresh waters cyanobacteria/algae: Recreational water bodies should not contain:
- level 11: ≥ 10 μg/L total microcystins; or ≥ 50 000 cells/mL toxic Microcystis aeruginosa; or biovolume equivalent of ≥ 4 mm3/L for the combined total of all cyanobacteria where a known toxin producer is dominant in the total biovolume or
- level 21: ≥ 10 mm3/L for total biovolume of all cyanobacterial material where known toxins are not present
or
- cyanobacterial scums consistently present. Further details are contained in NHMRC (2008) and Table 18.
Estuarine, coastal waters
cyanobacteria/algae: Recreational water bodies should not contain ≥ 10 cells/mL Karenia brevis and/or have Lyngbya majuscula and/or Pfiesteria present in high numbers2. Further details are contained in NHMRC (2008) and Table 18.
Suitability for secondary contact recreation
Fresh waters, estuarine and coastal waters
As per NHMRC (2008), including:
faecal contamination
cyanobacteria/algae (refer above and Table 18)
3 Guidelines for Managing Risks in Recreational Water are available on the NHMRC website.

Department of Science Information Technology and Innovation
76
Environmental value
Water type/area
Water quality guideline to protect EV (refer to specified codes and guidelines for full details)
Suitability for visual recreation
Fresh waters, estuarine and coastal waters
As per NHMRC (2008), including:
recreational water bodies should be aesthetically acceptable to recreational users. The water should be free from visible materials that may settle to form objectionable deposits; floating debris, oil, scum and other matter; substances producing objectionable colour, odour, taste or turbidity; and substances and conditions that produce undesirable aquatic life.
cyanobacteria/algae—refer NHMRC (2008) and Table 18.
Notes:
1. Level 1 recognises the probability of adverse health effects from ingestion of known toxins, in this case based on the toxicity of microcystins. Level 2 covers circumstances in which there are very high cell densities of cyanobacterial material, irrespective of the presence of toxicity or known toxins. Increased cyanobacterial densities increase the likelihood of non-specific adverse health outcomes, principally respiratory, irritation and allergy symptoms. (NHMRC, 2008; 8).
2. The NHMRC states that its guidelines are concerned ‘only with risks that may be associated with recreational activities in or near coastal and estuarine waters. This includes exposure through dermal contact, inhalation of sea-spray aerosols and possible ingestion of water or algal scums, but does not include dietary exposure to marine algal toxins.’ (NHMRC, 2008; 121).
Sources:
The water quality guideline source documents include:
Australian Drinking Water Guidelines (NHMRC, 2011, as updated 2016).
Australia New Zealand Food Standards Code (Australian Government).
Australian and New Zealand Guidelines for Fresh and Marine Water Quality (ANZECC & ARMCANZ, 2000).
Guidelines for Managing Risks in Recreational Water (NHMRC, 2008).
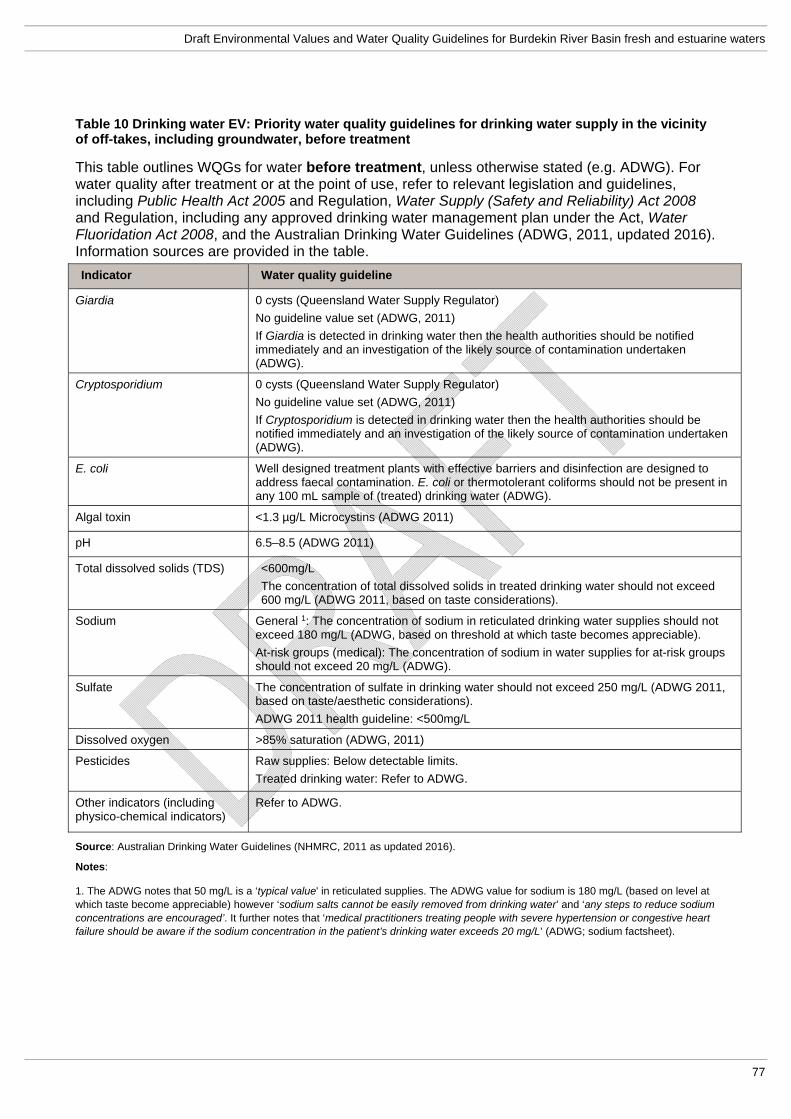
Draft Environmental Values and Water Quality Guidelines for Burdekin River Basin fresh and estuarine waters
77
Table 10 Drinking water EV: Priority water quality guidelines for drinking water supply in the vicinity of off-takes, including groundwater, before treatment
This table outlines WQGs for water before treatment, unless otherwise stated (e.g. ADWG). For water quality after treatment or at the point of use, refer to relevant legislation and guidelines, including Public Health Act 2005 and Regulation, Water Supply (Safety and Reliability) Act 2008 and Regulation, including any approved drinking water management plan under the Act, Water Fluoridation Act 2008, and the Australian Drinking Water Guidelines (ADWG, 2011, updated 2016). Information sources are provided in the table.
Indicator Water quality guideline
Giardia 0 cysts (Queensland Water Supply Regulator)
No guideline value set (ADWG, 2011)
If Giardia is detected in drinking water then the health authorities should be notified immediately and an investigation of the likely source of contamination undertaken (ADWG).
Cryptosporidium 0 cysts (Queensland Water Supply Regulator)
No guideline value set (ADWG, 2011)
If Cryptosporidium is detected in drinking water then the health authorities should be notified immediately and an investigation of the likely source of contamination undertaken (ADWG).
E. coli Well designed treatment plants with effective barriers and disinfection are designed to address faecal contamination. E. coli or thermotolerant coliforms should not be present in any 100 mL sample of (treated) drinking water (ADWG).
Algal toxin <1.3 µg/L Microcystins (ADWG 2011)
pH 6.5–8.5 (ADWG 2011)
Total dissolved solids (TDS) <600mg/L
The concentration of total dissolved solids in treated drinking water should not exceed 600 mg/L (ADWG 2011, based on taste considerations).
Sodium General 1: The concentration of sodium in reticulated drinking water supplies should not exceed 180 mg/L (ADWG, based on threshold at which taste becomes appreciable).
At-risk groups (medical): The concentration of sodium in water supplies for at-risk groups should not exceed 20 mg/L (ADWG).
Sulfate The concentration of sulfate in drinking water should not exceed 250 mg/L (ADWG 2011, based on taste/aesthetic considerations).
ADWG 2011 health guideline: <500mg/L
Dissolved oxygen >85% saturation (ADWG, 2011)
Pesticides Raw supplies: Below detectable limits.
Treated drinking water: Refer to ADWG.
Other indicators (including physico-chemical indicators)
Refer to ADWG.
Source: Australian Drinking Water Guidelines (NHMRC, 2011 as updated 2016).
Notes:
1. The ADWG notes that 50 mg/L is a ‘typical value' in reticulated supplies. The ADWG value for sodium is 180 mg/L (based on level at which taste become appreciable) however ‘sodium salts cannot be easily removed from drinking water’ and ‘any steps to reduce sodium concentrations are encouraged’. It further notes that ‘medical practitioners treating people with severe hypertension or congestive heart failure should be aware if the sodium concentration in the patient’s drinking water exceeds 20 mg/L’ (ADWG; sodium factsheet).

Department of Science Information Technology and Innovation
78
Table 11 Aquaculture EV: Water quality guidelines for tropical aquaculture
Source: Department of Primary Industries and Fisheries: Water Quality in Aquaculture—DPI Notes April 2004
Water parameter Recommended range
Water parameter Recommended range
Fresh water Marine General aquatic
Dissolved oxygen >4 mg/L >4 mg/L Arsenic <0.05 mg/L
Temperature ˚C 21–32 24–33 Cadmium <0.003 mg/L
pH 6.8–9.5 7–9.0 Calcium/Magnesium 10–160 mg/L
Ammonia (TAN, total ammonia-nitrogen)
<1.0 mg/L <1.0 mg/L Chromium <0.1 mg/L
Ammonia (NH3, un-ionised form)
<0.1 mg/L <0.1 mg/L Copper <0.006 mg/L in soft water
Nitrate (NO3) 1–100 mg/L 1–100 mg/L Cyanide <0.005 mg/L
Nitrite (NO2) <0.1 mg/L <1.0 mg/L Iron <0.5 mg/L
Salinity 0–5 ppt 15–35 ppt Lead <0.03 mg/L
Hardness 20–450 mg/L Manganese <0.01 mg/L
Alkalinity 20–400 mg/L >100mg/L Mercury <0.00005 mg/L
Turbidity <80 NTU Nickel <0.01 mg/L in soft water <0.04 mg/L in hard water
Chlorine <0.003 mg/L Tin <0.001 mg/L
Hydrogen sulphide <0.002 mg/L Zinc 0.03–0.06 mg/L in soft water
1–2 mg/L in hard water

Draft Environmental Values and Water Quality Guidelines for Burdekin River Basin fresh and estuarine waters
79
Table 12 Aquaculture EV: Water quality guidelines for optimal growth of particular species in fresh water
Water parameter Barramundi Eel Silver perch Jade perch Sleepy cod Redclaw
Dissolved oxygen 4–9 mg/L >3 mg/L >4 mg/L >3 mg/L >4.0 mg/L >4.0 mg/L
Temperature ˚C 26–32 23–28 23–28 23–28 22–31 23–31
pH 7.5–8.5 7.0–8.5 6.5–9 6.5–9 7.0–8.5 7.0–8.5
Ammonia (TAN, Total ammonia-nitrogen)
<1.0 mg/L <1.0 mg/L <1.0 mg/L
Ammonia (NH3, un-ionised form)*pH dependent.
<0.46 mg/L <0.1 mg/L <0.1 mg/L <0.1 mg/L <0.1 mg/L <0.1 mg/L
Nitrate (NO3) <100 mg/L
Nitrite (NO2) <1.5 mg/L <1.0 mg/L <0.1 mg/L <1.0 mg/L <1.0 mg/L
Salinity (extended periods)
0–35 ppt <5 ppt <5 ppt <4 ppt
Salinity bath 0–35 ppt 5–10 ppt for 1 hour
max. 20 ppt for one hour
Hardness (CaCO3) >50 mg/L >50 mg/L >40 mg/L >40 mg/L
Alkalinity >20 mg/L 100–400 ppm 100–400 ppm >40 mg/L >40 mg/L
Chlorine <0.04 mg/L <0.04 mg/L
Hydrogen sulphide 0–0.3 mg/L 0–0.3 mg/L
Iron <0.1 mg/L <0.5 mg/L <0.5 mg/L <0.1 mg/L <0.1 mg/L
Spawning temperature ˚C
Marine 23–28 23–28 >24 for more than three
days
Source: Department of Primary Industries and Fisheries: Water Quality in Aquaculture—DPI Notes April 2004.

Department of Science Information Technology and Innovation
80
Table 13 Aquaculture EV: Water quality guidelines for optimal growth of particular marine species
Water parameter Barramundi Tiger prawn Kuruma prawn
Hatchery Grow out Hatchery Grow out Grow out
Dissolved oxygen Saturation >4 mg/L >4 mg/L >3.5 mg/L >4 mg/L
Temperature ˚C 28–30 optimum
25–31 range
28–30 optimum 26–32 24
pH ~8 ~8 ~8 7.5–8.5 7.5–8.5
Ammonia (TAN, total ammonia-nitrogen)
0.1–0.5 mg/L
Ammonia (NH3, un-ionised form)
<0.1 mg/L <0.1 mg/L <0.1 mg/L <0.1 mg/L <0.1 mg/L
Nitrate (NO3) <1.0 mg/L <1.0 mg/L <1.0 mg/L <1.0 mg/L <1.0 mg/L
Nitrite (NO2) <0.2 mg/L <1.0 mg/L <0.2 mg/L <0.2 mg/L <0.2 mg/L
Salinity 28–31 ppt 0–35 ppt 10–25 ppt optimum
30–35 ppt optimum
Alkalinity 105–125 mg/L CaCO3
Clarity 30–40 cm Secchi disk
30–40 cm Secchi disk
Hydrogen sulphide <0.3 mg/L
Iron <0.02 mg/L <1.0 mg/L
Spawning temperature ˚C
28–32 27–32
Source: Department of Primary Industries and Fisheries—Water Quality in Aquaculture—DPI Notes April 2004 (as amended).
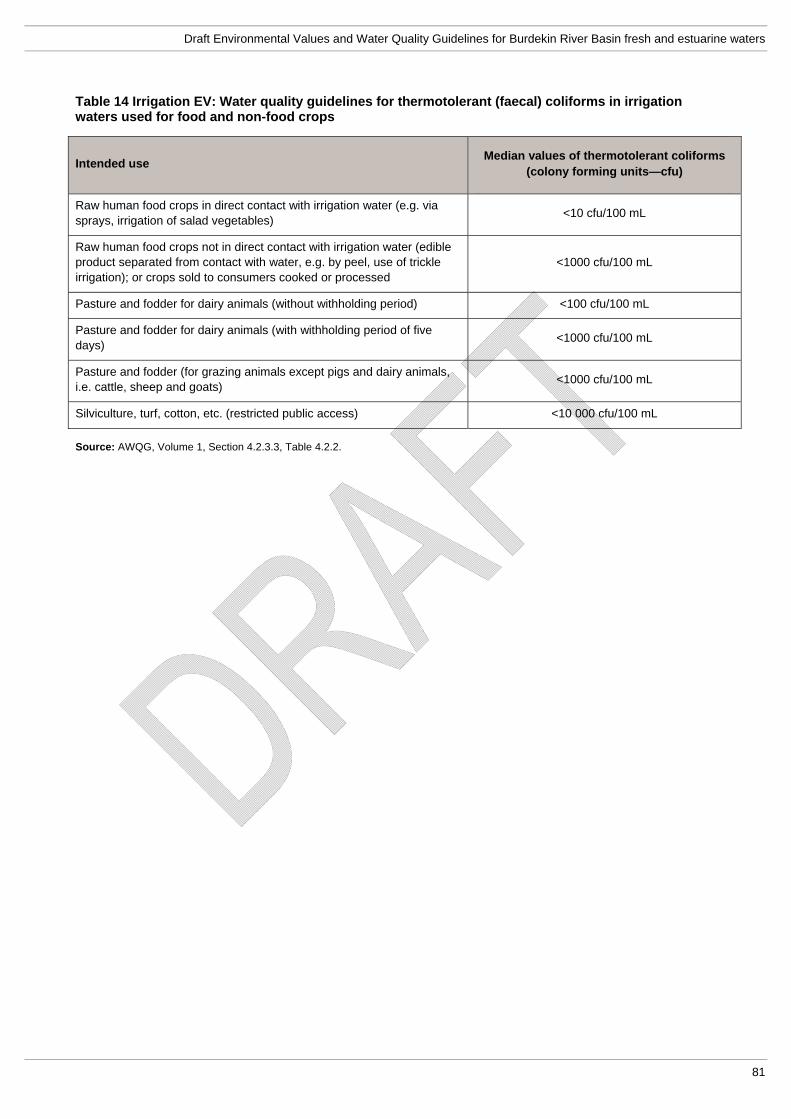
Draft Environmental Values and Water Quality Guidelines for Burdekin River Basin fresh and estuarine waters
81
Table 14 Irrigation EV: Water quality guidelines for thermotolerant (faecal) coliforms in irrigation waters used for food and non-food crops
Intended use Median values of thermotolerant coliforms
(colony forming units—cfu)
Raw human food crops in direct contact with irrigation water (e.g. via sprays, irrigation of salad vegetables)
<10 cfu/100 mL
Raw human food crops not in direct contact with irrigation water (edible product separated from contact with water, e.g. by peel, use of trickle irrigation); or crops sold to consumers cooked or processed
<1000 cfu/100 mL
Pasture and fodder for dairy animals (without withholding period) <100 cfu/100 mL
Pasture and fodder for dairy animals (with withholding period of five days)
<1000 cfu/100 mL
Pasture and fodder (for grazing animals except pigs and dairy animals, i.e. cattle, sheep and goats)
<1000 cfu/100 mL
Silviculture, turf, cotton, etc. (restricted public access) <10 000 cfu/100 mL
Source: AWQG, Volume 1, Section 4.2.3.3, Table 4.2.2.

Department of Science Information Technology and Innovation
82
Table 15 Irrigation EV: Water quality guidelines for heavy metals and metalloids in agricultural irrigation water— soil cumulative contamination loading limit (CCL), long-term trigger value (LTV) and short-term trigger value (STV)1
Element Soil cumulative contaminant
loading limit (CCL) (kg/ha)
Long-term trigger value (LTV) in irrigation water (up to 100
years) (mg/L)
Short-term trigger value (STV) in irrigation water (up to 20
years) (mg/L)
Aluminium ND2 5 20
Arsenic 20 0.1 2.0
Beryllium ND 0.1 0.5
Boron ND 0.5 Refer to AWQG,
Vol 3, Table 9.2.18
Cadmium 2 0.01 0.05
Chromium ND 0.1 1
Cobalt ND 0.05 0.1
Copper 140 0.2 5
Fluoride ND 1 2
Iron ND 0.2 10
Lead 260 2 5
Lithium ND 2.5
(0.075 for citrus crops) 2.5
(0.075 for citrus crops)
Manganese ND 0.2 10
Mercury 2 0.002 0.002
Molybdenum ND 0.01 0.05
Nickel 85 0.2 2
Selenium 10 0.02 0.05
Uranium ND 0.01 0.1
Vanadium ND 0.1 0.5
Zinc 300 2 5
Notes:
1. Concentrations in irrigation water should be less than the trigger values. Trigger values should only be used in conjunction with information on each individual element and the potential for off-site transport of contaminants (refer AWQG, Volume 3, Section 9.2.5).
2. ND = Not determined; insufficient background data to calculate CCL.
Source: AWQG, Volume 1, Section 4.2.6, Table 4.2.10.

Draft Environmental Values and Water Quality Guidelines for Burdekin River Basin fresh and estuarine waters
83
Table 16 Stock watering EV: Water quality guidelines for tolerances of livestock to salinity, as total dissolved solids, in drinking water
Livestock Total dissolved solids (TDS) (mg/L)
No adverse effects on animals expected.
Animals may have initial reluctance to drink or there may be some scouring, but stock should adapt without loss of production
Loss of production and decline in animal condition and health would be expected. Stock may tolerate these levels for short periods if introduced gradually
Beef cattle 0–4000 4000–5000 5000–10 000
Dairy cattle 0–2500 2500–4000 4000–7000
Sheep 0–5000 5000–10 000 10 000–13 0001
Horses 0–4000 4000–6000 6000–7000
Pigs 0–4000 4000–6000 6000–8000
Poultry 0–2000 2000–3000 3000–4000
Notes:
1. Sheep on lush green feed may tolerate up to 13 000 mg/L TDS without loss of condition or production.
Source: AWQG, Volume 1, Section 4.3.3.5, Table 4.3.1.

Department of Science Information Technology and Innovation
84
Table 17 Stock watering EV: Water quality guidelines (low risk trigger values) for heavy metals and metalloids in livestock drinking water
Metal or metalloid Trigger value (low risk)1,2 (mg/L)
Aluminium 5
Arsenic 0.5 (up to 53)
Beryllium ND
Boron 5
Cadmium 0.01
Chromium 1
Cobalt 1
Copper 0.4 (sheep), 1 (cattle), 5 (pigs), 5 (poultry)
Fluoride 2
Iron not sufficiently toxic
Lead 0.1
Manganese not sufficiently toxic
Mercury 0.002
Molybdenum 0.15
Nickel 1
Selenium 0.02
Uranium 0.2
Vanadium ND
Zinc 20
Notes:
1. Higher concentrations may be tolerated in some situations (further details provided in AWQG, Volume 3, Section 9.3.5).
2. ND = not determined, insufficient background data to calculate.
3. May be tolerated if not provided as a food additive and natural levels in the diet are low.
Source: AWQG, Volume 1, Section 4.3.4, Table 4.3.2.

Draft Environmental Values and Water Quality Guidelines for Burdekin River Basin fresh and estuarine waters
85
Table 18 Recreational waters: Alert levels and corresponding actions for management of cyanobacteria
When cyanobacteria are present in large numbers they can present a significant hazard, particularly to primary contact users of waters. Water quality guidelines for cyanobacteria in recreational waters are provided in Table 9. Monitoring and action requirements relative to cyanobacteria ‘alert’ levels are summarised below, and are explained more fully in the Guidelines for Managing Risks in Recreational Water (NHMRC, 2008). Further details on the process to determine suitability of waters for recreation, relative to historical cyanobacterial levels and susceptibility to cyanobacterial contamination, are contained in sections 6 and 7 of the NHMRC guidelines.
Green level surveillance mode1 Amber level alert mode1 Red level action mode1
Fresh waters
≥ 500 to <5000 cells/mL M. aeruginosa or biovolume equivalent of >0.04 to <0.4 mm3/L for the combined total of all cyanobacteria.
≥ 5000 to <50 000 cells/mL M. aeruginosa or biovolume equivalent of ≥ 0.4 to <4 mm3/L for the combined total of all cyanobacteria where a known toxin producer is dominant in the total biovolume2.
or3
≥ 0.4 to <10 mm3/L for the combined total of all cyanobacteria where known toxin producers are not present.
Level 1 guideline4:
≥ 10 μg/L total microcystins
or
≥ 50 000 cells/mL toxic M. aeruginosa or biovolume equivalent of ≥ 4 mm3/L for the combined total of all cyanobacteria where a known toxin producer is dominant in the total biovolume.
or3
Level 2 guideline4:
≥ 10 mm3/L for total biovolume of all cyanobacterial material where known toxins are not present.
or
cyanobacterial scums are consistently present5.
Coastal and estuarine waters
Karenia brevis
≤ 1 cell/mL > 1– < 10 cells/mL ≥ 10 cells/mL
Lyngbya majuscula, Pfiesteria spp.
History but no current presence of organism
Present in low numbers Present in high numbers. (For Lyngbya majuscula this involves the relatively widespread visible presence of dislodged algal filaments in the water and washed up onto the beach)
Nodularia spumigena: See NHMRC, Chapter 6 (Cyanobacteria and algae in fresh water) for details.
Notes:
1. Recommended actions at different alert levels are outlined below (based on NHMRC, 2008, Table 6.6—fresh waters. Similar actions are outlined for coastal/estuarine waters in NHMRC Table 7.6):
a. Green: Regular monitoring. Weekly sampling and cell counts at representative locations in the water body where known toxigenic species are present (i.e. Microcystis aeruginosa, Anabaena circinalis, Cylindrospermopsis raciborskii, Aphanizomenon ovalisporum, Nodularia spumigena); or fortnightly for other types including regular visual inspection of water surface for scums.
b. Amber: Notify agencies as appropriate. Increase sampling frequency to twice weekly at representative locations in the water body where toxigenic species (above) are dominant within the alert level definition (i.e. total biovolume) to establish population growth and spatial variability in the water body. Monitor weekly or fortnightly where other types are dominant. Make regular visual inspections of water surface for scums. Decide on requirement for toxicity assessment or toxin monitoring.
c. Red: Continue monitoring as for (amber) alert mode. Immediately notify health authorities for advice on health risk. (‘In action mode the local authority and health authorities warn the public of the existence of potential health risks; for example, through the

Department of Science Information Technology and Innovation
86
media and the erection of signs by the local authority.’ NHMRC, 2008; 114). Make toxicity assessment or toxin measurement of water if this has not already been done. Health authorities warn of risk to public health (i.e. the authorities make a health risk assessment considering toxin monitoring data, sample type and variability).
2. The definition of 'dominant' is where the known toxin producer comprises 75 per cent or more of the total biovolume of cyanobacteria in a representative sample.
3. This applies where high cell densities or scums of 'non toxic' cyanobacteria are present i.e. where the cyanobacterial population has been tested and shown not to contain known toxins (mycrocystins, nodularian, cylindrospermopsin or saxitoxin).
4. Health risks and levels: Level 1 is developed to protect against short-term health effects of exposure to cyanobacterial toxins ingested during recreational activity, whereas the Level 2 applies to the circumstance where there is a probability of increased likelihood of non-specific adverse health outcomes, principally respiratory, irritation and allergy symptoms, from exposure to very high cell densities of cyanobacterial material irrespective of the presence of toxicity or known toxins (NHMRC, 2008;114).
5. This refers to the situation where scums occur at the recreation site each day when conditions are calm, particularly in the morning. Note that it is not likely that scums are always present and visible when there is a high population as the cells may mix down with wind and turbulence and then reform later when conditions become stable.
Source: Based on NHMRC (2008) Guideline for Managing Risks in Recreational Water (tables 6.2, 6.6, 7.3).


![Guidelines [DRAFT]](https://img.dokumen.tips/doc/110x75/61f2bfd59989da49e46a60d2/guidelines-draft.jpg)