Embed Size (px)
Citation preview

Environmental Science (Course #235)
Course of Study
Findlay City Schools 2006

TABLE OF CONTENTS
1. Findlay City Schools’ Mission Statement and Beliefs 2. Environmental Science Curriculum Map 3. Integrated Benchmarks and Indicators 4. Environmental Science Indicators
Environmental Science Course of Study Writing Team
Heather Bryan Sandy White

Mission Statement
The mission of the Findlay City Schools, a community partnership committed to educational excellence, is to instill in each student the knowledge, skills and virtues necessary to be lifelong learners who recognize their unique talents and purpose and use them in pursuit of their dreams and for service to a global society. This is accomplished through a passion for knowledge, discovery and vision shared by students, families, staff and community.
Beliefs Our beliefs form the ethical foundation of the Findlay City Schools. We believe….
• every person has worth • every individual can learn • family is the most important influence on the
development of personal values. • attitude is a choice and always affects performance • motivation and effort are necessary to achieve full
potential • honesty and integrity are essential for building
trust. • people are responsible for the choices they make. • performance is directly related to expectations. • educated citizens are essential for the survival of
the democratic process. • personal fulfillment requires the nurturing of mind,
body and spirit. • every individual has a moral and ethical obligation to
contribute to the well-being of society. • education is a responsibility shared by students,
family, staff and community. • the entire community benefits by investing its time,
resources and effort in educational excellence. • a consistent practice of shared morals and ethics is
essential for our community to thrive.

ENVIRONMENTAL SCIENCE CURRICULUM MAP
Week Resource/Holt: Environmental Science
Topic Indicator -Scientific Ways of
Knowing (SWK) - Life Sciences (LS)
- Science and Technology (ST) -Physical Sciences
(PS) - Earth & Space
Sciences (ESS) - Scientific Inquiry
Week 1 Chapter 1 Environmental Science History, Science Safety
LS: 11-5, 11-9
Week 2 Chapter 1 Sustainability, Economics, Environment
SWK: 11-8,11-9, 11-10
Week 3 Chapter 2 Scientific Method SI: 11-1, 11-2, 11-3,
11-4, 11-5 Week 4 Chapter 3 Plate Tectonics,
Earthquakes, Volcanoes, Atmosphere,
Greenhouse Effect
LS: 11-14 PS: 12-11
ESS: 11-6, 11-8, 11-9
Week 5 Chapter 3 Hydrosphere, Biosphere, Water
Resources
ESS: 11-6, 11-8, 11-13
Week 6 Chapter 4 Ecosystems, Biotic Diversity
LS: 11-5, 11-9, 12-7, 12-8
Week 7 Chapter 4 Evolution LS: 11-5, 11-6, 11-9, 11-10, 11-12,
11-13, 12-7, 12-10
Week 8 Chapter 5 Energy Flow in Ecosystems
LS: 12-9 PS: 11-3
Week 9 Chapter 5 Nutrient Recycling, Ecosystem Change
LS: 11-12, 12-9 PS: 11-3
ESS: 11-11, 11-13
Week 10 Chapter 6 Biomes ESS: 11-4, 12-5 Week 11 Chapter 6, Chapter 7 Biomes, Freshwater
Ecosystems ESS: 11-4, 12-5
Week 12 Chapter 7 Freshwater and Marine ESS: 11-4, 12-5

Ecosystems Week 13 Chapter 8 Population Dynamics LS: 11-3, 11-6,
11-7, 11-8, 12-7, 12-8
Week 14 Chapter 8 Niche, Competition, Symbiosis
LS: 11-6, 11-7, 11-8, 12-7
Week 15 Chapter 10 Biodiversity, Keystone Species, Biodiversity at
Risk
LS: 11-5, 11-9 ESS: 11-12
Week 16 Chapter 10, Chapter 9 Future of Biodiversity, Human Population
Dynamics
LS: 11-3, 11-4, 11-11
Week 17 Chapter 9 Human Population Dynamics
LS: 11-3, 11-4, 11-11
Week 18 Exam Review, Semester Exam
Week 19 Chapter 11 Water Resources, Use and Management
LS: 11-5, 11-9
Week 20 Chapter 11 Water Pollution ST: 11-5 LS: 11-5, 11-9 ESS: 11-12
Week 21 Chapter 12 Air Pollution ST: 11-5 LS: 11-5, 11-9
ESS: 11-7, 11-12
Week 22 Chapter 12 Air Pollution ST: 11-5 LS: 11-5, 11-9
ESS: 11-7, 11-12
Week 23 Chapter 13 Climate, Climate Change LS: 11-5, 11-9 ESS: 11-3, 11-4,
11-5, 12-5, 11-9 Week 24 Chapter 13 Global Warming LS: 11-5, 11-9,
11-12 ESS: 11-9
Week 25 Chapter 14 Land Use ESS: 11-12 Week 26 Chapter 14 Land Management and
Conservation ESS: 11-12
Week 27 Chapter 15 Food and Agriculture ESS: 11-9 Week 28 Chapter 15 Crops, Animals and
Agriculture ESS: 11-9
Week 29 Chapter 1 6 Mineral Resources, Mining
ST: 11-5 LS: 11-5, 11-9

ESS: 11-14, 12-6
Week 30 Chapter 16, Chapter 17 Mining Regulations and Reclamation,
Nonrenewable Energy
ST: 11-5 PS: 11-3
LS: 11-5, 11-9 ESS: 11-14, 12-
6 Week 31 Chapter 17 Fossil Fuels, Nuclear
Energy ST: 11-5
PS: 11-3, 12-11 ESS: 11-14, 12-
6 Week 32 Chapter 18 Renewable Energy ST: 11-6 Week 33 Chapter 18, Chapter 19 Renewable Energy,
Solid Waste ST: 11-6
LS: 11-5, 11-9 Week 34 Chapter 19 Solid Waste, Hazardous
Waste LS: 11-5, 11-9
Week 35 Chapter 20 Pollution and Human Health
LS: 11-5, 11-9
Week 36 Review for Exams, Exams
Text: Environmental Science; Holt, Rinehart and Winston; Karen Arms, PhD, JD (author); ISBN: 0030390745 (Teacher edition). AP Text: Living in the Environment; Brooks/Cole; Tyler Miller (author); ISBN #0534376975

The following benchmarks and indicators will be integrated into the instruction of all the EARTH/SPACE SCIENCE and LIFE SCIENCE benchmarks and indicators detailed in this course of study/curriculum model for the instruction of Environmental Science:
SCIENCE AND TECHNOLOGY BENCHMARK A: Predict how human choices today will determine the quality and quantity of life on Earth. INDICATOR 11-1: Identify that science and technology are essential social enterprises but alone they can only indicate what can happen, not what should happen. Realize the latter involves human decisions about the use of knowledge. INDICATOR 11-2: Predict how decisions regarding the implementation of technologies involve the weighing of trade-offs between predicted positive and negative effects on the environment and/or humans. INDICAOR 11-4: Explain why basic concepts and principles of science and technology should be a part of active debate about the economics, policies, politics and ethics of various science-related and technology-related challenges. INDICATOR 12-1: Explain how science often advances with the introduction of new technologies and how solving technological problems often results in new scientific knowledge. INDICATOR 12-2: Describe how new technologies often extend the current levels of scientific understanding and introduce new areas of research. INDICATOR 12-3: Research how scientific inquiry is driven by the desire to understand the natural world and how technological design is driven by the need to meet human needs and solve human problems. SCIENTIFIC INQUIRY BENCHMARK A: Make appropriate choices when designing and participating in scientific investigations by using cognitive and manipulative skills when collecting data and formulating conclusions from the data. INDICATOR 11-1: Formulate testable hypotheses. Develop and explain the appropriate procedures, controls and variables (dependent and independent) in scientific experimentation. INDICATOR 11-2: Evaluate assumptions that have been used in reaching scientific conclusions. INDICATOR 11-3: Design and carry out scientific inquiry (investigation), communicate and critique results through peer review.

INDICATOR 11-4: Explain why the methods of an investigation are based on the questions being asked. INDICATOR 11-5: Summarize data and construct a reasonable argument based on those data and other known information. INDICATOR 12-2: Derive simple mathematical relationships that have predictive power from experimental data (e.g., derive an equation form a graph and vice versa, determine whether a linear or exponential relationship exists among the data in a table). INDICATOR 12-3: Research and apply appropriate safety precautions when designing and/or conducting scientific investigations (e.g., OSHA, MSDS, eyewash, goggles and ventilation). INDICATOR 12-4: Create and clarify the method, procedures, controls and variables in complex scientific investigations. INDICATORE 12-5: use appropriate summary statistics to analyze and describe data.
SCIENTIFIC WAYS OF KNOWING BENCHMARK A: Explain how scientific evidence is used to develop and revise scientific predictions, ideas or theories. INDICATOR 11-1: Analyze a set of data to derive a hypothesis and apply that hypothesis to a similar phenomenon (e.g., biome data). INDICATOR 11-2: Apply scientific inquiry to evaluate results of scientific investigations, observations, theoretical models and the explanations proposed by other scientists. INDIATOR 11-3: Demonstrate that scientific explanations adhere to established criteria, for example a proposed explanation must be logically consistent, it must abide by the rules of evidence and it must be open to questions and modifications.
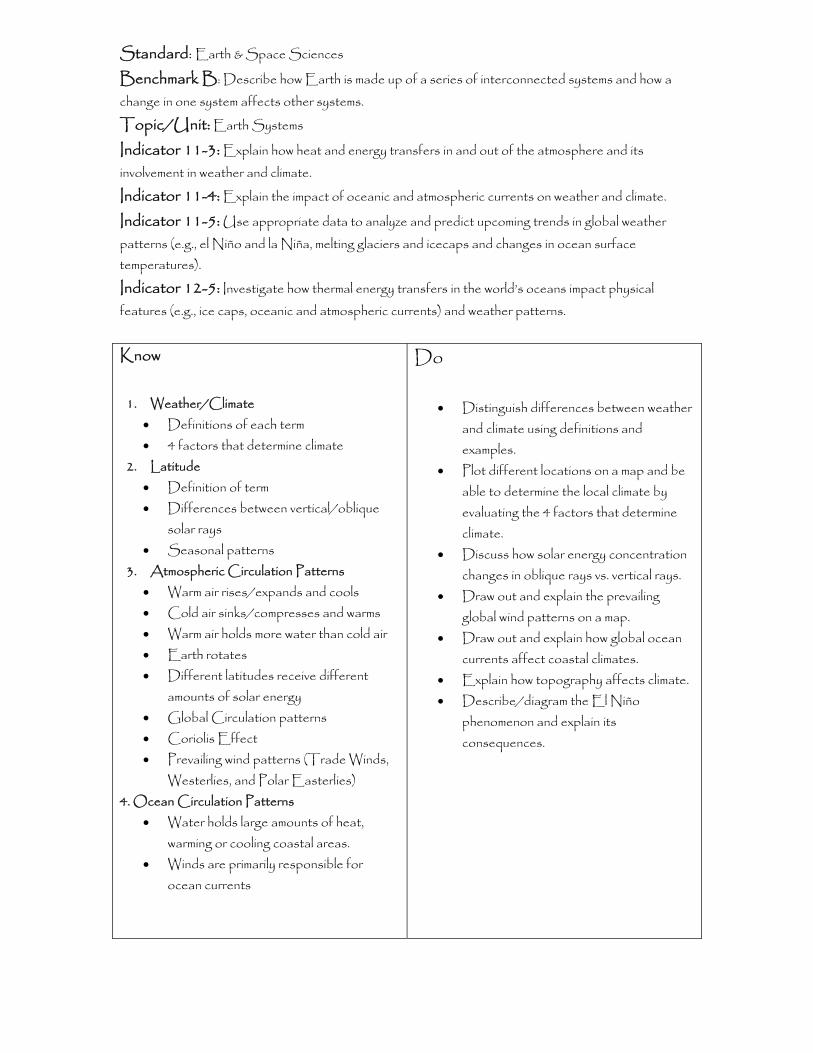
Standard: Earth & Space Sciences Benchmark B: Describe how Earth is made up of a series of interconnected systems and how a change in one system affects other systems. Topic/Unit: Earth Systems Indicator 11-3: Explain how heat and energy transfers in and out of the atmosphere and its involvement in weather and climate. Indicator 11-4: Explain the impact of oceanic and atmospheric currents on weather and climate. Indicator 11-5: Use appropriate data to analyze and predict upcoming trends in global weather patterns (e.g., el Niño and la Niña, melting glaciers and icecaps and changes in ocean surface temperatures). Indicator 12-5: Investigate how thermal energy transfers in the world’s oceans impact physical features (e.g., ice caps, oceanic and atmospheric currents) and weather patterns. Know
1. Weather/Climate • Definitions of each term • 4 factors that determine climate
2. Latitude • Definition of term • Differences between vertical/oblique
solar rays • Seasonal patterns
3. Atmospheric Circulation Patterns • Warm air rises/expands and cools • Cold air sinks/compresses and warms • Warm air holds more water than cold air • Earth rotates • Different latitudes receive different
amounts of solar energy • Global Circulation patterns • Coriolis Effect • Prevailing wind patterns (Trade Winds,
Westerlies, and Polar Easterlies) 4. Ocean Circulation Patterns
• Water holds large amounts of heat, warming or cooling coastal areas.
• Winds are primarily responsible for ocean currents
Do
• Distinguish differences between weather and climate using definitions and examples.
• Plot different locations on a map and be able to determine the local climate by evaluating the 4 factors that determine climate.
• Discuss how solar energy concentration changes in oblique rays vs. vertical rays.
• Draw out and explain the prevailing global wind patterns on a map.
• Draw out and explain how global ocean currents affect coastal climates.
• Explain how topography affects climate. • Describe/diagram the El Niño
phenomenon and explain its consequences.

Know 5. El Niño-Southern Oscillation (ENSO)
• Southern Western Pacific winds strengthen and push warm water eastward.
6. La Niña • Water in the Western Pacific Ocean is
cooler than normal 7. Geography
• Altitude affects climate. • Topography affects weather/climate.
Pre-Assessment: Assessment:
Graphic Organizer and/or Technology:
Testing Skills/Questions:
Best Practices:
Resources:

Testing Vocabulary: Climate Latitude El Niño La Niña Ozone Layer CFC’s Polar Stratospheric Clouds Westerlies Kyotol Protocol Polar Easterlies Tradewinds
Historical/Modern Link:

Standard: Earth & Space Sciences Benchmark B: Describe how Earth is made up of a series of interconnected systems and how a change in one system affects other systems. Topic/Unit: Earth Systems Indicator 11-6: Explain how interactions among Earth’s lithosphere, hydrosphere, atmosphere and biosphere have resulted in the ongoing changes of Earth’s system. Indicator 11-8: Describe the normal adjustments of Earth, which may be hazardous for humans. Recognize that humans live at the interface between the atmosphere driven by solar energy and the upper mantle where convection creates changes in Earth’s solid crust. Realize that as societies have grown, become stable and come to value aspects of the environment, vulnerability to natural processes of change has increased. Know
1. Geosphere, Lithosphere, Hydropshere, Atmosphere, and Biosphere
• Definitions of each term 2. Plate Tectonics
• Theory of Plate Tectonics • Earthquakes/Volcanoes/Ring of Fire • Erosion/Rock Cycle
3. Atmosphere • Layers of the atmosphere • Components of each layer • 3 mechanisms of heat transfer
4. Hydrosphere • Water Cycle • Surface waters impact on the
Atmosphere 5. Biosphere
• Earth is a closed system • All systems impact the Biosphere • Factors that confine life to the
Biosphere
Do
• Describe the composition and structure of the Earth.
• Explain the Theory of Plate Tectonics.
• Discuss how Earthquakes/Volcanoes are a result of Plate Tectonics.
• Plot the Ring of Fire on a map. • Interpret the movement of Earth’s
Plates on a diagram. • Describe how wind and water alter the
Earth’s surface. • Draw and interpret the Rock Cycle. • Label the different layers of the
atmosphere and describe the differences in pressure and temperature for each layer.
• Discuss how radiation, conduction and convection transfer heat throughout the atmosphere.
• Draw and label the hydrologic cycle. • Discuss how the hydrologic cycle
impacts the atmosphere. • Describe the factors that confine life
to the biosphere.

Pre-Assessment: Assessment:
Graphic Organizer and/or Technology:
Testing Skills/Questions:
Best Practices:
Resources:
Testing Vocabulary: Geosphere Crust Mantle Core Litohsphere Asthenosphere Tectonic Plate Erosion Atmosphere Troposphere Stratosphere Ozone Radiation Conduction Convection Water Cycle Evaporation Condensation Precipitation Biosphere Closed System Open System
Historical/Modern Link:

Standard: Earth & Space Sciences Benchmark B: Describe how Earth is made up of a series of interconnected systems and how a change in one system affects other systems. Topic/Unit: Earth Systems Indicator 11-7: Describe the effects of particulates and gases in the atmosphere including those originating from volcanic activity. Indicator 11-11: Analyze how materials from human societies (e.g., radioactive waste and air pollution) affect both physical and chemical cycles of Earth. Indicator 11-12: Explain ways in which humans have had a major effect on other species (e.g., the influence of humans on other organisms occurs through land use, which decreases space available to other species and pollution, which changes the chemical composition of air, soil, and water). Indicator 11-13: Explain how human behavior affects the basic processes of natural ecosystems and the quality of the atmosphere, hydrosphere and lithosphere.

Know 1. Pollution
• Definition of term • Point Source Pollutants come from a
single, identifiable source (e.g., sewage pipe)
• Non-Point Source Pollutants come from many sources which are hard to identify(e.g., fertilizer contamination)
• Health Effects of various pollutants on organisms
2. Air Pollution • Natural/Human causes of air pollution. • Primary pollutants are placed directly into
the air by humans. • Secondary pollutants occur when
primary pollutants either come into contact with other primary pollutants or natural substances.
• How acid rain forms and its impact on the environment.
• Formation of smog • What circumstances lead to a
temperature inversion • Indoor Air Pollution can lead to
situations such as sick-building syndrome. • Clean Air Act and its impact on
emissions 3. Water Pollution
• Classify water pollutants into 5 categories
• Wastewater treatment process • Common causes and results of artificial
eutrophication • Thermal pollution leads to fish kills by
decreasing the amount of dissolved oxygen in the water.
4. Noise Pollution • Common causes of noise pollution • Intensity of sound is measured in decibels
(dB). 5. Light Pollution
• Large waste of energy
Do
• Distinguish between Air, Water, Noise and Light pollution.
• Determine whether a pollutant is either a point or a non-point source form of pollution.
• Draw a concept map of the various types of pollution including their sources and environmental effects.
• Name the 2 major sources of air pollution in urban areas.
• Determine the causes and effects of acid rain.
• Explain where smog is most commonly found and why.
• Draw a diagram of a temperature inversion and explain how it traps/concentrates air pollution close to the ground.
• Chart the short-term and long-term effects of air pollution.
• Describe ways in which indoor air pollution can be prevented.
• Explain why groundwater pollution is very difficult to clean up.
• Diagram and outline the wastewater treatment process.
• Discuss how human activities lead to artificial eutrophication and thermal pollution.
• Research/Develop a plan to lessen the effects of water pollution.
• Identify the levels of decibels that lead to the pain threshold and permanent deafness.
• Design an efficient light source to alleviate light pollution.
• Identify what light pollution prevents humans from seeing at night.

• Inefficient forms of light pollution • How to prevent/lessen energy waste via
light pollution Pre-assessment: Assessment:
Graphic Organizer & Technology: Testing Skills/Questions:
Best Practices:
Resources:
Testing Vocabulary: Surface Water River System Watershed Groundwater Aquifer Porosity Permeability Recharge Zone Pollution Potable Pathogen Artificial
Eutrophication Thermal Pollution Point-Source
Pollution Non-point Source Pollution Wastewater Biomagnification Water Pollution
Historical/Modern Link:

Air Pollution Primary Pollutant Secondary Pollutant Smog Temperature Inversion Sick-Building
Syndrome Decibels Noise Pollution Light Pollution Asbestos Acid Precipitation Acid Shock pH

Standard: Earth & Space Sciences Benchmark C: Explain that humans are an integral part of the Earth’s system and the choices humans make today impact natural system in the future. Topic: Earth Systems Indicator 11-9: Explain the effects of biomass and human activity on climate (e.g., climatic change and global warming).
Know
1. The Greenhouse Effect • Why the atmosphere holds in heat. • The Greenhouse Effect is essential for
life on Earth. 2. Global Warming
• Definition of global warming • How humans influence global warming • Consequences of global warming
Do
• Diagram the Greenhouse Effect and explain why solar energy reaches the Earth, transforms into heat energy and is trapped by the atmosphere.
• Graph increasing atmospheric CO2
levels and compare those to increasing average global surface temperatures.
• Explain how humans have increased the percentage of Greenhouse Gases and accelerated global warming.
• Determine the potential consequences of global warming and its impact for future life of Earth.

Pre-Assessment: Assessment:
Graphic Organizer & Technology: Testing Skills/Questions:
Best Practices:
Resources:
Testing Vocabulary: Global Warming Greenhouse Gases
Historical/Modern Link:

Standard: Earth & Space Sciences Benchmark B: Describe how Earth is made up of a series of interconnected systems and how a change in one system affects other systems. Topic: Earth Systems Indicator 12-6: Describe how scientists estimate how much of a given resource is available on Earth. Benchmark C: Explain that humans are an integral part of the Earth’s system and the choices humans make today impact natural system in the future. Topic: Earth Systems Indicator 11-14: Conclude that Earth has finite resources and explain that humans deplete some resources faster than they can be renewed Know 1. Mineral Exploration
• Satellite imagery, Aerial Photographs, Gravity/Magnetism/Radioactivity, and Drilling
2. Nonrenewable Resources • Definition of term • Identify fossil fuels (e.g., coal, oil, and
natural gas) • Formation of fossil fuels • Consumption rate of fossil fuels • Estimated remains of fossil fuels
3. Renewable Resources • Definition of term • Identify renewable resources • Renewable resources can become
nonrenewable resources based upon the rate of consumption
Do
• Describe the manner in which mining companies explore for new mineral deposits.
• Create a chart detailing how each fossil fuel is formed, used by humans, and its estimated remains.
• Explore (discuss) which renewable resources are quickly becoming nonrenewable resources (e.g., fresh water) and why.
• Develop a plan to promote sustainable resource use.

Pre-Assessment: Assessment:
Graphic Organizer & Technology: Testing Skills/Questions:
Best Practices:
Resources:
Testing Vocabulary: Nonrenewable Resource Renewable Resource Mineral Ore Gangue Fossil Fuels Coal Oil Natural Gas
Historical/Modern Link:
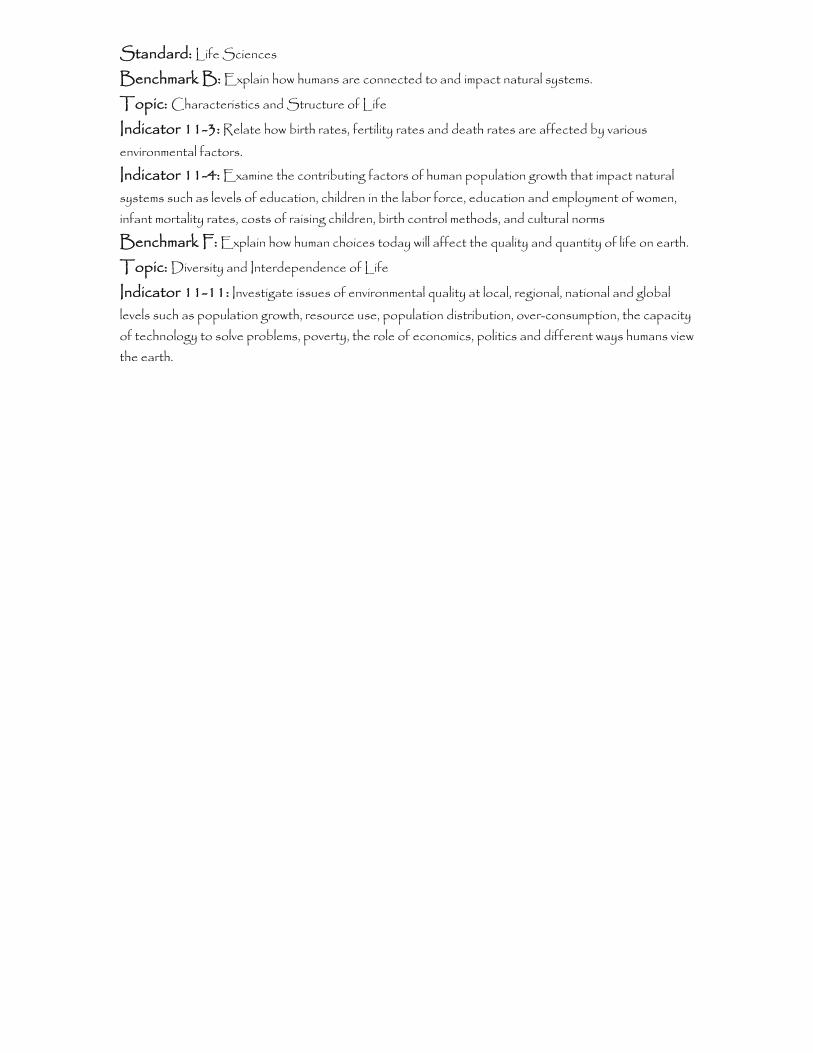
Standard: Life Sciences Benchmark B: Explain how humans are connected to and impact natural systems. Topic: Characteristics and Structure of Life Indicator 11-3: Relate how birth rates, fertility rates and death rates are affected by various environmental factors. Indicator 11-4: Examine the contributing factors of human population growth that impact natural systems such as levels of education, children in the labor force, education and employment of women, infant mortality rates, costs of raising children, birth control methods, and cultural norms Benchmark F: Explain how human choices today will affect the quality and quantity of life on earth. Topic: Diversity and Interdependence of Life Indicator 11-11: Investigate issues of environmental quality at local, regional, national and global levels such as population growth, resource use, population distribution, over-consumption, the capacity of technology to solve problems, poverty, the role of economics, politics and different ways humans view the earth.
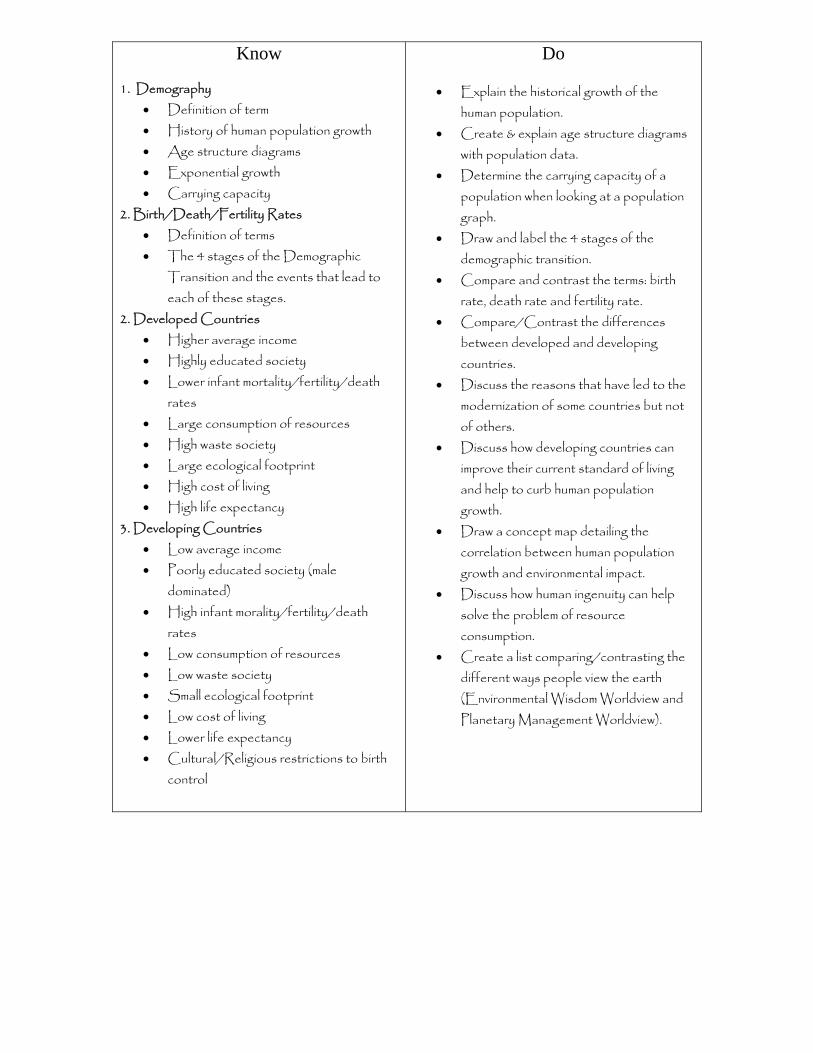
Know 1. Demography
• Definition of term • History of human population growth • Age structure diagrams • Exponential growth • Carrying capacity
2. Birth/Death/Fertility Rates • Definition of terms • The 4 stages of the Demographic
Transition and the events that lead to each of these stages.
2. Developed Countries • Higher average income • Highly educated society • Lower infant mortality/fertility/death
rates • Large consumption of resources • High waste society • Large ecological footprint • High cost of living • High life expectancy
3. Developing Countries • Low average income • Poorly educated society (male
dominated) • High infant morality/fertility/death
rates • Low consumption of resources • Low waste society • Small ecological footprint • Low cost of living • Lower life expectancy • Cultural/Religious restrictions to birth
control
Do
• Explain the historical growth of the human population.
• Create & explain age structure diagrams with population data.
• Determine the carrying capacity of a population when looking at a population graph.
• Draw and label the 4 stages of the demographic transition.
• Compare and contrast the terms: birth rate, death rate and fertility rate.
• Compare/Contrast the differences between developed and developing countries.
• Discuss the reasons that have led to the modernization of some countries but not of others.
• Discuss how developing countries can improve their current standard of living and help to curb human population growth.
• Draw a concept map detailing the correlation between human population growth and environmental impact.
• Discuss how human ingenuity can help solve the problem of resource consumption.
• Create a list comparing/contrasting the different ways people view the earth (Environmental Wisdom Worldview and Planetary Management Worldview).

Pre-Assessment: • Quiz
Assessment:
Graphic Organizer & Technology: • Concept Map
Testing Skills/Questions:
Best Practices: • Compare & Contrast
Resources: • Environmental Science Text
Testing Vocabulary: Demography Carrying Capacity Demographic Transition Fertility Rate Death Rate Birth Rate Age Structure Diagram Developed Country Developing Country Exponential Growth Life Expectancy Planetary Management Worldview Environmental Wisdom Wordlview
Historical/Modern Link: Have the students look at a historical human population graph and describe the changes that they believe have led to the exponential growth of the human population in the past 200 years.

Standard: Life Sciences Benchmark D: Relate how biotic and abiotic global changes have occurred in the past and will continue to do so in the future. Topic: Evolutionary Theory Indicator 11-12: Recognize the ecosystems change when significant climate changes occur or when one or more new species appear as a result of immigration or speciation. Indicator 11-13: Describe how the process of evolution has changed the physical world over geologic time. Indicator 12-10: Explain additional components of the evolution theory, including genetic drift, immigration, emigration and mutation. Benchmark E: Explain the interconnectedness of the components of a natural system. Topic: Diversity and Interdependence of Life Indicator 11-6: Predict some possible impacts on an ecosystem with the introduction of a non-native species. Indicator 11-10: Explain how environmental factors can influence heredity or development of organisms.

Know 1. Evolution, Natural Selection, Genetic Drift, Speciation, Immigration, Emigration and Mutation
• Definitions of each term 2. The Evolutionary Theory via Natural Selection
• Organisms produce more offspring than can survive.
• The environment is hostile and contains limited resources
• Organisms differ in the traits they have. • Some inherited traits provide organisms
with an advantage. • Each generation contains
proportionately more organisms with advantageous traits.
3. Climate change (warming or cooling) leads to ecosystem change.
• Biodiversity shifts latitude according to temperature change.
• Species that cannot adjust to the new conditions become extinct.
• Migrating species alter new ecosystems by impacting the food web and/or habitat.
4. Introduction of Non-native species • Disturb the food chain and cause
fluctuations in many populations of organisms.
Do
• Draw and describe a concept map using the terms evolution, mutation, natural selection, genetic drift, speciation, immigration and emigration.
• Discuss how the Evolutionary Theory by Natural Selection can occur using an example.
• Explain the concept of adaptation. • Discuss how genetic adaptations allow
certain organisms to adjust to change more easily than others.
• Discuss how current Global Warming is impacting local/national/global ecosystems in our world.
• Determine what types of organisms will most likely become extinct due to climate change.
• Detail the impact organisms have an their physical environment (e.g., plants, bacteria, animals, fungi and protests).
• Demonstrate on a map how biomes might shift with Global Climate Change.
Pre-Assessment:
• Explain the process of evolution by natural selection.
Assessment: • Explain the process of evolution by
natural selection.

Graphic Organizer & Technology: • Concept map
Testing Skills/Questions:
Best Practices:
Resources:
Testing Vocabulary: Natural Selection Mutation Evolutionary Theory Speciation Genetic Drift Immigration Emigration
Historical/Modern Link:

Standard: Scientific Ways of Knowing Benchmark C: Explain how societal issues and considerations affect the progress of science and technology. Topic: Science and Society Indicator 11-8: Explain that the decision to develop a new technology is influenced by society opinions and demands and by cost benefit considerations. Indicator 11-9: Explain how natural and human-induced hazards present the need for humans to assess potential danger and risk. Many changes in the environment designed by humans bring benefits to society as well as cause risks. Indicator 11-10: Describe costs and trade-offs of various hazards – ranging from those with minor risk to a few people, to major catastrophes with major risk to many people. The scale of events and the accuracy with which scientists and engineers can (and cannot) predict events are important considerations.
Know
1. Cost benefit analysis • Definition of term • Tend to be biased according to which
side is performing the cost benefit analysis
• Cost of the environmental regulations is often passed on to the consumer/taxpayer.
2. Risk Assessment • Definition of term • Public and Professional opinions typically
differ in risk assessment 3. Natural Disasters
• Hurricanes, Tornadoes, Earthquakes, Tsunamis, Floods, Landslides, etc.
Do
• Examine the environmental and economic effects of natural disasters.
• Perform a cost-benefit analysis on a local environmental problem.
• Defend environmental decisions using either a risk assessment or a cost-benefit analysis.

Pre-Assessment: Assessment:
Graphic Organizer& Technology: Testing Skills/Questions:
Best Practices:
Resources:
Testing Vocabulary: Cost-Benefit Analysis Risk Assessment
Historical/Modern Link:

Standard: Life Sciences Benchmark D: Relate how biotic and abiotic global changes have occurred in the past and will continue to do so in the future. Topic: Evolutionary Theory Indicator 11-14: Describe how geologic time can be estimated by observing rock sequences and using fossils to correlate the sequences at various locations. Recognize that current methods include using the known decay rates of radioactive isotopes present in rocks to measure the time since the rock was formed. Standard: Physical Sciences Benchmark B: Recognize that some atomic nuclei are unstable and will spontaneously break down. Topic: Nature of Energy Indicator 12-11: Use the predictability of decay rates and the concept of half-life to explain how radioactive substances can be used in estimating the age of materials.
Know 1. Geologic Time
• Relative dating of rock • Fossils (fossil record) • Radioactive Dating • Half-Life
Do
• Be able to determine the approximate ages of different rock layers according to the vertical placement of the layers and fossil locations.
• Determine the age of rock according to the fossil located within the rock.
• Determine the age of a fossil given the decay rate of an isotope and the percentage of that isotope remaining in the fossil.
• Be able to determining the decay rate of an isotope when given the age of the fossil and the remaining amount of the isotope within the fossil.

Pre-Assessment: Assessment:
Graphic Organizer & Technology: Testing Skills/Questions:
Best Practices:
Resources:
Testing Vocabulary: Radioactive Dating Half-Life Relative Dating Fossil Geologic Time
Historical/Modern Link:

Standard: Life Sciences Benchmark E: Explain the interconnectedness of the components of a natural system. Topic: Diversity and Interdependence of Life Indicator 11-6: Predict some possible impacts on an ecosystem with the introduction of a non-native species. Indicator 11-7: Show how populations can increase through linear or exponential growth with corresponding effects on resource use and environmental pollution. Indicator 11-8: Recognize that populations can reach or temporarily exceed the carrying capacity of a given environment. Show that the limitation is not just the availability of space but the number of organisms in relation to resources and the capacity of earth systems to support life. Indicator 12-8: Based on the structure and stability of ecosystems and their nonliving components, predict the biotic and abiotic changes in such systems when disturbed (e.g., introduction of non-native species, climate change, etc.).

Know 1. Invasive species are non-native species that have been introduced into a new ecosystem.
• Invasive species have no natural predators in new ecosystems.
• Invasive species consume the resources of endemic species (food, habitat).
2. Linear/Exponential Growth • Know the definitions of each term. • Linear growth indicates steady growth. • Exponential growth indicates the species
is growing more with each successive generation.
• Exponential growth has the ability to consume resources faster than they are being replenished.
3. Carrying Capacity • Definition of term. • Species can exceed their carrying
capacity, but then dieback to vacillate around it according to the amount of available resources.
• Species remain at their carrying capacity when they consume resources at the same rate as they are replenished.
4. Limiting Resource • A natural resource that, when limited,
determines the carrying capacity of a population.
Do
• Draw a food web of a local ecosystem and then create a list of potential outcomes after the introduction of a non-native species.
• Create graphs with population data and determine the type of growth for that species.
• Discuss why a species might demonstrate linear or exponential growth.
• Create a concept map showing the potential outcome of a species and their ecosystem in exponential growth including resource consumption, pollution output, ecosystem changes, etc..
• Discuss if humans have ever reached their carrying capacity in history (Easter Island, Roman Empire), and if we are growing towards a new one now.
Pre-Assessment: Assessment:

Graphic Organizer & Technology: Testing Skills /Questions:
Best Practices:
Resources: • National Geographic: Easter Island
Video
Testing Vocabulary: Exponential Growth Linear Growth Carrying Capacity Biotic Potential Dieback
Historical/Modern Link: • What happened to the Maya? • What happened on Easter Island?

Standard: Life Sciences Benchmark E: Explain the interconnectedness of the components of a natural system. Topic: Diversity and Interdependence of Life Indicator 12-7: Relate diversity and adaptation to structures and functions of living organisms at various levels of organization.
Know 1. 6 Kingdoms of Organisms
• Know each Kingdom (Archaebacteria, Eubacteria, Protists, Fungi, Plants, and Animals) and their major characteristics.
2. Species Interactions • Competition – each species negatively
affects the other (also occurs within the same species).
• Predation & Parasitism – species A feeds on species B.
• Mutualism – each species is helpful to the other.
• Commensalism – species A benefits form species B, species B is unaffected.
3. Direct/Indirect Competition • Definitions of each term. • Resource Petitioning – organisms
consume the same resource at different times or in different locations.
4. Coevolution • Over time species living in symbiosis with
one anther may coevolve. • Each species may develop adaptations
that reduce the harm or improve the benefit of the relationship.
Do
• Identify each taxonomic Kingdom and it major characteristics that distinguish it from the other kingdoms.
• Create a chart with each of the major species interactions, descriptions of those interactions, and which species benefit, are harmed, or are unaffected by those interactions.
• Determine which species are in direct or indirect competition with members of the same population or other populations within their ecosystem.
• Determine how certain populations have coevolved over time.

Pre-Assessment: Assessment:
Graphic Organizer & Technology: Testing Skills/Questions:
Best Practices:
Resources:
Testing Vocabulary: Archaebacteria Eubacteria Protista Fungi Plantae Animalia Symbiosis Competition Parasitism Mutualism Commensalism Predation Direct Competition Indirect Competition Coevolution Resource Petitioning Adaptation Evolution
Historical/Modern Link:

Standard: Life Sciences Benchmark B: Explain how humans are connected to and impact natural systems. Topic: Characteristics and Structure of Life Indicator 11-5: Investigate the impact on the structure and stability of ecosystems due to changes in their biotic and abiotic components as a result of human activity. Benchmark F: Explain how human choices today will affect the quality and quantity of life on earth. Topic: Diversity and Interdependence of Life Indicator 11-9: Give examples of how human activity can accelerate rates of natural change and can have unforeseen consequences.
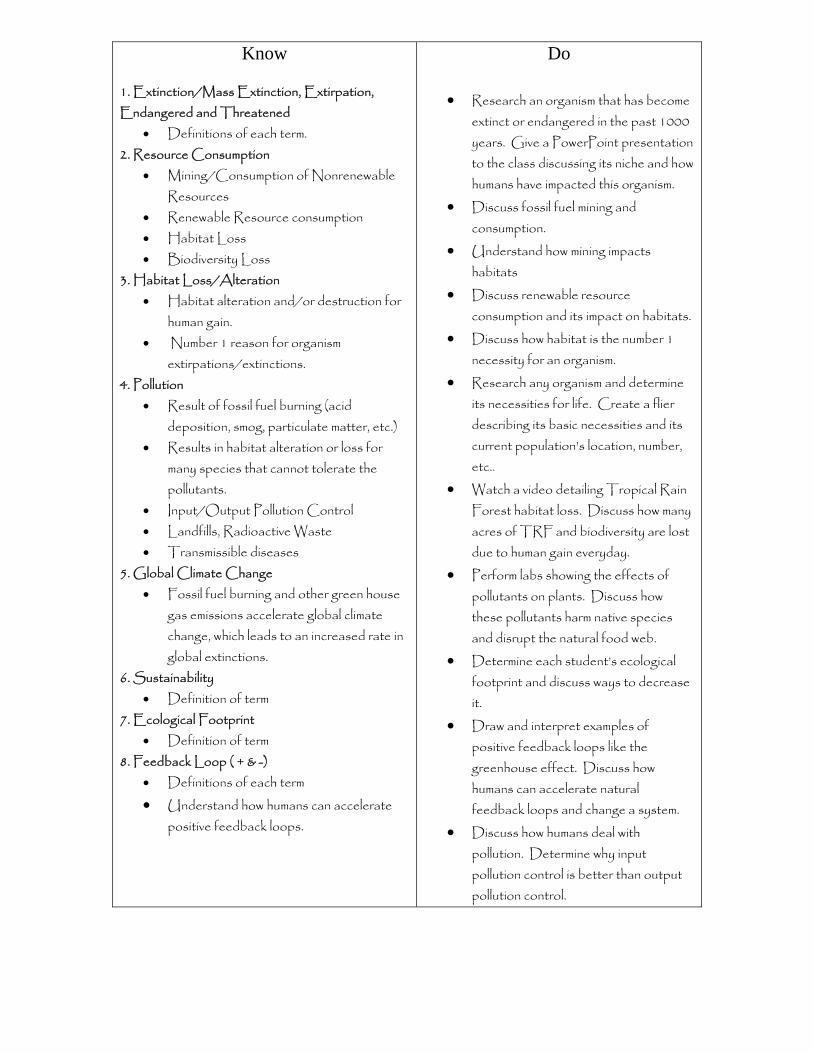
Know 1. Extinction/Mass Extinction, Extirpation, Endangered and Threatened
• Definitions of each term. 2. Resource Consumption
• Mining/Consumption of Nonrenewable Resources
• Renewable Resource consumption • Habitat Loss • Biodiversity Loss
3. Habitat Loss/Alteration • Habitat alteration and/or destruction for
human gain. • Number 1 reason for organism
extirpations/extinctions. 4. Pollution
• Result of fossil fuel burning (acid deposition, smog, particulate matter, etc.)
• Results in habitat alteration or loss for many species that cannot tolerate the pollutants.
• Input/Output Pollution Control • Landfills, Radioactive Waste • Transmissible diseases
5. Global Climate Change • Fossil fuel burning and other green house
gas emissions accelerate global climate change, which leads to an increased rate in global extinctions.
6. Sustainability • Definition of term
7. Ecological Footprint • Definition of term
8. Feedback Loop ( + & -) • Definitions of each term • Understand how humans can accelerate
positive feedback loops.
Do
• Research an organism that has become extinct or endangered in the past 1000 years. Give a PowerPoint presentation to the class discussing its niche and how humans have impacted this organism.
• Discuss fossil fuel mining and consumption.
• Understand how mining impacts habitats
• Discuss renewable resource consumption and its impact on habitats.
• Discuss how habitat is the number 1 necessity for an organism.
• Research any organism and determine its necessities for life. Create a flier describing its basic necessities and its current population’s location, number, etc..
• Watch a video detailing Tropical Rain Forest habitat loss. Discuss how many acres of TRF and biodiversity are lost due to human gain everyday.
• Perform labs showing the effects of pollutants on plants. Discuss how these pollutants harm native species and disrupt the natural food web.
• Determine each student’s ecological footprint and discuss ways to decrease it.
• Draw and interpret examples of positive feedback loops like the greenhouse effect. Discuss how humans can accelerate natural feedback loops and change a system.
• Discuss how humans deal with pollution. Determine why input pollution control is better than output pollution control.
Pre-Assessment: Assessment:
Graphic Organizer & Technology: Testing Skills/Questions:
Best Practices:
Resources:
Testing Vocabulary: Extinction Mass Extinction Extirpation Endangered Threatened Input Pollution Control Output Pollution Control Positive Feedback Loop Negative Feedback Loop Sustainability Ecological Footprint
Historical/Modern Link:

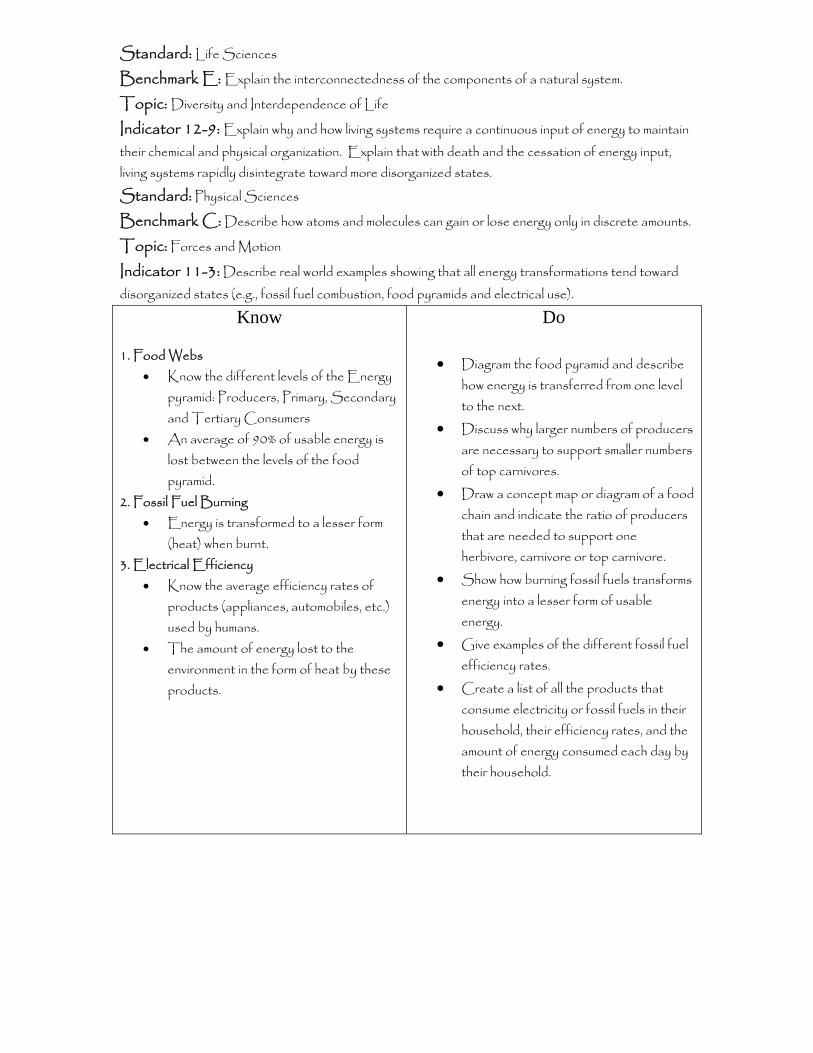
Standard: Life Sciences Benchmark E: Explain the interconnectedness of the components of a natural system. Topic: Diversity and Interdependence of Life Indicator 12-9: Explain why and how living systems require a continuous input of energy to maintain their chemical and physical organization. Explain that with death and the cessation of energy input, living systems rapidly disintegrate toward more disorganized states. Standard: Physical Sciences Benchmark C: Describe how atoms and molecules can gain or lose energy only in discrete amounts. Topic: Forces and Motion Indicator 11-3: Describe real world examples showing that all energy transformations tend toward disorganized states (e.g., fossil fuel combustion, food pyramids and electrical use).
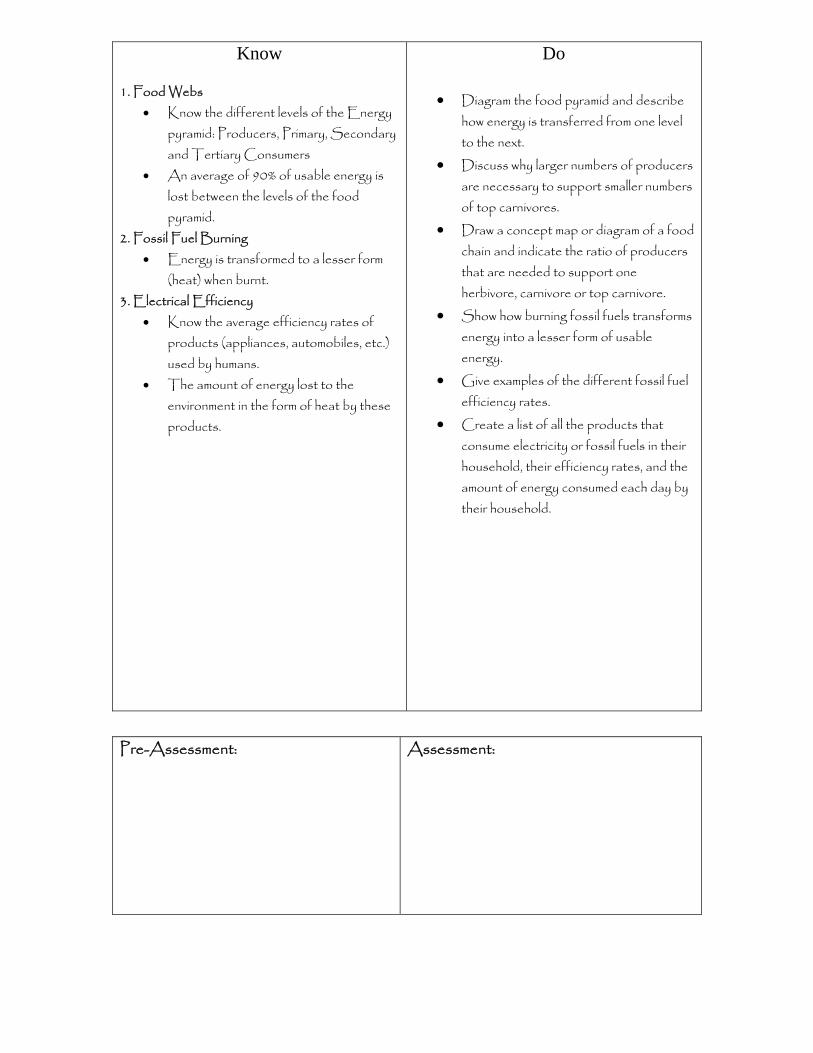
Know 1. Food Webs
• Know the different levels of the Energy pyramid: Producers, Primary, Secondary and Tertiary Consumers
• An average of 90% of usable energy is lost between the levels of the food pyramid.
2. Fossil Fuel Burning • Energy is transformed to a lesser form
(heat) when burnt. 3. Electrical Efficiency
• Know the average efficiency rates of products (appliances, automobiles, etc.) used by humans.
• The amount of energy lost to the environment in the form of heat by these products.
Do
• Diagram the food pyramid and describe how energy is transferred from one level to the next.
• Discuss why larger numbers of producers are necessary to support smaller numbers of top carnivores.
• Draw a concept map or diagram of a food chain and indicate the ratio of producers that are needed to support one herbivore, carnivore or top carnivore.
• Show how burning fossil fuels transforms energy into a lesser form of usable energy.
• Give examples of the different fossil fuel efficiency rates.
• Create a list of all the products that consume electricity or fossil fuels in their household, their efficiency rates, and the amount of energy consumed each day by their household.
Pre-Assessment: Assessment:

Graphic Organizer& Technology: Testing Skills/Questions:
Best Practices:
Resources:
Testing Vocabulary: Producer Primary Consumer Herbivore Secondary Consumer Carnivore Autotroph Heterotroph Tertiary Consumer Top Carnivore
Historical/Modern Link:
Standard: Life Sciences Benchmark E: Explain the interconnectedness of the components of a natural system. Topic: Diversity and Interdependence of Life Indicator 12-9: Explain why and how living systems require a continuous input of energy to maintain their chemical and physical organization. Explain that with death and the cessation of energy input, living systems rapidly disintegrate toward more disorganized states. Standard: Physical Sciences Benchmark C: Describe how atoms and molecules can gain or lose energy only in discrete amounts. Topic: Forces and Motion Indicator 11-3: Describe real world examples showing that all energy transformations tend toward disorganized states (e.g., fossil fuel combustion, food pyramids and electrical use).
Know 1. Food Webs
• Know the different levels of the Energy pyramid: Producers, Primary, Secondary and Tertiary Consumers
• An average of 90% of usable energy is lost between the levels of the food pyramid.
2. Fossil Fuel Burning • Energy is transformed to a lesser form
(heat) when burnt. 3. Electrical Efficiency
• Know the average efficiency rates of products (appliances, automobiles, etc.) used by humans.
• The amount of energy lost to the environment in the form of heat by these products.
Do
• Diagram the food pyramid and describe how energy is transferred from one level to the next.
• Discuss why larger numbers of producers are necessary to support smaller numbers of top carnivores.
• Draw a concept map or diagram of a food chain and indicate the ratio of producers that are needed to support one herbivore, carnivore or top carnivore.
• Show how burning fossil fuels transforms energy into a lesser form of usable energy.
• Give examples of the different fossil fuel efficiency rates.
• Create a list of all the products that consume electricity or fossil fuels in their household, their efficiency rates, and the amount of energy consumed each day by their household.

Pre-Assessment: Assessment:
Graphic Organizer& Technology: Testing Skills/Questions:
Best Practices:
Resources:
Testing Vocabulary: Producer Primary Consumer Herbivore Secondary Consumer Carnivore Autotroph Heterotroph Tertiary Consumer Top Carnivore
Historical/Modern Link:

Standard: Science and Technology Benchmark E: Predict how human choices today will determine the quality and quantity of life on Earth. Topic: Understanding Technology Indicator 11-5: Investigate that all fuels (e.g., fossil, solar and nuclear) have advantages and disadvantages; therefore society must consider the trade-offs among them (e.g., economic costs and environmental impact). Indicator 11-6: Research sources of energy beyond traditional fuels and the advantages, disadvantages and trade-offs society must consider when using alternative sources (e.g., biomass, solar, hybrid engines, wind and fuel cells).

Know 1. Coal
• The different forms of coal: Peat, Lignite, Bituminous, Subbituminous, and Anthracite
• Economic cost and environmental impact of mining, and burning coal.
• Habitat alteration possibilities of surface and subsurface coal mining.
• Pollution generated by mining and combusting coal.
• Formation, locations and amounts of the different forms of coal on Earth.
• Most abundant form (reserves) of fossil fuel on Earth (easily accessible and economical).
• SMCRA 1977 • Non-sustainable source of energy.
2. Oil • Environmental impact and economic cost
of mining, refining and combusting oil and all of its products.
• Habitat impacts of mining, burning and polluting oil products.
• Pollution generated by oil and it products (gas emissions, plastics, etc.).
• Formation, locations and amount of reserves on Earth.
• Non-sustainable source of energy. 3. Natural Gas
• Environmental impact of mining, refining and burning natural gas and all of its products.
• Economic cost of mining and combusting natural gas.
• Habitat impacts of mining and burning natural gas.
• Formation, locations and amount of reserves on Earth.
• Non-sustainable source of energy. 4. Nuclear
• Environmental impact of mining, and generating electricity and using uranium.
Do
• Discuss the different available forms of energy sources.
• Chart and compare the efficiency rates of all available forms of energy.
• Analyze the environmental impact of fossil fuels versus alternative fuel sources.
• Explain the environmental impact of both fossil fuel and alternative fuel sources.
• Perform a mining lab to examine the environmental and economic impacts of surface mining.
• Identify the remaining reserves of all fossil fuels.
• Debate which energy source is the best source for the future of the human race.
• Conduct a research project on one form of energy source to be presented to the class.

• Economic cost of mining and generating electricity using uranium.
• Habitat impacts of mining and generating electricity using uranium.
• Formation, locations and amount of reserves on Earth.
• Storage and transportation considerations of nuclear waste.
• Non-sustainable source of energy. 5. Solar
• Perpetual energy source. • Environmental impact of solar power. • Economic cost of solar power. • Passive solar heating vs. Active solar
heating • Photovoltaic cells • Sustainable source of energy.
6. Hydro • Environmental cost of hydropower. • Loss of habitat due to reservoir. • Disruption of downstream water flow. • Disruption of aquatic breeding cycles. • Economic cost of hydropower. • Sustainable source of energy.
7. Geothermal • Environmental impact of geothermal
power. • Economic cost of geothermal power. • Sustainable source of energy.
8. Wind • Environmental cost of wind power. • Clean energy source. • Interferes with migrating bird populations. • Economic cost of wind power. • Sustainable source of energy.
9. Biomass • Environmental impact of biomass power. • Pollution impact of burning biomass fuel. • Cogeneration heat source for buildings. • Economic cost of biomass power. • Sustainable source of energy.
Pre-Assessment: Assessment:
Graphic Organizer& Technology: Testing Skills/Questions:
Best Practices:
Resources:
Testing Vocabulary: Fossil Fuels Alternative Fuels Coal Oil Natural Gas Subsurface Mining Perpetual Energy Nuclear Power Geothermal Solar Wind Hydro Cogeneration Passive Solar Heating Active Solar Heating Photovoltaic Cells SMCRA 1977 Peat Lignite Bituminous Subbituminous Anthracite Surface Mining
Historical/Modern Link: