Embed Size (px)
Citation preview
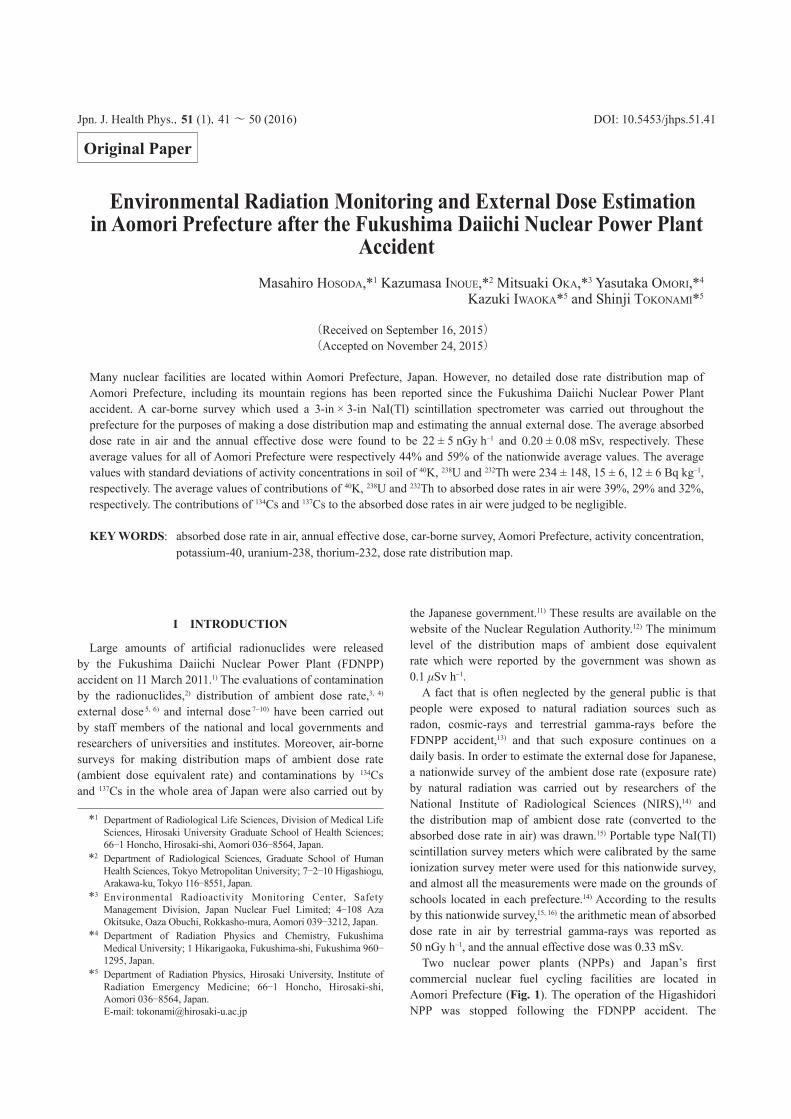
Jpn. J. Health Phys.,51 (1), 41~ 50 (2016) DOI: 10.5453/jhps.51.41
Environmental Radiation Monitoring and External Dose Estimation in Aomori Prefecture after the Fukushima Daiichi Nuclear Power Plant
AccidentMasahiro HOSODA,*1 Kazumasa INOUE,*2 Mitsuaki OKA,*3 Yasutaka OMORI,*4
Kazuki IWAOKA*5 and Shinji TOKONAMI*5
(Received on September 16, 2015) (Accepted on November 24, 2015)
Many nuclear facilities are located within Aomori Prefecture, Japan. However, no detailed dose rate distribution map of Aomori Prefecture, including its mountain regions has been reported since the Fukushima Daiichi Nuclear Power Plant accident. A car-borne survey which used a 3-in × 3-in NaI(Tl) scintillation spectrometer was carried out throughout the prefecture for the purposes of making a dose distribution map and estimating the annual external dose. The average absorbed dose rate in air and the annual effective dose were found to be 22 ± 5 nGy h–1 and 0.20 ± 0.08 mSv, respectively. These average values for all of Aomori Prefecture were respectively 44% and 59% of the nationwide average values. The average values with standard deviations of activity concentrations in soil of 40K, 238U and 232Th were 234 ± 148, 15 ± 6, 12 ± 6 Bq kg–1, respectively. The average values of contributions of 40K, 238U and 232Th to absorbed dose rates in air were 39%, 29% and 32%, respectively. The contributions of 134Cs and 137Cs to the absorbed dose rates in air were judged to be negligible.
KEY WORDS: absorbed dose rate in air, annual effective dose, car-borne survey, Aomori Prefecture, activity concentration, potassium-40, uranium-238, thorium-232, dose rate distribution map.
Original Paper
I INTRODUCTION
Large amounts of arti cial radionuclides were released by the Fukushima Daiichi Nuclear Power Plant (FDNPP) accident on 11 March 2011.1) The evaluations of contamination by the radionuclides,2) distribution of ambient dose rate,3, 4) external dose 5, 6) and internal dose 7~10) have been carried out by staff members of the national and local governments and researchers of universities and institutes. Moreover, air-borne surveys for making distribution maps of ambient dose rate (ambient dose equivalent rate) and contaminations by 134Cs and 137Cs in the whole area of Japan were also carried out by
the Japanese government.11) These results are available on the website of the Nuclear Regulation Authority.12) The minimum level of the distribution maps of ambient dose equivalent rate which were reported by the government was shown as 0.1 Sv h–1.
A fact that is often neglected by the general public is that people were exposed to natural radiation sources such as radon, cosmic-rays and terrestrial gamma-rays before the FDNPP accident,13) and that such exposure continues on a daily basis. In order to estimate the external dose for Japanese, a nationwide survey of the ambient dose rate (exposure rate) by natural radiation was carried out by researchers of the National Institute of Radiological Sciences (NIRS),14) and the distribution map of ambient dose rate (converted to the absorbed dose rate in air) was drawn.15) Portable type NaI(Tl) scintillation survey meters which were calibrated by the same ionization survey meter were used for this nationwide survey, and almost all the measurements were made on the grounds of schools located in each prefecture.14) According to the results by this nationwide survey,15, 16) the arithmetic mean of absorbed dose rate in air by terrestrial gamma-rays was reported as 50 nGy h–1, and the annual effective dose was 0.33 mSv.
Two nuclear power plants (NPPs) and Japan’s rst commercial nuclear fuel cycling facilities are located in Aomori Prefecture (Fig. 1). The operation of the Higashidori NPP was stopped following the FDNPP accident. The
*1 Department of Radiological Life Sciences, Division of Medical Life Sciences, Hirosaki University Graduate School of Health Sciences; 66–1 Honcho, Hirosaki-shi, Aomori 036–8564, Japan.
*2 Department of Radiological Sciences, Graduate School of Human Health Sciences, Tokyo Metropolitan University; 7–2–10 Higashiogu, Arakawa-ku, Tokyo 116–8551, Japan.
*3 Environmental Radioactivity Monitoring Center, Safety Management Division, Japan Nuclear Fuel Limited; 4–108 Aza Okitsuke, Oaza Obuchi, Rokkasho-mura, Aomori 039–3212, Japan.
*4 Department of Radiation Physics and Chemistry, Fukushima Medical University; 1 Hikarigaoka, Fukushima-shi, Fukushima 960–1295, Japan.
*5 Department of Radiation Physics, Hirosaki University, Institute of Radiation Emergency Medicine; 66–1 Honcho, Hirosaki-shi, Aomori 036–8564, Japan.
E-mail: [email protected]

Masahiro HOSODA, Kazumasa INOUE, Mitsuaki OKA, Yasutaka OMORI, Kazuki IWAOKA and Shinji TOKONAMI42
construction of the Oma NPP was also suspended at that time and re-started from October 2012. In the nationwide survey by NIRS, measurements of ambient dose rate were carried out at only 23 points in Aomori Prefecture 14) and these were not enough to draw a detailed dose rate distribution map of the prefecture. IYOGI et al.17) measured absorbed dose rate in air at 109 points in residential areas of Aomori Prefecture using radio-photoluminescence glass dosimeters (RPLGDs), and they provided the rst reported dose rate distribution map of the prefecture. Their survey included suf cient data to estimate the external dose for residents. However, in order to draw a more detailed dose rate distribution map of Aomori Prefecture which has many nuclear industries, it is necessary to make measurements at many more locations, including mountain regions.
According to air-borne survey results made available by the Nuclear Regulation Authority 12) for the northern Tohoku region, consisting of Aomori, Iwate, and Akita Prefectures, the observed ambient dose rates were below 0.1 Sv h–1 for almost all areas. Environment radiation monitoring at xed points around the nuclear fuel cycling facilities at Rokkasho Village (Nos. 21 and 22 in Fig. 1) is carried out by the local government, and the monitoring results have been used to discuss the dose contribution from the arti cial radionuclides by the FDNPP accident.18) However, no dose rate distribution map for all of Aomori Prefecture since the FDNPP accident has been obtained.
In this study, a car-borne survey for all of Aomori Prefecture, including its mountain regions, was carried out to
draw a detailed dose rate distribution map using the survey results. Additionally, an external dose estimation was carried out using the obtained data.
II MATERIALS AND METHODS
1. Survey routeA car-borne survey which used a 3-in × 3-in NaI(Tl)
scintillation spectrometer (EMF-211, EMF Japan Co., Japan) was carried out from the 12th to the 18th in August 2013. The survey route covered all 40 cities of Aomori Prefecture and it is shown in Fig. 1. This route map was drawn using the Generic Mapping Tools (GMT) created by WESSEL and SMITH.19) Measurements of the counts inside the car were carried out every 30 s along the route. Simultaneously with the gamma-ray count measurements, the latitude and longitude at each measurement point were measured with a global positioning system (GPS). Car speed was kept at 40–60 km h–1 for ordinary roads and 20–40 km h–1 for mountain regions. The estimated distances between measurement points ranged from 170 m to 500 m. The weather, except from 16:30–17:10 on the 16th of August, was sunny or cloudy throughout the entire measurement period. Count rates which were in uenced by rain on the 16th were re-measured on the 18th. Thus, the estimated absorbed dose rates in air were not affected by rainfall. The total distance of the car-borne survey was 2,501 km.
2. Evaluation of the conversion factor to the a sor ed dose rate in air
Fi g. 1 The route map in Aomori Prefecture and measurement points of gamma-ray pulse height distribution using a NaI(Tl) scintillation spectrometer.

Environmental Radiation Monitoring and External Dose Estimation in Aomori Prefecture after the Fukushima Daiichi Nuclear Power Plant Accident 43
The detailed method of the car-borne survey was described in previous reports by the authors 20~22); only an outline is described here. The NaI(Tl) scintillation counting system used can provide the absorbed dose rate in air using the response matrix method while the car is being driven.23, 24) However, photon peaks obtained with the NaI(Tl) scintillation detector are affected by temperature.25) Furthermore, it is dif cult to obtain the photon peak for each gamma-ray energy in a 30-s measurement in the natural environment. Thus, the accuracy of the energy calibration will be low for these reasons. Accordingly, the relationship between the total counts per minute (cpm) of a gamma-ray pulse height distribution and an absorbed dose rate in air (nGy h–1) was examined for the estimation of dose rate conversion factor (nGy h–1 cpm–1). Measurements of gamma-ray pulse height distributions were carried out 1 m above the ground surface at 35 points along the survey route. Counting time at each measurement point was set as 900 s. The gamma-ray pulse height distributions were unfolded using a 22 × 22 response matrix for the estimation of absorbed dose rate in air.23, 24)
3. Evaluation of the shielding factor y car odySince count rate is measured inside the car, it is necessary to
estimate a shielding factor of the car body towards terrestrial gamma-rays in order to represent the unshielded external dose rate.26) The shielding factor was estimated by making measurements inside and outside the car at 73 points and correcting them with the inside count rates. Measurements of the count were recorded over consecutive 30 s intervals during a total recording period of 2 min.
4. Evaluation of the effect of pavement cover on measurementIn order to evaluate the effect of pavement cover toward the
absorbed dose rate in air, measurements of count rates on the soil surface and the pavement were carried out at 20 points. Measurements on the soil surface and the pavement were also individually set for the recording period of 2 min.
5. Analysis of the activity concentrations in soil of 40K, 238U and 232ThMeasurements of the gamma-ray pulse height distributions
were carried out 1 m above the ground surface at the 25 points in Fig. 1. These measurement points were included in the 35 points used for evaluation of the conversion factor to the absorbed dose rate in air. In order to evaluate the activity concentration in soil, ten measurements taken above the pavement were not used for this analysis. The gamma-ray pulse height distributions were unfolded using a 22 × 22 response matrix for the analysis of activity concentrations in soil of 40K, 238U and 232Th and the contributions of their nuclides to absorbed dose rate in air.23, 24) By following the method presented in references by MINATO,23, 24) a gamma-ray pulse height distribution obtained by measurements was converted to the energy bin spectrum of incident gamma-rays which is a distribution of gamma-ray ux density to each energy bin. In this method, each channel of a multi-channel
analyzer was divided into unequal intervals as energy bins in the gamma-ray energy range from 0 to 3.2 MeV. The gamma-ray energies over 3.2 MeV were not included for evaluation, since the maximum value of the gamma-ray energy from natural radionuclides is 2.615 MeV which is emitted from 208Tl. The energy ranges were set up so that the gamma-rays of 1.464 MeV from 40K, 1.765 MeV and 2.205 MeV from 214Bi (238U-series) and 2.615 MeV from 208Tl (232Th-series) could be stored in each bin, individually. A 22 × 22 matrix for the 3-in ×3-in NaI(Tl) scintillator for an isotropic eld was calculated using the Monte Carlo code, SPHERIX.27) The gamma-ray
ux density and dose rate per unit solid angle are considered almost isotropic in the natural environment.28) The contribution of cosmic-rays to the gamma-ray pulse height distribution was subtracted using the energy bin number 22 which was stored as the gamma-ray energy range from 3.0 to 3.2 MeV. Moreover, the contribution of 40K contamination due to photo-multiplier tube was also subtracted from the gamma-ray pulse height distribution. Clear peaks from 40K (bin number 14, energy range: 1.39–1.54 MeV), 214Bi (bin numbers 16 and 18; energy range, 1.69–1.84 MeV and 2.10–2.31 MeV) and 208Tl (bin number 20; energy range, 2.51–2.72 MeV) were observed in the unfolded spectrum of the gamma-ray pulse height distribution. The activity concentrations of the 238U, 232Th and 40K could be estimated by comparing them with the theoretically evaluated gamma-ray ux density spectrum due to these nuclides. In order to evaluate each activity concentration of the natural radionuclides from an energy bin spectrum, it is necessary to calculate the gamma-ray ux densities per unit activity concentration of the 238U, 232Th and 40K. The primary and scattered gamma-ray ux densities per unit activity concentration could be calculated using the one-dimensional Monte Carlo gamma transport code, MONARIZA/G2.29) A total of one million histories were traced for each natural radionuclide. The nuclear data of gamma-ray energies and disintegration rates used the values reported by BECK 30) and BECK et al.31) for this Monte Carlo simulation. The activity concentration of each natural radionuclide was evaluated by a successive approximation which used a 3 × 3 matrix determined by MINATO 24) to the values of energy bins for 40K, 238U and 232Th. Incidentally, the energy resolutions of the photon peak from each natural radionuclide have wide variations for commercially available scintillators. So a diagonal element tting (DEF) technique which was developed by MINATO 24) was used in this calculation. A new matrix was reconstructed easily and quickly from the standard response matrix using this DEF technique. This calculation assumed that a semi-in nite volume source was formed in the ground.23, 24) Counting time at each measurement point was set as 900 s. The relative standard deviations for absorbed dose rate in air and activity concentrations in soil for 40K, 238U and 232Th obtained using this software depend on the integral absorbed dose (nGy) at each measurement point,32) and these were evaluated in this study as 2–3%, 2–4%, 6–13% and 4–9%, respectively. Since the standard uncertainties of these values were not reported in the literature,32) these relative standard deviations were used in the present analysis.

Masahiro HOSODA, Kazumasa INOUE, Mitsuaki OKA, Yasutaka OMORI, Kazuki IWAOKA and Shinji TOKONAMI44
III RESULTS AND DISCUSSION
1. Correction factors for count ratesA correlation between absorbed dose rate in air (nGy h–1)
which was calculated by software using the 22 × 22 response matrix method and total count rate (cpm) outside the car is shown in Fig. 2. The dose rate conversion factor and the standard uncertainty were evaluated as 1.9 × 10⁻³ and 2.2 ×10⁻⁵ (nGy h–1 cpm–1), respectively. The difference in the abundance ratio of 238U, 232Th and 40K at the measurement points may in uence variation of the dose rate conversion factor. However, the relative standard deviation of the ratios of total count rates and the absorbed dose rates in air at each measurement point in this study was 8.0%. Thus, this result suggests that the difference among measurement points for the dose rate conversion factor is likely negligible.
According to many previous reports,3, 20, 21, 33~39) the shielding factors due to the body of passenger cars depend on the car type, and these values range from 1.3 to 1.9. A correlation between count rates outside and inside the car is shown in Fig. 3, and the shielding factor and the standard uncertainty were evaluated as 1.50 and 0.01, respectively. Thus, this estimated value was similar to the previously reported value.
From comparison of the measured count rates on pavement and soil (unsealed) surfaces, the average value of count rates on the soil surface was approximately 4% higher than that on the pavement surface. Thus, the effect of cover on soil toward the absorbed dose rate in air was negligible. Similar results were reported for measurements made in other prefectures.33, 34) Moreover, this result suggests that the pavements were constructed using rocks which came from nearby locations.
Thus, the absorbed dose rate in air (Dout) 1 m above the
ground surface at each measurement point can be estimated using Eq. (1).
Dout = 2Nin × 1.50 × (1.9 × 10–3) (1)
In this study, the counts (Nin) inside the car were obtained by the measurements for 30 s. Since the dose rate conversion factor was given as dose rate (nGy h–1) for counts per minute (cpm) it is necessary to double Nin in order to convert it into the counts per minute.21)
The standard uncertainty of one time measurement can be given as a standard deviation of the measured value. The values of Nin were distributed from 1,789 to 8,970 (counts per 30 s). The standard uncertainties depend on the counts, and they were given as 85 to 189 (counts per 30 s). These standard uncertainties were converted to the relative standard uncertainties to estimate the combined relative standard uncertainty, and they ranged from 2.1% to 4.8%. Relative standard uncertainties for dose rate conversion factor and shielding factor were 1.2% and 0.67%, respectively. Thus, the maximum value of the combined relative standard uncertainty to the estimated absorbed dose rate in air by this method was evaluated as 4.9%.
2. Distri ution of the a sor ed dose rate in airThe distribution map of absorbed dose rate in air of
Aomori Prefecture is shown in Fig. 4. This map was drawn using 7,425 data which excluded the data that could have been in uenced by rain. This map was also drawn using the GMT. A minimum curvature algorithm was used for the data interpolation by GMT. This is the method for interpolating data by presuming a smooth curved surface from the data of each point. According to the explanation accompanying the geological map for Aomori Prefecture,40) loam which was
Fi g. 2 Correlation between absorbed dose rate in air which was calculated by software using the response matrix method and total count rate outside the car. The slope of this regression line was used as the dose rate conversion factor.
Fi g. 3 Correlation between count rates outside and inside the car. The slope of this regression line was used as the shielding factor of the car body.

Environmental Radiation Monitoring and External Dose Estimation in Aomori Prefecture after the Fukushima Daiichi Nuclear Power Plant Accident 45
deposited from the Pliocene to Pleistocene epochs is widely distributed in the N1 area. Moreover, alluvium (forming the Tsugaru plain) is distributed in the T2 area. It was reported that the absorbed dose rates in air for loam and alluvium of N1 and T2 areas were lower than those of other types of weathered rocks.34, 41) Thus, the absorbed dose rates in air in N1 and T2 were observed as lower values. In the N2 area, andesitic lava and pyroclastic rocks and rhyolitic (dacitic) lava and pyroclastic rocks (middle-upper Miocene epoch) are distributed. Absorbed dose rates in air for these materials were reported as being at a relatively low level.42, 43) Cretaceous granodiorite is distributed in part of the T1 area, and absorbed dose rates in air around this bedrock area were found to be 25–40 nGy h–1. According to MINATO,41) the absorbed dose rate in air in a granodiorite area is relatively lower than that in areas of other granite groups. Moreover, absorbed dose rates in air exceeding 50 nGy h–1 were observed around Mt. Shirakami in the T1 area. Cretaceous granodiorite and lower to upper Miocene sedimentary rocks (including andesitic lava and pyroclastic rocks) which have relatively low level dose rates are distributed around T1.40) However, since T1 is primarily mountainous, cliffs are found along most of the roadsides.
Thus, the relatively high level dose rates in the T1 area might be in uenced by gamma-rays emitted from exposed rocks of the cliffs. Absorbed dose rates in air at the T3 area were similarly observed as approximately 50 nGy h–1. Middle-upper Miocene andesitic lava and pyroclastic rocks and mudstone which are reported to have a low level dose rate are distributed in this area.40) It might be considered that this area was also in uenced by gamma-rays emitted from the exposed rock of roadside cliffs.
The frequency distribution of absorbed dose rates in air obtained by the car-borne survey is shown in Fig. 5. Normality of the distribution of the obtained values was evaluated using the Kolmogorov-Smirnov test by EZR,44) and the signi cance level was set as p < 0.05. Although these statistic results were not observed as a normal distribution, the standard deviations to the results obtained in this study were evaluated for comparison with the results by other researchers. Absorbed dose rates in air for the Tsugaru and Nanbu areas, and the whole prefectural area ranged from 14 to 51, 10 to 45, and 10 to 51 nGy h–1, respectively. The medians and geometric means (averages and standard deviations) of absorbed dose rates in air for the Tsugaru and Nanbu areas (indicated in Fig. 1),
Fi g. 4 The distribution map of absorbed dose rate in air in Aomori Prefecture. Mt. Iwaki shown with the white triangle is one of the landmarks of Aomori Prefecture and, as the highest mountain in the prefecture, has an elevation of 1,624 m. The areas of T1, T2, T3, N1 and N2 were classi ed roughly according to the geological map.40)

Masahiro HOSODA, Kazumasa INOUE, Mitsuaki OKA, Yasutaka OMORI, Kazuki IWAOKA and Shinji TOKONAMI46
and the whole prefectural area were evaluated as 21 and 22 (22 ± 5), 20 and 20 (21 ± 5), and 21 and 21 (22 ± 5) nGy h–1, respectively. The average value for all of Japan was reported as 50 nGy h–1 by FURUKAWA and SHINGAKI.15) Thus, the average value of Aomori Prefecture was found to be 44% of the average value for all of Japan.
3. Activity concentrations in soil and the effect of the FDNPP accidentThe results of activity concentrations in soil and the
contributions of 40K, 238U and 232Th to absorbed dose rate in air obtained by spot measurements are summarized in Ta le 1. The average values with standard deviations (range and median) of activity concentrations in soil of 40K, 238U and 232Th were 234 ± 148 (95–776, 192), 15 ± 6 (9–34, 15), 12 ± 6 (5–33, 11) Bq kg–1, respectively. According to the UNSCEAR,13) the current worldwide average values of these nuclides are 412, 32 and 45 Bq kg–1, respectively. The obtained average activity concentrations were compared with these worldwide average values, and they represented 57% of the worldwide average for 40K, 48% for 238U, and 27% for 232Th. According to the explanation included with the geological map for Aomori Prefecture,40) loam and other material deposits from the Holocene epoch that include low level natural radionuclides were distributed widely at almost all in-situ measurement points of the present survey.
In the present study, the average values (range and median) of contributions of 40K, 238U and 232Th to absorbed dose rates in air were 39% (28–54%, 40%), 29% (19–46%, 29%) and 32% (25–45%, 32%), respectively. The contributions of these nuclides to the dose rates were similar in value.
According to the recent report by KUDO et al.,18) 134Cs and 137Cs were observed in pine needles and pasture grass collected in Aomori Prefecture from April 2011 to December 2013. However, in the present study, no photon peaks due to 134Cs and 137Cs were observed in the gamma-ray pulse
height distributions which were obtained at all 35 survey measurement points. These results suggested that the contributions to the photon peaks from 134Cs and 137Cs at the survey measurement points were much lower than those from the natural radionuclides. It is well known that the energy resolution of NaI(Tl) scintillation detectors is lower than that of high purity germanium detectors and that some key radiocesium photon peaks cannot be resolved from those of natural radionuclides, e.g. those due to 214Bi and 134Cs at approximately 609 and 605 keV, respectively. However, other radiocesium photon peaks that are not interfered with by peaks of natural radionuclides, such as the peak at 795 keV, were not detected. Thus, the results obtained suggest that the contributions of 134Cs and 137Cs to the dose rates are likely negligible.
4. External dose estimationAnnual external doses (E) for the entire prefectural area,
and the Tsugaru and Nanbu areas were estimated using Eq. (2).
E = D × DCF × T × (Qin × R + Qout) (2)
Here, D is the absorbed dose rate in air (nGy h–1), DCF is the dose conversion factor from the absorbed dose in air to the external effective dose for adults, T is 8,760 h (24 h × 365 d), Qin and Qout are indoor and outdoor occupancy factors, and R is the ratio of indoor dose rate to outdoor dose rate in a 24-h period.17)
The DCF value of 0.748 ± 0.007 Sv Gy–1 was obtained experimentally for natural gamma-rays in various environments by MORIUCHI et al..45) It should be noted that this DCF value was obtained as the conversion factor from absorbed dose rate in air to effective dose equivalent. On the other hand, the value of 0.7 Sv Gy–1 which was reported by UNSCEAR is generally used for external dose estimation.13) However, it has been reported that the external effective dose using this value was 6% lower than that using 0.748 Sv Gy–1.45)
Fi g. 5 Histogram of absorbed dose rates in air obtained by car-borne survey in Aomori Prefecture.

Environmental Radiation Monitoring and External Dose Estimation in Aomori Prefecture after the Fukushima Daiichi Nuclear Power Plant Accident 47
According to the results of the Monte Carlo simulation by SAITO et al.,46) effective dose was less than 10% lower than the effective dose equivalent. These results were obtained using the parameters given by the International Commission on Radiological Protection (ICRP) Publication 60.47) The tissue weighting factor was revised in ICRP Publication 103,48) so it will be necessary to revise the DCF for effective dose. However, no revised DCF for effective dose has been published yet. Thus, the value obtained by MORIUCHI et al. was used as DCF for a conservative dose estimation in this study.
Detailed data on the average time spent on various activities for men and women above 10 years of age in Aomori Prefecture were summarized by the Ministry of Internal Affairs and Communications, Japan (MIC).49) Furthermore, data for the working population above 15 years of age in Aomori Prefecture were also summarized by MIC.50) These values are listed together with the values reported by IYOGI et al.17) in Ta le 2. The indoor and outdoor occupancy factors were decided as 0.92 and 0.08, respectively, according to the above data. The values evaluated in this study were similar to the values reported by IYOGI et al.,17) and were used for the external dose estimation.
The ratios of the indoor dose rate to the outdoor dose rate in Aomori Prefecture were also reported by IYOGI et al. In the Tsugaru area, Nanbu area, and the entire prefectural area, these ratios were 1.42 ± 0.26, 1.39 ± 0.25, and 1.48 ± 0.35,
respectively.17)
IYOGI et al.17) did not nd a seasonal variation for the effective dose. Thus, annual effective doses to the residents were considered without seasonal variation in the present study. Annual effective doses for the Tsugaru and Nanbu areas, and the whole prefectural area ranged from 0.12 to 0.45, 0.10 to 0.43, and 0.10 to 0.45 mSv, respectively. The medians and geometric means (averages and standard deviations) of annual effective doses for the Tsugaru area, Nanbu area, and the entire prefectural area were estimated to be 0.18 and 0.19 (0.20 ± 0.06), 0.19 and 0.19 (0.20 ± 0.07), and 0.18 and 0.19 (0.20 ± 0.08) mSv, respectively. In the previous study,17) the annual effective doses in the three areas were 0.26 ± 0.04, 0.22 ± 0.04, and 0.24 ± 0.04 mSv, respectively. IYOGI et al.17) measured absorbed dose rates mainly in residential areas, and their measurement technique was quite different from the present one. Furthermore, 17 years have passed since their survey was completed in 1996, and environment conditions are likely to have changed, even though only slightly. The external dose estimation method in this study was different from that used by IYOGI et al. Thus, although it is dif cult to compare these external doses directly, the annual effective doses seemed to have generally good agreement. Additionally, the nationwide average of the annual effective dose by terrestrial gamma-rays 16) is 0.33 mSv, and the average value for all of Aomori Prefecture was 59% of the nationwide average value.
Ta le 1 The measured activity concentrations and the contributions of 40K, 238U and 232Th to absorbed dose rate in air.
No.a Area Measurement siteLatitude
(°)Longitude
(°)
Absorbed dose rate in air (nGy h–1)
Contribution to the dose rate(%)
Activity concentration(Bq kg–1)
40K 238U 232Th 40K 238U 232Th1 Tsugaru Hirosaki City 40.6044 140.4632 24 ± 1 39 27 34 246 ± 6 16 ± 2 14 ± 12 Tsugaru Hirosaki City 40.6038 140.4931 20 ± 1 40 31 29 200 ± 6 15 ± 2 9 ± 13 Tsugaru Hirosaki City 40.5888 140.4715 27 ± 1 34 36 30 228 ± 5 23 ± 2 13 ± 14 Tsugaru Owani Town 40.5070 140.5770 24 ± 1 36 30 34 208 ± 5 17 ± 2 13 ± 15 Tsugaru Hirakawa City 40.5627 140.5369 24 ± 1 43 29 28 252 ± 6 17 ± 2 11 ± 16 Tsugaru Kuroishi City 40.6348 140.6102 14 ± 0 (< 1) 43 31 27 148 ± 5 10 ± 1 6 ± 17 Tsugaru Inakadate Village 40.6388 140.5669 16 ± 1 42 30 28 181 ± 5 12 ± 1 8 ± 18 Tsugaru Fujisaki Town 40.6707 140.5470 18 ± 1 40 28 32 185 ± 5 12 ± 1 10 ± 19 Tsugaru Itayanagi Town 40.6993 140.4540 23 ± 1 43 32 25 247 ± 7 18 ± 2 9 ± 1
10 Tsugaru Aomori City 40.7845 140.7812 27 ± 1 29 31 40 192 ± 5 19 ± 2 17 ± 111 Tsugaru Nakadomari Town 40.9320 140.4159 23 ± 1 43 29 28 237 ± 6 15 ± 2 10 ± 112 Tsugaru Fukaura Town 40.5761 140.0107 60 ± 1 52 19 29 776 ± 14 28 ± 2 28 ± 113 Tsugaru Fukaura Town 40.4552 139.9425 53 ± 1 39 25 36 553 ± 11 34 ± 3 33 ± 114 Tsugaru Nishimeya Village 40.5794 140.2999 22 ± 1 33 29 38 180 ± 5 15 ± 1 13 ± 115 Tsugaru Nishimeya Village 40.4833 140.2764 32 ± 1 54 20 26 413 ± 9 14 ± 1 13 ± 116 Nanbu Sai Village 41.3935 140.9162 25 ± 1 48 24 29 285 ± 7 13 ± 1 11 ± 117 Nanbu Mutsu City 41.3390 141.0542 15 ± 0 (< 1) 29 46 25 95 ± 3 15 ± 2 5 ± 0 (< 1)18 Nanbu Mutsu City 41.1684 140.8057 27 ± 1 35 26 38 209 ± 5 15 ± 1 14 ± 119 Nanbu Higashidori Village 41.2799 141.3345 14 ± 0 (< 1) 29 26 45 104 ± 4 9 ± 1 10 ± 120 Nanbu Yokohama Town 41.0842 141.2568 21 ± 1 33 32 35 157 ± 4 15 ± 1 11 ± 121 Nanbu Rokkasho Village 41.0625 141.3640 15 ± 1 41 28 31 156 ± 5 10 ± 1 7 ± 122 Nanbu Rokkasho Village 40.9792 141.3712 16 ± 1 40 26 34 150 ± 4 9 ± 1 8 ± 123 Nanbu Towada City 40.6140 141.2144 14 ± 0 (< 1) 36 29 34 122 ± 4 9 ± 1 7 ± 124 Nanbu Shichinohe Town 40.5865 141.1159 21 ± 1 28 31 41 161 ± 4 17 ± 2 15 ± 125 Nanbu Shingo Village 40.4375 141.1236 17 ± 1 42 24 34 169 ± 5 9 ± 1 9 ± 1
a The numbers refer to the designations in Fig. 1

Masahiro HOSODA, Kazumasa INOUE, Mitsuaki OKA, Yasutaka OMORI, Kazuki IWAOKA and Shinji TOKONAMI48
IV CONCLUSIONS
The car-borne survey using a NaI(Tl) scintillation spectrometer was carried out in Aomori Prefecture, Japan, for the purposes of making a dose distribution map and estimating external dose of Aomori residents. The following results were obtained.1) The average absorbed dose rates in air were found to be
22 ± 5 nGy h–1 for the Tsugaru area, 21 ± 5 nGy h–1 for the Nanbu area, and 22 ± 5 nGy h–1 for the whole prefecture.
2) The average annual effective doses were estimated to be 0.20 ± 0.06 mSv for the Tsugaru area, 0.20 ± 0.07 mSv for the Nanbu area, and 0.20 ± 0.08 mSv for the whole prefecture. The annual effective doses obtained in this and previous studies seemed to have generally good agreement.
3) The contributions to the photon peaks from 134Cs and 137Cs at the survey measurement points might be much lower than those from the natural radionuclides. Thus, the contributions of 134Cs and 137Cs to the dose rates would be reasonably judged as negligible.
4) The dose rate distribution map obtained in this study provides useful information to Aomori Prefecture residents on dose rate at arbitrary points in the prefecture.
ACKNOWLEDGEMENTS
This work was partly supported by a Hirosaki University
Grant for Exploratory Research by Young Scientists (2013). The authors would like to thank the relevant local governments, Prof. Michikuni SHIMO of Fujita Health University and Mr. Masanori YACHI of Hirosaki University for their kind assistance in carrying out this study.
REFERENCES
Atomic Radiation; UNSCEAR 2013 report annex A: Levels and effects of radiation exposure due to the nuclear accident after the 2011 Great East-Japan Earthquake and Tsunami. Available at: http://www.unscear.org/docs/reports/2013/14-06336_Report_2013_Annex_A_Ebook_website.pdf. Accessed 6 November 2015.
2) K. SAITO, I. TANIHARA, M. FUJIWARA, T. SAITO, S. SIMOURA, T. OTSUKA, Y. ONDA, M. HOSHI, Y. IKEUCHI, F. TAKAHASHI, N. KINOUCHI, J. SAEGUSA, A. SEKI, H. TAKEMIYA and T. SHIBATA; Detailed deposition density maps constructed by large-scale soil sampling for gamma-ray emitting radioactive nuclides from the Fukushima Dai-ichi Nuclear Power Plant accident, ., 139, 308–319 (2015).
3) M. HOSODA, S. TOKONAMI, A. SORIMACHI, S. MONZEN, M. OSANAI, M. YAMADA, I. KASHIWAKURA and S. AKIBA; The
Fukushima nuclear crisis, Sci. Rep., 1, 87 (2011) DOI: 10.1038/srep00087.
4) M. ANDOH, Y. NAKAHARA, S. TSUDA, T. YOSHIDA, F.
Ta le 2 The average time per day spent on various activities for men and women above 10 years of age living in Aomori Prefecture.
ActivityTime (h)
Indoors OutdoorsMIC 49) IYOGI et al. 17) MIC 49) IYOGI et al. 17)
Sleeping 8.02 8.05Personal care 1.30 1.13Eating meals 1.63 1.65Commuting 0.37 0.40Working a 2.49 2.64 0.98 1.55School work 0.63 0.75House keeping 1.42 1.28Nursing 0.05 0.05Child care 0.18 0.18Shopping 0.38 0.32Moving 0.42 0.33Reading, Watching TV 2.72 2.68Resting 1.62 1.28Study and research 0.15 0.15Hobbies and amusements 0.67 0.53Sports 0.18 0.17Community and volunteer activities 0.03 0.03Activities with friends 0.23 0.37Medical examination or treatment 0.15 0.12Other activities 0.37 0.30Sum 22.04 21.52 1.95 2.45Occupancy factor 0.92 0.90 0.08 0.10a Divided according to the working population in Aomori Prefecture.50)

Environmental Radiation Monitoring and External Dose Estimation in Aomori Prefecture after the Fukushima Daiichi Nuclear Power Plant Accident 49
TAKAHASHI, S. MIKAMI, N. KINOUCHI, T. SATO, M. TANIGAKI, K. TAKEMIYA, N. SATO, R. OKUMURA, Y. UCHIHORI and K. SAITO; Measurement of air dose rates over a wide area around the Fukushima Dai-ichi Nuclear Power Plant through a series of car-borne surveys, J. Environ.
., 139, 266–280 (2015).5) K. AKAHANE, S. YONAI, S. FUKUDA, N. MIYAHARA, H.
YASUDA, K. IWAOKA, M. MATSUMOTO, A. FUKUMURA and M. AKASHI; NIRS external dose estimation system for Fukushima residents after the Fukushima Dai-ichi NPP accident, Sci. Rep. 3, 1670 (2012) DOI: 10.1038/srep01670.
6) T. ISHIKAWA, S. YASUMURA, K. OZASA, G. KOBASHI, H. YASUDA, M. MIYAZAKI, K. AKAHANE, S. YONAI, A. OHTSURU, A. SAKAI, R. SAKATA, K. KAMIYA and M. ABE; The Fukushima Health Management Survey: estimation of external doses to residents in Fukushima Prefecture, Sci. Rep., 5, 12712 (2015) DOI: 10.1038/srep12712.
7) S. TOKONAMI, M. HOSODA, S. AKIBA, A. SORIMACHI, I. KASHIWAKURA and M. BALANOV; Thyroid doses for evacuees from the Fukushima nuclear accident, Sci. Rep., 2, 507 (2012) DOI: 10.1038/srep00507.
8) R. S. HAYANO, M. TSUBOKURA, M. MIYAZAKI, H. SATOU, K. SATO, S. MASAKI and Y. SAKUMA; Internal radiocesium contamination of adults and children in Fukushima 7 to 20 months after the Fukushima NPP accident as measured by extensive whole-body-counter surveys, Ser. B Phys. Biol. Sci., 89 (4), 157–163 (2013).
9) M. HOSODA, S. TOKONAMI, S. AKIBA, O. KURIHARA, A. SORIMACHI, T. ISHIKAWA, T. MOMOSE, T. NAKANO, Y. MARIYA and I. KASHIWAKURA; Estimation of internal exposure of the thyroid to 131I on the basis of 134Cs accumulated in the body among evacuees of the Fukushima Daiichi Nuclear Power Station accident, Environ. Int., 61, 73–76 (2013).
10) E. KIM, O. KURIHARA, K. TANI, Y. OHMACHI, K. FUKUTSU, K. SAKAI and M. AKASHI; Intake ratio of 131I to 137Cs derived from thyroid and whole-body doses to Fukushima residents, . 168 (3), 408–418 (2015).
11) Y. SANADA, T. SUGITA, Y. NISHIZAWA, A. KONDO and T. TORII; The aerial monitoring in Japan after the Fukushima Daiichi nuclear power plant accident, Prog. Nucl. Sci. Tech., 4, 76–80 (2014).
12) Nuclear Regulation Authority; Monitoring information of environmental radioactivity level. Available at: http://radioactivity.nsr.go.jp/ja/contents/5000/4900/24/ 1990_1125_2.pdf. Accessed 10 September 2015.
of Atomic Radiation; UNSCEAR 2008 report to the general assembly with scientific annexes: United Nations. Available at: http://www.unscear.org/docs/reports/2008/09-86753_Report_2008_Annex_B.pdf. Accessed 6 November 2015.
14) S. ABE, K. FUJITAKA, M. ABE and K. FUJIMOTO; Extensive J. Nucl. Sci.
Technol., 18 (1), 21–45 (1981).15) M. FURUKAWA and R. SHINGAKI; Terrestrial gamma radiation
dose rate in Japan estimated before the 201l Great East
Japan Earthquake, ., 1, 11–16 (2012).16) M. HOSODA, S. TOKONAMI and M. FURUKAWA; Dose
assessment on natural radiation, natural radionuclide, and
accident, ., 47, 22–45 (2012). (in Japanese)
17) T. IYOGI, S. UEDA, S. HISAMATSU, K. KONDO, H. HARUTA, H. KATAGIRI, M. KURABAYASHI, Y. NAKAMURA and N. TSUJI; Environmental gamma-ray dose rate in Aomori Prefecture, Japan, Health Phys., 82 (4), 521–526 (2002).
18) S. KUDO, K. IGARASHI and H. KIMURA;Fukushima Dai-ichi Nuclear Power Plant accident on environmental radioactivity in Aomori Prefecture, Prot. Dosim. 167 (1–3), 353–357 (2015).
19) P. WESSEL and W. SMITH; Free software helps map and display data, Eos. Trans. AGU, 72 (41), 441–446 (1991).
20) K. INOUE, M. HOSODA, Y. SHIROMA, M. FURUKAWA, M. FUKUSHI, K. IWAOKA and S. TOKONAMI; Changes of ambient gamma-ray dose rate in Katsushika Ward, metropolitan Tokyo before and after the Fukushima Daiichi Nuclear Power Plant accident, ., 303, 2159–2163 (2015).
21) M. HOSODA, S. TOKONAMI, Y. OMORI, S. K. SAHOO, S. AKIBA, A. SORIMACHI, T. ISHIKAWA, R. R. NAIR, P. A. JAYALEKSHMI, P. SEBASTIAN, K. IWAOKA, N. AKATA and H. KUDO; Estimation of external dose by car-borne survey in Kerala, India, PLoS ONE, 10 (4), e0124433 (2015) DOI: 10.1371/journal.pone.0124433.
22) M. HOSODA, N. AKATA, M. SHIMO, M. FURUKAWA, K. IWAOKA and S. TOKONAMI; Investigation of environmental radiation at Tono area in Gifu Prefecture, Japan, RADIOISOTOPES, 64, 465–474 (2015). (in Japanese with English abstract)
23) S. MINATO
scintillator for environmental gamma radiation analysis, ,
27 (12), 384–397 (1978). (in Japanese)24) S. MINATO
response matrixes for environmental gamma ray spectrum unfolding, RADIOISOTOPES, 50 (10), 463–471 (2001).
25) J. YAMADA, T. YOKOYAMA, Y. KOIKE and M. SHIMO; Temperature dependence of NaI(Tl) scintillation spectrometer and its correction method, RADIOISOTOPES, 58 (12), 825–830 (2009). (in Japanese)
26) S. MINATO; Vehicle-borne survey techniques for background radiations, Nagoya, 44 (11), 609–628 (1995). (in Japanese)
27) H. MATSUDA, S. FURUKAWA, T. KAMINISHI and S. MINATO; A new method for evaluating weak leakage gamma-ray
(I) Principle of background estimation method, Rep. , 31 (5),
132–146 (1982). (in Japanese)28) S. MINATO
environment, J. Nucl. Sci. Technol., 8, 342–347 (1971).29) S. MINATO; Monte Carlo calculation of gamma radiation

Masahiro HOSODA, Kazumasa INOUE, Mitsuaki OKA, Yasutaka OMORI, Kazuki IWAOKA and Shinji TOKONAMI50
from the atmosphere to the ground surface, Jpn. J. Health Phys., 15, 19–24 (1980).
30) H. L. BECK; The absolute intensities of gamma rays from the decay of 238U and 232Th, Health and Safety Laboratory Report HASL-262, U.S. Atomic Energy Commission, New York, NY 10014 (1972).
31) H. L. BECK, J. DECAMPO and C. GOGOLAK; In-situ Ge(Li) and NaI(T1) gamma-ray spectrometry, Health and Safety Laboratory Report HASL-258, U.S. Atomic Energy Commission, New York, NY 10014 (1972).
32) H. MATSUDA, S. MINATO and V. PASQUALE; Evaluation of accuracy of response matrix method for environmental gamma ray analysis, RADIOISOTOPES, 51 (1), 42–50 (2002). (in Japanese)
33) M. SHIMO, S. MINATO and M. SUGINO; A survey of environmental radiation Aichi, Gifu and Mie Prefectures, J. At. Energy Soc. Jpn., 41 (9), 954–964 (1999). (in Japanese)
34) M. SUGINO and M. SHIMO; Survey of environmental radiation dose rates and natural radionuclide concentrations in Gunma Prefecture, RADIOISOTOPES, 51 (12), 543–555 (2002). (in Japanese)
35) M. HOSODA, M. FUKUSHI, M. SUGINO, M. FURUKAWA and M. SHIMO; The natural radiation on Miyake-jima of the Izu Islands, Japan, Jpn. J. Health Phys., 40 (4), 365–371 (2005). (in Japanese with English abstract)
36) M. HOSODA, A. SORIMACHI, T. ISHIKAWA, Y. NAKAMURA and S. TOKONAMI
of indoor radon -a case study on Kumamoto City, Jpn. J. Health Phys., 43 (4), 349–353 (2008). (in Japanese)
37) K. MINAMI, M. SHIMO, M. SUGINO, S. MINATO, M. HOSODA, J. YAMADA, M. OKA, K. EJIRI and M. FUKUSHI; Survey of environmental radiation dose rates in Kyoto and Shiga Prefectures, Japan, Proceedings of the 12th Congress of the International Radiation Protection Association. 19–24 October 2008, Proceeding Series of the International Atomic Energy Agency, International Atomic Energy Agency, Vienna (2008). (in CD-ROM)
38) S. KINA, H. HIRAOKA, S. ISHIKAWA, R. SHINGAKI, T. FUJITANI, Y. SHIROMA and M. FURUKAWA; Car-borne survey of terrestrial gamma radiation dose rate in Okinawa Island, Japan, the Ryukyus, 97, 39–45 (2014). (in Japanese with English abstract)
39) K. INOUE, M. HOSODA, M. FUKUSHI, M. FURUKAWA and S. TOKONAMI; Absorbed dose rate in air in metropolitan Tokyo before the Fukushima Daiichi Nuclear Power Plant accident, . 167 (1–3), 231–234 (2015).
40) National Land Information Division; National Planning and Regional Policy Bureau, Ministry of Land,
Infrastructure, Transport and Tourism. http://nrb-www.mlit.go.jp/kokjo/tochimizu/F2/MAP/202010.pdf. Accessed 10 September 2015.
41) S. MINATO; Distribution of terrestrial ray dose rates in Japan, J. Geography (Chigakuzasshi), 115, 87–95 (2006). (in Japanese with English abstract)
42) S. MINATO; Terrestrial gamma ray dose rates in andesitic terrains, RADIOISOTOPES, 57, 305–311 (2008).
43) S. MINATO; Terrestrial gamma ray dose rate in the Cenozoic sedimentary rock terrains, RADIOISOTOPES, 58, 57–60 (2009). (in Japanese with English abstract)
44) Y. KANDA; Investigation of the freely available easy-to-use software ‘EZR’ for medical statistics, Bone Marrow Transplant., 48, 452–458 (2013).
45) S. MORIUCHI, M. TSUTSUMI and K. SAITO; Examination on conversion factors to estimate effective dose equivalent from absorbed dose in air for natural gamma radiations, Jpn. J. Health Phys., 25, 121–128 (1990). (in Japanese with English abstract)
46) K. SAITO, N. PETOUSSI-HENSS and M. ZANKL; Calculation of the effective dose and its variation from environmental gamma ray sources, Health Phys., 74, 698–706 (1998).
47) International Commission on Radiological Protection; 1990 Recommendations of the International Commission on Radiological Protection, ICRP Publication 60. Ann. ICRP 21(1–3) (1991).
48) International Commission on Radiological Protection; The 2007 Recommendations of the International Commission on Radiological Protection, ICRP Publication 103. Ann. ICRP 37 (2007).
49) Ministry of Internal Affairs and Communications, Portal
www.e-stat.go.jp/SG1/estat/List.dobid=000001041121 &cycode=0. Accessed 6 November 2015.
50) Ministry of Internal Affairs and Communications, Portal
www.e-stat.go.jp/SG1/estat/List.dobid=000001037598 &cycode=0. Accessed 6 November 2015.
Masahiro Hosoda, Ph. DLecture, Department of Radiological Life Sciences, Hirosaki University Graduate School of Health Sciences. Specialty: Measurement and assessment of environmental radiation and radionuclides.E-mail: [email protected]


![마더세이프라운드 radiation dose[윤석남 교수]](https://img.dokumen.tips/doc/110x75/55637202d8b42a3b708b4b92/-radiation-dose-.jpg)