Embed Size (px)
Citation preview

i
Environmental Radiation Dose Rate in the Gold Mining Region of Lolgorian in
Narok County
By
Amos Kipkosgei Chepkwony (B.ED Physics)
A thesis submitted in partial fulfilment for the requirements for the award of degree of
Master of Science in Nuclear Science of the University of Nairobi
July 2018

i
DECLARATION
I hereby declare that this thesis is my original work and has not been submitted for the
award of any degree or qualification at any other University.
Amos Kipkosgei Chepkwony, S56/73613/2014
Signature ………………………… Date ………………………….
Supervisors’ approval
This thesis has been submitted with our knowledge and approval as university
supervisors.
1) Mr Michael J. Mangala,
Institute of Nuclear Science and Technology,
University of Nairobi
Sign ………………………
Date ………………………
2) Dr. Geoffrey O. Okeng’o
Department of Physics
University of Nairobi
Sign ………………………
Date ………………………

ii
DEDICATION
Dedicated to my late parents Joseph and Pauline.
iii
ACKNOWLEDGEMENT
I wish to extend my gratitude to the Institute of Nuclear Science and Technology
community for their support during my study period. I thank my supervisors; Mr.
Michael Mangala (INST), Dr. Geoffrey Okengo (Physics Department) and Mr. Simon
Bartilol, Senior technologist at the Institute of Science and Technology, University of
Nairobi, for their support and guidance during my research period.
I thank the National Research Fund (NRF) for the research grant, I was awarded to
facilitate this research study.

iv
ABSTRACT
Exposure to radiation leads to harmful health effects on human beings, either deterministic
or stochastic depending on the threshold of the radiation dose. Knowledge on the radiation
profile of a particular working environment should be a requirement to both the radiation
regulatory authorities and the occupational workers. Currently there exists little to none
radiological information on the gold mining region of Lolgorian. This study serves to
bridge this gap in knowledge and data from the mining region.
This study was done in the gold mining region of Lolgorian in Narok County, specifically
to determine radioactivity concentrations of thorium, potassium and uranium
radionuclides, and to evaluate the associated radiation hazard indices. The study was done
by analyzing thirty six (36) soil samples from Lolgorian for radioactivity measurements
using hyper pure germanium detector.
The greatest contributor to radiation exposure in the vicinity of Lolgorian gold mines was
40K, with a mean activity concentration of 427 ± 116 Bq kg-1 (74%), as compared to 232Th
and 238U at 116 ± 69 Bq kg-1 (20%) and 33 ± 22 Bq kg-1(5%) respectively. The 238U activity
concentration was within the UNSCEAR global mean of 35 Bq kg-1, while 232Th and 40K
radionuclides were slightly above the global mean of 30 Bq kg-1 and 400 Bq kg-1
respectively. Radium equivalent values ranged between 38 – 529 Bq kg-1, with a mean of
232 ± 38 Bq kg-1; which is above the world mean reported at 160 Bq kg-1, but within the
UNSCEAR permissible limit of 370 Bq kg-1. Gamma radiation index Iγr was determined
to have a mean of 1.66 ± 0.28, hence exceeding the required index value of unity (≤1).
Internal and external hazard index were determined to be 0.72 ± 0.14 and 0.62 ± 0.11
respectively.
The absorbed dose rates at 1 m distance above the ground level was determined at between
19 nGy h-1 and 156 nGy h-1. The annual effective dose using an outdoor occupancy factor
of 0.4 had a mean value of 0.25 ± 0.04 mSv y-1, which is below the mean global annual
effective dose at approximately 0.5 mSv y-1.
Fe was the major constituent in the soil samples, followed by Ti and Mn, with a mean
concentration of 9.22 ± 7.70 %, 4370 ± 2500 mg kg-1, and 1869 ± 1509 mg kg-1
respectively. Other mean concentrations below 100 mg kg-1, were recorded for Zn, Zr, Rb
and Pb. Zn concentrations ranged between (20 – 792) mg kg-1, with a mean of 102 mg kg-

v
1. The study concluded that the radioactivity levels in the gold mining region of Lolgorian
in Narok County currently do not pose significant risk to the public. However, there is need
to analyze radioactivity levels in water sources to get a complete understanding of the
extent of radioactivity distribution. Continuous periodic monitoring of the region’s
radionuclide concentration is recommended.

vi
LIST OF ABBREVIATIONS AND ACRONYMS
EPA - Environmental Protection Agency
Hex - External Hazard Index
Hin - Internal Hazard Index
HPGe - High Purity Germanium Detector
IAEA - International Atomic Energy Agency
ICRP - International Commission on Radiological Protection
INST - Institute of Nuclear Science and Technology
NORMs - Natural Occurring Radioactive Materials
TENORM - Technologically Enhanced Naturally Occurring Radioactive
Material
UNSCEAR - United Nation’s Scientific Committee on the Effects of Atomic
Radiation

vii
TABLE OF CONTENT
DECLARATION .............................................................................................................. i
DEDICATION ................................................................................................................. ii
ACKNOWLEDGEMENT ............................................................................................. iii
ABSTRACT .................................................................................................................... iv
LIST OF ABBREVIATIONS AND ACRONYMS ...................................................... vi
TABLE OF CONTENT ................................................................................................ vii
LIST OF TABLES .......................................................................................................... ix
LIST OF FIGURES ......................................................................................................... x
CHAPTER ONE: INTRODUCTION ........................................................................... 1
1.1 Research Background .................................................................................................. 1
1.2 Description of the Study Area ..................................................................................... 2
1.3 Statement of the Problem ............................................................................................ 3
1.4 Objectives .................................................................................................................... 4
1.4.1 Main Objective ................................................................................................... 4
1.4.2 Specific Objectives ............................................................................................. 4
1.5 Justification of the Study ............................................................................................. 4
1.6 Scope of the Study ....................................................................................................... 5
CHAPTER TWO: LITERATURE REVIEW .............................................................. 6
2.1 Overview ..................................................................................................................... 6
2.2 Natural Radioactivity in the Environment ................................................................... 6
2.2.1 Potasium-40 in the Environment ........................................................................ 7
2.2.2 Uranium Decay Series and its Progeny Products ............................................... 8
2.2.3 Thorium Decay Series and its Progeny Products ............................................... 9
2.3 Radiological Studies .................................................................................................. 10
2.4 Environmental Impact of Gold Mining ..................................................................... 14
CHAPTER THREE: METHODOLOGY ................................................................... 15
3.1 Overview ................................................................................................................... 15
3.2 Sampling: Description of the Study Area .................................................................. 15

viii
3.3 Sampling .................................................................................................................... 17
3.4 Sample Preparation for Radioactivity Measurements and Trace Elements
Determination. ............................................................................................. 17
3.5 Instrumentation of HpGe Gamma Spectroscopy and measurements ........................ 17
3.6 Radiological Data Analyses ...................................................................................... 20
3.6.1 Radium equivalent ............................................................................................ 20
3.6.2 Gamma Index ................................................................................................... 21
3.6.3 External Hazard Index ...................................................................................... 21
3.6.4 Absorbed dose .................................................................................................. 21
3.6.5 Annual Effective Dose ..................................................................................... 21
3.7 EDXRF Elemental Analyses ..................................................................................... 22
CHAPTER FOUR: RESULTS AND DISCUSSION ................................................. 23
4.1 Overview ................................................................................................................... 23
4.1 Activity Concentration .............................................................................................. 23
4.2 Radiation Hazard Indices .......................................................................................... 28
4.3 Elemental Concentrations .......................................................................................... 31
CHAPTER FIVE: CONCLUSION AND RECOMMENDATIONS ........................ 37
5.1 Conclusion ................................................................................................................. 37
5.2 Recommendations ..................................................................................................... 37
REFERENCES .............................................................................................................. 38

ix
LIST OF TABLES
Table 3.1: Recommended energy lines for gamma-ray emitters of environmental
samples (IAEA, 2003) ................................................................................. 19
Table 4.1: Certified reference material activity concentrations and detection limits;
IAEA-RGTh-1, IAEA-RGU-1 and IAEA-RGK-1 respectively .................. 24
Table 4.2: Summary of the obtained activity concentrations in Bqkg-1 .......................... 25
Table 4.3: Calculated radiation hazard indices ............................................................... 29
Table 4.4: Results of the analyses of IAEA-PTXRF09 certified reference material ...... 32
Table 4.5: Elemental Concentrations in soils samples ................................................... 34
Table 4.6: Inter-element Correlation matrix .................................................................... 36
x
LIST OF FIGURES
Figure 1.1: Geological map of Lolgorian region, Narok County, Kenya ......................... 3
Fig. 2.1: Decay scheme of potassium-40 Source: Pradler, et. al., 2013 ........................... 8
Figure 2.2: Uranium and Thorium decay series (WNA, 2009) ......................................... 9
Figure 3.1(a) : Kenyan map indicating the Kilimapesa mining area in Lolgorian, Source:
http://www.goldplat.com/projects/kilimapesa-gold-kenya .......................... 15
Fig 3.1(b): A map showing the mining blocks sampled in Lolgorian. ............................ 16
Figure 3.2: The HpGe gamma spectrometer at the Institute of Nuclear Science &
technology (INST) ....................................................................................... 18
Figure 4.1: Spectral data for the certified references and a typical sample ..................... 23
Figure 4.2: Sample wise distribution of activity concentration due to 238U, 232Th and 40K
from measured samples................................................................................ 25
Figure 4.3: Relative abundance of the radionuclides in soils .......................................... 27
Figure 4.4: Correlation between the activity concentration of 238U and 232Th. ............... 27
Figure 4.5: Correlation between the activity concentration of 238U and 40K. .................. 28
Figure 4.6: Correlation between the activity concentration of 40K and 232Th ................. 28
Figure 4.7: Variation of radium equivalent in the samples ............................................. 29
Figure 4.8: shows the variation of gamma index in the samples .................................... 30
Figure 4.9: Variation of Hex & Hin in the samples ........................................................... 30
Figure 4.10: Variation of absorbed dose rates in the samples ......................................... 31
Figure 4.11: Variation of annual effective dose equivalent in the samples .................... 31

1
CHAPTER ONE: INTRODUCTION
1.1 Research Background
Radioactivity is a natural nuclear decay phenomenon which is associated to both artificial
and natural radionuclides. Artificial radioactive sources include those from nuclear
medicine and equipment, nuclear reactors, industrial process just to name a few. On the
other hand, natural radioactivity sources contribute significant bulk of public radiation
exposure that arise from terrestrial (primordial radionuclides) and extraterrestrial-cosmic
origin. Based on these three categories; i.e. cosmic, primordial and artificial sources, there
are over sixty natural radionuclides present in the environment (EPA, 2006). These
radionuclides are found in rocks, soil, water, air, food, and even in living tissues and thus
universally present hazardous risk.
Terrestrial radiation is the most significant of natural radiation sources, accounting to about
80 % of the annual radiation exposure (Watson et al., 2005). It mainly follows decay of
naturally occurring radioactive materials (NORMs), commonly known as primordial
radionuclides in all environmental materials such as rocks, soils, water, among others. In
principle the term NORMs refers to 232Th, 40K, 238U, in addition to their radioactive decay
daughter nuclides. Accordingly, the radiation dose levels associated with the NORMs is
generally low and varies, though not significantly within locality but largely depend on
concentration of the radionuclides, based on geological background and mineral
composition. Thus, exposure to radiation from NORMs is usually of little public concern,
except in cases of occupational exposures (IAEA, 2005) and where there is anomaly.
However, even though the degree of exposure to NORMs is usually statistically
insignificant from a medical physics perspective, the associated possible health risks
cannot be ignored (World Nuclear Association, 2011).
In general exposure to ionizing radiation can result in an array of health effects both
deterministic and stochastic. Deterministic effects result from acute radiation exposure
above the threshold dose. It leads to death of cells, tissue or organ damage, and in
unfortunate incidences, death. Examples of deterministic effects include loss of hair,
nausea and vomiting. On the other hand, stochastic effects are probabilistic with no
threshold dose. They can result from long term exposure to low radiation doses associated

2
with NORMs. These effects are specific to the organ exposed, dose rate, degree of
absorbed dose and exposure period (UNSCEAR, 2000).
Virtually all soils and rocks contain NORMs to some degree, uranium and thorium are in
very low concentrations (<0.1 %), while 40K is the most abundant in most natural
environment. NORMs are found in very low concentrations, and their associated health
risks usually considered negligible. However, anthropogenic activities such as mining,
smelting, processing, milling etc., can result in elevated concentrations. Industrial
processes such as mineral extraction result in high NORMs levels, commonly referred to
as technologically enhanced naturally occurring radioactive materials (TENORM). The
physical, chemical and radiological properties of the TENORMs are altered by being
disturbed, beneficiated or processed, thus enhancing their potential for environmental
exposure (EPA, 2008).
Mining activities have been known to result in the dispersion of the radionuclides at
elevated concentrations. Therefore, this study seeks to determine radioactivity levels in
Lolgorian gold mining areas in an effort to mitigate possible detrimental effects due to
radiation exposure to both workers and the general public.
1.2 Description of the Study Area
Lolgorian is a division in Narok County in Kenya, with its divisional headquarters being
Lolgorian (1° 14' 0" S, 34° 48' 0" E). It borders Keyian, Kilgoris and Kirindon divisions
and Mara triangle. The mining region lies between two rivers, river Mogor to the north and
Mara River to the south. Lolgorian town is 364 Km south west of Nairobi and 265 Km
from Nakuru and at altitude between 1156 m and 2278 m above sea level. The region
experiences two rainy seasons; the short rains taking place September and December, while
the long rains occur from March to June, with the wettest month being April. The climate
of the region is classified as warm and temperate, the average temperature of the region
being 17 degrees Celsius.
This study was conducted in the mining block SL91B that lies under the Migori greenstone
belt. The geology of the study area is defined as Nyanzan basalts, with granite, greywacke
Shales, tuffs, and Nyanzan Shales as the predominant underlying rocks. The region runs
from Lake Victoria up to the late Protezoric Mozambique belt to the east.

3
Figure 1.1: Geological map of Lolgorian region, Narok County, Kenya
1.3 Statement of the Problem
The contribution of the mining sector to a country’s economy and development cannot be
understated. To most of the global economies, this sector is actually a key foreign
exchange earner. However, the mining sector has been associated with serious
environmental concerns. Unfortunately, most studies and regulatory authorities focus on
direct and more visible impacts such as soil and water contamination, erosion, loss of
biodiversity, formation of sink holes, etc.
In general NORMs are associated to low health risks and are considered statistically
negligible. However high concentrations have been reported in mining areas, and in high
background radiation areas (Otwoma et al., 2012; Patel et al., 2012; Kinyua et al., 2001;
Patel, 1991). The problem is further exacerbated during the mining processes which
enhances (TENORMs). Such, could be the case in Lolgorian Gold mines, Kenya. In
Lolgorian, the mining process entails deep ground excavation prior to extraction of

4
minerals, a process known to lead to elevated levels of natural radionuclides, which are
hazardous to the mine workers and the public.
At the moment, there is no comprehensive data on the levels of radionuclide concentration
and the extent of radiation exposures to both miners and the immediate environment of
Lolgorian mines. This study therefore has profiled the environmental radiation exposure
and is necessary in development of mitigation guidelines to minimise public exposure.
1.4 Objectives
1.4.1 Main Objective
To establish radiological hazards linked to natural radionuclides in Kilimapesa gold mines
in Lolgorian, Narok County, Kenya.
1.4.2 Specific Objectives
i. To determine the activity concentrations of 40K, 232Th and 238U in soil samples;
ii. To estimate the absorbed dose rate and the annual effective dose rate in the collected
soil samples;
iii. To estimate the radium dose equivalent in the soil samples;
iv. To determine the external and internal radiation hazard indices in the soil samples.
1.5 Justification of the Study
Exposure to hazardous natural radionuclides can be harmful to human health in both short
term and long term, based on the degree and duration of radiation exposure. Consequently,
sufficient data on the radiation levels should not only be a requirement but a necessity for
miners, the public and the relevant decision-making government agencies. This study
therefore serves to bridge the knowledge gap on Lolgorian gold mines with respect to
radionuclide concentration levels and the associated radiological hazards in the Lolgorian
gold mines.
As such, the study will contribute towards public awareness creation on potential health
hazards associated with radiation exposures and will in addition provide baseline data for
future mitigation measures.

5
1.6 Scope of the Study
This study is relevant for radiological protection and safety in Kilimapesa Gold mines and
its immediate environs. The study is limited to identifying and quantifying the
radionuclides (40K, 238U and 232Th, and their daughter progenies) activity concentrations in
sub-soil samples collected from Kilimapesa mines and the estimation of radiological
hazards. Absorbed dose was determined at 1m distance above the ground level considered
the average height of a person. Other radiation exposure parameters; radium equivalent,
annual effective dose, gamma index, and external and internal hazard indices were
determined using existing models. The results obtained were used to determine the extent
of environmental radiological contamination resulting from the mining processes

6
CHAPTER TWO: LITERATURE REVIEW
2.1 Overview
This chapter presents a review and discussion on natural radioactivity and radionuclides in
the environment followed by a review of past and recent studies on environmental
radioactivity and dose rate assessments in support of the current study. The literatures cited
in this chapter are purely from primary sources
2.2 Natural Radioactivity in the Environment
There are two categories of natural radioactivity; terrestrial and extra-terrestrial/cosmic
radiation. Terrestrial radiation emanates from radionuclides contained in the earth’s crust
i.e. soil, minerals and rocks. It comprises of alpha and proton particles, whose interaction
in the upper atmosphere leads to creation of secondary particles such as muons, electrons,
neutrons and protons (UNSCEAR, 2000). Cosmic radiation on the other hand penetrates
into the earth’s atmosphere from the outer space i.e. galaxies and sun (Choppin et al, 2002).
Interaction of cosmic rays with the constituent nuclei in the atmosphere results into a
cascade of interactions and cosmogenic radionuclides. The most common cosmogenic
radionuclides are 14C and 3H. With respect to dose from NORMs, the contribution of these
radionuclides is insignificant due to attenuation in the atmosphere (UNSCEAR, 2008).
However, modification of the natural environment could result in higher radiation exposure
from natural radionuclides. For example, human activities such as mining and use of rocks
as key construction material expose human beings to elevated radiation doses, use of fossil
fuel and phosphate fertilizers are other such activities that can alter the radiation levels in
the environment (UNSCEAR, 2008).
In principle radiation exposure can either be internal or external, internal exposure results
from ingestion or inhalation of radionuclides. On the other hand, external exposure can
further be classified as outdoor and indoor exposure originating from the presence of
NORMs in rocks, soil and minerals. The degree of exposure to outdoor exposure varies
with the parent rock material from which the soil was derived. For instance, igneous rocks
are associated with higher degree of radiation, whereas sedimentary rocks exhibit
characteristically low degree of radiation. Phosphates and shales also exhibit higher
concentration level of natural radionuclides (UNSCEAR, 2008). Indoor exposure results
primarily from building materials such as sand, cement, stone, soil and bricks. A study by

7
Maina et al., (2002) observed that more than half of mud constructed houses in coastal
Kenya exceeded the IAEA action level of 200 Bq m-3, with some as high as 400 Bq m-3.
Radon was identified as the most common radiological indoor pollutant.
According to UNSCEAR (2008), gamma dose rate in air exhibits substantial temporal
variations. This observation has been attributed mainly to radon, which is greatly affected
by soil moisture content, snow or rainfall. Variations as high as 50 % have been recorded
within a thirty-minute time interval. Increased gamma dose levels of (50 – 100) % lasting
for several hours can be caused by rainfall or washout of the radon progeny. Subsequent
decline can be associated with increased moisture content (UNSCEAR, 2008).
There are two categories of naturally occurring radionuclides; those that are radioactive in
their own nature i.e. singly occurring radionuclides such as 40K, 50V, 113Cd, 142Ce, etc., and
those that belong to decay of nuclides i.e. uranium, actinium, thorium and neptunium decay
series. Radioactive decay occurs in heavy nuclides (A > 209; Z > 90), either by beta
emission resulting in a unit change in atomic number or by emission of alpha particles
leading to a stepwise decline in mass number by 4. This decay process terminates once a
stable nuclide is attained i.e. 206Pb, 207Pb and 208Pb for 238U, 235U and 232Th decay series,
and 209Bi for 237Np decay series.
2.2.1 Potasium-40 in the Environment
The isotopic abundance of 40K is 0.012 %. It has a half-life of approximately 1.25×10⁹
years. While p 39K is an essential nutrient in animals and plants, 40K is a significant source
of internal and external human radiation exposure. In general, the specific activity of
natural 40K has specific activity of 31.4Bq/g. The mean activity concentration of 40K in
earth’s crust is 840 Bq/kg and 60 Bq/kg in human body, its concentration in soils can be
enhanced through agricultural activities like use of phosphate bearing fertilizers (Ajmalet
al., 2014; Jibiri and Fasae, 2012). In terms of internal human exposure, 40K comes second
after radon and its daughter products. According to a report by International Commission
on Radiological Protection (ICRP, 1976), 40K is present in all biological systems, with an
adult (70 Kgs) containing approximately 140g of potassium that translates to 4.3 kBq of
40K in the body, especially in the muscles.
40K has three modes of decay; positron emission, K-electron capture and β emission (Figure
2.1). The probability of positron emission is 0.0011 %, where a proton in the nuclide

8
decays into a positron, resulting into a change from 40K into 40Ar (Read and Hayder, 2011).
In the second mode, that is K-electron capture, 40K nuclide decays indirectly into the stable
state of 40Ar in two phases; first, into the excited state of argon; which then decays into its
stable state via emission of gamma radiation of 1.46 MeV energy. The probability of
occurrence of electron capture is 11 % (Read and Hayder, 2011). Lastly, 40K radionuclide
can decay via emission of a β-particle into the stable state of 40Ca. The emitted β-particle
has 1.32 MeV energy with probability of occurrence at 88.7 %, as the predominant mode
(Read and Hayder, 2011).
Fig. 2.1: Decay scheme of potassium-40 Source: Pradler, et. al., 2013
2.2.2 Uranium Decay Series and its Progeny Products
There are three isotopes of uranium atom; 238U, 235U, and 234U. Uranium-238 is the most
dominant at 99.3%, followed by 235U (0.72%) and 234U at 0.005% (Cember, 2009). Both
238U and 234U belong to 4n+2 series, that is, uranium series, while 235U belong to 4n+3
series (actinium series). Uranium decay series starts at 238U, and has a long half-life of 4.5
* 106years. In the process, fourteen nuclides are produced following emission six beta
particles and eight alpha particles until a stable isotope of 206Pb is achieved (Figure 2.1) in
addition to gamma radiation emissions. Among the decay products, 214Bi and 214Pb can
readily be measured using gamma spectrometry. Due to a shorter half-life of the daughter
products than the parent nuclide, uranium series is said to be in secular equilibrium

9
(Richard and Martin, 1997). On the other hand, 235U belongs to 4n+3 (Actinium) series,
commencing at 235U and terminates at 207Pb, this decay series results in twelve nuclides
and emission of seven alpha particles.
2.2.3 Thorium Decay Series and its Progeny Products
According to Australian Radiation Protection and Nuclear Safety Agency (ARPANSA,
2015) fact sheet, there are twenty-six known thorium isotopes. Among them, only twelve
have half-life of more than a second and three with half-lives long enough to raise
environmental concern i.e. 232Th, 230Th and 229Th. However, 232Th is the most common
(almost 100%) and significant of these natural radioisotopes and is the parent member of
thorium (4n) series. Thorium series involves ten decay phases with six alpha particles
being emitted (Figure 2.2). Four of the resultant nuclides i.e. 212Pb, 228Ac, 208Tl and 212Bi,
can readily be measured using gamma spectroscopy (Read and Hayder, 2011; Harb et al,
2008). According to Harb et al. (2008), for 208Tl to be used in estimating thorium activity,
the obtained measurement must be corrected for branching during decay of 212Bi into 212Po
by β-decay (64%) and 208Tl by α-decay.
Figure 2.2: Uranium and Thorium decay series (WNA, 2009)

10
The most significant decay products in 232Th, 238U and 235U series in terms of human
exposure are the isotopes of radon (222Rn,, 220Rn, 219Rn) and radon daughters, mainly 210Po
and 210Pb (UNSCEAR, 2000; Richard and Martin, 1997). Radon isotopes, 222Rn, 220Rn,
219Rn results from an alpha decay of the radium isotopes 226Ra, 224Ra, 223Ra respectively.
Radon is present in soils, rocks, water and air at varying concentrations. This is dependent
mainly on soil and bedrock composition. Other factors that influence radon concentration
are grain size and shape, geology of soil formation, soil permeability, temperature moisture
content and radium concentration. For instance, for a mean radium concentration of 40Bq
kg-1, the resultant radon concentration estimate is 60 Bqm-3. The action level for radon is
1000 Bq m-3 for working area, based on 2000 hours occupancy level per year (ICRP, 2007).
According to UNSCEAR (2000), the dominant radiological exposure pathway in human
beings is through inhalation of radon and its progeny. This exposure is associated with
alpha particles released by short-lived progeny of 222Rn and 220Rn radionuclides, deposited
along the airways and lungs. The report further links irradiation of basal and secretory
cells in the upper airways to lung cancer, especially underground miners (UNSCEAR,
2000). In United States, indoor radon exposure is estimated to cause approximately 20,000
lung cancer deaths annually (EPA, 2000).
2.3 Radiological Studies
Radiation exposures resulting from the extraction and processing of minerals is an issue of
public concern. Consequently, numerous studies have been conducted in Kenya, as well
as globally, on radiological assessment in the mines. According to UNSCEAR (1993), the
typical annual effective dose globally resulting from the extraction and refining of
minerals, is estimated at 20 mSv/ year. As a result, there has been an increase in number
of radiological studies being conducted globally within the mines, suspected high
background radiation areas, as well as recreational and residential areas such as beaches
(Ademola, 2015; Sivakumara et al., 2014; Mustapha et. al., 2007; Darko et al., 2005). From
such studies, there has been enhanced understanding of radiological hazards posed, leading
to increased awareness. In addition, high background radiation areas have been mapped
out for safety measures. Such areas include, Mrima Hill in Kenya (Patel 1991),
Guarapariin Brazil (Paschoa, 2000), Yangjiang in China, which has been designated as
controlled area (UNSCEAR, 2000; Wei et al., 1993), among others.

11
In India, Sharma et al. (2016) conducted a research on natural radionuclides and radon
exhalation rate in cement, as well as its radiological relevance. Gamma ray spectroscopy
was used to assess the activity concentration of primordial radionuclides, radon-226,
uranium-238, potassium-40 and thorium-232, while CAN technique was applied in
determination of the rate of radon exhalation. Radium equivalent for assorted flooring
materials was also determined and the results compared. The obtained values were
determined below the maximum permissible value at 370 Bqkg-1 (UNSCEAR, 1988), with
the black granite registering the lowest radium equivalent at 23.49 Bqkg-1, in comparison
to the orange marble at 202.63 Bq kg-1. The difference in the radium equivalent values
could be associated with the activity levels of 232Th and 40K.
Njinga and Tshivhase (2016) evaluated natural radionuclide concentration as well as the
outdoor gamma dose rate in the environs of Tudor shaft gold mines in South Africa. The
authors further determined the radionuclide levels in the internal organs in cattle from the
area, in addition to calculating the lifetime cancer risk. The activity concentration of
232Th,40K and 238U were determined as 47 ± 3.7 Bqkg-1,87 ± 5.1 Bqkg-1 and 271 ± 3.6 Bqkg-
1,respectively. The outdoor gamma dose rate ranged from 131 ± 5.4 nGy/h to 202 ± 14
nGy/h, while average annual effective dose in the environs of the study area was
determined to be above the global mean at (0.16-0.25) mSv/y. The internal organs of cattle
from the study area were found to contain very high heavy metals and uranium content in
comparison to a control group. For instance, the uranium levels were 4000 times higher
than that of the control group. This observation was attributed to presence of both artificial
and natural radionuclides from the mining process. The lifetime cancer risk was estimated
at two to three times above the global mean (Njinga and Tshivhase, 2016).
In the artisanal gold mines of Awwal in Nigeria, Girrigisu et al. (2014) assessed the
radiological levels in soils using a NaI(Ti) detector. The obtained activity levels and their
corresponding hazard indices were found to be within permissible limits, thus didn’t pose
significant health risk. 40K had the highest activity concentration at 425 ± 5.6 Bq kg-1,
followed by 226Ra (23 ± 2.01 Bq kg-1), and 232Th (19 ± 1.2 Bq kg-1). The annual effective
dose rate was 0.042 mSv/year, compared to the UNSCEAR (1993) benchmark at 0.07
mSvyr-1. Likewise, Ademola et al. (2015) conducted a similar study around the gold mines
of Itagunmodi. The mean activity levels for 238U, 40K, and 232Th were determined at 55 ±

12
1.2 Bq kg-1, 505 ± 7.1 Bq kg-1and 26 ± 2.7 Bq kg-1, respectively and 8.7 ± 1.8 Bq kg-1, 102
± 12 Bq kg-1and 17 ± 2.6 Bq kg-1 respectively, in the surrounding residential areas. The
annual effective dose was above the global mean at 81.3 μSv y-1. Local variations in
activity levels were exhibited in the study, which could be associated with the kind of the
geology of gold bearing rocks (Ademola et al., 2015).
Uosif et al. (2015) investigated the activity levels of natural radionuclides 40K, 232Th and
226Ra, and their corresponding hazard indices in granites and quartz- bearing gold, in
addition to chemical analyses. Radionuclide concentration was determined using sodium
iodide detector and chemical analyses using XRF spectroscopy. The specific activity was
determined at 232Th (6 ± 0.7 to 42 ± 2 Bq kg-1), 226Ra (3 ± 0.5 to 43 ± 2 Bq kg-1) and 40K
(128 ± 6 to 682 ± 35 Bq kg-1). Total effective dose rate of 16 – 70 mSv y-1 and absorbed
dose rate of (13 – 58) nGy h-1 were recorded.
Mangala (1987) conducted an elemental analyses study in Mrima Hill, Coastal Kenya,
from which he established high elemental concentration levels of rare earths and thorium.
Patel (1991) also undertook a follow up study determine the environmental radioactivity.
Very high dose levels comparable to those of areas classified as high background radiation
areas were recorded in this area. For instance, external gamma radiation dose as high as
1375 mRem/yr, which is fifty times the background values were recorded.
Ghiassi-nejad (2002), found that residents of Ramsar city in Iran, which is a HBRA were
exposed to radiation doses of 10.3 mGy/y. The maximum dose recorded was 260 mSy/y.
These two studies attributed the high radiation levels to local geology. Incidentally, the
inhabitants of these areas locally source their construction materials such as soils and rocks,
thus continuously exposing the residents to potentially greater radiation risks.
Patel et al. (2012) conducted a radiological study in Lambwe area, south-western Kenya.
The area was established to be a high background radiation area, with maximum absorbed
dose levels of 6100 nGy/h and a mean of 2113 nGy/h being recorded. The author attributed
the high doses to local geology that is predominantly carbonatites. He further noted that
the study area is in a high-altitude region, thus contribution of cosmic radiation to the
absorbed dose could be significant.
Omari (2013) carried out a comparable study in Kerio Valley in Rift valley, Kenya. This
region has been associated for long with high radioactivity levels. He noted that even

13
though the values were above the global mean, they were however within the permissible
levels. The author further investigated various types of rocks like quartzite, granite and
tuff for radioactivity. Quartzite exhibited indoor and outdoor dose levels above the global
mean (60 nGy/h) at 157 nGy/h and 159 nGy/h respectively. But, in a different part of the
Kerio valley region, Nderitu et al. (2001), reported low annual effective dose levels, at
0.091 mSv/yr.
Patel et al. (2011) conducted a radiological study, to evaluate the degree of exposure of
gold miners in Migori, Western Kenya, to radionuclides and dust. The absorbed dose rate
of between 17 and 177 nGy h-1and an average of 42 nGy/h, was reported. This was below
the global mean of 60nGy/yr. In the neighbouring Homa mountains, Otwoma et al. 2012
evaluated the radioactivity and dose levels in soil and rock samples. The radionuclide
activity levels were high at; 232Th (409 Bq kg-1), 226Ra (195 Bq kg-1) and 40K (915Bqkg-1),
as compared to global mean at 232Th (30 Bq kg-1), 226Ra (35 Bq kg-1) and 40K (400 Bq kg-
1). The outdoor absorbed dose rate at 1m distance above the ground was determined at 108
to 1596 nGy/h. The annual effective dose varied between 28 µSv/h to 1681 µSv/h, and a
mean of 470 µSv/h. As a result of the high radiation levels, Homa mountains can be
classified as a high background radiation area (Otwoma et al. 2012).
Kinyua et al. (2001), did a study to assess the extent of radiation exposure to the miners as
well as local community in Kisii county in Kenya which has the biggest soapstone mines
such as Tabaka quarries. Activity concentrations for 226Ra, 40K and 232Th, in addition to
associated radiation hazard indices were determined. The mean absorbed dose was
determined nine times the global average, at 541.4 nGy/h. The external and internal hazard
index was above the recommended value. Therefore, there is concern over suitability of
soapstone as a construction material and for sculpture making.
Osoro et al. (2011) carried out a baseline study on radionuclide concentrations in surface
soils in residential areas/ villages around two proposed titanium mines in Coastal Kenya,
prior to commencement of the mining process. The study served as a reference for future
radiological monitory studies, once the mining process commence. The author further used
the obtained activity concentrations to calculate absorbed dose rate in air. The activity
concentration for 40K, 226Ra and 232Th were below global mean as well as those obtained
from similar studies in other parts of Kenya at 77 ± 15 Bq kg-1, 20 ± 4.8 Bq kg-1 and 28 ±

14
5.8 Bq kg-1 respectively. Similarly, the calculated dose rate was lower than global mean at
29 nGy/h.
A research carried out by Hashim et al. (2004) offers an intriguing perspective about the
origin of 137Cs along the Kenyan coast. In this particular study, the author looked into
artificial and natural radionuclide concentrations in the sediments. HPGe detector was used
to identify the radionuclides present in the sediments. The study revealed low level
contamination of 137Cs. Presence of 137Cs was a puzzle due to absence of any nuclear
facilities in Kenya. He pointed out towards the possibility of these nuclides being
transported from other areas, although further research is necessary. The obtained effective
dose varied from 0.02 to 0.19 mSv/y, far below the recommended limit (ICRP, 1991).
2.4 Environmental Impact of Gold Mining
Occurrence of gold deposits in Kilimapesa, Narok county is good and timely news for
Kenya. It will contribute towards the country’s socio-economic development agenda, as
well as in diversifying the economy of the local communities. However, there is a
downside to these development; environmental degradation. Some of the most significant
environmental concerns resulting from gold mining include; change in land-use patterns,
land degradation, deterioration of flora and fauna, and impact on both surface and
underground water sources as well as the drainage system(Erraiyan, 2014; Bhumika,
2014). Above all, elevation of metal content of soil and water resources is a key concern
(Pereiraet al., 2008; Angelovičová and Fazekašová, 2014). The significance and
magnitude of these effects on the environment depend on size and scale of exploration
activities, in addition to topography, climatic conditions, nature of mineral deposits,
method of mining, among others (MoEF,2007).
Contamination of agricultural soils and water resources with heavy metals is a major
challenge associated with mining (Humsaand Srivastava, 2015). For instance, during the
pre-processing stage, minerals are ground into fine particles that are more mobile. The
particles can easily be carried away by wind or water over long distances, with potential of
contaminating not only the nearby lands but also those that are miles away. In addition,
the metals can find their way into river systems or even seep downwards polluting
underground water.

15
CHAPTER THREE: METHODOLOGY
3.1 Overview
The procedures used in this study for sample collection, preparation, instrumentation and
analyses are outlined in this chapter. A detailed discussion of radiation indices used as an
indicator for human exposure will be discussed.
3.2 Sampling: Description of the Study Area
The sampled study area is located in the Kilimapesa gold mining block in Lolgorian region,
Narok County. The area is a block of 65 square kilometres. The sampled points were
selected randomly within the mining block as shown on figure 3.1 (b).
Figure 3.1(a) : Kenyan map indicating the Kilimapesa mining area in
Lolgorian, Source: http://www.goldplat.com/projects/kilimapesa-gold-kenya

16
Fig 3.1(b): A map showing the mining blocks sampled in Lolgorian.

17
3.3 Sampling
A total of thirty-six 36 sampling sites were identified for soil sampling. Soil samples were
collected at a depth of 10 - 20 cm. For each sampling sites, three subsamples were obtained
within a radius of 1m. The three subsamples were homogenized in situ, to obtain a
representative sample of about 0.5 kg, which was kept in well labeled polythene bags for
transportation to the laboratoryfor preparation and analyses.
3.4 Sample Preparation for Radioactivity Measurements and Trace Elements
Determination.
The samples were initially air dried for two weeks, followed by oven drying at a
temperature of 60 0c – 80 0c to constant weight. The samples were then ground to break
down aggregates. Grinding helps not only in size reduction, but also in ensuring
homogeneity of the elements in the sample.
For radioactivity analyses, about 300 g of the pulverized samples were sealed in 200 cc
plastic containers for a period of one month prior to gamma analyses. This was to give the
samples time to attain secular equilibrium between gaseous radon and its short-lived
daughters (214Bi and 214Pb) and the long-lived precursor radionuclides.
For EDXRF analyses, the samples were further pulverized using a pestle and mortar and
sieved using a 60 µm sieve. Portions of sieved soil samples were then diluted with starch
binder in ratios of 1:4 (20%) and thoroughly mixed to homogeneity. Three pellets, each
weighing approximately 350 mg were prepared using a hydraulic press from each sample
for heavy metal analysis.
3.5 Instrumentation of HpGe Gamma Spectroscopy and measurements
For radiation detection, different types of detectors e.g. filled detectors (scintillation
counters, ionization chamber, Geiger-Muller counters, and proportional counters),
scintillation or semiconductor detectors, can be used. The basic principle for all these
radiation detection techniques is generation of an electrical signal once the radiation
interacts with the active volume of the detector (Knoll, 1999). HPGe detector is a one of
the most sensitive and efficient radiation detection instrument, this type of detector was
used for radiation analyses during this study.
Germanium and silicon are some of the most commonly used semiconductor materials in
radiation detection. Detectors made from ultra-pure germanium material are usually

18
referred to as hyper-pure germanium (HpGe) or intrinsic detectors (Knoll, 1999).
Detection and measurement of gamma radiation usually necessitates a thick depletion layer
i.e. a greater sensitive volume (Cember, 2009). At the moment, HpGe detector is popularly
used for detection of gamma radiation. Figure 3.2 gives a schematic representation of
gamma ray spectroscopy used in this study. In general, the unit is made up of HpGe
detector, multichannel analyser (MCA), amplifier (AMP), PC and at times a printer. The
HPGe detector is a coaxial geometry, relative efficiency of 30%.
Measurement of activity of the NORMs in soil samples was done with HPGe gamma
spectrometer (figure 3.2). Samples were run for 12 hours. In addition, the environmental
background radiation was assessed using an empty container, prior to sample
measurements. The background measurements were done for each sample to correct for
net peak intensities of radionuclides of interest.
Figure 3.2: The HpGe gamma spectrometer at the Institute of Nuclear Science &
technology (INST)
From on the obtained gamma photo-peaks in the 232Th- series, 238U equivalent decay series,
and in 40K series, their respective activity concentrations were evaluated. For instance, the
232Th activity concentration was obtained from the mean intensities of 228Ac and 212Pb,
while 238U activity concentrations were calculated from the mean intensities of the 214Bi
and 214Pb (Mohanty et al., 2004) at the respective nuclide energies shown in table 3.1

19
Calibration of the HPGe system is essential in acquiring accurate results (Gilmore &
Hemingway, 1995). This ensures that the acquired spectra are accurately interpreted in
terms of energy and specific activity. It is achieved by performing three key tasks; peak
width calibration, energy calibration, and efficiency calibration, using high quality
standard spectra of appropriate geometry and source matrix (Gilmore & Hemingway,
1995). In this particular study, IAEA standard reference materials; RG-U, RG-K, RG-Th
and Soil-375 were used, Energy calibration was done using SRM-1 1332 Kev and 1172
Kev energy line of 60Co, 241 Am 59.54 Kev and 137Cs - 661.66 Kev lines
The activity concentrations of the NORMs in the sample were calculated by applying
equation 3.1 following evaluation of nuclide spectral line intensities using Oxford PCA3
v.1 software was used for peak deconvolution. The software performs simultaneous fitting
and identification to all the significant photo-peaks in the spectra and displays menu driven
reports that included centroid channel energy, FWHM of identified peak, net peak area,
background counts, intensity and percentage margin of uncertainty.
𝐴𝑠𝑀𝑠
𝐼𝑠=
𝐴𝑟𝑀𝑟
𝐼𝑟 (3.1)
Where: Mr and Ms is the mass of the reference and sample respectively, Ir and Is are the
intensity of reference and sample respectively; Ar and As is the activity of reference and
sample, respectively.
Table 3.1: Recommended energy lines for gamma-ray emitters of environmental
samples (IAEA, 2003)
Radionuclide Isotope(s) Spectral line (KeV)
K- 40 40K 1460.81
Th- 232 212Pb
228Ac
238.63
911.21
U-238
(226Ra)
214Pb
214Bi
351.92
609.31

20
In determining the detection limits (DL) for the radionuclides, equation 3.2 was used,
whereby the gamma-ray spectral data corresponding to the IAEA calibration standards RG-
U, RG-Th and RG-K were used.
𝐷𝐿 =3𝐶√𝐵𝑔
𝑃𝐴 (3.2)
Where: Bg is the background counts obtained from a gamma peak; PA is the net area under
respective gamma photo peaks; C is the activity concentration of the specific radionuclide
of interest (in Bq/Kg).
3.6 Radiological Data Analyses
Determination of the various radiation hazard indices was done using existing models.
The values obtained from the models for the various indices were then compared to
UNSCEAR permissible limits and relevant conclusions made.
From the activity concentrations obtained from this study, the potential radiological
hazards were determined. The activity concentrations of the radionuclides were evaluated
from their respective gamma ray lines or gamma ray lines emitted from their decay
products (Table 3.1). 1460.8 keV spectral line was used to determine 40K, while the mean
activity spectral lines of 238 keV (212Pb) and 911 keV (228Ac) were used to determine 232Th
concentration, and the gamma lines of 609 keV (214Bi) and 351 keV (214Pb) were used to
calculate 226Ra concentration. On the other hand, radiological hazards due to γ-ray
radiation were assessed using radium equivalent activity (Raeq), Gamma index (Iyr) and
external hazard index (Hex; Bashir et al., 2012).
3.6.1 Radium equivalent
Natural soil samples contain primordial radionuclides to varying degrees. The index used
to calculate the associated potential radioactive hazards is the Radium Equivalent. To
model radium equivalent an assumption that 4810 Bq kg-1 of potassium-40, 259 Bq kg-1 of
thorium-232 and 370 Bq kg-1 of Uranium-238 have equivalent dose (Kolo et al. 2015;
Dabayneh et al. 2008) . Equation 3.3 is used to calculate radium equivalent.
Req = AU + 1.43 ATh + 0.077 AK (3.3)
Where Au, Ath and Ak are the activity concentrations of uranium-238, thorium-232 and
potassium-40 respectively.

21
3.6.2 Gamma Index
It is an index used as an indicative radioactive hazard potential associated with the
materials.
𝐼𝑦𝑟 =1
150𝐴𝑈 +
1
100𝐴𝑇ℎ +
1
1500𝐴𝐾
Where Au is the activity concentration of uranium-238, Ath the activity concentration of
thorium-232 and Ak the activity concentration of potassium-40.
3.6.3 External Hazard Index
External hazard index and internal hazard index are used to limit the required dose rate
annually to 1 mSv y-1, the model is outlined by Beretka & Mathew (1985)
𝐻𝑒𝑥 =𝐴𝑈
370+
𝐴𝑇ℎ
259+
𝐴𝐾
4810 3.5 (a)
Where: ATh, AU and AK is the specific activities of 232Th, 238U and 40K respectively.
On the other hand, internal hazard index is evaluated using the equation
𝐻𝑖𝑛 =𝐴𝑈
185+
𝐴𝑇ℎ
259+
𝐴𝐾
4810 3.5 (b)
3.6.4 Absorbed dose
The absorbed dose rates in air (D) were estimated from the obtained activity concentration
40K, 232Th and 238U, using equation 3.6 (UNSCEAR 1993).
𝐷 = 0.427𝐴𝑈 + 0.662ㄲ𝑇ℎ + 0.043𝐴𝐾 (3.6)
ATh, AU and AK is the specific activities of 232Th, 238U and 40K respectively
3.6.5 Annual Effective Dose
The annual effective dose (E) due to NORMs was calculated by applying equation 3.7
(UNSCEAR, 1993). An outdoor occupancy factor (f) of 0.4 and a dose conversion
coefficient (Q) of 0.7 Sv Gy-1 was used to convert the absorbed dose rate in air to the
effective dose were used (UNSCEAR, 2000).
𝐸 = 𝑇𝑓𝑄𝐷
Where; T = total seconds per year.
(3.4)
(3.7)

22
3.7 EDXRF Elemental Analyses
In this study, Amptek Experimenters’ Kit X-123 SSD spectrometer was used. The
spectrometer consists of the X-ray tube for sample excitation with collimators, to focus X-
rays on the crystal and detector and a Si(Li) detector. The equipment was operated at 30
KV and 80 µA.
The samples were measured in air and irradiated for 50 seconds. The obtained spectra were
evaluated for intensities by non-linear least square fitting software called AXIL (Analysis
of X-Ray Spectra Interactive Least Square Fitting) and QAES (Quantitative Analysis of
Environmental Sample) software from the IAEA.
To validate the analytical procedure, certified reference materials (CRM) were used, and
detection limits determined. For this particular study, river clay CRM from IAEA was
prepared and analyzed in a similar way as the samples.
The lower limit of detection is the concentration equivalent to three standard counting
errors of a set of measurements of the background intensity (Bertin, 1970; Jenkins and
Gilfrich, 1992). In this study, the lower limit of detection was determined from
measurement of a standard reference PTXRF-09 and the values calculated by using
equation 3.8.
𝐿𝐿𝐷 =3𝐶√𝑅𝑏
𝑃 (3.8)
Where: Rb is the background area of the element; P is the peak area of the element; and C
is the concentration of the element in mg kg-1.
23
CHAPTER FOUR: RESULTS AND DISCUSSION
4.1 Overview
The results of the radioactivity measurements are presented and discussed in this chapter,
in addition to the results for the elemental analyses of the samples. Results for the
validation of the analytical methods used will also be presented.
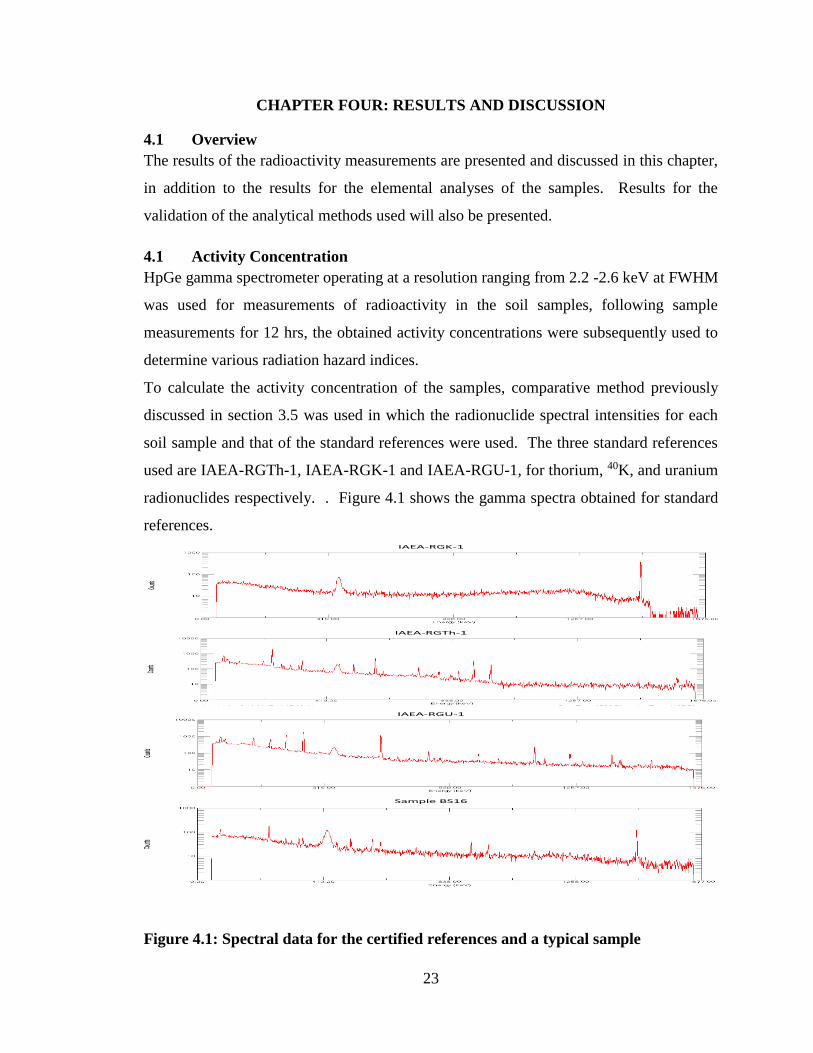
4.1 Activity Concentration
HpGe gamma spectrometer operating at a resolution ranging from 2.2 -2.6 keV at FWHM
was used for measurements of radioactivity in the soil samples, following sample
measurements for 12 hrs, the obtained activity concentrations were subsequently used to
determine various radiation hazard indices.
To calculate the activity concentration of the samples, comparative method previously
discussed in section 3.5 was used in which the radionuclide spectral intensities for each
soil sample and that of the standard references were used. The three standard references
used are IAEA-RGTh-1, IAEA-RGK-1 and IAEA-RGU-1, for thorium, 40K, and uranium
radionuclides respectively. . Figure 4.1 shows the gamma spectra obtained for standard
references.
Figure 4.1: Spectral data for the certified references and a typical sample
IAEA-RGK-1
IAEA-RGTh-1
IAEA-RGU-1
Sample BS16

24
Since the method involves direct comparison of the intensities of the radionuclides in the
reference standard to that of the sample effectively minimizes matrix effects such as self-
attenuation, coincidence summation etc. and half-life correction will cancel out. The
effects due to density are minimized by adoption of similar geometry as that used for
measurements for both reference material and the sample.
To achieve the best estimate of the activity concentration, a weighted mean analysis is
employed for activity determination; use of at least two discrete gamma-ray lines from the
same decay series thereby ensuring a significant reduction in the statistical uncertainty of
the derived activity concentrations. 232Th activity concentration was determined from the
average concentrations of 212Pb and 228Ac in the samples, while that of 238U equivalent was
determined from the average concentrations of the 214Pb and 214Bi decay products
(Mohanty et al., 2004).
Table 4.1: Certified reference material activity concentrations and detection limits;
IAEA-RGTh-1, IAEA-RGU-1 and IAEA-RGK-1 respectively
Radionuclide Certified Activity
conc.
Certified range Detection limits
232Th (Bqkg-1) 3250 3160-3340 30
238U (Bqkg-1) 4940 4910-4970 5
40K (Bqkg-1) 14,000 13600-14400 5
In general, 40K was found to be the greatest contributor to radiation exposure in the study
area with a mean activity concentration of 427 ± 227s Bq kg-1, as compared to 232Th and
238U at 116 ± 69 Bq kg-1 and 33 ± 22 Bq kg-1, respectively. While the activity concentration
of 238U was within the reported global mean of 35 Bqkg-1, 40K and 232Th radionuclides were
determined at levels slightly above the global mean of 400 Bq kg-1and 30 Bq kg-
1(UNSCEAR, 2000).
Table 4.2 presents a summary of the activity concentrations of the 36 samples measured in
terms of mean, minimum and maximum concentrations, while figure 4.2 shows variations
in activity concentrations in the soil samples for this study.

25
Table 4.2: Summary of the obtained activity concentrations in Bqkg-1
Descriptive statistics 40K 238U 232Th
Average 427 33 116
Standard deviation 227 22 69
Minimum 64 5 19
Maximum 1084 107 248
Figure 4.2: Sample wise distribution of activity concentration due to 238U, 232Th and 40K from measured samples.
26
Generally, the three radionuclides i.e. 232Th, 238U and 40K were randomly distributed in the
study area. For instance, 40K activity concentration ranged between 1084 Bq kg-1at site
S22 to 64 Bq kg-1 at site S9, with an average of 427 ± 116 Bq kg-1. For 232Th, the highest
activity concentration was reported at site S18 (284 Bq kg-1), while the lowest activity
being recorded at site S9 at 19.7 Bq kg-1. Comparatively lower activity concentrations
were reported for 238U, ranging between 5 – 107 Bq kg-1. Similar observation was made
by Harb et al. (2014), where great variability in activity concentrations was recorded over
a distance of few meters. This observation could be attributed to difference in physical,
chemical and geochemical properties of the samples (Assie et al., 2016).
The results obtained in soil samples are within the global average activity concentration set
at of 400 Bq kg-1, 35 Bq kg-1, and 30 Bq kg-1, for 40K, 232Th and 238U radionuclides
(UNSCEAR, 2000). These values are however lower than some values reported in similar
environments. A study by Patel et al. (2011) in Migori gold mines, Western Kenya, to
assess the degree of exposure to miners determined the mean activity concentrations at
409.5 Bqkg-1 for 232Th, 195.3 Bqkg-1 for 238U and 40K at 915.6 Bqkg-1. The values were
comparable to those obtained by Girrigisu et al. (2014), in the artisanal gold mines of
Awwal in Nigeria, where the highest mean activity concentration was recorded for 40K at
425 ± 5.6 Bqkg-1, followed by 238U (23 ± 2.01 Bqkg-1), and 232Th (19 ± 1.2 Bqkg-1).
Likewise, Ademola et al. (2015) in a similar study around Itagunmodi gold mines reported
the mean activity levels for 238U, 40K, and 232Th at 55 ± 1.2 Bqkg-1, 505 ± 7.1 Bqkg-1 and
26 ± 2.7 Bqkg-1, respectively.
Figure 4.3 shows the relative abundance of NORMs in the soil samples. About 74 % of the
total measured activity concentrations was contributed by 40K; 5% by 238U and 20% by
232Th. Similar observation was made by Kabasa (2015), where 40K was found to be the
most abundant at 973 ± 401 Bq kg-1 (90%), followed by 232Th at 69 ± 28 Bq kg-1 (6%) ,
and finally 238U at 40 ± 15 Bq kg-1 (4%). The high potassium concentrations can be
attributed to the presence of potassium bearing minerals; biotite, muscovite, orthoclase,
microcline, feldspars, radioactive minerals; smectite, kaolite. (Okeyode & Ganiyu, 2009).
The level of 232Th reported may be associated to the geology of the area. However, for a
definite conclusion, it is necessary to undertake a detailed geochemical survey.

27
Figure 4.3: Relative abundance of the radionuclides in soils
There is a strong correlation between 238U and 232Th in the soil samples analyzed in this
study
Fig. 4.4, 4.5& 4.6 shows the correlation between the radionuclides 40K , 232Th and 238U
Figure 4.4: Correlation between the activity concentration of 238U and 232Th.

28
Figure 4.5: Correlation between the activity concentration of 238U and 40K.
Figure 4.6: Correlation between the activity concentration of 40K and 232Th
4.2 Radiation Hazard Indices
Various indices were applied in the determination of potential radiological risks due to γ-
ray radiation. These include, Gamma index (Iγr), radium equivalent activity (Raeq),
external and internal hazard, annual effective dose and absorbed dose rate. Table 4.3 shows
a summary of these indices in the samples analyzed in this study. These indices are
calculated based on the obtained activity concentrations of the NORMs as presented in
table 4.2.

29
The radium equivalent values were found to range between 128 – 529 Bq kg-1, with an
average of 232 ± 38 Bq kg-1, which is above the world average of 160 Bq kg-1, but within
the acceptable limit of 350 Bq kg-1 (UNSCEAR, 2000)..
Figure 4.7: Variation of radium equivalent in the samples
Gamma radiation index (Iyr) is used as a screening parameter for materials for possible
radiation health effects. In this study, a mean of 1.66 ± 0.28 is reported. The average
exceeds the dose criteria where the value of gamma of than less than one (≤1), to
correspond to an annual effective dose of ≤1 mSv (Ravisankar et al. 2014).
Descriptive
statistics
Req
(Bq kg-1)
Iyr Hex Hin Dr E
Mean 232 1.66 0.62 0.72 103 0.25
Stdev 38 0.28 0.11 0.12 17 0.04
Max 529 3.77 1.43 1.62 232 0.57
Min 128 0.91 0.34 0.39 56 0.14
Req
Table 4.3: Calculated radiation hazard indices

30
Figure 4.8: shows the variation of gamma index in the samples
Internal (Hin) and external (Hex) hazard indices are used to quantify the risks of internal and
external exposure to gamma radiation. According to UNSCEAR (2000), a value of the
index less than unity is considered insignificant.
Fig 4.9 shows the variation of Hex and Hin in the samples in which the obtained mean values
is 0.62 ± 0.11 and 0.72 ± 0.14 for Hex and Hin respectively, can then be concluded that the
radionuclides do not pose any significant risk.
Figure 4.9: Variation of Hex & Hin in the samples
The absorbed dose rates (DR) due to gamma radiations were estimated on assumption that
226Ra, 232Th and 40K are uniformly distributed, and that other radionuclides contribute
insignificantly to the total environmental background dose (Leung et al. 1990; Jacob et al.
1986). The obtained values ranged between 19 nGy/h and 156 nGy/h in the samples fig

31
(4.10). These values were further applied in calculation of the annual effective dose with
an assumption of outdoor occupancy factor of 0.4. An average of 0.14 ± 0.04 mSv/y (Fig
4.11) was recorded against the non-occupation exposure limit of 1 msvy-1, which is below
the global mean value of the annual effective dose set at 0.5 mSv y-1 and a range of 0.3 -
0.6 mSv yr-1 for individual countries (Senthilkumar et al., 2010; UNSCEAR, 2000).
Figure 4.10: Variation of absorbed dose rates in the samples
4.3 Elemental Concentrations
Elemental content of the soil samples from Lolgorian gold mines was determined using
Energy Dispersive X-ray Spectroscopy (AMPTEK Experimenter’s Kit). To validate the
Annual Effective Dose Equivalent
Figure 4.11: Variation of annual effective dose equivalent in the samples

32
analytical method, certified reference material; IAEA-PTXRF-09, from International
Atomic Energy Agency was analyzed for comparison of the results of measurement (Table
4.4). Preparation and analytical procedure similar to that of the samples was employed.
The obtained experimental results were comparable to the certified values, as presented in
table 4.4.
Table 4.4: Results of the analyses of IAEA-PTXRF09 certified reference material
Element Experimental value Certified value Certified range
K (1.78 ± 0.29) % (1.95 ±0. 11) % (1.84 – 2.06) %
Ca (1.29 ± 0.09) % (1.38 ± 0.10) % (1.28 – 1.48) %
Fe (3.01 ± 0.14) % (2.97 ± 0.15) % (2.82 – 3.12) %
Ti (4286 ± 360) ppm (4300 ± 290)ppm (4010 – 4590)ppm
Mn (1047 ± 87) ppm (1000 ± 90)ppm (930 – 1090) ppm
Zn (93 ± 11) ppm (96 ± 7.7) ppm (88.3 – 103.7) ppm
Rb (114 ± 9.1) ppm (107 ± 8.4) ppm (98.6- 115.4) ppm
Zr (325 ± 24) ppm (302 ± 20.4) ppm (281.6 – 322.4) ppm
Pb (43 ± 7.9)ppm (36.9 ± 5.1)ppm (31.8 – 42.0) ppm
Iron is a major constituent in the soil samples analyzed in this study. Concentration ranges
of between 1.92 % at site S11 to 30 % at site S36, with a mean concentration of (9.22 ±
7.70) %, are reported. Generally, the iron concentrations in soils are usually high, where
concentrations range between (0.5 – 5) % is recorded in uncontaminated soils (Kabata-
Pendias and Pendias, 1992). Therefore, these soil are highly enriched with iron, the values
are comparable to those obtained by Odumo (2009), in a study in Migori gold mines,
Southern Nyanza, Kenya, where iron was determined as the most abundant element at a
concentration range of between 10.5 % to 24.5 %.
33
Titanium and manganese are some of the minor elemental constituents in the soil samples,
with mean concentration reported at 4370 ± 2500 mg kg-1 and 1870 ± 1500 mg kg-1
respectively. The highest Ti concentration level was reported at site S12 (11100 mg kg-1),
while the lowest concentration was recorded at site S6 (684 mg kg-1). These concentration
values are comparable to those reported by Odumo (2009), at between 171 – 13000 mg kg-
1. However, these values are lower than those reported by Maina et al. (2012), near titanium
mine in Kenyan coastal region, where Ti concentration range of (0.13 % to 2.81 %) are
reported. Patel and Mangala (1994), reported higher values in their studies conducted in
Mrima Hill, Kenya, where Ti was determined as the major constituent with an uneven
distribution in the concentration range of 1.00 % to 9.00 % and a mean concentration of
4.69 %, the highest Mn concentration was recorded at site S12 at 5741 ± 182 mg kg-1, while
the lowest concentrations at site S19. A strong positive correlation was observed between
Ti and Mn concentrations (R= 0.74) as shown by table 4.6, whereby both elements reported
highest concentrations at site S12 and low concentrations at site S19 and S16. Table 4.5
shows the results of elemental composition in soil samples

34
Element Ti (mg kg-1) Mn (mg kg-1) Fe (W%) Zn (mg kg-1) Rb (mg kg-1) Zr (mg kg-
1)
Pb (mg kg-1)
S1 4641 ± 365 1032 ± 68 5.4 ± 0.1 82 ± 10 115 ± 4.9 515 ± 9.9 37 ± 8.3
S2 6049 ± 406 1193 ± 76 7.2 ± 0.2 83 ± 13 85 ± 4.4 220 ± 6.7 40 ± 7.5
S3 5444 ± 389 1754 ± 89 6.7 ± 0.2 63 ± 15 160 ± 6.2 253 ± 7.5 48 ± 7.2
S4 5789 ± 437 2368 ± 107 6.7 ± 0.1 67 ± 11 119 ± 4 272 ± 7 41 ± 8
S5 3968 ± 513 932 ± 128 26.0 ± 0.4 19 ± 15 25 ± 3 213 ± 7 239 ± 17
S6 684 ± 174 852 ± 58 4.8 ± 0.1 26 ± 8 16 ± 2 144 ± 5 185 ± 10
S7 4695 ± 396 5283 ± 215 8.8 ± 0.2 132 ± 14 117 ± 5 334 ± 8 51 ± 8
S8 989 ± 165 556 ± 54 3.0 ± 0.2 18 ± 9 32 ± 3 144 ± 6 528 ± 32
S9 4630 ± 352 2259 ± 129 12.3 ± 0.3 86 ± 9 39 ± 3.2 78 ± 4 51 ± 7
S10 1433 ± 169 564 ± 56 2.2 ± 0.1 179 ± 16 33 ± 3 141 ± 5 503 ± 29
S11 1671 ± 137 486 ± 36 1.9 ± 0.1 25 ± 5 37 ± 2 206 ± 5 27 ± 5
S12 11100 ± 600 5741 ± 182 21.7 ± 0.3 85 ± 16 147 ± 6 417 ± 11 50 ± 8
S13 5717 ± 350 2264 ± 86 6.3 ± 0.1 39 ± 6 65 ± 3 369 ± 8 27 ± 5
S14 8239 ± 454 5166 ± 173 16.1 ± 0.3 98 ± 14 73 ± 4 124 ± 5 50 ± 8
S15 5944 ± 465 1102 ± 70 5.8 ± 0.1 65 ± 12 125 ± 5 209 ± 7 30 ± 7
S16 9761 ± 423 2533 ± 106 13.6 ± 0.2 792 ± 31 96 ± 5 77 ± 4 444 ± 21
S17 4792 ± 315 1535 ± 98 5.6 ± 0.2 54 ± 11 122 ± 5 260 ± 7 44 ± 8
Table 4.5: Elemental Concentrations in soils samples

35
Element Ti (mg kg-1) Mn (mg kg-1) Fe (W%) Zn (mg kg-1) Rb (mg kg-1) Zr (mg kg-1) Pb (mg kg-1)
S18 7334 ± 410 4248 ± 175 14.9 ± 0.3 181 ± 18 100 ± 4 157 ± 5 320 ± 16
S19 1703 ± 201 377 ± 37 2.4 ± 0.1 71 ± 10 30 ± 2 148 ± 5 714 ± 27
S20 1344 ± 148 510 ± 42 1.9 ± 0.1 13 ± 5 26 ± 2 110 ± 4 20 ± 4
S21 5804 ± 502 3033 ± 150 18 .0± 2.0 227 ± 16 33 ± 3 80 ± 5 40 ± 8
S22 3943 ± 281 1523 ± 82 5.2 ± 0.1 41 ± 12 105 ± 4 182 ± 5 31 ± 7
S23 1886 ± 209 805 ± 72 2.9 ± 0.2 127 ± 16 37 ± 3 139 ± 5 642 ± 35
S24 1860 ± 228 882 ± 83 4.2 ± 0.3 137 ± 16 52 ± 4 253 ± 9 594 ± 39
S25 1411 ± 158 650 ± 54 3.4 ± 0.1 115 ± 13 30 ± 3 157 ± 6 366 ± 22
S26 4951 ± 334 4201 ± 148 7.0 ± 0.1 82 ± 15 126 ± 5 372 ± 9 28 ± 7
S27 4713 ± 336 839 ± 65 4.6 ± 0.1 59 ± 10 133 ± 5 182 ± 8 30 ± 7
S28 782 ± 139 432 ± 41 2.3 ± 0.1 31 ± 8 19 ± 2 89 ± 5 238 ± 12
S31 5751 ± 333 3053 ± 156 11.0 ± 0.2 222 ± 17 70 ± 3 168 ± 6 126 ± 11
S32 3776 ± 552 1079 ± 138 27.3 ± 0.4 22 ± 14 24 ± 3 178 ± 7 233 ± 14
S33 4879 ± 361 1699 ± 96 6.3 ± 0.2 72 ± 14 156 ± 6 253 ± 7.5 45 ± 7
S34 4327 ± 492 2613 ± 120 13.5 ± 0.3 111 ± 18 32 ± 3 87 ± 4 39 ± 8
S35 3614 ± 486 1148 ± 140 30.0 ± 0.5 40 ± 6 19 ± 3 143 ± 6 206 ± 15
S36 4713 ± 336 839 ± 65 4.6 ± 0.1 59 ± 10 133 ± 5 182 ± 5 30 ± 7

36
Zirconium was determined within moderate levels in all the samples analyzed in this study, and
ranges between 77 – 515 mg kg-1 with a mean of 202 ± 102 mg kg-1. These values are comparable
to the values of Mrima Hill reported by Patel and Mangala (1994), at between 94 mg kg-1 and 720
mg kg-1 and a mean of 251 mg kg-1. The values were however lower than those reported by Maina
et al. (2012), in a study around a titanium mine at a range of 280 mg kg-1 to 3300 mg kg-1, with a
mean of 1190 mg kg-1.
Table 4.6 shows the inter-elemental correction matrix. Zirconium distributions correlate strongly
to those of rubidium(r=0.57). Zinc, rubidium and lead were also determined above detection limits
in all samples. Zinc concentrations ranged between 20 – 792 mg kg-1, with an average of 102 mg
kg-1. These values are lower than those reported by Odumo (2009), at a range of 580 mg kg-1, in
Migori gold mines, western Kenya. For Rb, a mean of 74 ± 47 mg kg-1 was recorded in these
samples, the reported values were comparable to those obtained by Odumo (2009), at below 100
mg kg-1. Rb was found to correlate strongly with Ti (R = 0.62), and weakly with Mn (r = 0.41).
Lead is a non-essential metal in human physiology and can be toxic even at low concentrations, a
concentration value of between 20 – 714 mg kg-1 and a mean of 180 mg kg-1 were recorded in this
study. The mean Pb concentrations reported were higher than those reported globally in surface
soils at 35 mg kg-1 and in varying ranges from 10 to 70 mg kg-1 (Wuana & Okieimen, 2011),
however the concentration is lower than the value reported by Odumo (2009), at a mean of 1473
mg kg-1.
Table 4.6: Inter-element Correlation matrix
Variables Ti Mn Fe Zn Rb Sr Zr Pb
Ti 1
Mn 0.74 1
Fe 0.47 0.39 1
Zn 0.45 0.25 0.09 1
Rb 0.62 0.41 -0.13 0.10 1
Sr -0.10 -0.27 0.05 -0.18 0.12 1
Zr 0.28 0.28 -0.06 -0.22 0.57 0.17 1
Pb -0.40 -0.34 -0.13 0.27 -0.46 -0.01 -0.32 1
Values in bold are different from 0 with a significance level
alpha=0.05

37
CHAPTER FIVE: CONCLUSION AND RECOMMENDATIONS
5.1 Conclusion
The study assessed the radiological hazards posed to the miners and residents, due to presence of
natural radionuclides in soils from Kilimapesa gold mines in Lolgorian-Narok County. To achieve
this objective, activity concentration of 40K, 232Th and 238U, in the soil samples were determined.
The obtained radionuclide activity concentrations were used to estimate radiation risks posed,
using different radiation hazard indices models. In addition, elemental content of the soil samples
was determined.
In general, 40K was found to be the greatest contributor to radiation exposure in the study area with
a mean activity concentration of 427 ± 116 Bq kg-1, as compared to 232Th and 238U at 116 ± 69 Bq
kg-1 and 33 ± 22 Bq kg-1 respectively. While the activity concentration of 238U was within the
reported global mean of 35 Bqkg-1, 232Th and 40K radionuclides were determined at values slightly
above the global mean of 30 Bq kg-1 and 400 Bq kg-1, respectively. The three radionuclides were
not uniformly distributed in the study area soils. For instance, 40K activity concentration ranged
between 64 Bq kg-1 to 1084 Bq kg-1, with a mean of 427 ± 116 Bq kg-1, while 238U ranged between
5 – 107 Bq kg-1. This observation could be attributed to difference in physical, chemical and
geochemical properties of the samples over small distances.
To assess potential radiological hazards due to gamma radiation, various radiation hazard indices
such as radium equivalent activity, gamma index, external and internal hazard index, absorbed
dose rate and annual effective dose, were determined. In general the values of these indices
although higher than the global averages, indicated that there was no significant radiation risk as
a result of NORMs in the study area.
Iron, Ti, Zn, Mn, Zr, Rb and Pb, were determined as the principal constituents in all the sampling
sites selected for the study. Iron was the major constituent in the soil samples, followed by Ti and
Mn, with a mean concentration of 9.22 ± 7.70 %, 4370 ± 2500 mg kg-1, and 1869 ± 1509 mg kg-1
respectively. Mean concentrations below 100 mg kg-1, were recorded for Zn, Zr, Rb and Pb.
5.2 Recommendations
From the results and conclusions drawn from this study the following are recommended:
1) Regular monitoring of radioactivity in Lolgorian;
2) To measure the ambient atmosphere absorbed and annual effective dose;
3) Analyze radioactivity in water sources; rivers, boreholes, as well as in biological samples.
38
REFERENCES
Ahmad, N., Jaafar, M.S., Bakhash, M. and Rahim, M., 2015. An overview on measurements of
natural radioactivity in Malaysia. Journal of Radiation Research and Applied
Sciences, 8(1), pp.136-141.
Ayham A., Abdul-Jabbar A., Awatif S. and Asia H. (2016). Determination of natural radioactivity
by gamma spectroscopy in Balad soil, Iraq. Advances in Applied Science Research, 7(1):
35 – 41.
Beretka, J. and Mathew, P.J., 1985. Natural radioactivity of Australian building materials,
industrial wastes and by-products. Health physics, 48(1), pp.87-95.
Charles, M., 2001. UNSCEAR Report 2000: sources and effects of ionizing radiation. Journal of
Radiological Protection, 21(1), p.83.
Eisenbud, M. and Gesell, T.F., 1997. Environmental Radioactivity from Natural, Industrial &
Military Sources: From Natural, Industrial and Military Sources. Academic press.
Ghiassi-Nejad, M., Mortazavi, S.M.J., Cameron, J.R., Niroomand-Rad, A. and Karam, P.A., 2002.
Very high background radiation areas of Ramsar, Iran: preliminary biological
studies. Health Physics, 82(1), pp.87-93.
Girigisu, S., Ibeanu, I.G.E., Adeyemo, D.J., Onoja, R.A., Bappah, I.A. and Okoh, S., 2014.
Assessment of radiological levels in soils from artisanal gold mining exercises at Awwal,
Kebbi state, Nigeria. Research Journal of Applied Sciences, Engineering and
Technology, 7(14), pp.2899-2904.
Goldplat, assessed on 14April 2016, http://www.goldplat.com/projects/kilimapesa-gold-kenya
Harb S., El-Kamel A. H., Zahran A. M., Abbady A. and Ahmed F. A. (2014). Assessment of
natural radioactivity in soil and water samples from Aden governorate South of Yemen

39
region. International Journal of Recent Research in Physics and Chemical Sciences,1(1):
1 - 7
Hashim, N.O., Rathore, I.V.S., Kinyua, A.M. and Mustapha, A.O., 2004. Natural and artificial
radioactivity levels in sediments along the Kenyan coast. Radiation Physics and
Chemistry, 71(3), pp.805-806.
Kabasa, S.O. (2014) Environmental Radiation Exposure Hazard Associated With Coal Deposits
of Mui Basin Block C, Kitui County. M.Sc Thesis, University of Nairobi. Pp 38-42.
Knoll, G.F., 2010. Radiation Detection and Measurement. John Wiley & Sons.
Nderitu, S.K., Maina, D.M. and Kinyua, A.M., 2001. Natural gamma radiation levels, indoor and
water 222 RN Concentrations in soil division of Kerio valley, Kenya.
Njinga, R.L. and Tshivhase, V.M., 2016. Lifetime cancer risk due to gamma radioactivity in soils
from Tudor Shaft mine environs, South Africa. Journal of Radiation Research and Applied
Sciences.
Odumo, B., Carbonell, G., Angeyo, H.K., Patel, J.P., Torrijos, M. and Martín, J.A.R., 2014. Impact
of gold mining associated with mercury contamination in soil, biota sediments and tailings
in Kenya. Environmental Science and Pollution Research, 21(21), pp.12426-12435.
Odumo, O.B., Mustapha, A.O., Patel, J.P. and Angeyo, H.K., 2011. Radiological survey and
assessment of associated activity concentration of the naturally occurring radioactive
materials (NORM) in the Migori artisanal gold mining belt of southern Nyanza,
Kenya. Applied Radiation and Isotopes,69(6), pp.912-916.
Osoro, M.K., Rathore, I.V.S., Mangala, M.J. and Mustapha, A.O., 2011. Radioactivity in Surface
Soils around the Proposed Sites for Titanium Mining Project in Kenya. Journal of
Environmental Protection, 2(4), p.460.

40
Otwoma, D., Patel, J.P., Bartlol, S. and Mustapha, A.O., 2012. Radioactivity and dose assessment
of rock and soil samples from Homa Mountain, Homa Bay County, Kenya. In XI Radiation
Physics and Protection Conference, Cairo, Egypt (pp. 25-28).
Otwoma, David An investigation of the Radioecology of the Carbonatite deposits in the Homa
Mountain region in South Nyanza, Kenya (2012).
Patel, J.P., 1991. Environmental radiation survey of the area of high natural radioactivity of Mrima
hill of Kenya. Discovery and innovation, 3(3), pp.31-35.
Senthilkumar, G., Raghu, Y., Sivakumar, S., Chandrasekaran, A., Anand, D.P. and Ravisankar,
R., 2014. Natural radioactivity measurement and evaluation of radiological hazards in
some commercial flooring materials used in Thiruvannamalai, Tamilnadu, India. Journal
of Radiation Research and Applied Sciences, 7(1), pp.116-122.
Sharma, N., Singh, J., Esakki, S.C. and Tripathi, R.M., 2016. A study of the natural radioactivity
and radon exhalation rate in some cements used in India and its radiological
significance. Journal of Radiation Research and Applied Sciences, 9(1), pp.47-56.
United Nations Scientific Committee on the Effects of Atomic Radiation sources, Effects and Risks
of Ionizing Radiation UNSCEAR 2012 Report to the General Assembly
United Nations. Scientific Committee on the Effects of Atomic Radiation, 2008. Effects of Ionizing
Radiation: Report to the General Assembly, with scientific annexes (Vol. 1). United
Nations Publications.
Uosif, M.A.M., Issa, S.A. and El-Salam, L.A., 2015. Measurement of natural radioactivity in
granites and its quartz-bearing gold at El-Fawakhir area (Central Eastern Desert),
Egypt. Journal of Radiation Research and Applied Sciences, 8(3), pp.393-398.
Valentin, J. ed., 2007. The 2007 Recommendations of the International Commission on
Radiological Protection (pp. 1-333). Oxford, UK: Elsevier.