Embed Size (px)
Citation preview

for the Food and Beverage Industries
1st Edition
Environmental MonitoringHandbook

The 3M Environmental Monitoring Handbook is intended to provide general guidance only. The technical
information, recommendations and other statements contained in this document are based on experience
and information that 3M believes to be reliable, but the accuracy or completeness of such information is not
guaranteed. Such information is intended for persons with knowledge and technical skills sufficient to assess
and apply their own informed judgement to the information, taking into consideration the nature of their
business, existing policies and particular laws and regulations that might apply.

Environmental Monitoring Handbook - Table of Contents
Environmental Monitoring Handbook for the Food and Beverage Industries
TABLE OF CONTENTS
ATP and Protein-based Hygiene MonitoringLouise Roberts | Alimenti Food Sciences Ltd
Gareth Lang | 3M Food Safety
Burcu Yordem | 3M Food Safety
CHAPTER 2
The Importance of Environmental Sampling in Food Safety and Quality ProgramsMartin Wiedmann | Cornell University Department of Food ScienceAlexandra Belias | Cornell University Department of Food ScienceGenevieve Sullivan | Cornell University Department of Food ScienceJohn David | 3M Food Safety
CHAPTER 1
Environmental Monitoring for Indicator Organisms Kelly Stevens | General MillsJean-Francois David | 3M Food SafetyCari Lingle | 3M Food Safety
CHAPTER 3
CHAPTER 4
Environmental Monitoring for PathogensMartin Wiedmann | Cornell University Department of Food ScienceAlexandra Belias | Cornell University Department of Food ScienceGenevieve Sullivan | Cornell University Department of Food ScienceChristian Blyth | 3M Food Safety
Key Terms and Definitions iii
1
11
29
41
i

Environmental Monitoring Handbook - Table of Contents
Environmental Monitoring for Allergens
Thomas Grace | Bia DiagnosticsKen Davenport | 3M Food SafetyGabriela Lopez Velasco | 3M Food Safety
CHAPTER 6
73
Driving Meaningful Change in Your Organization Through Culture and Environmental Monitoring
John Butts | Food Safety By DesignLone Jespersen | CultivateMichele Fontanot | 3M Food Safety
CHAPTER 7
85
Environmental Sampling Guidance
Scott Egan | 3M Food SafetyBurcu Yordem | 3M Food Safety
CHAPTER 8
95
TABLE OF CONTENTS (Cont.)
107About the Contributors
CHAPTER 5
Environmental Monitoring for Spoilage OrganismsRandy Worobo | Cornell University Department of Food ScienceAbigail Snyder | The Ohio State University Department of Food Science and Technology Cari Lingle | 3M Food Safety
59
ii

Environmental Monitoring Handbook - Terms and Definitions
Key Terms and Definitions
iii
Term Definition
Adenosine triphosphate (ATP)
Energy molecule present in every cell, alive or dead.
Aggressive sampling1 Increased frequency and/or scope of sampling in response to a positive sample result. May also include addition of post-rinse sampling and other advanced sampling approaches.
Biofilm
Thin, slimy film of densely-packed bacteria that adheres to a surface. Biofilms may form on rough or scratched surfaces and in hard-to-reach areas, making them difficult to eliminate. Biofilms can represent a persistent harborage for microorganisms and a source of contamination of food products, as they can contain spoilage organisms or pathogens.
Microbiota The population of microorganisms found in a specific environment.
Clean out-of-place (COP)
Method of cleaning equipment items by removing them from their operational area and taking them to a designated station for disassembly and cleaning.
Clean-in-place (CIP) Method of cleaning interior surfaces of process equipment, pipes, vessels, filter and associated fittings without disassembly.
Correction2,3
An action to eliminate a detected nonconformity. These can be immediate activities to identify and correct a problem that occurred during the production of food, such as re-cleaning and sanitizing a line before start-up of production when food residue remains after cleaning. This should not be confused with corrective action, as it may not address the cause of the problem.
Corrective action2,3
An action to eliminate the cause of a detected nonconformity or other undesirable situation, to prevent recurrence. This should not be confused with correction, which may not address the cause, or preventive action, which is taken to prevent occurrence of a potential problem.
Corrective and preventive action (CAPA)4
A quality management concept found within GMP, HACCP and ISO standards that aims to rectify a task, process, product or behavior that has resulted in errors or deviations from the intended plan. CAPA is split between two distinct functions – corrective actions and preventive actions – to systematically investigate the cause of the identified problems and prevent their recurrence or occurrence, respectively.
Critical control point (CCP)2,5
A point, step, or procedure in a food process at which control can be applied and is essential to prevent or eliminate a food safety hazard or reduce the hazard to an acceptable level.
Critical limit5
A maximum and/or minimum value to which a biological, chemical or physical parameter must be controlled at a CCP to prevent, eliminate or reduce to an acceptable level the occurrence of a food-safety hazard.

Environmental Monitoring Handbook - Terms and Definitions
iv
Term Definition
Environmental monitoring program (EMP)
Defined program for monitoring the environment of a food manufacturing facility to prevent cross contamination of the finished product from the environment. The term EMP typically is used to describe a program that verifies cleaning, sanitation, and other environmental pathogen control programs, and an EMP typically include sampling sites, frequency, testing methodology, acceptable criteria and corrective actions. More broadly, environmental monitoring programs often encompass a range of tests – from ATP and indicator organisms to pathogens, spoilage organisms, and allergens – and may serve to perform either validation or verification of specific prerequisite programs (e.g., sanitation and sanitary equipment design) or may be more generally seen as a strategy to monitor the environment for unhygienic conditions that may lead to food safety and/or quality issues.
Environmental monitoring sampling zones1,6,7,8,9
Environmental sampling programs use a zone classification to identify the risk level of areas or sites where product may be exposed to post-lethality environmental contamination. In most countries and regions, sampling sites in processing facilities are assigned to one of four zones: (i) Zone 1 is the highest-risk area consisting of exposed food contact surfaces; (ii) Zone 2 contains non-food contact surfaces in close proximity to food and food contact surfaces, (iii) Zone 3 contains more remote non-food contact surfaces located in or near the processing area; (iv) Zone 4 includes non-food contact surfaces outside of the processing areas. In some countries, sampling sites may be classified into three zones, typically combining Zones 2 and 3 into one zone.
FirefightingThe (often-unsuccessful) approach of repeatedly attempting the same solution on a recurring problem in effort to obtain microbiological control.
For-cause1 Investigative sampling that follows a positive sample from a product, contact surface or other verification site.
Good manufacturing practices (GMP)
The conditions and practices for processing safe food under sanitary conditions, including personnel, plant and grounds, sanitary operations, sanitary facilities and controls, equipment and utensils, processes and controls, warehousing and distribution, and defectaction levels considerations.
Growth niche1 Location that supports microbiological growth and is protected from the sanitation process; characterized by high microbial counts after cleaning and sanitation.
Harborage site1 Growth niche that contains the pathogen or its indicator.
Hazard2,5 Any biological, chemical (including radiological), or physical agent that has the potential to cause illness or injury. Hazards may be introduced to or naturally present in the food.
Environmental Monitoring Handbook - Terms and Definitions
v
Term Definition
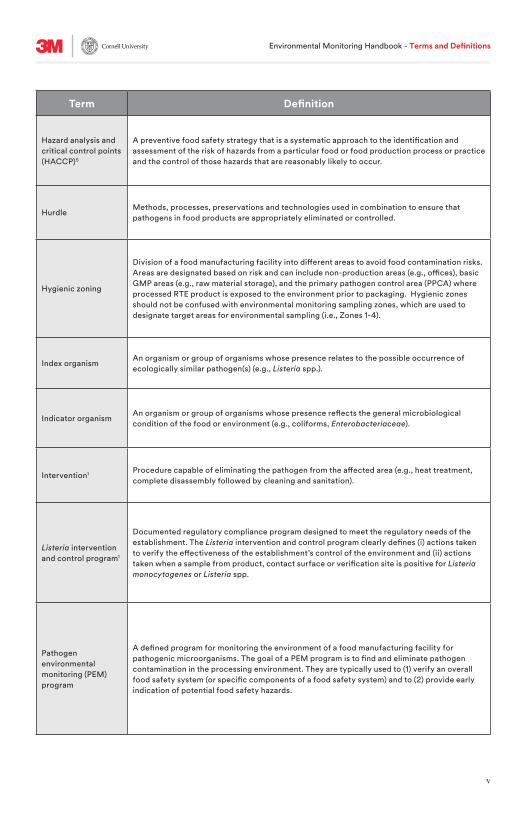
Hazard analysis and critical control points (HACCP)5
A preventive food safety strategy that is a systematic approach to the identification and assessment of the risk of hazards from a particular food or food production process or practice and the control of those hazards that are reasonably likely to occur.
HurdleMethods, processes, preservations and technologies used in combination to ensure that pathogens in food products are appropriately eliminated or controlled.
Hygienic zoning
Division of a food manufacturing facility into different areas to avoid food contamination risks. Areas are designated based on risk and can include non-production areas (e.g., offices), basic GMP areas (e.g., raw material storage), and the primary pathogen control area (PPCA) where processed RTE product is exposed to the environment prior to packaging. Hygienic zones should not be confused with environmental monitoring sampling zones, which are used to designate target areas for environmental sampling (i.e., Zones 1-4).
Index organismAn organism or group of organisms whose presence relates to the possible occurrence of ecologically similar pathogen(s) (e.g., Listeria spp.).
Indicator organismAn organism or group of organisms whose presence reflects the general microbiological condition of the food or environment (e.g., coliforms, Enterobacteriaceae).
Intervention1 Procedure capable of eliminating the pathogen from the affected area (e.g., heat treatment, complete disassembly followed by cleaning and sanitation).
Listeria intervention and control program1
Documented regulatory compliance program designed to meet the regulatory needs of the establishment. The Listeria intervention and control program clearly defines (i) actions taken to verify the effectiveness of the establishment’s control of the environment and (ii) actions taken when a sample from product, contact surface or verification site is positive for Listeria monocytogenes or Listeria spp.
Pathogen environmental monitoring (PEM) program
A defined program for monitoring the environment of a food manufacturing facility for pathogenic microorganisms. The goal of a PEM program is to find and eliminate pathogen contamination in the processing environment. They are typically used to (1) verify an overall food safety system (or specific components of a food safety system) and to (2) provide early indication of potential food safety hazards.

Environmental Monitoring Handbook - Terms and Definitions
vi
Term Definition
Periodic deep cleaning and sanitation1
Disassembly of equipment or other components of a processing plant beyond the normal level, followed by cleaning and sanitization.
Post-rinse sampling1
Samples taken after production, disassembly and the initial rinse but before the application of soap or sanitizer. Typical sites are below the product line and in areas that tend to collect spatter from the rinsing process (e.g., machine sides, legs, support structure, floor wall juncture). Post-rinse samples are good broad indicators of the presence of the organism in the post-lethality exposed product area. Detection of the organism does not mean there is a harborage site within the scope of the sampled area. Positive post-rinse samples will typically trigger aggressive sampling.
Preoperative sampling
Samples taken after sanitation but before starting production, typically during or after assembly and setup.
Preventive action3 An action to eliminate the cause of a potential non-conformity or other undesirable situation to prevent occurrence.
Preventive control (PC)2
Proactive control measures designed and undertaken to reduce or eliminate food safety hazards. These include risk-based, reasonably appropriate procedures, practices, and processes that a person knowledgeable about the safe manufacturing, processing, packing, or holding of food would employ to significantly minimize or prevent the hazards identified under the hazard analysis that are consistent with the current scientific understanding of safe food manufacturing, processing, packaging, or holding at the time of the analysis.
Primary pathogen control area (PPCA)
A designated hygiene zone. The PPCA is an area where product is exposed to the environment post-lethal processing. Also known as the ready-to-eat (RTE) area, high-risk area or high-hygiene area.
Qualitative test A test that determines presence or absence of an analyte(s) in a sample.
Quantitative test A test that measures the level or concentration of an analyte(s) in a sample.
Relative light unit (RLU)
The reading of the amount of light as determined by an individual ATP-based hygiene monitoring system. ATP system manufacturers may have different values for 1 light unit and all measurements are made relative to that value.

Environmental Monitoring Handbook - Terms and Definitions
vii
Term Definition
Sanitation processcontrol program1
Overall process used to manage environmental control; includes both food safety components and non-regulatory quality components. Regulatory components include HACCP, SSOPs, prerequisite programs and pathogen control program. ‘‘For-cause’’ investigative sampling is part of the pathogen control program. ‘‘Not-for-cause’’ sampling is a part of the sanitation process control program but is not necessarily a component of the regulatory compliance program.
Sanitation standard operating procedures (SSOPs)
Written procedures that a food manufacturing facility develops and implements to ensure sanitary conditions and prevent direct contamination or adulteration of food product. These include written steps for cleaning and sanitation, and are considered as one of the prerequisite programs of HACCP.
“Seek and destroy” process1
A multi-faceted systematic approach to finding sites of persistent strains (niches) in food processing plants, with the goal of either eradicating or mitigating effects of these strains. This process has been used effectively to address persistent Listeria monocytogenes contamination in food processing plants. The continued use of this science-based strategy can not only control environmental pathogens, but it can also be deployed for controlling microbial spoilage in ready-to-eat (RTE) foods.
The “seek and destroy” process can help to:
• Finds pathogenic growth niches• Finds potential growth niches requiring monitoring and control• Defines normal level of disassembly• Defines periodic deep level of disassembly• Defines frequency of periodic deep level of disassembly• Qualify a new piece of equipment (e.g., run for 90 days then conduct seek and destroy
investigation)• Validate effectiveness of equipment cleaning protocol• Validate effectiveness of intervention applied to a piece of equipment (e.g., heat
treat¬ment or other method)
Time-Action-Concentration-Temperature (TACT)
An approach to evaluate a root-cause failure of a cleaning process by examining the time, mechanical action, concentration of chemicals and/or the temperature of the intervention process.

Environmental Monitoring Handbook - Terms and Definitions
viii
Term Definition
Transfer pathway1
Path of travel an organism takes to move from transfer point to transfer point (e.g., the pathway between the harborage site and a contact surface or product); this typically reflects transfer of a pathogen by objects or people. Water, employees, equipment, product, materials and aerosols are common transfer vectors.
Transfer point1
Surfaces that are exposed to cleaning and sanitation and can serve as points of contact facilitating the transfer of an organism from one surface to another, e.g. gloved hands. Transfer points should not be growth niches when effective cleaning and sanitizing procedures are used.
Validation5
Providing scientific evidence that a strategy controls a given hazard. Environmental monitoring is a key strategy that can be used to validate cleaning and sanitation procedures. This typically involves testing of equipment, using a “seek and destroy” approach after cleaning and sanitation have been performed, including complete disassembly of the equipment and collection of samples on the disassembled equipment to validate that the procedures used completely clean and sanitize a piece of equipment.
Vector swabbingAdditional investigative swabbing conducted in all directions, including up and down where possible, from the site of an initial positive detection.
Verification monitoringprogram1
Routine program to verify the consistent application of the sanitation process control program; includes sampling of Zone 1, 2, and 3 environmental sites in the ready-to-eat (RTE) area. This program is used for regulatory compliance and is a part of an establishment’s HACCP or SSOP program.
Verification sites, contact surface (Zone 1)1
Testing of Zone 1 (food contact surface) sites is typically the primary verification measure for the consistent application of the environmental pathogen control program to prevent product contamination. In high-risk product manufacturing, these sites should be evaluated weekly; lower risk lines may be evaluated less frequently as long as the process is under control.
Verification sites (Zones 2 and 3)1
Locations sampled during operations to detect the presence of the organism in the normal operating environment. Verification sites are surfaces that are exposed during the normal operating conditions and are likely to serve as transfer points (i.e., they are located in transfer pathways). Monitoring of verification sites detects the organism as it is being moved from its harborage location to a contact surface or the product.

Environmental Monitoring Handbook - Terms and Definitions
ix
Term Definition
Zone 1 1,6,7,8,9 Direct food contact surfaces post lethal processing, e.g., slicers, peelers, fillers, hoppers, screens, conveyor belts, air blowers, employee hands, knives, racks, work tables.
Zone 2 1,6,7,8,9
Non-food contact surfaces in close proximity to food and food contact surfaces, e.g., processing equipment exterior and framework, refrigeration units, equipment control panels, switches.
Zone 3 1,6,7,8,9 More remote non-food contact surfaces located in or near the processing area, e.g., forklifts, hand trucks, carts, wheels, air return covers, hoses, walls, floors, drains.
Zone 4 1,6,7,8,9 Non-food contact surfaces outside of the processing areas, e.g., locker rooms, cafeterias, entry/access ways, loading bays, finished product storage areas, maintenance areas.

References:
1. Malley, T.J., Butts, J., Wiedmann, M. 2015. Seek and destroy process: Listeria monocytogenes process controls in the ready-to-eat meat and poultry industry. J. Food Prot. 78 (2): 436-445. http://dx.doi.org/10.4315/0362-028X.JFP-13-507
2. United States Food and Drug Administration. 2015. Current Good Manufacturing Practice, Hazard Analysis, and Risk-Based Preventive Controls for Human Food; Final Rule. Verification of implementation and effectiveness. https://www.fda.gov/Food/GuidanceRegulation/FSMA/ucm334115.htm
3. International Organization for Standardization. 2015. ISO 900:2015. Quality management systems – Fundamentals and vocabulary.
4. United States Food and Drug Administration. 2018. Quality System Regulation. Subpart J – Corrective and Preventive Action. 21 CFR §820.100. https://www.ecfr.gov
5. Codex Alimentarius Commission. 2003. General Principles of Food Hygiene. CAC/RCP 1-1969. http://www.fao.org/fao-who-codexalimentarius/codex-texts/all-standards/en/
6. Dairy Food Safety Victoria. 2016. Dairy Pathogen Manual. http://www.dairysafe.vic.gov.au/publications-media/regulations-and-resources/guidelines 7. United States Food and Drug Administration. 2017. Control of Listeria monocytogenes in Ready-To-Eat Foods: Guidance for Industry; Draft Guidance. https://www.fda.gov/RegulatoryInformation/Guidances/ucm073110.htm 8. United Fresh Produce Association. 2013. Guidance on Environmental Monitoring and Control of Listeria for the Fresh Produce Industry. http://www2.unitedfresh.org/forms/store/ProductFormPublic/guidance-on-environmental-monitoring-and-control-of-listeria-for-the-fresh-produce-industry
9. Simmons, C.K., Wiedmann, M. 2018. Identification and classification of sampling sites for pathogen environmental monitoring programs for Listeria monocytogenes: Results from an expert elicitation. Food Microbiol. 75: 2-17. https://doi.org/10.1016/j.fm.2017.07.005
Environmental Monitoring Handbook - Terms and Definitions
x

Environmental Monitoring Handbook - Importance
1
The Importance of Environmental Sampling in Food Safety and Quality Programs
CHAPTER 1
By Martin Wiedmann | Cornell University Department of Food ScienceAlexandra Belias | Cornell University Department of Food ScienceGenevieve Sullivan | Cornell University Department of Food ScienceJohn David | 3M Food Safety
Importance of identifying specific purposes and goals for environmental monitoring programs
Increasing recognition of the food processing environment as a contamination source
Target analytes for environmental monitoring programs
Importance of coordination and integration of environmental monitoring programs
The business needs for environmental monitoring programs
5
2
7
7
8
1.2.
1.1.
1.3.
1.4.
1.5.
1

Environmental Monitoring Handbook - Importance
2
There is increasing recognition that food processing facilities’ environments, as well as other built environments used in food production and distribution (e.g., retail food handling spaces, restaurants or packing houses for produce) can be important sources of biological agents, chemical compounds and physical hazards that may negatively affect food safety and quality. Classical food safety and quality systems strongly relied on the concept of Hazard Analysis and Critical Control Points (HACCP) to ensure food safety and food quality, with an emphasis on identifying a specific targeted critical control point (CCP) for each hazard identified as reasonably likely to occur. The specific parameters that would allow for effective control of the target hazard at the CCP would have to be established (“validation”) and would then have to be
continuously monitored (“verification”). The quintessential example for a CCP would be a heat treatment meeting a certain minimum temperature and time requirement such as pasteurization of milk.
However, HACCP as well as quality management systems that utilize similar concepts require so-called “prerequisite programs” to be in place to ensure that HACCP-based food safety programs and similar food quality programs effectively work.
Examples of classical prerequisite programs include pest control, sanitation and sanitation standard operating procedures (SSOPs), personal hygiene and Good Manufacturing Practices (GMPs) (Figure 1).
Figure 1. HACCP and selected prerequisite programs that can be validated and verified by environmental monitoring
Safety of water, steam, ice
Condition and cleanliness of food contact surface
Facilities and environment (sanitary equipment and design)
Cleaning and sanitation(SSOPs)
GMPs
Prevention of cross contamination
Allergen management
1.1. Increasing recognition of the food processing environment as a contamination source
2

Environmental Monitoring Handbook - Importance
3
Examples of Listeria monocytogenes and Salmonella persistence events responsible for outbreaks
In the United States, the Centers for Disease Control and Prevention (CDC) and state-level health departments continually monitor the number of cases of foodborne illness. When there is a spike in the number of cases caused by a given pathogen, this may be an indication that an outbreak is occurring.
For example, in October of 1998, there was a spike in the number of listeriosis cases in New York, indicating a potential outbreak. In response, the Listeria monocytogenes isolates collected from these clinical cases, as well as cases in other states, were characterized by subtyping to determine if their “fingerprints” matched. A single subtype was common among several cases from that October, as well as some isolates from previous months initially deemed to be sporadic cases. Interviews with the patients were then conducted to determine if there were any common foods consumed among them.
The results showed that 89 percent of the patients infected with the outbreak strain had consumed cooked frankfurters, and only 32 percent of participants not infected with the outbreak strain had consumed cooked frankfurters. Of those patients infected with the outbreak strain, 78 percent reported eating a single brand of frankfurters.1
(cont.)
Despite the value of HACCP-based food safety systems and similarly structured food quality systems, it has become clear that a large number of food safety and quality issues experienced around the world are due to failures and problems with prerequisite programs.
This includes the lack of validation and verification of the prerequisite programs, particularly sanitation (including sanitary equipment and facility design), and GMPs (including hygienic zoning).
Examples of food safety and quality issues caused by failures with prerequisite programs include listeriosis outbreaks linked to ready-to-eat (RTE) foods where contamination could be traced back to locations in the processing plant environment. This occurs in growth niches where Listeria monocytogenes could survive over time and contaminate finished product. Similar issues have also been observed for Salmonella.
Microbial spoilage issues in RTE food and beverages can also often be traced back to sources in processing plant environments that were not effectively controlled through sanitation and GMPs. Examples of spoilage organisms typically traced back to sources in processing plant environments include Pseudomonas spp., lactic acid bacteria, as well as yeast and mold.
Similarly, allergen contamination issues and recalls can sometimes be traced to failures in prerequisite programs.
3

Environmental Monitoring Handbook - Importance
4
From there, finished product Listeria monocytogenes testing was performed on the frankfurters of the identified brand. Subtypes of isolates from the finished product matched those isolated from clinical cases, implicating this company in the outbreak.
By the end of the outbreak, there were 108 cases of listeriosis and 14 associated deaths. Even though the company had an appropriate HACCP plan, they were still producing unsafe product. It was later determined that the Listeria monocytogenes contamination originated from the processing plant environment. This case illustrates the need for effective environmental monitoring programs (including appropriate corrective and preventive actions) even in facilities that have HACCP plans.
Similarly, a Salmonella Agona outbreak was traced back to toasted oat cereal in 1998, which caused 209 cases of salmonellosis.2 The Salmonella was determined to be coming from the processing plant environment. Then, 10 years later in 2008, another Salmonella Agona outbreak was traced back to puffed rice cereal, which caused 28 salmonellosis cases. It was determined that the strains implicated in both outbreaks were of the same subtype, indicating that the Salmonella had survived in the plant for a decade. This case illustrates that effective environmental monitoring programs are not only necessary for Listeria monocytogenes, but are also essential for Salmonella, particularly in facilities that produce low-water activity RTE products.
With the processing facilities’ association to sources of food safety and quality issues becoming increasingly recognized, the food industry and its regulators are heightening their emphasis of environmental monitoring programs, which may target the actual analyte of concern (e.g., pathogens, allergens, spoilage organisms) or indicators. Indicators include any organism or compound where presence (or their detection above a certain threshold) may provide evidence of conditions that are unhygienic or otherwise increase the risk of food safety or spoilage issues. Conceptually, environmental monitoring may serve as either validation or verification of specific prerequisite programs (e.g., sanitation and sanitary equipment design) or may be more generally seen as a strategy to monitor the environment for unhygienic conditions.
The increasing importance of environmental monitoring programs is particularly well-illustrated by recent changes to regulatory approaches to food safety. The U.S. Food and Drug Administration (FDA) Food Safety Modernization Act (FSMA) and similar regulations in other countries have elevated the importance of prerequisite programs. For example, in the FSMA Current Good Manufacturing Practice, Hazard Analysis, and Risk-Based Preventive Controls for Human Food Rule (PC Rule), many of the specified “preventive controls” represent programs that would have previously been classified as prerequisite programs. However, FSMA preventive controls include a requirement for verification of the preventive controls, which was not in place for prerequisite programs.
Additionally, the FSMA PC Rule includes a specific recognition of environmental monitoring as a key verification strategy forcertain non-process preventive controls such as sanitation: “Environmental monitoring, for an environmental pathogen or for an appropriate indicator organism, if
Environmental Monitoring Handbook - Importance
5
contamination of a ready-to-eat food with an environmental pathogen is a hazard requiring a preventive control, by collecting and testing environmental samples.”3
This provision demonstrates the growing consensus on the importance of environmental monitoring programs as an essential part of food safety and quality systems.
Environmental monitoring programs and environmental sampling activities can serve multiple and sometimes complementary purposes. In practice, environmental monitoring programs often encompass a range of tests – from ATP and indicator organisms to pathogens, spoilage organisms, and allergens – conducted on a variety of samples collected throughout a facility at various time points and with varying frequencies. Often, these programs have been used for years and modified over time to address specific customer and regulatory requirements or specific issues or concerns. This can lead to programs that represent an uncoordinated, non-unified approach that may not use resources effectively, particularly if new requirements for environmental monitoring are frequently added. Hence, it is often essential for the food industry and specific processing plants to more specifically define the purpose of current and planned environmental monitoring programs.
While there does not appear to be a universally recognized framework for this, there are some potential approaches that would seem logical and consistent with other aspects of food safety and quality management, such as HACCP.
A HACCP-informed approach to develop
purpose-driven environmental monitoring programs could, for example, start with an identification of food safety and quality related “hazards.” A food manufacturer might then determine which specific hazards could potentially be transmitted through the processing plant environment, with recognition given to the fact that the processing plant could be a source or a vehicle for cross contamination, or both. Control strategies (e.g., sanitation, GMPs, sanitary equipment design) would then be prescribed to control each hazard; these would represent the equivalent of “non-process preventive controls.” Subsequently, a facility could identify environmental monitoring activities needed to validate that a given non-process preventive control addresses the target hazard (which often would be non-trivial). It would then verify the effectiveness of the validated non-process preventive control and ensure it is consistently implemented (Figure 2).
Importantly, verification may include measurements and records other than classical environmental monitoring tests. For example, ATP testing (which can be used to verify cleaning), combined with records on sanitizer concentration measurements and check sheets that document the length of sanitizer
1.2. Importance of identifying specific purposes and goals for environmental monitoring programs

Environmental Monitoring Handbook - Importance
6
application could be sufficient to verify sanitation. Furthermore, corrective actions should be developed in the case that the verification critical limits are not met.
Environmental monitoring programs could be developed for specific purposes and implemented by identifying key preventive controls (without necessarily assigning specific hazards to be controlled by each
preventive control), with subsequent identification of environmental monitoring activities needed to validate and verify each control. These approaches may also facilitate realignment of existing environmental monitoring activities, including elimination or revision of specific tests that no longer have clearly defined goals and purposes.
Identify food safety and quality hazards that can be introduced into the product from the processing plant environment
Determine how to respond if a critical limit is exceeded (for example, re-cleaning and re-sanitation if ATP is above threshold)
Use environmental monitoring to verify that the non-process preventive controls put in place are working
Maintain records on the validation, monitoring, verification and corrective actions of non-process preventive controls
Develop an enviromental monitoring program (with critical limits) and set a frequency (e.g., weekly, at least 4 hours after processing starts); possible critical limits may include ATP levels and EB counts below a certain threshold or "negative for Listeria spp.”
Identify non-process preventive control strategies needed to control each hazardExamples of control strategies include sanitation, GMPs and sanitary equipment design
Determine the limit required to control the hazardValidate that the critical limit is effective in controlling the hazardFor example, determine equipment disassembly needed as well as the time, temperature and concentration of a sanitation process/SSOP and validate the process using intensive environmental monitoring of the target area or target equipment
HazardAnalysis
Identify CCPs
Monitoring
Develop Corrective
Actions
Verification
EstablishCritical Limits
Record Keeping
Figure 2. A HACCP-informed approach to environmental monitoring

Environmental Monitoring Handbook - Importance
7
When it comes to designing and implementing environmental monitoring programs, it is essential to identify the proper chemical and biological target analytes for testing different samples and achieving different goals (such as verification and validation). Typical target analytes used in environmental monitoring programs include compounds that can assess cleaning efficacy (e.g., ATP or
protein), allergens, indicator organisms, pathogens and spoilage organisms. An understanding of these target analytes as well as the sensitivity and specificity of the tests used is essential in the design and implementation of appropriate environmental monitoring programs, and more detail on the different target analytes is provided in subsequent chapters.
Coordinating and integrating different aspects of an environmental monitoring program can increase the program’s effectiveness and efficiency. For example, in some facilities, ATP testing, environmental allergen tests and environmental microbiological tests may not always be coordinated and data may not be analyzed together, despite the fact all of them typically help validate or verify sanitation practices. Coordinated analyses of the different tests thus may allow for rapid and sensitive detection of sanitation issues.
For example, coordinated environmental sampling programs should include record-keeping and data analyses of all environmental monitoring data (ATP, indicator organisms, allergen monitoring and pathogen monitoring) and should include a standardized sampling site list that encompasses all sites tested. Best practices for environmental monitoring programs may include (but are not limited to) electronic record-keeping,
consistent designation of sampling sites (some facilities may have thousands of sampling sites, all with a unique identifier), coordinated and integrated analysis of different environmental monitoring data, regular in-person review of all environmental monitoring data (typically at least every six to 12 months) as well as other approaches to coordinate and integrate different environmental sampling programs.
Additional strategies and activities that facilitate coordination and integration of environmental monitoring programs include use of floor plans and trending charts that allow for integrated temporal and spatial analysis of different environmental monitoring data as well as SOPs for sample collection and follow-up on out-of-spec results.
1.3. Target analytes for environmental monitoring programs
1.4. Importance of coordination and integration of environmental monitoring programs

Environmental Monitoring Handbook - Importance
8
Control of environmental sources of microbial contaminants is important for proactively addressing food spoilage issues
Using social media, a single consumer was capable of reaching close to a half million people with her dissatisfaction with the premature spoilage of a juice pouch. In this case, the effects were so powerful that the company was forced to conduct a costly redesign of their package so that consumers could see the juice in the pouch to ensure it had not spoiled. Since the processing plant environment is the likely source for a number of spoilage organisms, environmental monitoring programs can play a key role in not only improving the safety of food products, but also helping with identifying and eliminating or managing niches of spoilage-causing organisms.
With social media allowing consumers to easily communicate spoilage issues to large audiences, proactive approaches to preventing even rare spoilage issues are becoming increasingly more important. Well-designed environmental programs thus provide a number of benefits for food companies and a larger return-on-investment than many may realize.
While the primary goal for environmental monitoring programs typically is to control and reduce food safety hazards (e.g., allergens, microbial pathogens), environmental monitoring programs also play an important role for protecting businesses from potentially expensive recalls. For example, recalls of RTE food products due to contamination with pathogens such as Listeria monocytogenes and Salmonella can often be attributed to environmental sources.
Effective environmental monitoring programs, particularly those linked to specific goals such as sanitation validation and verification, can significantly reduce the risk of these recalls. For example, good environmental monitoring data are often essential to allow companies to limit recalls to a single lot, production day or production week. This is due to the fact that without appropriate validation and verification data, it is challenging to sufficiently prove that finished product contamination on a given day could not have been transferred to subsequent lots.
In addition to food safety hazards, spoilage issues (including problems caused by organisms introduced from the environment in processing plants) represent an increasing business risk for food companies. Consumers often use social media platforms to communicate food spoilage issues and pressure companies into action (Sidebar).
Reduced risks of spoilage issues and associated recalls due to effective environmental monitoring programs
1.5. The business needs for environmental monitoring programs

Environmental Monitoring Handbook - Importance
9
thus represent another benefit to food companies.
Despite the fact it’s widely known that recalls are extremely costly for companies, quantification of the benefits of environmental monitoring programs is still often considered challenging. While recalls tend to occur rarely, improved foodborne disease surveillance systems place companies at an increased risk of being identified as the source of an outbreak.
However, food companies have also seen that effective environmental monitoring programs can facilitate extended run-times, thereby improving production efficiency. For example, environmental monitoring may identify difficult-to-clean areas that can be eliminated through equipment redesign, which will subsequently allow for longer production runs.
Connect with a 3M Food Safety expert
www.3M.com/ConnectEnvironmentalMonitoring
Learn more about environmental monitoring
www.3M.com/EnvironmentalMonitoring

Environmental Monitoring Handbook - Importance
10
References:
1. Mead, P. S., Dunne, E. F., Graves, L., Wiedmann, M., Patrick, M., Hunter, S., Salehi, E., Mostashari, F., Craig, A., Mshar, P., Bannerman, T., Sauders, B. D., Hayes, P., DeWitt, W., Sparling, P., Griffin, P., Morse, D., Slutsker, L., Swaminathan, B. 2006. Nationwide outbreak of listeriosis due to contaminated meat. Epidemiology and Infection. 134: 744-751. http://doi.org/10.1017/S0950268805005376
2. United States Centers for Disease Control. 2008. Multistate Outbreak of Salmonella Agona Infections Linked to Rice and Wheat Puff Cereal (FINAL UPDATE). https://www.cdc.gov/salmonella/2008/rice-wheat-puff-cereal-5-13-2008.html
3. United States Food and Drug Administration. 2015. Current Good Manufacturing Practice, Hazard Analysis, and Risk-Based Preventive Controls for Human Food; Final Rule. Verification of implementation and effectiveness. § 117.165. https://www.fda.gov/Food/GuidanceRegulation/FSMA/ucm334115.htm

Environmental Monitoring Handbook - Hygiene Monitoring
11
ATP and Protein-based Hygiene Monitoring
CHAPTER 2
By Louise Roberts | Alimenti Food Sciences LtdGareth Lang | 3M Food SafetyBurcu Yordem | 3M Food Safety
Purpose of ATP or protein-based hygiene monitoring 12
12
14
15
21
22
25
12
15
18
19
14
2.1.
2.2.
2.3.
2.4.
2.5.
2.6.
2.7.
2.2.1.
2.4.1.
2.4.2.
2.4.3.
2.2.2.
Principle of the methods
ATP vs. microbiological results
Development of an ATP or protein sampling program
Corrective actions based on ATP or protein sampling results
Data trending and analysis
Other consideratons
Principle of ATP testing
Selection of sampling sites
Sampling frequency and number of samples
Determination of cut-off levels for ATP
Principle of protein testing

Environmental Monitoring Handbook - Hygiene Monitoring
12
ATP and protein-based hygiene monitoring technologies are rapid, simple-to-use methods for determining the hygienic status of surfaces such as those found in food processing facilities. Everyday, the high-risk decision to start food production needs to be made. These tests can provide a measurable and objective assessment of the cleanliness of equipment and surfaces prior to food processing or preparation.
Organic matter on a surface can act as a food source for microorganisms. Removing this organic matter reduces the opportunity for bacteria and mold to multiply or grow, thus reducing the microbial risk within the processing environment. Removal of organic matter can also enhance the efficacy of sanitizers, further improving the overall sanitary status of the facility and reducing risk.
2.1. Purpose of ATP or protein-based hygiene monitoring
2.2. Principle of the methods
ATP (adenosine triphosphate) is present in every cell. It is the energy molecule for the cell and is broken down to ADP (adenosine diphosphate), releasing energy for the cell to utilize.
As well as being present in living cells, it is
present in residues from organic sources such as:
• Food debris remaining on a surface after cleaning.
• Biofilms produced by bacteria. • Surfaces touched by operators.
2.2.1. Principle of ATP testing
• Where the cleaning regime is inadequate or fails, residue from organic sources may remain on the surface.
• Where this occurs, both direct and indirect food contamination risks exist.
Microorganisms
DIRECT RISKFood poisoning, spoilage and shelf-life reduction
INDIRECT RISKEncourage
microorganism growth
Organic residues
Cu2+
OH1 2 BCA
Cu+PROTEIN
(Cysteine, cystinetyrosine and tryptophan
amino acid residues)
BCA = Cu+Complex
PurpleAbs=562nm
Figure 1. How ATP indicates direct and indirect risks

Environmental Monitoring Handbook - Hygiene Monitoring
13
The amount of ATP present in a cell will vary depending on a number of factors, including whether it is bacterial (prokaryotic) or somatic (eukaryotic). It is much easier to detect ATP from food cells than microbial cells, as the amount of ATP in a eukaryotic cell can be 107 times more than a prokaryotic cell (Figure 2).
ATP hygiene monitoring utilizes the energy present in the ATP molecule along with an enzyme complex known as Luciferin-
Luciferase to produce light, the same chemical reaction used by fireflies.1
In the bioluminescence reaction, luciferase utilizes ATP to catalyze the oxidation of luciferin to oxyluciferin, yielding light (Figure 3). The light produced is proportional to the amount of ATP present. By measuring the light produced, a correlation can be formed with the amount of ATP present and therefore the amount of ATP-containing organic matter present.
The amount of ATP in a cell will vary. This is mostly related to the size of the cell.
Food (eukaryotic) cells may contain 10 ng ATP
Microbial (prokaryotic) cell may contain 1 fg ATP
1 ng = 10–9 g 1 fg = 10–15 g
Figure 2. ATP content in different cell types
Figure 3. Measuring ATP with bioluminescence
Firefly luciferase+ Mg2+
SHO
OH
+ATP + O2
D-luciferin
O
S
N N
SO
+AMP +PP1 + CO2 + Light
oxyluciferin
O
S
N N

Environmental Monitoring Handbook - Hygiene Monitoring
14
While ATP and protein testing are well- established methods for measuring hygiene, it is important to note that the technologies cannot be used as a replacement for traditional microbiology. The amount of ATP or protein in a single microbial cell is far below detectable levels using ATP or protein-based tests. Therefore, these technologies cannot be used to quantify microbes or directly correlate with microbiology results. The
role of ATP or protein-based tests is to assess the levels of cleanliness, which then relates to increased risk of microbial contamination. An effective environmental monitoring program will make use of a combination of these technologies in a methodically planned and well-justified manner. In addition, hygiene monitoring results are immediately actionable, allowing any corrections to be taken without delay.
Protein testing is a qualitative or semi-quantitative color-based test for the presence of protein residue and therefore cleanliness.
The depth of color produced indicates the level of protein present. However, as with ATP testing, the technology cannot indicate if the source of the protein is microbial or otherwise.
Protein-based tests generally utilize the well-understood copper-based Biuret reaction (Figure 4). In this reaction, cupric ions (Cu2+) form a complex with the peptide bonds of protein, reducing the cupric ions to cuprous icons (Cu+). Bicinchoninic acid
(BCA) can then form a complex with the Cu+ ions, resulting in a color change.2
Results from protein-based tests are generally available within several minutes (compared to seconds for ATP-based tests) and are less sensitive than ATP technology. The results are also generally only qualitative or semi-quantitative, limiting their usefulness in data analysis and trending. A significant benefit is that protein tests can often be performed with no specialized equipment. They are also often temperature-stable, making them particularly useful to facilities with limited resources, such as auditors and food service outlets.
2.2.2. Principle of protein testing
2.3. ATP vs. microbiological resultsMicroorganisms
DIRECT RISKFood poisoning, spoilage and shelf-life reduction
INDIRECT RISKEncourage
microorganism growth
Organic residues
Cu2+
OH1 2 BCA
Cu+PROTEIN
(Cysteine, cystinetyrosine and tryptophan
amino acid residues)
BCA = Cu+Complex
PurpleAbs=562nm
Figure 4. The Biuret reaction utilized in protein tests

Environmental Monitoring Handbook - Hygiene Monitoring
15
Development of an environmental hygiene monitoring program will typically involve three steps.
First is the initial program to validate the cleaning regime. This is followed by a program for routine verification of the regime and finally ongoing review and adjustment of the program.
The initial validation program will typically involve a much higher testing frequency and more test points, and the data gathered during this program can be used to establish baseline levels. Revalidation should take place whenever changes are made, such as when new cleaning
chemicals or processes are introduced, new equipment is used or new products are manufactured.
The ongoing verification program is then generally conducted at a reduced frequency using fewer test points. However, the data generated during this time should be routinely reviewed and analyzed to determine if there are any trends or areas of concern, and also to confirm that pass/fail levels and the program itself is adequate and adjusted as necessary.
Specific aspects of a sampling program will be discussed in other sections.
2.4. Development of an ATP or protein sampling program
Sampling site selection should begin with a mapping exercise to give an overview of the complete facility and production process. This will involve a division of the facility into several areas (zones) based on the microbial risk to the product (Figure 5).3, 4, 5, 6
Once the overall environment has been mapped, a process can be undertaken to determine the most appropriate test points, keeping in mind that the aim is to assess cleanliness and control the risk posed by having an unclean surface.
This process is best undertaken as a team approach with input from cleaning crew and quality, combining an understanding of the purpose of the ATP test and a risk-based approach to sampling. It should be
noted that the ATP test points may differ from microbiological sampling sites.
Some of the main things to be considered by the team are:
1 - Stage of processing. In any manufacturing process using a step to reduce microbial risk, all processing environments occurring after that step can be considered higher risk due to the potential for post-processing contamination. Any processing environment situated prior to the microbial reduction step can be considered a lower risk area since it is preceding the hazard control point. Microbial reduction steps can take many forms, from pasteurization to peeling of fruit.
2.4.1. Selection of sampling sites

Environmental Monitoring Handbook - Hygiene Monitoring
16
It should be noted that the lower risk rating assigned to areas prior to microbial reduction must be viewed in context of the validated microbial reduction step. If these areas were to be insufficiently cleaned, it may lead to cumulative microbial contamination, rendering the later processing steps insufficient.
2 - Proximity to the food and potential for cross-contamination. Generally, a surface that has direct contact with a product that will not be processed further to eliminate microbial risk is a high-risk point. In contrast, a surface that does not have contact with the product and/or where the product will be processed further to eliminate microbial risk is a lower risk point.
In addition to direct contact surfaces, the potential for cross contamination should also be considered including:
• Proximity of the surface to the product, e.g., whether the equipment is above the product and whether there is risk of contamination such as water droplets in a humid environment.
• Control panels, utensils or tools and whether there is a risk of cross contamination by operators.
3 - Ease of cleaning and condition of the surface to be tested. While sanitary design and good maintenance should be fundamental in any facility, circumstances may arise where these aspects are less than optimal. To address this risk the level of difficulty in cleaning, a surface must be considered to assess if the surface condition or material can reduce the effectiveness of the cleaning. The level of risk associated with the surface may increase where cleaning is difficult. Examples include older equipment, porous surfaces, scratched or marked surfaces and poor accessibility.
A simple and convenient way to conduct the risk analysis (Figure 6) and understand the potential risk to be mitigated through the use of hygiene monitoring can be summarized as follows:
Risk Analysis:
• How significant is the hazard? = How close is the surface to the food?
• What is the probability the hazard will occur? = How hard is it to clean the surface?

Environmental Monitoring Handbook - Hygiene Monitoring
17
Figure 5. Environmental monitoring sampling zones
Figure 6. Identification of high-risk sampling sites
Product Contact Surfaces(Slicers, peelers, fillers, hoppers, screens, conveyor belts, air blowers, employee hands, knives, racks, work tables)
ZONE 1
Non-Food Contact Surfaces in Close Proximity to Food and Food Contact Surfaces(Processing equipment exterior and framework, refrigeration units, equipment control panels, switches)
ZONE 2
More Remote Non-Food Contact Surfaces Located In or Near the Processing Areas
(Forklifts, hand trucks, carts, wheels, air return covers, hoses, walls, floors, drains)
ZONE 3
Non-Food Contact Surfaces Outside of the Processing Areas(Locker rooms, cafeterias, entry/access ways, loading bays, finished product storage areas, maintenance areas)
ZONE 4Not typically
tested for ATP
HA
ZARD
(Pro
xim
ity to
Foo
d)
PROBABILITY(Difficulty of Cleaning)
Color = Risk Level
High(generally Zone 1)
Medium(generally Zone 2 and 3)
Low(generally Zone 4)
Low Medium High
ZONE 4 | General Area
ZONE 3 | Close Proximity
ZONE 2 | Indirect Contact
ZONE 1Direct Contact

Environmental Monitoring Handbook - Hygiene Monitoring
18
2.4.2. Sampling frequency and number of test points sampled
Once sampling sites have been identified, a combination of the testing aims (cleaning validation or ongoing verification) and outcomes of the previously conducted risk rating exercise should be used to determine the frequency and number of test points to sample.
The primary factors determining the number of test points to sample is the physical size of the manufacturing operation and complexity or number of steps involved in the manufacturing process. For example, where several manufacturing steps or pieces of machinery are involved and considered a risk, each should be sampled. In cases of complex or large machinery, multiple test points should be considered.
Highly manual production processes may warrant more Zone 2 test points to be included in the sampling plan, as hands-on operation means an increased risk of cross contamination by production staff.
Zone 1 areas should have the highest sampling frequency and should be conducted daily, ideally during every cleaning and sanitation process and possibly also as part of the production start-up routine. This ensures that corrective actions can be undertaken before the finished product is compromised. Where there are a high number of test points, it may be more economical to randomize or rotate a portion of testing, but careful consideration should be given to ensure overall hygiene is still being achieved.
Based on these principles, the use of hygiene monitoring technologies such as ATP and protein-based swabs is typically directed towards Zone 1 (product or packaging contact) test points. In a facility that is “under control,” Zone 1 areas will be free of pathogens and have low levels of indicator organisms (both discussed in other chapters). With the reduced likelihood of direct risks at these points, the primary focus should be to control indirect risks such as unclean surfaces that can lead to the development of direct risks or impact product quality.
In larger food production facilities, the equipment is likely to be more complex and involve both manual and clean-in-place (CIP) systems. In such facilities, a comprehensive program involving indicator and pathogen testing should also be established. In smaller facilities
such as catering kitchens, the ability to conduct microbiological testing may be limited. In these cases, ATP testing may be increasingly used in Zone 2, indirect food contact surfaces which represent a risk for cross contamination.
This same approach can be used for any facility, although in cases like facilities utilizing a CIP cleaning system, the ability to access higher risk surfaces may be limited. In these cases, ATP testing of the final rinse water can be used to indicate the level of cleanliness achieved.
Additional test points may also be included as a result of corrective and preventive action (CAPA) activities or during any validation activities following a process change, such as construction or modification of existing equipment.

Environmental Monitoring Handbook - Hygiene Monitoring
19
2.4.3. Determination of cut-off levels for ATPAs with any test method, hygiene monitoring results or levels which are outside of acceptable limits and require corrective action must be established. While many other test types have well-established or regulated levels at which corrective action must be taken, acceptable hygiene levels are very user-specific and should reflect the needs of the individual facility or process. Many ATP or
protein-based systems also have an option to set a caution range that sits between a pass and a fail.
With ATP detection technology, multiple methods can be used to determine these levels, with some methods increasing the level of complexity and accuracy more than others. These can be summarized into three main methods (Figure 7).
For Zone 2 or lower risk areas, the sampling regime may occur at a lower frequency but should still be sufficient enough to ensure cleaning and hygiene levels are maintained before they can lead to more extensive issues. Sampling frequencies for Zone 2 could include rotating sampling throughout a given time frame until all areas are tested, a periodic (weekly, for example) check of all test points or a daily randomized selection.
For any test points where an ATP or protein-based test is not performed, for example due to rotated sampling, a visual inspection should still be conducted and findings or corrective actions undertaken recorded. A visual inspection can also be used prior to ATP or protein testing.
Figure 7. Common methods of determining ATP test thresholds
Luciferin / luciferase
ATP:Adenosine Triphoshate
The “energy currency” molecule of all living organisms
Increase in organismsor organic residues
Increase inATP levels
Increase inlight (RLU)
ManufacturerGuidance
(No Data Points)
Before & After Cleaning
(Minimal Data Points)
StatisticalAnalysis
(Many Data Points)
1 2 3COMPLEXITY
ACCURACY

Environmental Monitoring Handbook - Hygiene Monitoring
20
1. Manufacturer Guidance The simplest method, and often the first step used to determine cut-off levels is to seek guidance from the manufacturer of the ATP system being used. In this situation, the guidance should reflect the types of product manufactured and/or the types of equipment or surfaces being sampled. Similar guidance may also be sought through industry contacts, publications or manufacturers of the production equipment being used. Regardless of the source of the guidance, the levels should be reviewed as soon as data is available to ensure that they are meaningful. At a minimum, this should involve testing both clean and unclean surfaces to ensure they pass/fail as expected. It must be clearly noted that manufacturers of ATP systems use different measurement scales, so pass/fail values cannot be used interchangeably between one another.
2. Before and After Cleaning A relatively simple and more customized approach, this method can have several variations. At a minimum, it will involve taking measurements over several days of representative test points before and after cleaning. It may also involve taking several measurements following a deep clean to show what is achievable. Once the data has been collected it should be reviewed to establish how easily clean and unclean can be differentiated and pass/fail levels applied as appropriate. An example may be to use a pass level that is twice the average clean value, provided that clean and dirty can still be clearly differentiated.
If the aim is to achieve an immediate improvement in hygiene rather than maintain current levels, clean levels may be based on results from deep cleaning rather than routine cleaning.
3. Statistical Analysis While more complicated, using a statistical analysis will result in the most meaningful pass/fail values being set. Performing a statistical analysis will involve the collection of a larger number of results (data points) from cleaned surfaces, with a minimum of 30 being required for the analysis to be meaningful. Ideally, the minimum of 30 data points will be collected from each test point and analyzed individually, although it is also possible to group similar test points (in terms of surface type, product and risk, etc.) to obtain the 30 data points for analysis. The statistics used can vary, although two common approaches use either standard normal distribution or an accepted percentage of pass/fails. Both are described below. For more detailed guidance and tools to help determine pass/fail levels, the ATP system manufacturer should be contacted. For both types of analysis described here, an initial review should be conducted to confirm that the data set is acceptable. This can be achieved by performing a simple plot of the relative light unit (RLU) values over time followed by a review to exclude any obvious outliers (high RLU values) that may skew the results. This review should be performed using a scale that takes into account the results that would be expected from an unclean surface. If the results are erratic, it indicates the cleaning process is highly variable and should be investigated and stabilized.

Environmental Monitoring Handbook - Hygiene Monitoring
21
Once an acceptable data set has been obtained, the pass/fail levels can be statistically determined. To use a method based on standard normal distribution, the mean and standard deviation must be calculated. The fail level can then be determined by adding two or three standard deviations to the mean, corresponding to ~95 percent or ~99 percent of results respectively.
An alternative method utilizes an accepted level of cleaning efficacy that the company believes they are achieving (e.g., 95 percent) or can be viewed as the percentage improvement in cleaning they would like to achieve (e.g., 5 percent). To use this method, a histogram of the results is generated and the level at which the required number of pass/fails is reached
(e.g., 95 percent) is determined to be the pass/fail level.
Once pass and fail levels have been established, they should be reviewed to ensure they are reflective of actual cleaning performance. Where ATP testing is used effectively and a CAPA process implemented, there will typically be an improvement in hygiene levels and a subsequent lowering of average ATP results within a short space of time.
To take into account the improved hygiene levels, the pass and fails levels should be reviewed as soon as sufficient additional data is available. Subsequent to then, ongoing periodic reviews should be completed as part of a continuous improvement approach.
As discussed, one of the key benefits of these hygiene monitoring methods is the speed at which results are available, therefore allowing immediate corrections to be taken.
The corrections to be taken in the event of a failing result should be documented as part of the quality system and followed up with corrective actions to prevent a recurrence. In the case of hygiene monitoring, a failed test outcome will typically result in recleaning and retesting until a pass is achieved. Sometimes, a caution range may be implemented in the system. In such cases, the corrective action may not warrant immediate action, but instead a more thorough cleaning and/or increased scrutiny before the next production run.
While data trending and analysis is conducted in more detail in the following section, repeated fail or caution results should be investigated as a priority by those on site who have knowledge of the process, and appropriate preventive actions should be implemented.
Along with speed and sensitivity, a key benefit of ATP hygiene monitoring is the ability to trend and analyze the generated data over time. This provides a better understanding and ultimately control of the facility’s hygiene and production processes.
2.5. Corrective actions based on ATP or protein sampling results

Environmental Monitoring Handbook - Hygiene Monitoring
22
89
234
203
56
12
45
98
64
98
P
15
78
100
P
P
1
Pastry cutter
Cheese grater
Depositor
Cheese mixer
Moulder
Dough station 1
Dough toss 1
Mixer 1
Mixer 2
Grinder
Depositor 2
Depositor 2
Moulder
Cheese grinder
Moulder 2
Moulder 3
Test Point
Test#
1
2
3
ResultsTest Name
1st Test
Retest (1)
Final Retest
Points (#)
278
50
20
Points (%)
100%
18%
7%
Daily Master Sanitation Schedule
All Results Overview
Su12
M13
Tu14
W15
Th16
F17
Sa18
Su19
M20
Tu21
W22
Su26
M27
Tu28
W29
Th23
F24
Sa25
179
65
143
23
14
6
100
91
654
P
1
82
105
P
P
7
123
178
65
56
51
5
101
200
32
P
4
94
90
P
P
3
123
197
69
45
32
8
87
80
48
C
3
76
89
P
P
5
34
345
23
48
45
12
45
95
19
P
9
80
87
P
P
6
358
1
78
25
101
65
65
91
27
P
50
54
86
P
F
759
68
245
37
45
67
45
20
24
83
P
7
80
8
P
P
2
89
78
198
25
85
12
15
86
64
P
6
90
9
P
P
9
28
37
9
24
15
9
32
58
P
5
64
4
P
P
5
262
66
89
156
564
5
89
84
98
P
90
125
890
F
C
8
149
231
25
32
12
48
75
73
P
4
36
78
P
P
6
143
199
49
67
54
23
97
1
71
P
8
1
72
P
P
4
148
75
37
62
2
45
6
81
P
3
65
91
P
P
5
111
78
81
56
95
45
85
8
97
P
1
75
83
P
3
102
81
23
82
32
2
86
45
95
F
4
84
49
P
P
2
58
199
123
14
75
15
12
54
48
P
8
64
76
P
9
79
232
48
22
76
65
45
78
56
P
6
21
5
P
P
4
145
456
66
69
11
45
86
52
84
P
4
45
4
P
P
7
Legend: Pass Caution Fail Untested
50
18
20 20
16735 26
ATP system manufacturers will typically provide software for managing data, although the data analysis capabilities and ability to present meaningful data varies with each (Figure 8).
When trending and analyzing data, aspects that should be routinely monitored include cleaning consistency, suitability of pass/fail levels, trends or patterns and areas of concern.
2.6. Data trending and analysis
Figure 8. Data trending software for cleaning consistency

Environmental Monitoring Handbook - Hygiene Monitoring
23
Cleaning consistency can be assessed through a simple line graph (Figure 9a-b). If the graph shows a high degree of variability, it indicates that the cleaning process is not in control.
Common areas to investigate to understand the root-cause of poor cleaning control include staff training, cleaning methods/tools, variations in the products produced and sampling technique.
Trends or patterns can also be identified using longer term data sets in the form of a line graph (Figure 10). These trends can reflect improving or declining hygiene levels at plant-level or test point-level, and can be used as evidence of improved hygiene practices or identification of areas needing investigation.
Figure 9a. High degree of variance / inconsistency in results over time. Cleaning not in control.
Figure 9b. Low degree of variance / inconsistency in results over time. Cleaning in control.
1000800600400200
0
Food Prep line 1 : high risk : CONVEYOR TWO : UXL 100 (Surface ATP)
Food Prep line 1 : high risk : HOPPER TWO : UXL 100 (Surface ATP)
PIZZA LINE 1 : Dough Mix : BLENDER : UXL 100 (Surface ATP) PIZZA LINE 1 : Dough Mix : DEPOSITOR 1 : UXL 100 (Surface ATP)
PIZZA LINE 1 : Dough Mix : FILLER HEAD 1 : UXL 100 (Surface ATP)
7/26 8/2 8/9 8/16 8/23 8/30
1000800600400200
07/26 8/2 8/9 8/16 8/23 8/30
2017 2018 2017 2018
RLU
sR
LUs
30025020015010050
0
RLU
s
2017 2018
30025020015010050
0
RLU
s
1000800600400200
0
Food Prep line 1 : high risk : CONVEYOR TWO : UXL 100 (Surface ATP)
Food Prep line 1 : high risk : HOPPER TWO : UXL 100 (Surface ATP)
PIZZA LINE 1 : Dough Mix : BLENDER : UXL 100 (Surface ATP) PIZZA LINE 1 : Dough Mix : DEPOSITOR 1 : UXL 100 (Surface ATP)
PIZZA LINE 1 : Dough Mix : FILLER HEAD 1 : UXL 100 (Surface ATP)
7/26 8/2 8/9 8/16 8/23 8/30
1000800600400200
07/26 8/2 8/9 8/16 8/23 8/30
2017 2018 2017 2018
RLU
sR
LUs
30025020015010050
0
RLU
s
2017 2018
30025020015010050
0
RLU
s
Figure 10: Cleaning trend identification from long-term ATP data

Environmental Monitoring Handbook - Hygiene Monitoring
24
Any adverse trends observed should be investigated to understand the root-cause and may include the following observations and causes:
• Long-term trends may be associated with seasonal variation or equipment surfaces becoming worn. In these cases, hygiene could be improved through increased cleaning at appropriate times of the year or worn equipment could be replaced.
• Regularly occurring patterns may be linked to scheduled production of different products or changes in cleaning crews.
• Step changes may indicate a change in cleaning practices, chemicals or equipment.
Areas of concern can be identified by analyzing test points for frequency of failing results, indicating that the test point is consistently difficult to clean. This level of analysis becomes more complex and generally requires the use of a software system capable of performing such a task automatically, although it could also be done manually if sufficient time was dedicated to the analysis.
Suitability of pass/fail levels should also be reviewed on an ongoing basis (Figure
11). Assessing if the levels are appropriate can be handled in several ways, but can include evaluating each test point for its history of failing. If over an extended period of time or many measurements the test point has never failed, it is likely that either the pass/fail levels are too lenient or the level of risk associated with that point should be reviewed. Following the review, appropriate pass/fail levels may be set as discussed in the previous section. A system of continuous improvement through regular lowering of pass/fail levels is also a common practice.
Overall, the use of ATP and protein-based tests should be seen not only as a convenient tool for quickly determining the hygiene levels of a surface before starting production but also as an investment in data related to the production process. Once generated, the data should be analyzed and used as a tool to manage the site in a more effective manner and demonstrate that hygiene targets are being achieved. It can lead to an informed, focused approach to managing the hygiene of any given area and can also be used as a training aid or to optimize cleaning regimes, production run times or use of cleaning chemicals/sanitizers.
1000800600400200
0
Food Prep line 1 : high risk : CONVEYOR TWO : UXL 100 (Surface ATP)
Food Prep line 1 : high risk : HOPPER TWO : UXL 100 (Surface ATP)
PIZZA LINE 1 : Dough Mix : BLENDER : UXL 100 (Surface ATP) PIZZA LINE 1 : Dough Mix : DEPOSITOR 1 : UXL 100 (Surface ATP)
PIZZA LINE 1 : Dough Mix : FILLER HEAD 1 : UXL 100 (Surface ATP)
7/26 8/2 8/9 8/16 8/23 8/30
1000800600400200
07/26 8/2 8/9 8/16 8/23 8/30
2017 2018 2017 2018
RLU
sR
LUs
30025020015010050
0
RLU
s
2017 2018
30025020015010050
0
RLU
s
Figure 11. Adoption of more stringent pass/fail levels for continuous improvement of hygiene control

Environmental Monitoring Handbook - Hygiene Monitoring
25
2.7. Other considerations
CASE STUDY
A trial of any rapid hygiene monitoring system is strongly recommended and this should mimic a part of the full sampling schedule. As previously mentioned, it is also very important to note that while all ATP systems give results in “RLU,” the readings from different manufacturers are not interchangeable. For instance, a reading of 10 RLU from one manufacturer may be equivalent to 50 RLU for a different manufacturer, so pass/fail levels must be independently determined for every system.
In addition, ATP testing can be complemented by visual inspection and microbiological testing. Visual inspection can quickly give a big-picture view about the effectiveness of cleaning processes, but it has limitations because microorganisms cannot be seen by the naked eye. Microbiological testing can enumerate organisms that may cause contamination; however, it cannot provide immediate results on the manufacturing floor. A robust hygiene monitoring program would utilize all three complementary methods.
This case study has been selected as an illustration of how a rapid hygiene monitoring system can be used to measure and manage the hygiene of food preparation areas.
The manufacturing siteThe manufacturer was operating a medium-sized cook-chill facility, providing prepared raw meats, vegetables and various prepared meals. It had been purpose-built with fully segregated low-risk and high-care areas, as well as a butchery and vegetable preparation areas.
ATP-based rapid hygiene monitoring was introduced at the site during the pre-production phase as both a training tool for staff and to collect baseline data for determining the pass/fail levels that would be used during routine production.
The belief that visual assessment was sufficient to determine the hygienic status of a surface was quickly dispelled, as the ATP results showed readings much higher than should be achievable for the types of surfaces and processes being used.
Using the ATP system as an objective measure of cleanliness, the cleaning staff were then able to improve their cleaning methods to bring the ATP results back down to levels known to be achievable in similar facilities. This phase in the ATP system implementation was used to stabilize cleaning and show that it was in control before progressing to further data analysis to refine and customize pass/fail levels. The use of an objective measure of cleanliness also reinforced the importance of having correctly implemented cleaning practices and embedded a culture of good hygiene amongst the staff.
The system was initially used solely to confirm the hygiene of the high-care area, but once established and fully operational, use of the system was expanded to monitor and help improve hygiene practices in other areas (e.g., butchery and wash-up), although on a less frequent basis in line with the lower risk ratings in those areas.
25

Environmental Monitoring Handbook - Hygiene Monitoring
26
Over time, the range of products prepared at the facility expanded to include more ready-to-eat (RTE) foods, which were given a defined, separate area. Analysis of historical data from the other production areas was used to determine that a lower pass/fail value could be implemented in this area, recognizing the higher levels of hygiene expected for RTE products.
Ongoing use of the ATP system has allowed the different areas to be released for production with confidence that high levels of hygiene are being met and maintained. The microbiological test results also
correlated well with the hygiene levels, although occasional discrepancies were observed, highlighting that a combination of test methods is required to manage the microbial risk in a facility. There were microbiological swab results that fell outside of acceptable limits from time to time, but these were infrequent and quickly resolved, resulting in a “pass” at the retest.
Ongoing analysis of the data has enabled the facilities’ hygiene to be managed in a proactive rather than reactive way, enabling a system of continuous improvement.
Connect with a 3M Food Safety expert
www.3M.com/Connect/ATPMonitoring
Learn more about hygiene monitoring
www.3M.com/ATPMonitoring

Environmental Monitoring Handbook - Hygiene Monitoring
27
References:
1. Chappelle, E.W., Levin, G.V. 1968. Use of the firefly bioluminescence reaction for rapid detection and counting of bacteria. Biochemical Medicine. 2: 41– 52. https://doi.org/10.1016/0006-2944(68)90006-9
2. Smith, P.K., Krohn, R.I., Hermanson, G.T., Mallia, A.K., Gartner, F.H., Provenzano, M.D., Fujimoto, E.K., Goeke, N.M., Olson, B.J., Klenk, D.C. 1985. Measurement of protein using bicinchoninic acid. Analytical Biochemistry. 150: 76-85. https://doi.org/10.1016/0003-2697(85)90442-7
3. Dairy Food Safety Victoria. 2016. Dairy Pathogen Manual. http://www.dairysafe.vic.gov.au/publications-media/regulations-and-resources/guidelines
4. United States Food and Drug Administration. 2017. Control of Listeria monocytogenes in Ready-To-Eat Foods: Guidance for Industry; Draft Guidance. https://www.fda.gov/RegulatoryInformation/Guidances/ucm073110.htm
5. United Fresh Produce Association. 2013. Guidance on Environmental Monitoring and Control of Listeria for the Fresh Produce Industry. http://www2.unitedfresh.org/forms/store/ProductFormPublic/guidance-on-environmental-monitoring-and-control-of-listeria-for-the-fresh-produce-industry
6. Simmons, C.K., Wiedmann, M. 2018. Identification and classification of sampling sites for pathogen environmental monitoring programs for Listeria monocytogenes: Results from an expert elicitation. Food Microbiol. 75: 2-17. https://doi.org/10.1016/j.fm.2017.07.005

Environmental Monitoring Handbook - Indicators
28
Environmental Monitoring for Indicator Organisms
CHAPTER 3
By Kelly Stevens | General MillsJean-Francois David | 3M Food SafetyCari Lingle | 3M Food Safety
Purpose of environmental monitoring for indicator organisms 29
29
32
35
36
37
37
38
30
32
34
31
31
3.1.
3.2.
3.3.
3.4.
3.5.
3.6.
3.2.1.
3.3.1.
3.3.2.
3.3.4.
3.3.3.
3.2.2.
3.2.3.
Indicator organisms and their significance in the food processing environment
Development of an indicator sampling program
Corrective actions based on indicator organism results
Identifying sources of indicator organisms
Summary
Total Plate Count
Selection of sampling sites
Sampling frequency and number of samples
Determination of cut-off levels for indicator organisms
Data trending, analysis and establishing a baseline for indicator organisms
Coliforms
Enterobacteriaceae
Environmental Monitoring Handbook - Indicators
29
The term indicator organism is defined as an organism or group of organisms that reflects the general microbiological condition of a food or the environment.1 The presence of indicator organisms does not provide any information on the potential presence or absence of a specific pathogen nor does it provide an assessment on potential public health risk. However, data from environmental monitoring programs that incorporate indicator organisms can be used to:
• Determine the hygienic status of the processing equipment and environment.
• Understand the microbial ecology of the processing environment.
• Validate and/or verify cleaning and sanitation (typically testing for indicator organisms would validate or verify sanitation, while ATP testing (see Chapter 2) would be used to validate or verify cleaning).
• Verify process control steps.• Assess post-processing contamination
risk.
The role of testing for indicator organisms is still often misunderstood by food microbiologists, quality assurance personnel, and others; many incorrectly assume that detection of indicator organisms above a certain level suggests the presence of pathogens. In contrast to “indicator organisms,” organisms whose presence (or detection above a threshold) actually suggest an increased risk for the presence of an ecologically similar pathogen are referred to as “index organisms.” There is, however, considerable skepticism among many whether there are any organisms that could accurately be considered as true “index organisms,” with the possible exception of Listeria spp.
Once thought to be an indication of fecal contamination or potential pathogenic contamination, indicator organisms were incorporated into food microbiological testing during the beginning of the 20th century. Testing for these organisms gave a broader view of organisms in ingredients, finished product and the environment rather than looking for a specific species.
Microbiologists knew if the manufacturing process was truly under control, the number of indicator organisms would also be in control. Indicator organisms that can be used for environmental monitoring programs include those found by Total Plate Count, coliforms, and Enterobacteriaceae tests.
3.1. Purpose of environmental monitoring for indicator organisms
3.2. Indicator organisms and their significance in the food processing environment

Environmental Monitoring Handbook - Indicators
30
Total Plate Count (TPC), also referred to as Aerobic Plate Count (APC), Standard Plate Count (SPC), Total Viable Count (TVC) or Mesophilic Count (MC), represents one of the most common indicator tests, although methods used throughout the world vary slightly. At the core, these methods have key commonalities: a non-selective nutrient medium incubated under aerobic conditions used for enumeration. The purpose of the method is to provide information on the total population of bacteria present capable of growing in the presence of oxygen at mesophilic temperatures.
TPC has many applications. For instance, the total number of organisms present can affect both quality and potential spoilage risk of a finished product. In its application as an indicator organism, TPC is used to provide an indication of the total microbial population on a surface or in a sample.2 More specifically, TPC is an extremely valuable method to validate and verify sanitation procedures. TPC counts above a certain threshold would typically suggest that sanitation of the specific environment or equipment was ineffective or improperly performed.
3.2.1. Total Plate Count
Enterococcus faecalis
E. coli
Bacillus

Environmental Monitoring Handbook - Indicators
31
Coliforms are a diverse group of Gram-negative, non-spore forming rods that are defined by their ability to ferment lactose to produce acid and/or carbon dioxide gas. The precise definition varies by internationally accepted standard methods. Traditionally, testing of coliforms derived from the search for E. coli, and presence of coliforms had long been thought to indicate fecal contamination. However, decades of research regarding this diverse group of bacteria indicates that only a fraction are fecal in origin, while the majority are environmental contaminants.3
Coliform testing is used as an indication of improper cleaning, insanitary conditions or post-process contamination. Importantly, however, coliform testing only detects a subset of the organisms that may be present in a food processing facility. For example, members of the genus Pseudomonas, which represent important spoilage organisms for many foods, are not detected with coliform tests. For this reason, a coliform test may not detect certain problems with a sanitation program, which could be detected with another test (e.g., TPC). Therefore, coliform tests are best used in conjunction with other tests, such as TPC, to validate or verify sanitation procedures and protocols.
Enterobacteriaceae represent a diverse group of Gram-negative bacteria, which includes all coliform bacteria. Enterobacteriaceae are non-spore forming, oxidase-negative rods that ferment glucose to acid and/or carbon dioxide gas. Although the Enterobacteriaceae group includes genera known to be pathogenic, such as Salmonella, it is considered an indicator test group and not a method for monitoring the presence of pathogens. If information regarding the presence or absence of a specific pathogen is required, it is advised to perform a specific test for that organism as opposed to relying on indicator tests.
3.2.2. Coliforms
3.2.3. Enterobacteriaceae
Utilizing coliforms as an indicator for environmental monitoring
While there is general agreement that coliform detection does not provide evidence for fecal contamination, a number of countries (e.g., Japan) and industries (e.g., dairy industry in the United States) have regulations on coliforms. For example, in Japan, coliforms are historically well-recognized in several regulations for food industries. Therefore, coliforms are widely used as indicators in Japan for monitoring production environments.
Environmental monitoring for coliforms is considered valuable since coliform presence in finished products would typically result from environmental sources after the critical control points (CCP), usually the heat treatment step, except for rare instances where it may indicate a failure of the CCP. When coliforms are used in environmental monitoring, high levels of coliforms may sometimes even trigger additional follow-up pathogen testing. Therefore, despite an increasing preference for Enterobacteriaceae testing over coliform testing, coliform testing of environmental samples may still be common in a number of countries and industries.

Environmental Monitoring Handbook - Indicators
32
3.3. Development of an indicator sampling program
The first step when selecting sampling sites should be to map the manufacturing process and identify the processing steps (e.g., filling, freezing, slicing), functional units (e.g., processing lines, which typically consist of multiple pieces of equipment), and equipment, noting the construction materials used (e.g., stainless steel, rubber, high-density polyethylene [HDPE]). Mapping and sampling sites should focus on Zone 1 (product contact surfaces) and Zone 2 (surfaces adjacent to product contact surfaces), as indicator testing in these areas provides the most value in terms of sanitation effectiveness. In-process sampling of Zone 1 sites also provides quantifiable data that can be used to indicate possible loss of process control
or conditions which could lead to product contamination. In-process sampling of Zone 1 sites for indicator organisms can also be used to define appropriate run times for different lines and could be used to provide scientific support for extended run times.
Additionally, indicator testing for Zone 1 and 2 sites represents a supplementary method for monitoring the condition of equipment and prescribing the frequency of preventative maintenance or repairs. For example, trends towards higher numbers of indicator organisms in certain sites may point towards the need for (more frequent) replacement of gaskets or other rubber and plastic parts.
3.3.1. Selection of sampling sites
Enterobacteriaceae testing serves the same purpose as coliform testing in that it indicates improper cleaning, insanitary conditions or post-process contamination.
Similar to coliform testing procedures, Enterobacteriaceae tests will also not detect all Gram-negative bacteria, for example, Pseudomonas species.
Development of an indicator sampling plan should be initiated under the direction of a person trained and experienced in microbiological indicators, testing methodology, sampling methodology, microbiological results interpretation and with knowledge of the processing system that will be sampled. Sampling sites, sampling frequency and collection times should be determined based on risk and processing schedules. Once the sampling plan is fully developed, training and documentation should be facilitated.
Sample collectors and data reviewers should always be trained prior to them
collecting samples or analyzing data from environmental monitoring programs. Training should include aseptic technique, properly collecting samples at each location, ensuring the proper location is swabbed and understanding safety considerations for each location. Collectors should be retrained if there are any incidences or indications of any improper handling or swabbing. Additionally, annual training should take place to ensure that proper technique and sampling is maintained year after year. To see how each operator collects a sample, training and evaluation of this technique is ideally hands-on as opposed to classroom training.

Environmental Monitoring Handbook - Indicators
33
Incorporation of Zone 3 sites into the indicator sampling plan may be valuable during investigations or root-cause analysis, as these sites are likely to have fluctuating levels of the different target bacteria, which may result in erratic trends.
Similar to selection of sites for pathogen testing (see Chapter 4), indicator sampling sites should be selected with the aim of finding potential issues rather than sites that are easy to clean and sanitize or will always meet the acceptable limits. For example, large, flat stainless-steel surfaces are typically easier to clean and sanitize (and therefore tend to not be the best sampling sites, particularly if these are the only sites used) while a fabric-backed belt is more difficult to clean and
sanitize. The sampling plan should include a representative site from each processing step as well as sites that include each of the different types of material used in the construction of equipment.
Once sites are selected, the appropriate tool for sampling each should also be decided. If the site is a small niche or crevice that is difficult to access, a swab may be the best option. For areas that are larger, a sponge would be best as it allows for more effective collection through higher mechanical action. On easy-to-clean, flat surfaces in which a higher sensitivity test method is desired (as low counts are expected), direct contact of a medium to the surface may be used (Figure 1).
Figure 1. Examples of direct contact and swab sampling using 3MTM PetrifilmTM Plates

Environmental Monitoring Handbook - Indicators
34
Sampling frequency for indicators as part of an environmental monitoring program (which typically is designed as a verification activity) should be risk-based and take into consideration the type of product being produced (ready-to-eat, ready-to-cook or raw; high or low-water activity), the level of risk at each process step and other considerations specific to the processing environment such as:
• Processing lethality.• Sanitation frequency.• Facility characteristics.• Potential for cross contamination.
The frequency of in-process sampling is also influenced by the microbial susceptibility of the product being produced, microbial load of ingredients and normal flora of ingredients.
A risk-based sample selection approach should allow one to test only a portion of all the available sampling sites, but still be able to verify control of the environment or sanitation procedures.
When used for verification of sanitation efficacy, sampling should take place after every sanitation cycle and prior to production startup to allow for trending of results and early identification of issues. If the production equipment is complex or contains difficult-to-access areas, it may also be helpful to sample while the equipment is operating but before starting the processing of food. This may mean that certain equipment (e.g., conveyer belts) may need to be run for a certain time period (e.g., 15 minutes) before sampling. This will increase the likelihood that residual microbial populations that remained after sanitation become accessible to sampling.
Increased sampling should also take place following an out-of-specification result, particularly for coliforms andEnterobacteriaceae.
This section outlines considerations for sampling frequency of routine (verification) environmental monitoring programs that utilize indicator organism tests. However, indicator organism testing is also an essential tool for validation of sanitation procedures, such as specific high-risk pieces of equipment. As detailed in other chapters, validation of cleaning and sanitation may include multiple testing methods (e.g., ATP, indicator, and possibly pathogen tests).
3.3.2. Sampling frequency and number of samples

Environmental Monitoring Handbook - Indicators
35
The quantitative results that can be obtained from indicator organism testing are particularly useful, as they can be further analyzed and used to determine baseline levels. Analysis of the data should take place regularly to identify trends and specific issues to allow for appropriate corrections and corrective actions. For example, frequent analysis can help identify a trend of increasing indicator organism numbers, which may then allow facilities to take action before a failure point is reached. Longer term analysis can also foster understanding of seasonality effects and identify opportunities for operational and product improvements.
The baseline levels represent what a sanitation program can deliver on a
consistent basis throughout the process/facility and can therefore be used to expose results that are out of specification in terms of sanitation effectiveness. The baseline can be determined in a number of ways, including collecting samples after consecutive sanitation cycles from each test point. The results can then be plotted in a process control chart to establish the baseline (Figure 2).
Importantly, standard operating procedures (SOPs) for indicator testing should include specific instructions for trending, including the frequency of formal reviews of indicator testing data.
3.3.3. Data trending, analysis and establishing a baseline for indicator organisms
Figure 2. Example of coliform counts and baseline-level post-sanitation
2
1.9
1.8
1.7
1.6
1.5
1.4
1.3
1.2
1.1
1
0.9
Log
CFU
/cm
2
Coliform Count
1 2 3 4 5 6 7 8 9 10 11 12 13 14 15 16 17 18

Environmental Monitoring Handbook - Indicators
36
Acceptable limits of indicator organisms should be established for each sampling location. The limits can be determined in several ways, including utilizing the baseline levels and leveraging historical data.
Following sanitation, low levels of indicator organisms are expected on surfaces.
Example guidance from the Almond Board of California (Table 1) would suggest the following as appropriate and achievable levels for indicator organisms. Presence or levels of indicator organisms above the acceptable limit demonstrate that conditions exist that could lead to loss of process control, potentially resulting in product contamination.
Improvements to sanitation, repair of equipment and changes in processes may allow for a new baseline and lower acceptable limits to be applied.
3.3.4. Determination of cut-off levels for indicator organisms
Table 1. Recommended micobiological indicator limits for equipment cleaning before and after application of sanitizer provided by Almond Board of California.4
Quantitative Microbiological
Indicator Test
Target/Acceptable
Limits
Post-Heat Treatment Taken Before Sanitizer (cfu/40 in2 [250
cm2])
Post-Heat Treatment - Pre-op Taken After
Sanitizer (cfu/40 in2 [250 cm2])
Aerobic Plate Count
Target <100 <10
Acceptable <500 <100
Coliforms
Target <10 <10
Acceptable <100 <50
Total
Enterobacteriaceae
Target <10 <10
Acceptable <100 <50
Environmental Monitoring Handbook - Indicators
37
Corrective action documentation should include the actions taken, results of those actions, dates and people involved. Significant deviations should trigger re-evaluation of the plan and sample collection retraining. Once the corrective action has been put into place, additional sampling at strategic locations in the area of the failure should transpire to ensure the effectiveness of the corrective action. Corrective actions should be reapplied in locations or lines where similar conditions or risks occur.
Corrective actions may not always be a consequence of a failure; they may also be in the form of quality or process improvement. In-process sampling may
indicate seasonal effects, abnormal microbial load of an ingredient or equipment in need of repair.
As an example of corrective action resulting from an identified seasonal effect, consider a scenario in which counts at a certain point in the process during winter may take eight hours of operation to become elevated to a point that the equipment needs to be cleaned. However, in the summertime it takes four hours to reach the same level of bioburden at the same location. The process improvement, in this case, may be to increase the frequency of cleaning during the summer months on that product line.
3.4. Corrective actions based on indicator organism results
As described above, indicator organisms are commonly present in the production environment, and more broadly in nature. Classical sources of indicator organism are cross contamination from outside of the production area or in process (potable) water. Indicator organisms introduced to Zone 1 and Zone 2 areas are most likely to stem from ingredients and raw materials. When assessing sources of elevated indicator organism levels, it also is important to take into consideration any atypical activity that may be occurring in the facility such as construction or new product runs on an adjacent line. New activities, equipment, change in sanitation chemicals or personnel could also contribute to increases in indicator organism counts.
Sporadic increases in indicator organism counts could also stem from equipment failures or improper cleaning. Equipment failures could include cracks in gaskets or fractures in conveyor belts creating a growth niche or harborage site (Figure 3).
Furthermore, if all equipment and machinery is not dismantled for cleaning on a regular basis, or if difficult-to-clean areas exist, biofilms may form and result in contamination of product. While these issues should typically be identified during validation of cleaning and sanitation SOPs, they may sometimes be identified through verification sampling that targets indicator organisms.
3.5. Identifying sources of indicator organisms

Environmental Monitoring Handbook - Indicators
38
Figure 3. Examples of potential growth niches in equipment
Bolts
Interface
Underside strip
Milk Filler
Growth niches in rubber-plastic interface of filler cup (cracking)
Poor welds
Hollow roller on a conveyor belt
A robust environmental monitoring program should include testing for indicator organisms, especially post-sanitation and on Zone 1 and 2 surfaces. Indicator organisms TPC, coliforms, and Enterobacteriaceae may be used to verify efficacy of sanitation activities and that plant operating conditions are under control. The presence of indicator organisms does not indicate the presence of a pathogen, but their levels above
defined acceptable limits can indicate insufficient cleaning and sanitation or operating conditions. Use of indicator testing can act as an early warning system to identify and prevent potential product contamination issues. If results exceed the established control limits, facilities are expected to take appropriate corrective action and to document the actions taken and results obtained.
3.6. Summary
Connect with a 3M Food Safety expert
www.3M.com/Connect/MicroIndicators
Learn more about indicator organism testing
www.3M.com/MicroIndicators

Environmental Monitoring Handbook - Indicators
39
References:
1. Chapin, T.K., Nightingale, K.K., Worobo, R.W., Wiedmann, M., Strawn, L.K. 2014. Geographical and Meteorological Factors Associated with Isolation of Listeria Species in New York State Produce Production and Natural Environments. Journal of Food Protection. 77: 1919-1928. https://doi.org/10.4315/0362-028X.JFP-14-132
2. Downes, F. P., Ito, K., and American Public Health Association. 2001. Compendium of methods for the microbiological examination of foods (4th ed.). Washington, DC: American Public Health Association.
3. Martin N.H., Trmčić, A., Hsieh, T., Boor, K.J., Wiedmann, M. 2016. The Evolving Role of Coliforms As Indicators of Unhygienic Processing Conditions in Dairy Foods. Front. Microbiol. 7:1549. https://www.ncbi.nlm.nih.gov/pmc/articles/PMC5043024/pdf/fmicb-07-01549.pdf
4. Almond Board of California. Preventing Salmonella Recontamination: Pathogen Environmental Monitoring Program Guidance Document. http://www.almonds.com/processors/processing-safe-product/pem

Environmental Monitoring Handbook - Pathogens
40
Purpose of environmental monitoring for pathogens 41
43
46
51
52
53
44
47
49
44
45
4.1.
4.2.
4.3.
4.4.
4.5.
4.6.
4.2.1.
4.3.1.
4.3.2.
4.2.2.
4.2.3.
Pathogens of concern and their significance in the food processing environment
Development of a pathogen sampling program for verification of environmental pathogen control strategies
Corrective actions based on pathogen testing results
Identifying sources of pathogens and development of preventive controls
Advanced sampling approaches to control environmentally transmitted foodborne pathogens
Listeria and Listeria monocytogenes
Zoning and selection of sampling sites
Sampling frequency and number of samples
Salmonella
Cronobacter
Environmental Monitoringfor Pathogens
CHAPTER 4
By Martin Wiedmann | Cornell University Department of Food ScienceAlexandra Belias | Cornell University Department of Food ScienceGenevieve Sullivan | Cornell University Department of Food Science Christian Blyth | 3M Food Safety

Environmental Monitoring Handbook - Pathogens
41
In general terms, companies perform environmental monitoring for foodborne pathogens in processing and other food handling facilities to identify and eliminate environmental pathogen sources, consequently reducing the risk of food contamination and the associated risk of recalls, foodborne illness cases and outbreaks. Pathogen environmental monitoring (PEM) programs thus are often considered to represent a proactive approach to microbial food safety. They can identify challenges and pathogen sources before they lead to contamination of finished food products. PEM programs are particularly important since foodborne pathogen contamination of finished products typically occurs at low frequency, which makes finished product testing alone an ineffective strategy for ensuring food safety.
More specifically, PEM programs are typically used to (1) verify an overall food safety system (or specific components of a food safety system) and to (2) provide early indication of potential food safety hazards.1 However, testing of environmental samples for pathogens is usually not an effective means for validation of food safety practices, prerequisite programs and “non-process preventive controls” (e.g., sanitation standard operating procedures [SSOPs]). This is because the absence of pathogens may suggest a control strategy was effective when really the target pathogen was simply not present even before the control strategy (e.g., sanitation) was applied.
Validation of sanitation procedures and other control strategies typically requires the use of multiple environmental
monitoring approaches, including ATP testing, to validate cleaning and Total Plate Count (TPC) methods to validate sanitation. Often, use of these tests is supplemented with pathogen testing to identify specific harborage sites that allow for pathogen growth or survival. The process used to identify specific harborage sites or niches (e.g., as part of validation or similar type efforts) is often referred to as the “seek and destroy” technique.2
In addition to validation and verification, testing of environmental samples for pathogens is used to support root-cause analysis efforts and to verify that corrective actions taken are effective in addressing specific pathogen-related problems. These activities may be part of “for-cause” and “not-for-cause” investigations.
While PEM programs are most commonly used in processing facilities that manufacture ready-to-eat (RTE) products, these programs are also increasingly used in produce packing houses, often to help with control of L. monocytogenes. They may also be valuable to verify pathogen control strategies in other establishments that handle RTE food, such as institutional kitchens that serve high-risk populations.
Importantly, there are a number of industry and commodity-specific guidance documents for establishing and implementing PEM programs (in particular for Listeria) that should be consulted (Table 1). These guidance documents typically provide a level of detail that considerably exceeds what is covered in this handbook.
4.1. Purpose of environmental monitoring for pathogens

Environmental Monitoring Handbook - Pathogens
42
Table 1. Examples of guidance documents for the establishment of pathogen environmental monitoring programs.
Document Title Organization Target Industry Target Pathogen
Dairy Pathogen Manual 3 Dairy Food Safety Victoria (Australia)
DairySalmonella and
L. monocytogenes
Listeria monocytogenes Guidance on Environmental Monitoring and Corrective Actions in At-Risk Foods 4
Grocery Manufacturers
Association
Ready-to-eat (RTE) foods
L. monocytogenes
Control of Listeria monocytogenes in
Ready-to-Eat Foods: Guidance for Industry 5
U.S. Food and Drug Administration
RTE L. monocytogenes
Control of Listeria monocytogenes: Guidance for
the U.S. Dairy Industry 6
Innovation Center for
U.S. DairyDairy L. monocytogenes
Guidance on Environmental Monitoring and Control of
Listeria for the Fresh Produce Industry 7
United Fresh Produce Association
Fresh Produce L. monocytogenes
FSIS Compliance Guideline: Controlling Listeria
monocytogenes in Post-lethality Exposed Ready-to-
Eat Meat and Poultry Products 8
U.S. Department of Agriculture
Food Safety and Inspection Service
RTE L. monocytogenes

Environmental Monitoring Handbook - Pathogens
43
While a considerable number of pathogens cause foodborne illness, there are only a few pathogens for which sources in food processing and handling environments have been linked to foodborne illness cases and outbreaks. Key pathogens targeted in PEM programs include L. monocytogenes, with testing typically targeting all Listeria spp., rather than the specific pathogenic species L. monocytogenes and Salmonella. In addition, environmental sources of Cronobacter spp. are a concern in
manufacturing of powdered infant formula.
While not covered in more detail here, food processing environments cannot be excluded as the source of other foodborne pathogens, including Gram-negative pathogens in the Enterobacteriaceae family (e.g., pathogenic E. coli, such as Enterohemorrhagic E. coli [EHEC]) and even Yersinia. Hence, some facilities may include pathogenic E. coli as a target in their PEM programs.
4.2. Pathogens of concern and their significance in the food processing environment
Listeria
Salmonella
Cronobacter

Environmental Monitoring Handbook - Pathogens
44
Listeria is a bacterial genus that, as of 2016, is comprised of 17 species. Nine Listeria species have been newly described since 2009.9 Genomic and phenotypic data clearly define a distinct group of six species (Listeria sensu strictu) that share common phenotypic characteristics (e.g., ability to grow at low temperature); this group includes the human pathogen Listeria monocytogenes. The other 11 species (Listeria sensu lato) represent three distinct groups, which have been proposed to represent three different genera that are distinct from Listeria sensu strictu.9 Listeria tests virtually always detect all members of Listeria sensu strictu but may not always detect all members of Listeria sensu lato. It is important to select a method that has been tested for the ability to detect these species.10
While L. monocytogenes is the pathogen of concern, PEM programs typically test for Listeria spp., which means a positive test result indicates the presence of a Listeria species that may or may not be L. monocytogenes. This strategy provides for a more sensitive approach to identify (1) conditions that allow for L. monocytogenes presence or introduction and (2) harborage sites that could support L. monocytogenes.
However, a site that is positive for Listeria species could also be positive for L. monocytogenes and follow-up on each Listeria positive sample needs to be conducted “as if the site were positive for L. monocytogenes.” If this approach is followed consistently and appropriately, it provides a more sensitive approach to food safety and environmental monitoring than specific testing for L. monocytogenes.
There are specific situations, however, where testing of environmental samples to specifically find L. monocytogenes may be appropriate, for example in a for-cause investigation that is triggered by a finished product positive for L. monocytogenes. In this context, it is important to emphasize that finished product testing approaches with regard to testing for Listeria spp. or L. monocytogenes may differ considerably by country and region. For example, in the United States, one would virtually always test for Listeria monocytogenes and not for Listeria spp., as regulatory agencies typically expect speciation of Listeria spp., isolated from finished RTE products. In other countries however, screening of finished products for Listeria spp. may be the more common approach.
The genus Salmonella includes two species, Salmonella enterica and Salmonella bongori. PEM testing in facilities where Salmonella has been identified as a hazard reasonably likely to occur from environmental sources will virtually always target Salmonella spp., using tests that detect both of these species.
While Salmonella may classically be thought of as a fecally transmitted
pathogen, there is clear evidence that the environment of processing facilities and other food associated environments can be an important source of Salmonella, particularly, but not limited to dry environments. For example, Salmonella has been shown to persist for at least 10 years in dry food processing facilities.11 Hence, the identification of Salmonella harborage sites is important for certain types of RTE food facilities.
4.2.1. Listeria and Listeria monocytogenes
4.2.2. Salmonella

Environmental Monitoring Handbook - Pathogens
45
The genus Cronobacter (formerly Enterobacter sakazakii) has been amended over the last several decades due to the continued genotypic and phenotypic investigation of various strains that have emerged over time.12,13 Sources of Cronobacter have been shown to be primarily plant-based matrices (corn, soy, wheat, rice, herbs, spices) as well as milk powder and powdered infant formula.14 Cronobacter species are opportunistic pathogens, and have been found to be the cause of life-threatening illnesses in neonates, infants and immunocompromised older individuals. Contamination of powdered infant formula has been the primary cause for infections in neonates and infants, resulting in many outbreaks worldwide and associated recalls of powdered infant formula.15 In addition to finished product, Cronobacter has been isolated from milk powder and powdered infant formula plant environments (including roller dryers, drying towers, and tanker bays) and has been shown to persist in these environments for long periods of time due to its resistance to desiccation and ability to survive spray drying.14,16,17 Monitoring for Cronobacter in milk powder and powdered infant formula plant environments is critical to prevent contamination of the finished product. Due to the changes in taxonomical classification, it is especially important to select a method that reliably detects all species of Cronobacter.18
4.2.3. Cronobacter Be aware of the square inch or cm2 mentality
Many training materials and even government guidance documents specify a certain area that should be sampled when environmental pathogen monitoring is performed. Areas of 12 inches by 12 inches or 30 centimeters by 30 centimeters are often mentioned.8 These recommendations are problematic, however, as virtually all potential niches that should be sampled as part of an environmental monitoring program are not square or even flat areas. Think about hollow table legs or rollers, floor wall junctures or floor cracks.
Hence, it is important to provide training on sampling that emphasizes the need to sample potential niches on irregular areas, rather than only flat surfaces. Sometimes a good sample may be 600 centimeters (6 meters) of a floor seam that is 0.5 centimeters wide. Or sometimes it may have to be any surface of a hollow table leg that is accessible to sampling.

Environmental Monitoring Handbook - Pathogens
46
4.3. Development of a pathogen sampling program for verification of environmental pathogen control strategies
This section will focus on the development of PEM programs that provide verification of safety systems. It will not cover sampling strategies for validation of food safety programs, prerequisite programs and non-process preventive controls (such as sanitation procedures), as this would typically involve a combination of multiple testing approaches, including ATP, TPC and, potentially, pathogen tests. Development of a PEM program and associated sampling plans involves multiple steps. A possible step-wise framework for this is detailed in Table 2; however individual facilities must typically refine and expand this framework.
Importantly, a key challenge with PEM programs is that the specifics of sample collection, including the pressure applied to a sponge and the specific locations tested (e.g., a floor crack vs. an adjacent
uncracked floor section) can have a huge impact on whether pathogens are detected. Hence, it is important to design the sampling plan and the overall PEM program to avoid intentionally or unintentionally providing incentives for the sample collectors to not collect samples that would likely yield pathogen positives.
For example, setting numeric targets or key performance indicators for the percentage of positive PEM samples may simply lead to sample collectors not collecting samples that will likely yield positives. The goal of a PEM program is to find and eliminate pathogen contamination in the processing environment, and this goal cannot be achieved if there are incentives against collecting a positive sample.

Environmental Monitoring Handbook - Pathogens
47
4.3.1. Zoning and selection of sampling sites
Table 2. Key steps for development of a PEM program
Steps Comments and Suggestions
1 Assemble PEM team Should be a cross-functional team that, at minimum, includes representation of quality assurance, microbiologist, sanitation and plant management functions
2Assemble documentation and information needed for PEM program development
Includes floor plans, details on equipment and equipment location, PEM results obtained previously in the same facility, other environmental programs already implemented (e.g., ATP testing), and validation data for food safety programs (if available)
3Identify regulatory and customer requirements for PEM (if any)
Should also include identification of industry and regulatory guidance documents
4Decide on key parameters of PEM program
Includes target organisms, testing procedures, sample sites, sampling frequency, number of samples collected per week or month, sampling time and day and testing lab (in-house versus third-party lab)
5Develop written documentation
Includes record-keeping system, SOPs and written guidance for follow-up on positive results (corrective actions). All tasks need to be assigned to specific individuals with written record of these assignments
6 Train sample collectorsIncludes training SOPs, records of training and results for tests. Training should be delivered in a form that is easily understandable by all personnel
7 Schedule regular review
Regular review of sampling plans, results and corrective actions should occur every 6 to 12 months and needs to include the complete PEM team (Step 1). This may include a regular (e.g., yearly) PEM sampling performed by an independent or outside group (e.g., consultants or a corporate food safety team), which may collect a large set of environmental samples to assess whether the implemented routine sampling plan is effective at detecting the target pathogens
Virtually all PEM programs use the concept of sampling “zones” when developing a sampling plan. In most countries and regions, sampling sites in processing facilities are assigned to one of four zones
(see Figure 1) with Zone 1 representing food contact surfaces (i.e., surfaces directly contacted by an exposed RTE food) and Zone 4 representing areas outside of the RTE area (such as locker rooms, loading

Environmental Monitoring Handbook - Pathogens
48
docks, etc.).3,5,7,19 In some countries, sampling sites may be classified into three zones. Under this scheme, Zones 2 and 3 of the “four-zone” scheme are typically combined into one zone.
Assignment of sampling sites to zones is not always straightforward. For example, surfaces above exposed RTE foods, which show condensation that can drop onto the exposed food, would typically be
considered Zone 1, but may be classified into Zone 2 if zone classification is performed during a time of low humidity when no visible condensation is present and when the team may not be aware of the condensation potential. Additionally, while drains are typically classified into Zone 3, drains that are located immediately under food contact surfaces may be considered Zone 2 sites.
Figure 1. Environmental monitoring sampling zones
Non-Food Contact Surfaces in Close Proximity to Food and Food Contact Surfaces(Processing equipment exterior and framework, refrigeration units, equipment control panels, switches)
ZONE 2
More Remote Non-Food Contact Surfaces Located In or Near the Processing Areas
(Forklifts, hand trucks, carts, wheels, air return covers, hoses, walls, floors, drains)
ZONE 3
Non-Food Contact Surfaces Outside of the Processing Areas(Locker rooms, cafeterias, entry/access ways, loading bays, finished product storage areas, maintenance areas)
ZONE 4
Food Contact Surfaces(Slicers, peelers, fillers, hoppers, screens, conveyor belts, air blowers, employee hands, knives, racks, work tables)
ZONE 1

Environmental Monitoring Handbook - Pathogens
49
4.3.2. Sampling frequency and number of samples
The standard guidance for sampling frequency and number of samples suggests that both of these need to be determined “based on risk.” This definition tends to not be very helpful as there are few, if any, guidance documents that specify how to quantitatively assess the risk associated with environmental pathogens. Generally, facilities where RTE foods are exposed to the environment would be considered high-risk and would require, at a minimum, weekly sampling for target pathogens. Specifically, Listeria would be a target pathogen for weekly sampling for any such facility that either produces RTE foods that allow for Listeria growth (e.g., cheese, fluid milk, RTE deli meats, RTE seafood) or that
produces foods that have been linked to listeriosis outbreaks regardless of whether or not they typically would not allow for growth (ice cream is a good example of this latter case).
The sampling frequency can be reduced to monthly (or less, in rare cases) if there is substantial evidence that there is a low risk of Listeria contamination. For example, a very small facility that processes less than 3 to 4 days per week may be able to justify a lower sampling frequency. Similarly, facilities that only produce RTE foods that undergo in-package listeriocidal treatment and that do not allow Listeria growth may be able to justify sampling less than weekly.
Typically, an initial step in the design of a PEM program is to select possible PEM sites. The result of this effort is usually a master list of sampling sites with a unique identifier for each sampling site. Sufficiently detailed descriptions should be included to ensure subsequent sampling of the same site can be reproducible, and preferably, this list would be created and maintained in an appropriate database that is compatible with other databases such as laboratory information management systems (LIMS). Selection of the sampling sites typically involves a walk-through by the PEM team (Table 2, Step 1), to identify sampling sites, including hard-to-clean areas, potential niches, harborage sites, high-traffic areas and pathways that may facilitate pathogen movement in the facility.
Since disassembling equipment in order to allow sampling of actual harborage sites is not feasible for routine verification sampling, companies may instead select representative sampling sites that are contiguous or adjacent to areas of potential harborage. Sampling of actual harborage sites post-disassembly is typically performed for validation sampling or as
part of seek and destroy missions triggered by other events, such as positive samples found through verification sampling.
Each sample site will be assigned a zone, and zone definitions may differ by country, region and even regulatory agency. A written definition for what constitutes a given zone should be included in each sampling plan. Importantly, while this list represents all potential verification sampling sites, this does not mean that samples from all sites will be collected during each sample collection. For example, it would not be unusual for a medium-sized food processing facility to have a master list of 400 to 500 sites, but only collect samples from 40 to 50 of these sites a week. However, it is important that the individuals responsible for sample collection are given the freedom to also collect at least some samples that are not included in the sample site list, to allow them to collect samples from high-risk sites like pooled water, drain back-ups or new cracks in the floor that may become apparent during sample collection.

Environmental Monitoring Handbook - Pathogens
50
Table 3. Description of sampling frequency for the different food processing facility alternatives classified by USDA FSIS8
Figure legend: Post-lethality treatment (PLT): a process used to reduce or eliminate L. monocytogenes in the product; examples include pasteurization and high-pressure processing. Antimicrobial agent or process (AMAP): an agent or process used to limit or suppress the growth of L. monocytogenes in the product.
USDA FSIS Alternatives
Description of Alternatives
HACCP Classification
Size
Production Volume/ Day
(lbs.)
Minimum Frequency of Food Contact Surface Testing
(note: 3-5 samples should be collected per line)
Alternative 1 (Alt. 1)
PLT & AMAP n/a n/a2 times/ year/ line (every 6
months)
Alternative 2, Choice 1 (Alt. 2a)
PLT, only n/a n/a 4 times/ year/ line (quarterly)
Alternative 2, Choice 2 (Alt. 2b)
AMAP, only n/a n/a 4 times/ year/ line (quarterly)
Alternative 3 (Alt. 3); non-deli or non-hotdogs
Sanitation, only (neither
PLT nor AMAP)
n/a n/a 1 time/ month/ line (monthly)
Alternative 3 (Alt. 3); deli or hotdogs
Sanitation, only (neither
PLT nor AMAP)
Very small 1 – 6,000 1 time/ month/ line (monthly)
Small6,001 – 50,000
2 times/ month/ line (every 2 weeks)
Large50,001 -
>600,0004 times/ month/ line (weekly)
Salmonella would be a target pathogen for weekly sampling for any facility that produces RTE foods that are exposed to the processing facility environment and have previously been linked to either salmonellosis cases or outbreaks, or contamination events that could be linked to sources in the processing facilities. Facilities that would typically be required to execute stringent Salmonella sampling plans involving weekly sampling include, but are not limited to, those that produce chocolate, dry cereals, dairy powders, and many other low-moisture RTE food products.
Similar to sampling frequency, there are very few, if any, recommendations for the number of samples to be taken as part of PEM programs, other than that sample number determinations should be “risk-based.” One of the few documents that provides guidance on sampling frequency is a United States Department of Agriculture Food Safety and Inspection Service (USDA FSIS) Listeria guidance document that suggests collection of 3 to 5 food contact surface (Zone 1) samples per production line per sampling.8 This could range from weekly to every 6 months for extremely low-risk facilities (Table 3), but only covers Zone 1 (food contact surfaces).

Environmental Monitoring Handbook - Pathogens
51
For a routine verification program, which is described here, it is essential that a clear written plan and outline exists for corrective actions. These plans should include details on:
• Minimum number of vector swabs to be collected after an initial positive, including a protocol to determine the specific vector swabbing procedures.
• Deep cleaning procedures to be used in follow-up to a positive test result.
• Root-cause analyses procedures to be used, including details on the team that will conduct these analyses.
• Procedures to be used to translate findings into a corrective and preventive action (CAPA) plan, including requirements for CAPA close-out.
Vector swab sites should be selected to represent areas and sites that could be the source of the initial positive findings. This could mean nearby potential harborage sites, such as floor-wall junctures, drains, overhead drip pans, or traffic path sites that intersect with the initial positive site to which the organism could have spread.
If the routine (“verification”) environmental sampling is used to verify a validated food safety program, prerequisite program or non-process preventive control (e.g., a set of SSOPs, sanitation procedures), the written plan should also include details on the procedures to be used for revalidation of the affected non-process preventive controls.
4.4. Corrective actions based on pathogen testing results
Air testing for pathogens A frequent question is whether air should be tested for pathogens. Unlike for mold spores, there is no evidence that vegetative bacterial pathogens are transmitted by air in food processing facilities. However, aerosols (extremely fine and small water suspended in air) can be a very effective vehicle for transmission of pathogens in processing facilities. Confusion about the role of air versus aerosols may explain why questions about air sampling for pathogens are brought up frequently.
Rather than air testing to identify the role of aerosols in pathogen transmission in a processing facility, testing the sources and deposition areas of aerosols would be a more appropriate strategy to address this concern. In addition, minimizing aerosolization (for example by removing high-pressure hoses in processing facilities and minimizing water use during processing) is essential to reduce pathogen transmission in processing facilities.
Another air-associated potential source of pathogens maybe high-pressure air; the air hoses may be a niche for pathogens. Hence, testing high-pressure air may be advised in facilities, particularly if high-pressure air is used to clean food contact surfaces.

Environmental Monitoring Handbook - Pathogens
52
A key part of a PEM program is to identify harborage sites where actual pathogens survive and grow, often because they are protected from sanitizers. The food safety goal is to identify and eliminate growth niches (i.e., areas that support general bacterial growth) as well as potential harborage sites during the validation of sanitation procedures and before they become contaminated. Routine verification PEM programs confirm the effectiveness of sanitation procedures and other preventive controls that have been implemented.
The initial objective of the PEM program is to identify and eliminate harborage within the exposed product area. However, it is possible that niches may be missed during the validation process (and subsequent seek and destroy missions), as they may sometimes only be identified by ongoing verification sampling. An example would include a niche that was not present at the time of validation sampling but developed over time. In addition, areas that do not initially represent potential niches and harborage sites may become actual niches and harborage sites because equipment and equipment parts, such as gaskets, wear out.
Well-designed and implemented verification PEM programs can and should detect these sorts of issues. However, detection of actual pathogen sources can sometimes be hindered if follow-up activities to an initial positive (e.g., vector swabbing, deep cleaning) are not executed correctly.
For example, excessive sanitizer use (including floor sanitation) performed immediately prior to vector swabbing may yield negative results, when in reality it simply led to a situation where persistent pathogens, index organisms or harborage sites were covered up rather than truly eliminated. This approach could also lead to situations where a pathogen or index organism positive sample may be misinterpreted as a sporadic positive when it actually was an indication of pathogen persistence. Appropriate, well-planned and executed follow-up to each pathogen or index organism positive sample is thus essential for effective PEM programs.
4.5. Identifying sources of pathogens and development of preventive controls

Environmental Monitoring Handbook - Pathogens
53
4.6. Advanced sampling approaches to control environmentally transmitted foodborne pathogens
As detailed throughout this chapter, basic environmental pathogen monitoring programs generate data needed to validate and verify environmental pathogen control strategies. This includes “for-cause” investigative sampling after verification samples yield positive results.
Food processing facilities that have robust validation and verification sampling strategies often develop and implement advanced sampling strategies. These sampling methods enable the creation of preventive controls and other strategies that further improve the ability of these facilities to prevent microbial contamination events from environmental sources. For example, some RTE meat processors in the U.S. perform “process control” sampling in addition to verification and validation sampling activities, with validation sampling using the seek and destroy approach to find and eliminate niches and harborage sites (Figure 2).
Process control sampling utilizes “indicator sites” (not to be confused with indicator organisms) for sampling, which are early warning sites where pathogen detection does not yet indicate an acute food safety issue. These include areas of the facility and equipment with sanitary design concerns as well as Zone 4 to Zone 3 transfer pathways where presence or ingression of a target pathogen can be identified before it reaches a verification sampling site. Indicator sites are typically located near hurdles and barriers to measure the effectiveness of the obstacle, or at or near
a growth niche to measure the level of control exerted by the sanitation process control system. In addition to pathogen detection, indicator site sampling can also use TPC, ATP and other analysis methods.
Investigative sampling following pathogen detection in an indicator site would be considered “not-for-cause,” as this is conducted as part of a sanitation process control program but is not necessarily a component of a regulatory compliance program. Employing process control sampling that utilizes indicator sites provides facilities not only with an “early warning system,” but can also encourage stringent testing strategies, as positive results at an indicator site would not necessarily indicate a systematic failure of a food safety system that requires “for-cause” investigative sampling.

Environmental Monitoring Handbook - Pathogens
54
Seek and Destroy Process
Observe Flood Sanitation
Observe Assembly
Normal Cleaning and Sanitation Process
Observe Post-Assembly Sanitizer Application
Observe Normal Setup and Startup Activities
Stop Operation Before Product is Placed on the Line
Disassemble to Normal Daily Level
Disassemble Any RemainingMachine Components
Clean and Flood or Heat- sanitize All Disassembled
Line Components
If APC Growthis Supported, Then Suspicious Area is a
Growth Niche
If Positive for Listeria, the Suspicious Area is a Harborage Site
Inspect and Swab AnySuspect Areas
Are CleaningMethods
Acceptable?
Is Level ofDisassemblyAcceptable?
Evidence ofUnacceptable
Organic Buildup?
Are All Components Being Adequately Sanitized(Chenical or Heat)?
Are GMPs BeingFollowed?
Root-cause
Figure 2. Example of the seek and destroy process.2
Connect with a 3M Food Safety expert
www.3M.com/Connect/PathogenTesting
Learn more about pathogen testing
www.3M.com/PathogenTesting

Environmental Monitoring Handbook - Pathogens
55
References:
1. United States Food and Drug Administration. 2015. Current Good Manufacturing Practice, Hazard Analysis, and Risk-Based Preventive Controls for Human Food; Final Rule. Verification of implementation and effectiveness. § 117.165. https://www.fda.gov/Food/GuidanceRegulation/FSMA/ucm334115.htm
2. Malley, T.J., Butts, J., Wiedmann, M. 2015. Seek and destroy process: Listeria monocytogenes process controls in the ready-to-eat meat and poultry industry. J. Food Prot. 78 (2): 436-445. http://dx.doi.org/10.4315/0362-028X.JFP-13-507
3. Dairy Food Safety Victoria. 2016. Dairy Pathogen Manual. http://www.dairysafe.vic.gov.au/publications-media/regulations-and-resources/guidelines
4. Grocery Manufacturer’s Association. 2014. Listeria monocytogenes Guidance on Environmental Monitoring and Corrective Actions in At-Risk Foods. https://www.gmaonline.org/forms/store/ProductFormPublic/LEMP
5. United States Food and Drug Administration. 2017. Control of Listeria monocytogenes in Ready-To-Eat Foods: Guidance for Industry; Draft Guidance. https://www.fda.gov/RegulatoryInformation/Guidances/ucm073110.htm
6. Innovation Center for U.S. Dairy. 2015. Control of Listeria monocytogenes: Guidance for the U.S. Dairy Industry. http://www.idfa.org/docs/default-source/resource-library/guidance-for-the-us-dairy-industry-10-19-15.pdf
7. United Fresh Produce Association. 2013. Guidance on Environmental Monitoring and Control of Listeria for the Fresh Produce Industry. http://www2.unitedfresh.org/forms/store/ProductFormPublic/guidance-on-environmental-monitoring-and-control-of-listeria-for-the-fresh-produce-industry
8. United States Department of Agriculture Food Safety and Inspection Service. 2014. FSIS Compliance Guideline: Controlling Listeria monocytogenes in Post-lethality Exposed Ready-To-Eat Meat and Poultry Products. https://www.fsis.usda.gov/wps/wcm/connect/d3373299-50e6-47d6-a577-e74a1e549fde/Controlling-Lm-RTE-Guideline.pdf?MOD=AJPERES
9. Orsi, R., Wiedmann, M. 2016. Characteristics and distribution of Listeria spp., including Listeria species newly described since 2009. Appl. Microbiol. Biotechnol. 100: 5273-5287. https://doi.org/10.1007/s00253-016-7552-2
10. 3M Food Safety. 2018. 3M™ Molecular Detection Assay 2 – Listeria Performance Summary.
11. United States Centers for Disease Control. 2008. Multistate Outbreak of Salmonella Agona Infections Linked to Rice and Wheat Puff Cereal (FINAL UPDATE). https://www.cdc.gov/salmonella/2008/rice-wheat-puff-cereal-5-13-2008.html
Environmental Monitoring Handbook - Pathogens
56
12. Joseph, S., Cetinkaya, E., Drahovska, H., Arturo Levican, A., Figueras, M.J., Forsythe, S.J. 2012. Cronobacter condimenti sp. nov., isolated from spiced meat, and Cronobacter universalis sp. nov., a species designation for Cronobacter sp. genomospecies 1, recovered from a leg infection, water and food ingredients. Int. J. Syst. Evol. Microbiol. 62: 1277–1283. http://dx.doi.org/10.1099/ijs.0.032292-0
13. Jackson, E.E., Masood, N., Ibrahim, K., Urvoy, N., Hariri, S., Forsythe, S.J. 2015. Description of Siccibacter colletis sp. nov., a novel species isolated from plant material, and emended description of Siccibacter turicensis. Int. J. Syst. Evol. Microbiol. 65: 1335–1341. https://dx.doi.org/10.1099/ijs.0.000108
14. Forsythe, S.J. 2018. Updates on the Cronobacter Genus. Annu. Rev. Food Sci. Technol. 9:23–44. http://dx.doi.org/10.1146/annurev-food-030117-012246
15. Norberg, S., Stanton, C., Ross, R.P., Hill, C., Fitzgerald, G.F., Cotter, P.D. 2012. Cronobacter spp. in Powdered Infant Formula. J. Food Prot. 75: 607–620. https://doi.org/10.4315/0362-028X.JFP-11-285
16. Craven, H.M., McAuley, C.M., Duffy, L.L., Fegan, N. 2010. Distribution, prevalence and persistence of Cronobacter (Enterobacter sakazakii) in the nonprocessing and processing environments of five milk powder factories. J. Appl. Microbiol. 109:1044–52. https://doi.org/10.1111/j.1365-2672.2010.04733.x
17. Osaili T., Forsythe S. 2009. Desiccation resistance and persistence of Cronobacter species in infant formula. Int. J. Food Microbiol. 136:214–20. https://doi.org/10.1016/j.ijfoodmicro.2009.08.006
18. 3M Food Safety. 2017. Evaluation of the 3M™ Molecular Detection Assay 2 – Cronobacter and Three Commercial Methods for the Detection of Cronobacter spp.
19. Simmons, C.K., Wiedmann, M. 2018. Identification and classification of sampling sites for pathogen environmental monitoring programs for Listeria monocytogenes: Results from an expert elicitation. Food Microbiol. 75: 2-17. https://doi.org/10.1016/j.fm.2017.07.005

Environmental Monitoring Handbook - Spoilage Organisms
57
Environmental Monitoring for Spoilage Organisms
CHAPTER 5
By Randy Worobo | Cornell University Department of Food ScienceAbigail Snyder | The Ohio State University Department of Extension Cari Lingle | 3M Food Safety
Purpose of environmental monitoring for spoilage organisms
58
58
61
65
67
67
68
68
59
62
64
59
59
5.1.
5.2.
5.3.
5.4.
5.5.
5.6.
5.2.1.
5.3.1.
5.3.2.
5.3.3.
5.3.4.
5.2.2.
5.2.3.
Spoilage organisms and their significance in the food processing environment
Development of a spoilage organism sampling program
Corrective actions based on spoilage organism results
Identifying sources of spoilage organisms
Additional aspects to consider
Yeast and molds
Selection of sampling sites
Sampling frequency and number of samples
Data trending and analysis for spoilage organisms
Determination of cut-off levels for spoilage organisms
Total Plate Count
Lactic acid bacteria

Environmental Monitoring Handbook - Spoilage Organisms
58
Environmental monitoring allows companies to take a proactive approach to microbial spoilage, rather than retrospectively addressing failures as they arise. This is particularly useful in quality management systems, as spoilage incidents often arise sporadically and, without consistent baseline measurements, underlying or chronic issues can go unnoticed.
Environmental monitoring is often used as a verification activity for sanitation regimes since the processing environment is one of the main contributors to microbial quality failures that manufacturers seek to control. Poor environmental sanitation increases the risk of an unintended microbial spoilage incident.
Food processing environments are non-sterile, and the microorganisms which colonize these environments are often well-adapted to using the manufactured food product as a substrate for growth. This adaption increases the risk of spoilage if cross contamination occurs.
Moreover, facility-specific spoilage microbes are often adapted to withstand facility-specific production controls. Heat-tolerant bacteria and fungi are more frequently isolated from products and facilities with thermal processes. Preservative-resistant yeast are more frequently isolated from facilities employing those preservatives. Long-term use of sanitizers that are not broad-spectrum, or poor cleaning practices can also result in higher levels of environmental spoilage organisms. The power of selective pressure can lead to environmental harborage of troublesome spoilage microbes.
Microbial spoilage can result in decreased shelf-life, inferior organoleptic properties, and in some instances, product recalls and withdrawals. These outcomes have significant economic and consumer perception consequences.
Particular production methods or product types are associated with certain spoilage organisms. Facilities should consider which spoilage organisms are most pertinent based on these parameters to determine if the use of a targeted environmental monitoring strategy, one which focuses on a specific type or class of organisms, or a more generalized environmental monitoring strategy, one which relies on relevant indicators, is most appropriate. For example, hot-fill facilities would likely address heat-resistant molds as part of their environmental monitoring program.
The resilience of spoilage organisms to the inactivation process employed, the tolerance of the spoilage organism to the formulation conditions and the affinity of the spoilage organism for the raw ingredients should be evaluated in identification of specific spoilage organisms. Relevant spoilage organisms are often grouped by a combination of taxonomy, function and detection methods. Commonly used groups include yeast and molds, Total Plate Count and lactic acid bacteria.
5.1. Purpose of environmental monitoring for spoilage organisms
5.2. Spoilage organisms and their significance in the food processing environment

Environmental Monitoring Handbook - Spoilage Organisms
59
Yeast and molds are fungi, eukaryotic spoilage organisms that are highly resistant to many processing and formulation controls.1 Yeast and molds reportedly persist and propagate even under extremely harsh environmental conditions.
Yeast, single-celled eukaryotes that appear similar to bacteria on a Petri dish or under the microscope, are resilient to low pH and are particularly associated with the spoilage of high-water activity and/or high-sugar foods such as pasteurized juices, syrups, fresh-cut fruit and yogurt. Yeast transmission often occurs through food, beverage or processing/cleaning water
vectors, or due to insufficient sanitation practices. Filamentous fungi (molds) are resilient to low pH, water activity, and some are extremely heat-resistant. They are particularly associated with shelf-stable or extended shelf-life (ESL) products, those foods which have been processed and formulated in a way to control other, faster growing spoilage organisms. Mold transmission frequently occurs through air due to the high aerosolization potential of spores, in addition to the other mechanisms relevant to all spoilage organisms.
Total Plate Count (TPC), or more accurately, total aerobic plate count, refers to all culturable microorganisms recovered on rich, complex media under aerobic conditions.1 TPC may be used as an indicator of general sanitation and to evaluate the total microbial load in the processing environment.
Detection using this method may be specifically relevant to highly perishable products subject to spoilage from a diverse array of commensal organisms, rather than
products which support the growth of only a select few spoilage organisms. TPC results are usually dominated by bacterial growth, which out-competes slower growing fungi.
Processing environment designs that are sensitive to environmental contamination may also be usefully evaluated using TPC. These systems could include filler areas, cooling water reservoirs and hard-to-clean niches in production lines.
Lactic acid bacteria represent a diverse, functional collection of bacteria that cause spoilage of fresh meat and meat products, ready-to-eat (RTE) products like fresh-cut fruit and modified atmosphere packed (MAP) lunch meats, beer and wine.1 Spoilage is characterized by off-flavor metabolites produced during
microbial growth – notably, lactic acid. Homofermentative lactic acid bacteria exclusively produce lactic acid as a byproduct of their metabolic activity, whereas heterofermentative lactic acid bacteria variably synthesize lactic acid, acetic acid, carbon dioxide and other organoleptic metabolites.
5.2.1. Yeast and molds
5.2.2. Total Plate Count
5.2.3. Lactic acid bacteria

Environmental Monitoring Handbook - Spoilage Organisms
60
Lactic acid bacteria are a significant challenge for the meat industry. Meat is a high-value, highly perishable product that is commonly associated with lactic acid bacteria spoilage. Subsequently, it is one of the best studied product/spoilage relationships and the quality defects are well-characterized. Spoilage due to lactic acid bacteria outgrowth can be recognized by off-flavors and aromas, slime (dextran)
formation and package bloating due to carbon dioxide production among heterofermentative strains. Lactic acid bacteria are ubiquitous; contamination comes from the environment and can be mitigated through strong environmental and utensil sanitation practices, along with control of the storage conditions during shelf-life.
Consumers report package bloating due to microbial spoilage initiated an investigation.
FDA becomes involved and, initially, proposes a Class I Recall.*
Initial assessment of theTotal Plate Count and yeast and mold countis inconclusive about the cause of the spoilage.
Additional testing reveals the spoilage organism to be lactic acid bacteria, the same microbes detected in the processing environment. Consequently, the spoilage issue is treated as a Class II Recall.*
As a part of long term corrective actions,the facility improves their environmentalsanitation regime and changes the container closure to facilitatedecontamination during processing.
Figure 1. Chronology of spoilage-induced recall for a hypothetical U.S. food manufacturer
*Class I Recall: Dangerous or defective products that predictably could cause serious health problems or death. Class II Recall: Products that might cause a temporary health problem, or pose only a slight threat of a serious nature.2

Environmental Monitoring Handbook - Spoilage Organisms
61
A prescriptive environmental monitoring program can target problem areas to reduce spoilage in the short term, and allows for tracking and trending to control quality threats in the long term. This aids in root-cause analysis and can help distinguish between failures in policy versus failures in the execution of policies. Sampling plans should be structured around several factors:
• Identification of an appropriate microbial target.
• Selection of sampling sites.• Determination of the frequency of
sampling.• Establishment of actionable cut-off
levels and associated corrections.
Sampling programs should be feasible for the facility, and decisions around these parameters may necessarily involve several members of the food quality team.
Facilities should also consider the method of detection most appropriate for their spoilage organism of concern. Facilities targeting molds which produce spores that are readily aerosolized may consider the use of air sampling methods to monitor spore load.
Microbial air quality can be evaluated through quantitative air sampling or using the settle plate method. Location and time of sampling should both be considered in development of a monitoring plan. Areas of high-air circulation, high-sensitivity (i.e., exposed product), or high-microbial prevalence (e.g., depalletizing area) are relevant air sampling locations.
Environmental monitoring of surfaces can be accomplished by direct plating and indirect plating through the use of sponges.
Direct contact plating is a rapid, easy-to-apply method for detecting low levels of microbes from non-food contact surfaces. However, if sampling of larger surface areas is required, common indirect contact methods utilizing swabs or sponges can be used.
Indirect plating also allows for additional sample processing. For example, for selection of heat-resistant spoilage organisms, a heat shock can be applied to the sample before plating to reduce background microbiota. Additionally, this method allows for plating on multiple media if several microbial targets are of interest.
Figure 2: Example of air sampling using 3MTM PetrifilmTM Plates
5.3. Development of a spoilage organism sampling program

Environmental Monitoring Handbook - Spoilage Organisms
62
Joints in conveyor belt links and underneath belt
Inside roller and gaps
Leg harborage areas
Figure 3. Example of multiple sampling sites from one piece of equipment
Site selection should be based on the goals and targets of the environmental sampling plan. Environmental monitoring plans targeting spoilage organisms can serve as a verification of sanitation procedures or a “seek and destroy” technique for targeting specific spoilage organisms in the environment. Both goals can be addressed through the same plan, but the primary goal may influence aspects of the procedure.
A master list of sampling sites should be developed, and from that collection of sites, a subset should be tested on each
monitoring day. If particular sites are notoriously problematic or indicative of sanitation efficacy, the facility may choose to incorporate those more frequently into the rotation among a randomized subset. It is advisable to periodically re-evaluate the master list, and invite alternative opinions of relevant sampling sites to add to the list. Moreover, employees should be trained on where, specifically, to sample sites based on the description in the sampling plan. Figure 3 illustrates how multiple, highly relevant sites can be identified on the same piece of equipment.
5.3.1. Selection of sampling sites

Environmental Monitoring Handbook - Spoilage Organisms
63
Verification of sanitation is supported through the selection of a diverse array of changing sites, along with targeted checks of difficult-to-clean sites. Seek and destroy approaches to eliminate specific spoilage organisms from the environment should be informed by the transmission mechanism and probable sources associated with the organism, as described earlier.
Generally speaking, swabbing larger areas, compared to the investigation of small niches often sampled in Listeria-targeting programs, has been shown to improve environmental monitoring programs to prevent spoilage. Environmental swabs may serve a dual purpose since spoilage organisms and pathogens, or their indicators, can be detected from a single sample. However, in some instances, sampling site selection may vary between pathogen and spoilage environmental monitoring programs based on the zones which are selected.
For control of spoilage organisms, facilities may choose to direct sampling activity to surfaces increasingly distant from food production as they contribute to cross-contamination. Zone 2 surfaces such as overhead pipes directly above food contact surfaces, Zone 3 surfaces such as fan blades and cooling water reservoirs, and Zone 4 surfaces such as air intake vents all represent areas prone to harboring problematic spoilage organisms, depending on the facility.
Moreover, Zone 1 surfaces are easily included in an environmental monitoring program which targets spoilage organisms, and the findings may inform sanitation interventions which pertain to safety as well. Table 1 contains a list of common problematic areas in processing facilities that arise in all four zones.
Table 1. Example sample sites often associated with spoilage organism harborage
Site Quality threat Zone
Dead leg Lack of turbulent flow leads to accumulation and growth of spoilage bacteria and yeast.
1
Conveyor
Complex equipment that may directly contact product and may also include hollow rollers, rough welds and microcracks. Moreover, employee overspray during sanitation can contaminate this equipment and contribute to cross contamination.
1+
Cooling water reservoirs Biofilm development contributes to post processing contamination of hot-filled or retorted product.
2
Fan bladesAccumulation of fungal spores and dust particulate leads to circulation through air streams in the production environment.
3
Air vent
Cooler seals/gaskets Harborage site, particularly associated with machinery mold, that is difficult to clean without dedicated attention in the master sanitation schedule.
3

Environmental Monitoring Handbook - Spoilage Organisms
64
The number of samples taken on each monitoring day should be based on the size and complexity of the facility, in addition to the practicality of implementing the program. The frequency of sampling should be evaluated in accordance with the relative risk of a quality failure, should pre-established cut-off levels be exceeded.
Facilities in which environmental monitoring results frequently reveal poor sanitation or emerging microbial harborage sites should increase the frequency of sampling. This same risk evaluation should be used in determining how frequently results should be evaluated by a food safety and quality team. Sampling frequency may
alternatively be established in relationship to the timing of a sanitation event or high-risk processing activity that may require additional monitoring to prevent quality deviations.
Depending on the facility, sampling may need to be adjusted seasonally or as a result of intermittent events. For example, the concentration of airborne fungal spores increases during the spring and manufacturers sensitive to mold spoilage at the fill step may adjust accordingly. Alternatively, co-packers and facilities handling multiple SKUs on shared processing lines may consider their sampling schedule as a part of a mitigation
5.3.2. Sampling frequency and number of samples
Underside of overhead pipe
Dispense head
Dead leg
Conveyor
Figure 4: Example of spoilage organism sample sites in Zones 1 and 2
In the graphic below, a baked product exits an oven on a conveyor while a topping is added from a dispenser. Above the line is an overhead pipe on which condensation forms during production. The arrows in the figure indicate potential sampling sites for spoilage organisms in this area of production.

Environmental Monitoring Handbook - Spoilage Organisms
65
strategy to prevent the introduction of problematic spoilage organisms, or their growth substrates, into sensitive products.
Generally speaking, one swab per 1,000 square feet (roughly 100 square meters) of processing space may be used as a baseline for quality management, although
more may be increasingly informative. In most cases, sampling frequency should occur at least monthly. Both frequency and the number of sites increase as size of the facility, pace of production, age of the facility and equipment, and quality threat risk aversion increase.
Different visualization methods allow the food quality team to address different questions. It often proves useful to present environmental monitoring data from an extended period of time in the form of a graph, so that trends and patterns become apparent compared to visualization in a spreadsheet or as a collection of sampling reports. Sorting data based on date,
location or type of sampling site can address various issues that can arise in a production facility. Manufacturers should take the time to analyze their results in order to gain the full benefit of instituting an environmental monitoring program for spoilage organisms. Figures 5a-c illustrate how a company may choose to analyze their environmental monitoring data.
5.3.3. Data trending and analysis for spoilage organisms
Figure 5a. Example of environmental monitoring data visualization: Total Plate Count
Total Plate Count1600
1400
1200
1000
800
600
400
200
0
Tota
l Pla
te C
ount
CFU
/g
JANFEB
MAR
APRM
AYJUN
JULAUG
SEPOCT
NOVDEC
Yeast and Mold Counts from Air1200
1000
800
600
400
200
0Yea
st a
nd M
old
Cou
nts
CFU
/60
cm2
Lactic acid bacteria counts CFU/cm2
LINE 1 LINE 2 LINE 3 LINE 4
Lactic Acid Bacteria Counts from Equipment/Environment
Drain
Funnel
Seal
Belt
Filler Nozzle
0 50 100 150 200 250 300 350 400
This chart is an illustration of Total Plate Count results in one location over the course of a year. During the warmer summer months (June, July, August), counts increase due to the season. A sharp, significant increase can be seen in late November that is unusual for the season. A root-cause investigation would need to be conducted to understand the cause for these irregular results.

Environmental Monitoring Handbook - Spoilage Organisms
66
Figure 5b. Example of environmental monitoring data visualization: Yeast and mold
Total Plate Count1600
1400
1200
1000
800
600
400
200
0
Tota
l Pla
te C
ount
CFU
/g
JANFEB
MAR
APRM
AYJUN
JULAUG
SEPOCT
NOVDEC
Yeast and Mold Counts from Air1200
1000
800
600
400
200
0Yea
st a
nd M
old
Cou
nts
CFU
/60
cm2
Lactic acid bacteria counts CFU/cm2
LINE 1 LINE 2 LINE 3 LINE 4
Lactic Acid Bacteria Counts from Equipment/Environment
Drain
Funnel
Seal
Belt
Filler Nozzle
0 50 100 150 200 250 300 350 400
Yeast and mold counts from air samples from multiple locations in a facility can be monitored by comparing counts side-by-side using a bar graph. In this example, the counts on Line 2 are higher than the other locations, thus making the food produced on this line at a higher risk for yeast and mold contamination. Steps can be taken to mitigate the risk by determining the source of the yeast and mold, putting equipment in place to shield the product from contamination or implementing a process to eliminate the yeast and mold after this point in the production.
Figure 5c. Example of environmental monitoring data visualization: Lactic acid bacteria
Total Plate Count1600
1400
1200
1000
800
600
400
200
0
Tota
l Pla
te C
ount
CFU
/g
JANFEB
MAR
APRM
AYJUN
JULAUG
SEPOCT
NOVDEC
Yeast and Mold Counts from Air1200
1000
800
600
400
200
0Yea
st a
nd M
old
Cou
nts
CFU
/60
cm2
Lactic acid bacteria counts CFU/cm2
LINE 1 LINE 2 LINE 3 LINE 4
Lactic Acid Bacteria Counts from Equipment/Environment
Drain
Funnel
Seal
Belt
Filler Nozzle
0 50 100 150 200 250 300 350 400
In this chart, lactic acid bacteria counts have been monitored at various locations. If a finished product is contaminated, this information may be useful to start the investigation to determine the root-cause of the failure. In this example, the lactic acid bacteria counts on a seal are higher than expected and the seal should be checked for cracks or improper cleaning.

Environmental Monitoring Handbook - Spoilage Organisms
67
When cut-off levels are exceeded, short-term corrections and long-term corrective actions must be initiated. Immediate corrections universally include a sanitation step, one which either targets a particular location or is a general deep cleaning.
A procedure detailing the steps and focus of the cleaning practices initiated after exceeding the established environmental monitoring cut-offs should be documented, and employees responsible for interpretation of the environmental monitoring results and initiation of corrections should be trained for these responsibilities. Many facilities
opt to include a re-sampling step in their corrections following this sanitation procedure to verify the contaminant was removed or reduced to an acceptable level. It is advisable to include this site, additionally, in the next monitoring cycle to determine if the source or cause of the contamination was removed or if, instead, the same location becomes re-contaminated.
Long-term solutions and root-cause analysis should be based on data from several observation cycles, and may include retraining employees, evaluating cleaners and sanitizers, modifying
5.4. Corrective actions based on spoilage organism results
Cut-offs are the quantitative standards which delimit acceptable results for the environmental monitoring program, and are best established through in-plant experience. In order to make an informed decision about appropriate levels, a facility should track the results of their environmental monitoring program for 10-20 rounds of monitoring. This data creates a baseline from which normal variation can be observed, and cut-offs can be extrapolated.
The baseline method is particularly suited for establishing cut-offs for indicator organisms and quantitative microbial evaluations. In contrast, environmental monitoring programs that target specific spoilage organisms with the goal of their total exclusion from the processing environment (e.g., heat-resistant molds) may choose to identify the presence of any detectable target sufficient to initiate a correction.
A facility may choose to stratify their cut-offs, and corrections, based on the type of surface from which the sample was taken. For example, a baseline appropriate TPC for a drain likely differs from that of a food contact surface. The initiation of a corrective response should be appropriate for the findings.
Environmental monitoring programs often become burdensome for companies when ineffective cut-offs or overzealous corrective actions are mandated. Since environmental monitoring programs are largely preventive instead of reactionary, sustained trends in microbial detection may also warrant an investigation. Again, slight variations in counts are expected and guide baseline calculations, but facilities may choose to adopt a policy wherein an upward trend of 5-10 consecutive sampling events may trigger a correction prior to reaching cut-off levels.
5.3.4. Determination of cut-off levels for spoilage organisms

Environmental Monitoring Handbook - Spoilage Organisms
68
Identifying areas in the processing facility contaminated with spoilage organisms is a useful quality management strategy. However, spoilage organisms may be continuously reintroduced into the system if the point source is not eliminated. Continually detecting problematic levels of spoilage organisms from the same site may indicate additional underlying issues that are not being addressed through routine or specialized sanitation of this site.
Facilities should consider their risk levels for introduction of spoilage organisms from various sources. Common sources include poor-quality raw ingredients, which can continuously reintroduce microbes into the
environment during every production run. Equipment selection and design may also work against the environmental monitoring system if it allows for cross contamination, or even if it fails to actively exclude contaminants. Isolation of activities, age of equipment and the building, and the degree to which processes are enclosed are all factors that impact the environmental microbiota and the probability of contamination. Consider long-term findings from the environmental monitoring program for spoilage organisms in the development of preventive maintenance and approved supplier programs.
Environmental monitoring for spoilage organisms is diagnostic, and should not be considered a standalone system for control. Microbial analysis of cooling water, ingredients and pressurized air may all be important supporting analyses to an environmental monitoring program. Rigorous good manufacturing
practices (GMPs) also serve to control spoilage microbiota. However, only GMP violations which directly contribute to changes in surface or air contamination may be detected by the environmental monitoring program and other avenues of contamination should be considered.
5.5. Identifying sources of spoilage organisms
5.6. Additional aspects to consider
cleaning and sanitizing procedures or sanitation schedules and considering pertinent changes in production. These corrective actions may be dependent on the risk aversion of the company and the probability that a spoilage issue will result subsequent to the environmental monitoring observations.
Both the probability and severity of potential product spoilage should be used to determine if finished product needs to be reprocessed or destroyed.
This should be recorded in a policy with the environmental monitoring program before any breach of established cut-off levels occurs. Some facilities also elect to increase the number or frequency of their sampling following a violation of their cut-off levels. This, theoretically, could direct targeted sanitation towards the contamination source through vector swabbing from ATP tests, but it also increases the level of control a facility has over maintaining an acceptable sanitary level in their production environment.

Environmental Monitoring Handbook - Spoilage Organisms
69
A concerted effort across a broad-based team is the best strategy to minimize the risk of a spoilage incident. Additionally, the data from this program may be broadly beneficial as the food safety and quality team evaluates various systems. An increase in spoilage potential may signal systemic problems that preempt future potential food safety failures as well. Environmental monitoring systems which detect spoilage organisms support proactive responses, but companies need to be prepared and have personnel with sufficient time to evaluate the results from
these programs in order to leverage the findings.
Employees should also consider the impact of GMPs on spoilage microbiota present in the facility. Re-evaluation of the environmental monitoring program itself should be conducted every 1-3 years. Changes to the processing system or formulation may not only change the level of spoilage risk, but could also impact the type of spoilage organisms relevant for a given manufacturer.
Connect with a 3M Food Safety expert
www.3M.com/Connect/SpoilageDetection
Learn more about spoilage organism testing
www.3M.com/SpoilageDetection
Environmental Monitoring Handbook - Spoilage Organisms
70
References:
1. Downes, F. P., Ito, K., and American Public Health Association. 2001. Compendium of methods for the microbiological examination of foods (4th ed.). Washington, DC: American Public Health Association.
2. United States Food and Drug Administration. 2010. FDA 101: Product Recalls.https://www.fda.gov/ForConsumers/ConsumerUpdates/ucm049070.htm

Environmental Monitoring Handbook - Allergens
71
Environmental Monitoring for Allergens
CHAPTER 6
ByThomas Grace | Bia DiagnosticsKen Davenport | 3M Food SafetyGabriela Lopez Velasco | 3M Food Safety
Purpose of environmental monitoring for allergens 72
73
76
77
80
81
74
78
78
79
76
6.1.
6.2.
6.3.
6.4.
6.5.
6.6.
6.7.
6.8.
6.4.1.
6.4.2.
6.4.3.
Allergens and their significance in the food processing environment
Specific vs. non-specific allergen testing
Development of an allergen sampling program
Corrective actions based on allergen testing results
Identifying sources of allergen contamination
Additional aspects to consider
Summary
Selection of sampling sites
Sampling frequency and number of samples
Determination of cut-off levels for allergens

Environmental Monitoring Handbook - Allergens
72
Food allergens have increasingly become major concerns for food and beverage manufacturers. In 2004, it was estimated that approximately 2 percent of adults and about 5 percent of infants and young children in the United States suffer from food allergies each year (Figure 1).1 Additionally, about 30,000 individuals require emergency room treatment and 150 individuals die each year due to allergic reactions to food.1
The number of people diagnosed with food allergies has increased significantly over the last several years as well as the number of hospital visits. This has a direct impact on public health expenditures and lost productivity.2,3 At the same time, allergens that are not declared on food and beverage labels have consistently been
among the leading causes of food recalls in the U.S., which significantly impacts food manufacturers.4
While having dedicated facilities for allergen-containing and allergen-free manufacturing would be ideal, the reality is that food not intended to contain particular allergens may be manufactured in the same facility and, often, on the same equipment as allergen-containing foods. Consequently, a robust environmental monitoring program should include considerations for allergen detection on manufacturing equipment after cleaning and before production of the next commodity. Also, the presence of allergens should be assessed in the environment to prevent cross-contact of food with allergens.5
6.1. Purpose of environmental monitoring for allergens
Figure 1. Percentage of U.S. children with food allergies over time
0%
1%
2%
3%
4%
5%
6%
2000-2002 2003-2005 2006-2008 2009-2011

Environmental Monitoring Handbook - Allergens
73
The types of foods that can cause allergic reactions are wide and varied. However, the most common sources can be grouped into a few categories. These categories are not consistent across regulatory agencies, which adds complexity to the classification (Table 1).
In some cases, the specificity of the definitions of a category can determine the number of foods included in the list. For
example, “seafood” is an all-encompassing category for Canada. However, it is subdivided in the U.S. as “fish” and “shellfish;” the latter of which is again further divided in the European Union (EU) as “crustaceans” and “mollusks.”6 Some countries go so far as to define specific species of fish or fish component. In Japan, fish are recommended to be labeled specifically as “mackerel,” “salmon,” “salmon roe,” etc.7
6.2. Allergens and their significance in thefood processing environment
Table 1. Regulated allergen foods in the United States, Canada, Australia/New Zealand and EU1,6,7
*Not an allergen but regulated in a similar way as adverse reactions can occur in some individuals.
United States “Big 8” Canada (10 Allergens)
Australia/New Zealand(12 Allergens)
EU (14 Allergens)
Milk Milk Milk Milk
Egg Egg Egg Egg
Peanut Peanut Peanut Peanut
Soybeans Soy Soy Soya
Wheat WheatGluten (Including Wheat, Barley, Rye, etc.)
Gluten (Including Wheat, Barley, Rye, etc.)
Tree nut Tree nut Tree nut Tree nut
Fish
Seafood
Seafood (fish) Fish
Crustacean shellfish ShellfishCrustacean
Mollusks
Mustard Mustard Mustard
Sesame Sesame Sesame
Sulphite* Sulphite* Sulphite*
Lupin Lupin
Celery

Environmental Monitoring Handbook - Allergens
74
The Food Safety Modernization Act (FSMA) requires manufacturers in the U.S. or that export to the U.S. to include allergen controls in their food safety plan.8 Similarly, the various schemes commonly employed for compliance with the Global Food Safety Initiative (GFSI) also require allergen controls to be identified and monitored. While not explicitly required in Hazard Analysis and Critical Control Points (HACCP) plans, there is the implicit expectation that allergens should be identified as hazards, and that critical controls should be in place to prevent inadvertent contamination of products with allergens.
In facilities and production lines that manufacture both allergen-containing
foods and foods not intended to contain allergens, it is essential to take appropriate actions to ensure that there is no cross-contact between the foods. In some cases, this can be handled by the scheduling of manufacturing operations to limit the risk. However, this does not eliminate the possible risk of cross contamination alone, even with a robust cleaning program in place.
Because of this, environmental monitoring is required for both the initial validation of the cleaning procedure and the ongoing verification that the cleaning has been executed according to written procedures.
Food manufacturers use a variety of approaches and tests as part of a food safety allergen program (Figure 2).5 Thirty percent of today’s food and beverage manufacturers report the use of multiple allergen tests.5
There are two general approaches to allergen testing that have been traditionally employed for cleaning verification: specific and non-specific allergen tests.
6.3. Specific vs. non-specific allergen testing
Figure 2. Food manufacturers’ allergen testing by method5
42.6%
35.7%
24.3%
Allergen-Specific Tests
Protein-Specific Tests
ATP-Based Tests

Environmental Monitoring Handbook - Allergens
75
Specific allergen tests use a target recognition approach to detect proteins within the allergenic food. These tests can be used to identify and/or quantify the amount of the allergenic food that may be present in a sample. For example, a facility that makes both peanut butter ice cream and vanilla ice cream needs to ensure that the peanut butter ice cream is completely removed from the manufacturing equipment. They could use an antibody-based test such as lateral flow device (LFD) or enzyme-linked immunosorbent assay (ELISA) to detect and/or quantify peanut proteins using antibodies raised against the purified protein.
Additionally, processing can affect the recognition of target proteins by the antibodies in the test. For example, heat treatment of the food (e.g., boiling, baking, roasting, etc.) or even the temperatures used during cleaning (e.g., steam-cleaning) may alter the sensitivity of the test to the allergen residues in the environment. It is important to ensure that the test selected for environmental monitoring is capable of detecting both non-thermally processed as well as thermally processed allergens. Users should take extra caution with foods that go through fermentation (e.g., soy sauce, wheat beer) or enzymatic/chemical digestion (e.g., hydrolyzed proteins used in some infant formula). Food processes where the proteins may be severely fragmented into small peptides may make the allergenic foods undetectable by traditional ELISA or lateral flow tests. For this reason, it is important that the selected method used for cleaning verification is fit for purpose and thus capable of detecting the allergens of concern in the users’ process.
The use of an allergen test based on the application of specific antibodies has an advantage in its high specificity. If an antibody-based test results in a positive outcome with a gluten test, for example,
there is a high-degree of certainty that the surface or rinse water sample is contaminated with gluten. Because of this selectivity, specific allergen tests are required by GFSI for process validation.
If a cleaning process is designed to remove milk from processing equipment prior to manufacturing soy milk, then a milk-specific ELISA or LFD is needed to validate that the process is capable of removing residual milk. This is typically done by testing before and after cleaning to show, specifically, that milk residues are effectively removed. LFDs and ELISAs can help define a HACCP system by surveying the processing equipment and finding the “hot spots.” This can expose which areas (e.g., valves and equipment interfaces) need future monitoring or need to optimize clean-in-place cycles.
After validation is complete, routine testing following cleaning allows users to verify that the validated cleaning procedures are effectively being carried out. For example, results that determine that the allergenic residues are at low or undetectable levels following routine cleaning during a line changeover would serve as a useful verification.
While most companies know the specific allergen they need to monitor, the specificity of the ELISAs and LFDs also represent a drawback when dealing with foods containing multiple allergens. For example, a production line of salad dressing containing egg, milk, gluten and soy scheduled to next produce a vinaigrette lacking all of these allergens would require verification that these allergens have been removed by using egg, milk, gluten and soy-specific tests. It is possible that one can choose a single target allergen that will be representative of all four allergens and can indicate that there is no residue of the previous salad dressing present. In this instance, one might choose the highest
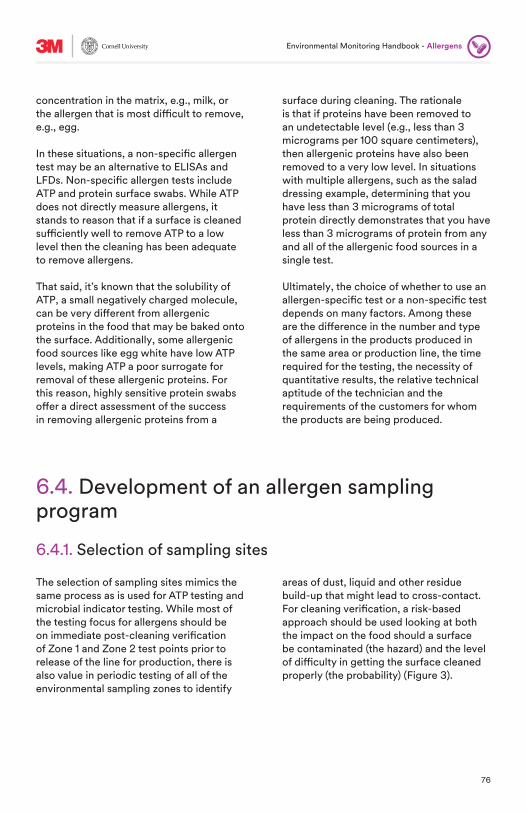
Environmental Monitoring Handbook - Allergens
76
concentration in the matrix, e.g., milk, or the allergen that is most difficult to remove, e.g., egg.
In these situations, a non-specific allergen test may be an alternative to ELISAs and LFDs. Non-specific allergen tests include ATP and protein surface swabs. While ATP does not directly measure allergens, it stands to reason that if a surface is cleaned sufficiently well to remove ATP to a low level then the cleaning has been adequate to remove allergens.
That said, it’s known that the solubility of ATP, a small negatively charged molecule, can be very different from allergenic proteins in the food that may be baked onto the surface. Additionally, some allergenic food sources like egg white have low ATP levels, making ATP a poor surrogate for removal of these allergenic proteins. For this reason, highly sensitive protein swabs offer a direct assessment of the success in removing allergenic proteins from a
surface during cleaning. The rationale is that if proteins have been removed to an undetectable level (e.g., less than 3 micrograms per 100 square centimeters), then allergenic proteins have also been removed to a very low level. In situations with multiple allergens, such as the salad dressing example, determining that you have less than 3 micrograms of total protein directly demonstrates that you have less than 3 micrograms of protein from any and all of the allergenic food sources in a single test.
Ultimately, the choice of whether to use an allergen-specific test or a non-specific test depends on many factors. Among these are the difference in the number and type of allergens in the products produced in the same area or production line, the time required for the testing, the necessity of quantitative results, the relative technical aptitude of the technician and the requirements of the customers for whom the products are being produced.
6.4. Development of an allergen sampling program
6.4.1. Selection of sampling sites
The selection of sampling sites mimics the same process as is used for ATP testing and microbial indicator testing. While most of the testing focus for allergens should be on immediate post-cleaning verification of Zone 1 and Zone 2 test points prior to release of the line for production, there is also value in periodic testing of all of the environmental sampling zones to identify
areas of dust, liquid and other residue build-up that might lead to cross-contact. For cleaning verification, a risk-based approach should be used looking at both the impact on the food should a surface be contaminated (the hazard) and the level of difficulty in getting the surface cleaned properly (the probability) (Figure 3).

Environmental Monitoring Handbook - Allergens
77
6.4.2. Sampling frequency and number of samples
Those areas with direct food contact (Zone 1) and very close indirect contact (Zone 2) that are judged to be difficult to clean should be prioritized for most frequent testing. Those areas that are distant from the food (Zones 3 and 4) or are very easy to clean (smooth, flat surfaces with easy access) should be prioritized lower.
High-risk areas (Red, in Figure 3) should be tested every time the line is cleaned or perhaps at a high frequency such as once per week. Moderate-risk areas (Yellow) could be tested at a lower frequency of once per week to once per month. Low-risk areas (Green) should be tested at a low frequency of, perhaps, once per month or once per quarter. By modifying the testing frequency based on the risk assessment,
food and beverage manufacturers can ensure that they get the most risk-reduction for the resources spent on testing.
The number of samples depends on both the complexity of the manufacturing equipment/line and the practical considerations for testing budget. For a typical testing line, 5 to 10 test points per line should be tested to get enough coverage to substantially reduce the risk of undetected poor cleaning. The exact number, however, is at the discretion of the quality team, and the rationale should be planned and documented in the facility’s food safety plan or HACCP plan.
HA
ZARD
(Pro
xim
ity
to F
ood)
PROBABILITY(Difficulty of Cleaning)
Color = Risk Level
High(generally Zone 1)
Medium(generally Zone 2 and 3)
Low(generally Zone 4)
Low Medium High
ZONE 4 | General Area
ZONE 3 | Close Proximity
ZONE 2 | Indirect Contact
ZONE 1Direct Contact
Figure 3. Identification of high-risk areas of allergen testing

Environmental Monitoring Handbook - Allergens
78
The immediate corrective actions to be taken when an allergen test from environmental monitoring programs is above the threshold depends on the risk level of the sample as determined in Figure 3.
• High-risk (Red) samples that are positive require re-cleaning of the equipment and re-testing prior to clearing the line for production.
• Moderate-risk (Yellow) samples can receive a bit more discretion depending on the type of product produced. Ideally, the area should be re-cleaned prior to production, though increased monitoring and/or deep cleaning of the area in the future might also be an acceptable response.
• Low-risk (Green) positives should be scheduled for additional cleaning at a future date followed by post-cleaning testing.
6.5. Corrective actions based on allergen testing results
6.4.3. Determination of cut-off levels for allergens
The topic of allergen thresholds has been the focus of debate over the last decade with only pockets of resolution. Gluten thresholds in the finished product seem to be generally accepted at less than 20 parts per million (20 ppm, or 20 μg/g).9 Certain special interest groups for celiac and gluten-sensitive communities are advocating for lower thresholds (5 ppm-10 ppm) than what is required by regulations. Other allergenic foods have less clarity, as a patchwork of thresholds is emerging from Voluntary Incidental Trace Allergen Labelling (VITAL) in Australia, EU, Japan and other national/regional regulations.10
While there is currently little consensus on the thresholds for finished food, there is even less for what is acceptable on equipment and environmental samples. This is doubly compounded by concentration units of measure for food (ppm) being improperly applied to surfaces where weight or per weight
volume units of measure have no meaning. Historically, this likely came about by the use of ELISA methods that give results as ppm to analyze environmental swabs. Regardless of the source, it has produced additional confusion in the marketplace, as even some standard-setting bodies have discussed applying 5 ppm as a threshold for environmental samples.
That being said, the current expert opinion from the Food Allergy Research and Resource Program (FARRP) is that a pass result using an ELISA kit should be below the limit of quantification (LOQ – for most kits 2.5-5 ppm(μg/g), or possibly equivalent to 1.25-2.5 μg/100cm2, depending on the protocol for swab extraction) to effectively reduce the risk to the end-consumer.11 This represents a very practical approach to setting environmental thresholds for testing systems despite the lack of clarity from regulatory bodies.

Environmental Monitoring Handbook - Allergens
79
Longer term corrective actions should include root-cause analysis for determining the source of the allergen contamination or the cause of failure in the cleaning procedure. Additional long-term corrective actions could include:
• Changing the cleaning frequency. • Revalidating the cleaning procedure.
• Changing the cleaning process to remove variability or increase the effectiveness.
• Assessing equipment for upgrades or replacement.
• Upgrading plant design to improve cleaning.
• Improving raw material/ingredient segregation.
6.6. Identifying sources of allergen contamination As with any food safety failure, a root-cause analysis to determine the source of allergens or origin of the failure and follow-up action to remove them is required to ensure the failures do not repeat. There may be situations where the source of the contamination is not known. In these cases, the tests for specific allergen residues will likely be much more valuable in the root-cause analysis than the use of non-specific tests such as ATP or protein swabs.
If the failure occurred on Zone 1 or Zone 2 where the source of allergens is obvious (i.e., they were present in the previous product run on the equipment), then the core of the root-cause analysis is to
determine why the food residues were not adequately removed. The focus of the root-cause should be on the cleaning process and on a potential failure in the Time, mechanical Action, concentration of Chemicals, or the Temperature of the process, commonly referred to as TACT (Figure 4).
Additional considerations could include changes, intentional or unintentional, to the manufacturing process, such as excessive cooking that makes the food residues more difficult to remove, equipment failures that cause spattering or product accumulation, or changes in the raw materials.
Figure 4. TACT approach to evaluate root-cause failure on the cleaning process
T A
T C
TACT – Every day, every time
Time – enough time for effective cleaningT
Action – sufficient mechanical action appliedA
Chemical – type/concentrationC
Temperature – too hot/too coldT

Environmental Monitoring Handbook - Allergens
80
If the failures occurred in Zone 3 or Zone 4, the focus of the root-cause should be on the source of the allergenic materials and their potential transportation to these zones. People, spatter from the manufacturing process, fine powder drift, traffic patterns for fork-lifts and
other causes may result in the migration of allergen-containing residues from the manufacturing area to Zones 3 and 4. Air-handling equipment, fans and construction might also cause the inadvertent transport of allergen residues.
Selecting the proper allergen detection test sometimes requires more detailed knowledge about the targets of the test. For example, many commercial milk assays target the protein casein, which is about 80 percent of the protein in cow’s milk. This is a good indicator for producers using products containing whole-milk or cheese powders.
However, if the milk-containing products only contain whey powder, the casein test will not detect residues from these products, as the content of casein in whey is very low. For companies with whey- or whey protein isolate-containing products, tests that target beta-lactoglobulin (the major protein in whey) would be required in order to measure the carryover of whey protein in their non-milk labeled product. Similar concerns exist for food containing yolk or egg white, as most tests for egg proteins focus on the ovalbumin from the egg white, but would be ineffective in detecting the presence of egg yolk.
One of the interesting “quirks” of the allergen groupings in the U.S. and other regions is the grouping of certain allergen sources into large categories, such as the seafood/fish/shellfish categories. Some antibody sources and, in turn, ELISAs and LFDs may be specific for certain species within the category while others may be more broadly applicable to a wide range of species. It is important to perform a validation for any test selected to ensure
that the test is fit for purpose and can reliably detect the allergen source present in the specific food matrix.
The detection of gluten and wheat also has a number of challenges. Gluten is the protein that triggers celiac disease (a non-allergenic disease) as well as triggering the symptoms in those people with gluten sensitivity. Gluten is the main protein found in a wide range of grains including wheat, barley and rye and their sub-cultivars.
In contrast to celiac disease, there are people with a specific allergy to wheat proteins that include gluten. To complicate this matter further, there are some test methods which employ gluten antibodies that are very specific for wheat gluten with low affinity for barley gluten, while others can have greater than a four-fold stronger reaction to barley gluten than to wheat gluten. The wheat-specific gluten antibodies may indicate that there is no gluten present when there are significant amounts contributed from barley contamination. In contrast, barley-specific gluten antibodies may indicate that there is 40 ppm of gluten when in reality the concentration is only 10 ppm of barley gluten. Then for this particular case, it would be important to verify that the selected method can specifically detect and quantify rye, barley and wheat.
6.7. Additional aspects to consider

Environmental Monitoring Handbook - Allergens
81
6.8. Summary• Food allergies have increased over the
years, which may have a severe impact on public health, especially in infants and young children.
• Current food demand may require sharing of production facilities to manufacture foods containing allergens and foods expected to be specific allergen free. Thus, robust food safety programs that consider environmental monitoring and allergen control are essential.
• An effective allergen control program should be able to identify and monitor potential areas of cross-contact and ensure through a comprehensive validation that the cleaning process in a food manufacturing facility is effective to minimize contamination with food allergens.
• Verification of allergen control measurements can be achieved through allergen testing. There are two general approaches that can be used:
- Highly specific allergen testing that relies on the recognition of specific proteins yielding a qualitative or quantitative result. These are recommended for a cleaning process validation, to test allergen-free final product and for environmental monitoring.
- Non-specific allergen testing that generally detects ATP and proteins whose presence may indicate an inadequate cleaning process. These are useful when food manufacturing includes products containing various allergens in a single product, or when it’s necessary to assess overall cleaning processes.
• Selection of a testing method should be supported by a risk-based analysis that helps determine that the verification measurements will support allergen control plans.
• Testing methods for allergen detection are often based on the specific recognition of a particular protein. It is important to perform a validation for any test selected to ensure that the test is fit for purpose and can reliably detect the allergen source present in the specific food matrix.
• Currently, allergen thresholds are a hot topic of debate without clear guidance. Based on expert opinion by FARRP, a pass result using an ELISA kit should be below the limit of quantification of the specific method (2.5 to 5 ppm for most commercial kits).
• Environmental monitoring for allergen control should include a sampling plan that supports verification of food safety or HACCP plans. Identification of high-risk areas (Zones 1 and 2) should be prioritized for higher testing frequency. Consideration should also be given to moderate- and low-risk areas (Zones 3 and 4) that may be tested with lower frequency.
• A complete allergen control strategy should consider short- and long-term corrective actions within the environmental monitoring program, as well as root-cause analysis to determine potential sources of allergens and anything that may cause a failure in their removal during the cleaning process or their exclusion in final product.
Connect with a 3M Food Safety expert
www.3M.com/Connect/AllergenMonitoring
Learn more aboutallergen testing
www.3M.com/AllergenMonitoring

Environmental Monitoring Handbook - Allergens
82
References:
1. Food Allergen Labeling and Consumer Protection Act of 2004. Public Law 108-282, Title II.https://www.fda.gov/Food/GuidanceRegulation/GuidanceDocumentsRegulatoryInformation/Allergens/ucm106187.htm
2. Jackson, K.D., Howie, L.D., Akinbam, L.J. 2013. Trends in Allergic Conditions among Children: United States, 1997-2011. National Center for Health Statistics Data Brief. http://www.cdc.gov/nchs/products/databriefs/db121.htm
3. Gupta, R., Holdford, D., Bilaver, L., Dyer, A., Meltzer, D. 2012. The high economic burden of childhood food allergy in the United States. J. of Allergy and Clin. Immunol. 131: AB223-AB223. https://doi.org/10.1016/j.jaci.2012.12.1464
4. Food Safety News. 2017. Undeclared allergens a leading cause of food recalls in U.S. https://www.foodsafetynews.com/2017/04/undeclared-allergens-a-leading-cause-of-food-recalls-in-u-s/
5. Ferguson, B. 2018. Testing and Sanitation for Allergen Control. Food Safety Magazine. https://www.foodsafetymagazine.com/magazine-archive1/februarymarch-2018/testing-and-sanitation-for-allergen-control/
6. Regulation EU No. 1169/2011 of the European Parliament of the council. 2011. Annex II.
7. Food Allergy Research and Resource Program. 2017. International Regulatory Chart. Version September 21. https://farrp.unl.edu/documents/Regulatory/International%20Allergens%209-21-17.pdf
8. United States Food and Drug Administration. 2015. Current Good Manufacturing Practice, Hazard Analysis, and Risk-Based Preventive Controls for Human Food; Final Rule. Verification of implementation and effectiveness. § 117.165. https://www.fda.gov/Food/GuidanceRegulation/FSMA/ucm334115.htm
9. Codex Alimentarius. International Food Safety Standards. CODEX STAN 118-1979. Revised 2008. Standard for foods for special dietary use for persons intolerant to gluten.
10. Taylor, S.L., Baumert, J.L., Kruizinga, A.G., et al. 2014. Establishment of reference doses for residues of allergenic foods: Report of the VITAL expert panel. Food Chem. Toxicol. 63: 9-17. https://doi.org/10.1016/j.fct.2013.10.032
11. Taylor, S.L. 2016. Validation and Verification of Allergen Control Plans. Food Allergy Research and Resource Program Effective Food Allergen Management Workshop. Rosemont, IL.

Environmental Monitoring Handbook - Driving Change
83
Driving Meaningful Change in Your Organization Through Culture and Environmental Monitoring
CHAPTER 7
By John Butts | Food Safety By DesignLone Jespersen | CultivateMichele Fontanot | 3M Food Safety
The path to microbiological process control
Benefits of microbiological process control
Company culture and predictive microbiological process control
Cultural dimensions, tactics and environmental monitoring target behaviors
84
88
89
89
7.1.
7.2.
7.3.
7.4.

Environmental Monitoring Handbook - Driving Change
84
As described throughout this handbook, an environmental monitoring program is fundamentally a tool to measure and reflect control. With renewed industry focus on the programs underpinning Hazard Analysis and Critical Control Points (HACCP) and a greater-than-ever understanding of the important role environmental monitoring plays in delivering safe products to consumers, it is imperative that food
manufacturers regard environmental monitoring programs as critical and invest the resources necessary to ensure effective execution. Once implemented, it is also vital that the programs evolve with the organization to result in ongoing, microbiological process control of facilities and to foster an effective and positive food safety culture within the organization.
How effectively an environmental monitoring program is applied largely defines a food manufacturer’s ability to attain microbiological process control of its environment – and therefore in its finished product.
Microbiological process control is a three-step process:
(1) Eliminate the resident organisms of concern from the processing environment.
(2) Control movement by managing the vectors and pathways.
(3) Utilize process control methodology to measure and predict loss of control.
The concept of complete microbiological process control uses environmental monitoring as a tool to measure the level of control being achieved.
Step 1. Elimination of the resident organisms of concern is measured by presence or absence in the verification, indicator site and investigative sampling programs. Obtaining negative results from these sites over a long term is a key indicator of elimination.
Step 2. The effectiveness of barriers and hurdles to entry and movement within the exposed product area measure the control of movement.
Step 3. Degree of microbiological process control is evaluated by plotting collected data (variable and attribute) on control charts and calculation of statistical capability indices.
Environmental monitoring measures the risk present in the processing environment and also assesses the hurdles established to control entry of pathogens. This requires process control, or indicator sites as well as verification sites to be sampled individually and in conjunction with one another. These results indicate the level of control in the facility and help identify when failures occur or when interventions or additional actions are required to bring the process back into required levels of control.
7.1. The path to microbiological process control

Environmental Monitoring Handbook - Driving Change
85
The path to microbiological process control is one of increasing maturity which can typically be broken into five stages1:
Doubt
Awareness
Enlightenment
Preventive
Predictive
Experience of the U.S. processed meat industry during their time of “Enlightenment” and the introduction of sanitary design
In the late 1980’s and early 1990’s, the United States processed meat industry was well aware of the hazards of Listeria but was unaware of how to control it in the processing environment. Despite their best efforts, corrections and attempts to rid harborage sites or niches following a positive environmental result were often ineffective. Thorough cleaning and sanitization didn’t address the root cause and prevent the sites from routinely being recontaminated, keeping the industry at large stuck in a phase of awareness for a prolonged period of time.
As it reached an eventual state of Enlightenment, the industry experienced still further setbacks. The clean and sanitize approach that was being employed following a positive result created a frustrating dynamic of “firefighting,” or solving the same problem repeatedly with the same results (Einstein’s definition of insanity).
Only with the implementation of true corrective actions in the form of new sanitary design principles for equipment were harborage sites and growth niches reduced or eliminated.
Process control (aggressive sampling looking for positives)
• Indicator sites Ŕ Facility and equipment sanitary
design concerns Ŕ Zone 4 to Zone 3 transfer pathways
(hurdles) Ŕ Effectiveness of hygienic zoning Ŕ Post initial rinse
• Verification sites (indicates process control failure)
Ŕ Zone 1 contact surfaces Ŕ Zone 2 and Zone 3 transfer
pathways and vectors
Importantly, microbiological process control measures the conditions for growth, e.g. via ATP tests and Total Plate Count (TPC) as well as transfer of the indicator organism.
1
3
2
4
5
Figure 1. Five stages of microbiological process control maturity

Environmental Monitoring Handbook - Driving Change
86
DoubtThe initial stage in the journey to microbiological process control can often be described as one of Doubt. In this stage, management often sees environmental monitoring as an unnecessary cost offering no real benefit, typically pointing to the fact that they have a HACCP program in place and believe that their facility is somehow different or better managed than others and therefore environmental monitoring is not something that should apply to them.
AwarenessThe next stage after doubt is Awareness. In this stage, the food manufacturer becomes aware of the potential of an environmental microbiological hazard, but is not aware of the root cause or source of the hazard, thus unable to control the hazard.
EnlightenmentThe stage of Enlightenment is reached when growth niches are eventually identified in a facility. The discovery of these niches during this stage of maturity is typically the result of investigations following more serious incidents, e.g., positives showing up in end products or upon discovery and testing of residues during machinery disassembly.
The process of moving from Awareness to Enlightenment is often one of significant stress and tension within a facility as they begin to comprehend the situation and attempt to deal with the issue through corrective actions, almost universally being a process to clean and sanitize without getting to the root cause (Table 1).
This state of control can often be associated with:
• Management and employee frustrations associated with the inability to solve chronic problems (“The problems just do not go away.”)
• Tension created between departments.
• Increased sanitation efforts, costs and labor (these remain until preventive and predictive stages are attained).
• Stress caused by the inability to clean the uncleanable.
• Greater amounts of retained product, which brings with it more risk associated with loss of control, the potential of recalls, more involvement and efforts from top management, need for more storage space and, all in all, unnecessary stress to the entire system.
PreventiveThe Preventive state exists when a known growth niche or harborage site can be brought back to an acceptable sanitary condition, e.g. harborage-negative growth conditions equal to or less than preoperative upper specification limit.
The Preventive state is characterized by cleaning-out-of-place (COP) for all small parts, maintenance tools and operator tools. All equipment in high-risk areas have validated interventions. Microbial movement is minimized by effective good manufacturing processes (GMPs) and floor sanitizer. Additionally, a physical hygienic zone separation is accompanied by hurdles at zone barriers.
PredictiveThe Predictive stage exists when a growth niche or harborage site can be managed with sampling and analysis of indicator site data. Out-of-control or out-of-specification indicator site results define when to apply the chosen intervention to manage the contaminant.
Unfortunately, today’s technology does not provide the ability to eliminate through redesign all sanitary design issues that could result in food safety or product quality issues. Those that require control may be managed in a Preventive and Predictive method by the use of indicator sites.
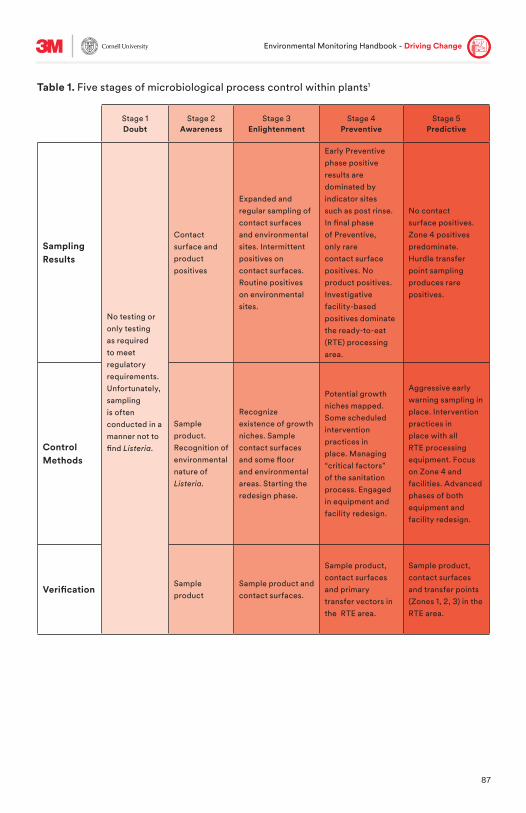
Environmental Monitoring Handbook - Driving Change
87
Table 1. Five stages of microbiological process control within plants1
Stage 1Doubt
Stage 2Awareness
Stage 3Enlightenment
Stage 4Preventive
Stage 5Predictive
SamplingResults
No testing or only testing as required to meet regulatory requirements.Unfortunately, sampling is often conducted in a manner not to find Listeria.
Contact surface and product positives
Expanded and regular sampling of contact surfaces and environmental sites. Intermittent positives on contact surfaces. Routine positives on environmental sites.
Early Preventive phase positive results are dominated by indicator sites such as post rinse. In final phase of Preventive, only rare contact surface positives. No product positives. Investigative facility-based positives dominate the ready-to-eat (RTE) processing area.
No contact surface positives. Zone 4 positives predominate. Hurdle transfer point sampling produces rare positives.
ControlMethods
Sample product. Recognition of environmental nature of Listeria.
Recognize existence of growth niches. Sample contact surfaces and some floor and environmental areas. Starting the redesign phase.
Potential growth niches mapped. Some scheduled intervention practices in place. Managing “critical factors” of the sanitation process. Engaged in equipment and facility redesign.
Aggressive early warning sampling in place. Intervention practices in place with all RTE processing equipment. Focus on Zone 4 and facilities. Advanced phases of both equipment and facility redesign.
VerificationSampleproduct
Sample product and contact surfaces.
Sample product, contact surfaces and primary transfer vectors in the RTE area.
Sample product, contact surfaces and transfer points (Zones 1, 2, 3) in the RTE area.

Environmental Monitoring Handbook - Driving Change
88
Once microbiological control is obtained, the benefits include:
Productivity gains
• Order fulfillment becomes more predictable.
• Fewer problems are encountered during normal production.
• Plant performance exhibits greater overall equipment effectiveness (OEE).
• Process and product qualifications work in a systematic manner and provide data to validate.
• The Predictive phase enables time-consuming and equipment-stressing interventions to be applied only when necessary.
Risk mitigation
• The Predictive phase predominately manages growth niches as opposed to harborage sites.
• Organizations gain a higher level of brand protection.
• Facility- and equipment-based positives are eliminated.
• The focus of control is on Zone 4 and raw materials.
Direct cost reduction
• The sustainability and financial costs associated with products that are destroyed or diverted are reduced.
• Labor and overhead costs associated with managing retained product, and with managing the effects of in-process testing, verification and requalification, diminish.
• Production downtime caused by positive results becomes rarer.
• The Predictive phase enables time-consuming and equipment-stressing interventions to be applied only when necessary.
• Data collection is less expensive and statistical analysis is more easily and reliably applied.
• Insurance costs are reduced.• Food safety and quality professionals
spend less time managing the sampling process.
• Sampling costs are lower while more sites are sampled for multiple reasons:
Ŕ Firefighting ceases and for-cause investigational sampling is eliminated.
Ŕ Indicator tests (e.g., TPC) become a larger portion of total testing.
Continuous improvement
• Understanding of sanitary design failure leads to improved sanitary design and reduced sanitation costs and labor.
• Plants can be more aggressive with indicator testing.
• More consistent and predictable quality and shelf-life is realized.
7.2. Benefits of microbiological process control

Environmental Monitoring Handbook - Driving Change
89
Connecting microbial process control and an organization’s culture
The relationship between effective environmental monitoring programs and an organization’s culture is more significant than most food safety practitioners and business leaders realize. As such, much angst can spread throughout a food company when positives are detected through verification activities, especially in cultures at Doubt and Awareness stages (Table 1) where food safety activities are largely completed by food safety professionals.
Food safety in these stages is crisis management-driven, with leaders stressing the importance of “doing things right” while conducting investigations that fail to get to the root cause. The development of such effect-driven behaviors that wait for a crisis to engage operations professionals is harmful to consumers, brands and overall company financial performance.
The separation of process control and verification enables celebration of process control positives and focus on prevention rather than control via crisis. Linking environmental monitoring programs to
organizational, and food safety, culture is critical. It creates “line of sight” to the corporate vision, principles and values and subsequent team – and individual behaviors.
The Global Food Safety Initiative (GFSI) has defined food safety culture as “A company’s shared values, norms, and beliefs that affect mindsets and behaviors toward food safety in, across, and throughout the company”.2
As one looks at the descriptors for the Predictive stage, they find a reliance on Zone 4 and equipment – and facility design to eradicate and control organisms. In other words, a culture that believes in keeping the organisms as far away from food products and a mindset that investing in re-designing equipment and infrastructure is an important and ongoing activity. Organizations are wise to look introspectively at some of the cultural tactics that they can apply to create this linkage and move towards a Predictive stage for microbial process control.
7.3. Company culture and predictive microbiological process control
7.4. Cultural dimensions, tactics and environmental monitoring target behaviors Organizations cannot get to the Predictive stage without understanding the multi-dimensional aspect of a culture of food safety. Based on the five dimensions to a culture of food safety3, an integrated set of tactics might help move a culture. Food manufacturers will find “target behaviors” that, if tactics are implemented effectively, should be consistently seen from employees (Table 2).
It is important to note that no two cultures are the same and that, not unlike the scientific expertise that many rely on to design effective environmental programs, experts might have to be engaged to help build a plan specific to the organization and its needs.

Environmental Monitoring Handbook - Driving Change
90
Cultural Dimension Tactic Environmental Monitoring Target
Behaviors
Mission and values
• Integrate environmental monitoring to company/plant/business strategic and operational cycle
• Enable all leaders to message environmental monitoring
Leaders of all functions actively ask questions about food safety and environmental monitoring in strategy and budget discussions Leaders of all functions integrate food safety and environmental monitoring messages in their ongoing communications
People
• Food safety education for everyone: “Put a swab in everybody’s hands…”
• Multidisciplinary team
All employees are expected to take company food safety education as part of their role-specific competencies
All environmental monitoring insights – good and bad – are investigated by teams from multiple functions
Adaptability • Carrot vs. stick
Team leaders use indicator sites and positive consequences (e.g., reward findings), resulting in problem prevention and continuous improvement that builds trust in the food safety process
Consistency
• Communication rhythm• Insights driven by
environmental monitoring data
Leaders design food safety and environmental monitoring into the company rhythm (i.e., board discussions, leadership meetings, plant huddles and frontline team discussions)
Environmental monitoring data are integrated into the company business intelligence solution and insights discussed from board room to frontline
Risks and hazards
• Environmental monitoring pictures and stories
Technical team members generate ongoing messages and stories for others to use in team member onboarding and engagement
Table 2. Cultural tactics and target behaviors
Connect with a 3M Food Safety expert
www.3M.com/Connect/ImprovedMonitoring
Learn more about environmental monitoring
www.3M.com/ImprovedMonitoring

Environmental Monitoring Handbook - Driving Change
91
References:
1. Butts, J. 2011. A Team Approach for Management of the Elements of a Listeria Intervention and Control Program. Agric. Food Anal. Bacteriol. 1:6-14.
2. Global Food Safety Initiative. 2018. A Culture of Food Safety: A Position Pager from the Global Food Safety Initiative (GFSI). Version 1.0 – 4/11/18. https://www.mygfsi.com/news-resources/news/news-blog/1419-a-culture-of-food-safety.html
3. Jespersen, L., Griffiths, M., Wallace, C.A. 2017. Comparative analysis of existing food safety culture evaluation. Food Control. 79: 371-379. https://doi.org/10.1016/j.foodcont.2017.03.037

Environmental Monitoring Handbook - Sampling Guidance
92
Environmental SamplingGuidance
CHAPTER 8
By Scott Egan | 3M Food SafetyBurcu Yordem | 3M Food Safety
Sampling neutralizers
Selection of sampling device
Sampling methods
93
97
98
8.1.
8.2.
8.3.

Environmental Monitoring Handbook - Sampling Guidance
93
Sampling from food processing environments can present several challenges. Trying to obtain meaningful results that accurately reflect the level of microbial contamination on a surface is no small chore. One such challenge is the presence of sanitizers that may continue to have bactericidal or bacteriostatic activity after the sampling event. This continued activity can reduce the microbial population within the sample prior to detection or enumeration taking place (e.g., during transportation) or inhibit an organism’s growth on the culture media used in the actual testing process. This can ultimately result in reduced counts for quantitative methods or negative results for qualitative methods and thus not truly represent the risks present in the production environment.
To overcome this challenge, sample collection devices such as swabs or sponges should incorporate components that are effectively able to neutralize any sanitizers present. The selection of a neutralizer (or combination of neutralizers) should be undertaken with knowledge of the types of sanitizers used within a facility, as not all neutralizers/combinations are equally effective against different types of sanitizers.
Two other important aspects to consider when selecting neutralizers are: compatibility with the test method to be used, and whether the method is qualitative or quantitative. If quantification is the aim, the neutralizers selected should not support the growth of the organisms, but
merely maintain the population at or similar to the level at the time of sampling.
These aspects can often be overlooked not only during initial selection of a neutralizer, but also when sanitizers, test methods or sampling regimes change.
Most commercially available swabs and sponges will incorporate a combination of neutralizers as part of standard or proprietary formulations. The most common neutralizing or sampling liquids and their various levels of effectiveness are summarized in this chapter’s table content. In the case of proprietary formulations, the manufacturer should be contacted to obtain information on the components or the sanitizers it has been shown to be effective against.
Letheen Broth is commonly used for environmental sampling in the food, nutraceutical, cosmetic and pharmaceutical industries.1,2 It has neutralizing capability with iodine, quaternary ammonium compounds and chlorine sanitizers. However, it has no ability to neutralize mercurials, formaldehyde or glutaraldehyde, so once again the sanitizer being used must be taken into consideration.
Additionally, Letheen Broth has some enrichment capabilities, so the surface should be resanitized after sample collection.
8.1. Sampling neutralizers

Environmental Monitoring Handbook - Sampling Guidance
94
Table 1. Composition of Letheen Broth
Table 2. Composition of D/E Neutralizing Buffer
Composition: (typical formula g/L)
Enzymatic Digest of Animal Tissues 10.0 g
Beef Extract 5.0 g
Polysorbate 80 5.0 g
Sodium Chloride 5.0 g
Lecithin 0.7 g
Composition: (typical formula g/L)
Enzymatic Digest of Casein 5.0 g
Yeast Extract 2.5 g
Polysorbate 80 5.0 g
Dextrose 10.0 g
Lecithin 7.0 g
Sodium Thioglycollate 1.0 g
Sodium Thiosulfate 6.0 g
Sodium Bisulfite 2.5 g
Bromcresol Purple 0.02 g
D/E Neutralizing Buffer was developed by Dey and Engley to neutralize a broad spectrum of disinfectants and preservative antimicrobial chemicals. It was designed for testing the efficacy of disinfectants rather than for environmental sampling. Although it counteracts the biocidal activity of all the main sanitizers, it also contains
an indicator dye and has enrichment properties. Its broad neutralizing capabilities may be more than required since few food processing plants sanitize with the toxic agents such as mercurials, formaldehyde or gluteraldehye.3,4 Because it contains an indicator dye and has enrichment capabilities, a surface must be resanitized after sample collection.

Environmental Monitoring Handbook - Sampling Guidance
95
Table 3. Composition of Neutralizing Buffer
Table 4. Composition of Buffered Peptone Water
Composition: (typical formula g/L)
Aryl Sulfonate Complex 5.0 g
Sodium Thiosulfate 0.16 g
Potassium Phosphate, monobasic 0.0425 g
Composition: (typical formula g/L)
Peptone 5.0 g
Sodium Phosphate, dibasic 0.16 g
Sodium Chloride 0.0425 g
Potassium Phosphate, monobasic 1.5 g
Neutralizing Buffer, often thought to be a generic term, is actually a specified formulation commonly used in industry for Listeria, Total Plate Count, Salmonella, E. coli and other types of testing.2,4 It does not effectively neutralize phenolic, mercurial, formaldehyde or glutaraldehyde sanitizers (although these are uncommon
in the food industry due to their toxicity). It has the advantage of containing no enrichment agents, so re-sanitizing the sampling site after sample collection is not necessary. Note that this formulation contains aryl sulfonate complex and may require dilution of the sample prior to testing with a molecular-based method.
Buffered Peptone Water (BPW) is often used in abattoirs to collect samples from carcasses as directed by regulations. It is not recommended for use on sanitized surfaces as it has minimal neutralizing
capability. Note that Buffered Peptone Water is an enrichment broth, so if used for environmental sampling, the surface should be resanitized after sample collection.5
It should be noted that the effectiveness of different, common neutralizing media against common sanitizers can vary and
that specific neutralizing media may or may not neutralize specific disinfectants (Table 5).
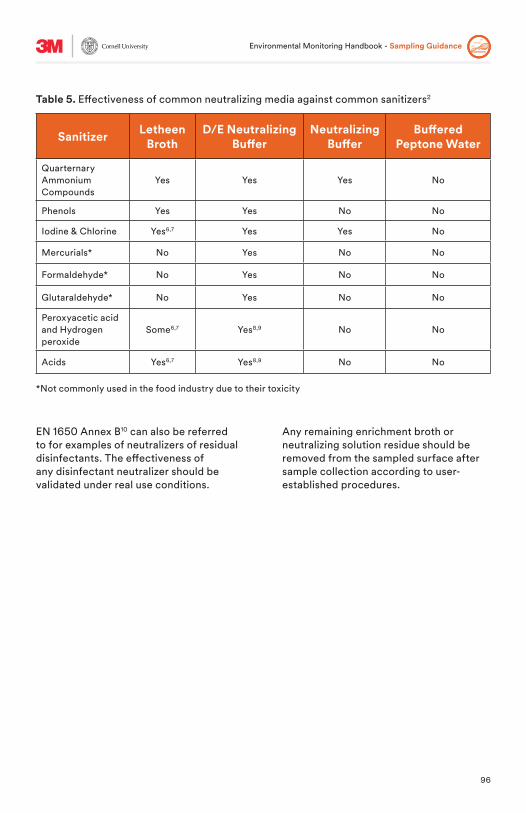
Environmental Monitoring Handbook - Sampling Guidance
96
Table 5. Effectiveness of common neutralizing media against common sanitizers2
*Not commonly used in the food industry due to their toxicity
Sanitizer Letheen Broth
D/E Neutralizing Buffer
Neutralizing Buffer
Buffered Peptone Water
Quarternary Ammonium Compounds
Yes Yes Yes No
Phenols Yes Yes No No
Iodine & Chlorine Yes6,7 Yes Yes No
Mercurials* No Yes No No
Formaldehyde* No Yes No No
Glutaraldehyde* No Yes No No
Peroxyacetic acid and Hydrogen peroxide
Some6,7 Yes8,9 No No
Acids Yes6,7 Yes8,9 No No
EN 1650 Annex B10 can also be referred to for examples of neutralizers of residual disinfectants. The effectiveness of any disinfectant neutralizer should be validated under real use conditions.
Any remaining enrichment broth or neutralizing solution residue should be removed from the sampled surface after sample collection according to user-established procedures.

Environmental Monitoring Handbook - Sampling Guidance
97
8.2. Selection of sampling deviceUnless defined by specific regulations, the primary decision to be made should be the type of device (sponge or swab) to be used. The key things to consider when choosing the device are what the size of the area being sampled is, whether the area is readily accessible and which type of testing will be conducted on the sample. An effective environmental monitoring program will use a combination of sponges and swabs.
Sponges are larger sampling devices and are available in a variety of formats, from individual sterilized portions to portions attached to a handle to aid aseptic handling.
Sponges are preferred if qualitative pathogen testing is to be conducted, as they can be used to sample a larger area, therefore increasing the likelihood of detection. The area sampled should be greater than 100 square centimeters (15.5 square inches) and preferably greater than or equal to 1,000 square centimeters (155 square inches).5,11 However, in many cases, particularly when swabbing for detection of pathogens or index organisms (e.g., Listeria spp.), sampling of areas of a specific size is not appropriate or feasible as locations likely to harbor pathogens do not represent areas that can be easily assessed (e.g., long cracks in floors). In these cases it is important to sample as large an area as possible (e.g., multiple meters or yards of a floor crack).
The material used in the manufacture of sponges is most commonly cellulose or polyurethane.11,12 Various studies have looked at the different efficacies of each of these materials for their ability to collect and allow improved detection rates. However, these studies have generally shown no significant difference.13,14
Sponges should be free of inhibitory substances. Typical household sponges are not recommended for environmental sampling, as they may contain biocides which would inhibit microbial growth.
Swabs are smaller sampling devices consisting of a tip or bud for collecting the sample attached to a long flexible stem. Because of their smaller size, they are better suited for sampling in hard-to-reach places and are typically used for areas of 100 square centimeters or less.5,11
Due to their smaller size and ease-of-use for sampling a defined area, swabs can be particularly useful for quantitative environmental testing (e.g. for indicator organisms). This is important because the defined area will be used in the calculation of results.
The material used is typically synthetic such as alginate, Dacron or rayon. However, cotton is also sometimes used. 1,5 Evidence should also be obtained, either through supplier documentation or product validation/verification, that the chosen device does not have any bacteriostatic or bactericidal activity.
Additional consideration should be given to the quality, strength and type of materials used, as fragments of the device may separate, leading to foreign object contamination of the facility and the potential implications. Additional features such as blue-colored designs and metal detectability may also be of benefit.
Environmental Monitoring Handbook - Sampling Guidance
98
8.3. Sampling methodsThe sampling methods employed will vary depending on the type of device being used and the testing intended to be conducted.
Moisture is one of the most important factors for bacterial survival on surfaces. Therefore, regardless of the device or intended testing, it is recommended to sample from a moistened surface or with a moistened collection device to improve recovery.13
A noteworthy exception can be sampling of dry environments where introduction of moisture may be undesirable, as it enhances the risk of microbial growth. In these cases, specialized tools (e.g., spatulas, spoons, scoops) may be be used to collect dry materials and dust from the environment.
It is also important to only sample a single item or area with each device. This prevents cross-contamination between items or areas in the facility.
Pathogen sampling should have the general intention of sampling as much surface area as possible to improve the likelihood of detection. Although regulations may specify the size of sampling area, these can typically be taken as minimum sizes. As discussed in Chapter 4, training materials often cite specific sampling areas (12 by 12 inches, or 30 by 30 centimeters, for examples), but many surface areas are not square or flat enough to accommodate such surface area.
If sampling sites are not easily accessible, a swab may be more suitable. Again, the intention should be to obtain as much
surface contact as possible to maximize the likelihood of detection.
Quantitative sampling may require more care to be taken. For example, if the test result is expressed in CFU/cm2, a specific sample area size is typically defined and adhered to. Sampling templates can assist with sampling a defined area, but caution should be taken as their use can lead to cross contamination.
It would also not be uncommon, even for quantitative sampling, to target an area of undefined size. For example, testing for Total Plate Count may be used to assess the efficacy of sanitation on difficult to reach areas, in which case it may be impossible to sample a defined area. For these unmeasured surface areas, the results may be reported based on the entire sampling site instead of the surface area measured. When environmental samples are taken, it is critical that proper aseptic technique is used to prevent inadvertent contamination of the sample. It is recommended to wash or sanitize hands prior to opening the sampling device. Each type of sampling device also has particular techniques that should be followed along with any additional guidance from manufacturers if using proprietary swab designs.
Swabs (Figure 1) should be aseptically removed from their container and particular attention should be given not to touch the bud or any area of the stem that will be returned into the container. During removal, the swab tip should be pressed against the container to remove excess liquid.

Environmental Monitoring Handbook - Sampling Guidance
99
Where possible, particularly for easily acceptable areas sampled for quantitative analysis, multiple directions should be used when sampling and the swab should be rotated between thumb and forefinger. After swabbing the first direction, the swab should be returned to the container and rinsed in the neutralizing solution to remove collected organisms and re-moisten the tip. The same procedure should then be repeated in two other directions. The swab is then sealed in its container for transportation.
Sponges (Figure 2) should be aseptically removed from their container using sterile gloves or forceps, or by manipulating the container to access the handle of the device. Care should be taken not to contaminate the sponge or any other part
of the device that will be inserted back into the container.
The sponge should be wiped over the sampling surface using firm and even pressure. This will help to dislodge organisms that may be protected by biofilm. After sampling in one direction, the sponge should be turned over and used to swab in a perpendicular direction. The sponge should then be placed in its container, aseptically taking care not to insert any portion that is not part of the sample (e.g., the handles of some devices). The container should then be sealed for transport.
After any sampling has taken place, surfaces should be cleaned of any neutralizing solution and resanitized.
Figure 1. Example of sampling technique using 3MTM Swab-Sampler
1 2 3 4
6 5
7

Environmental Monitoring Handbook - Sampling Guidance
100
Figure 2. Example of sampling technique using 3MTM Sponge-Stick
Sample transport is the final step in the environmental sampling process and, again, particular attention must be given to some aspects. Samples should be delivered for analysis at refrigerated temperature as soon as possible, preferably within 24 hours as detailed in ISO 18593:2004.
Containers used for transportation should be clean and sanitized. They should include ice packs and be able to maintain refrigeration temperature for the duration of transportation.
Upon receipt at the laboratory, the internal temperature of the cooler should be verified using a thermometer.2 Additionally, samples should not be allowed to freeze under any circumstances, as sub-zero temperatures may kill or injure the microbes present.
If it is not possible to perform sample analysis within the recommended time frame or transport samples appropriately, alternatives should be developed and validated accordingly to ensure it does not undermine the sensitivity of the method.4
Connect with a 3M Food Safety expert
www.3M.com/Connect/SurfaceSampling
Learn more about sample collection
www.3M.com/SurfaceSampling

Environmental Monitoring Handbook - Sampling Guidance
101
References:
1. Downes, F. P., Ito, K., and American Public Health Association. 2001. Compendium of methods for the microbiological examination of foods (4th ed.). Washington, DC: American Public Health Association.
2. The Compendium of Analytical Methods. Volume 3. Laboratory Procedures for theMicrobiological Analysis of Foods. 2010. MFLP-41: Environmental sampling for the detection of microorganisms. Health Canada.
3. United States Food and Drug Administration. 2015. Testing Methodology for Listeria species or L. monocytogenes in Environmental Samples. Version 1. https://www.fda.gov/Food/FoodScienceResearch/LaboratoryMethods/ucm114664.htm
4. United States Department of Agriculture Food Safety and Inspection Service. 2014. FSIS Compliance Guideline: Controlling Listeria monocytogenes in Post-lethality Exposed Ready-To-Eat Meat and Poultry Products. https://www.fsis.usda.gov/wps/wcm/connect/d3373299-50e6-47d6-a577-e74a1e549fde/Controlling-Lm-RTE-Guideline.pdf?MOD=AJPERES
5. International Organization for Standardization. 2018. ISO 18593:2018. Microbiology of the food chain - Horizontal methods for surface sampling.
6. 3M Food Safety. 1985. Letheen Broth: A Neutralizing Solution for Iodine, Chlorine, Quaternary Ammonium and Acid Sanitizers (Internal Data).
7. 3M Food Safety. 2012. Sample Handling Sponges – New Sponge Qualification Performance Summary. TB.119.00.
8. Ignatovich, I., Podtburg, T., Leishman, O., Steinagel, S. 2017. Comparison of Neutralizing Buffered Peptone Water and Dey/Engley Broth in the Recovery of Salmonella enterica from Broiler Carcass Rinsates. J Food Protection. 80 (Supplement A): 163.
9. Park, Y.J., Chen, J. 2011. Mitigating the Antimicrobial Activities of Selected Organic Acids and Commercial Sanitizers with Various Neutralizing Agents. J Food Protection. 74: 820-825. https://doi.org/10.4315/0362-028X.JFP-10-447
10. EN 1650:2008. Chemical disinfectants and antiseptics – Quantitative suspension test for the evaluation of fungicidal activity of chemical disinfectants and antiseptics in food, industrial, domestic, and industrial areas - Test method and requirements (phase 2 step 1).
11. United States Food and Drug Administration. 2017. Chapter 10: Detection of Listeria monocytogenes in Foods and Environmental Samples, and Enumeration of Listeria monocytogenes in Foods. Bacteriological Analytical Manual. https://www.fda.gov/Food/FoodScienceResearch/LaboratoryMethods/ucm071400.htm

Environmental Monitoring Handbook - Sampling Guidance
102
12. United States Department of Agriculture Food Safety and Inspection Service. Microbiology Laboratory Guidebook. 2017. Method 8.10: Isolation and Identification of Listeria monocytogenes from Red Meat, Poultry and Egg Products, Ready-To-Eat Siluriformes (Fish) and Environmental Samples. https://www.fsis.usda.gov/wps/portal/fsis/topics/science/laboratories-and-procedures/guidebooks-and-methods/microbiology-laboratory-guidebook/microbiology-laboratory-guidebook
13. Keeratipibul, S., Laovittayanurak, T., Pornruangsarp, O., Chaturongkasumrit, Y., Takahashi, H., Techaruvichit, P. 2017. Effect of swabbing techniques on the efficiency of bacterial recovery from food contact surfaces. Food Control. 77:139-144. https://doi.org/10.1016/j.foodcont.2017.02.013
14. Sheth, I., Li, F., Hur. M., Laasri, A., De Jesus, A. J., Kwon, H. J., Macarisin, D., Hammack, T., Jinneman, K, Chen, Y. 2018. Comparison of three enrichment schemes for the detection of low levels of desiccation-stressed Listeria spp. from select environmental surfaces. Food Control. 84:493-498. https://doi.org/10.1016/j.foodcont.2017.08.022

Environmental Monitoring Handbook - About the Contributors
103
About the Contributors
Alexandra Belias is a graduate student working toward a doctoral degree in food science at Cornell University’s College of Agriculture and Life Sciences. Her current work is focused on projects associated with tracking pathogen contamination of produce. Belias received a Bachelor of Science in food science from Purdue University.
Alexandra BeliasCornell University
Christian Blyth is a pathogen sales and technical specialist at 3M Food Safety, based in the company’s Canada office for more than a decade. A regulatory expert on food safety, Blyth often speaks about food safety topics involving pathogens at industry conferences. His bachelor’s degree in biology was received from the University of Waterloo in Ontario.
Christian Blyth3M Food Safety, Canada
Dr. John Butts is the founder and president of Food Safety By Design, a private consulting firm that helps producers of high-risk products learn how to better prevent and manage food safety risks. Butts is also the advisor to the CEO of Land O’ Frost, and has served in a technical role at Land O’ Frost since 1974. He received a doctorate degree from Purdue University in 1974.
John Butts, Ph.D. Food Safety By Design

Environmental Monitoring Handbook - About the Contributors
104
Jean-Francois David is the scientific advisor to Europe for 3M Food Safety. Based in France and supporting 3M’s customer implementation of new products and technologies, David has more than 20 years of experience in food safety. He received his schooling from the Brest Graduate School of Microbiology and Food Security (ESMISAB) in Brest, France.
Jean-Francois David3M Food Safety, Europe
Dr. Ken Davenport, based in St. Paul, Minn., is the product development manager at 3M Food Safety. With over 15 years of experience in the food industry and 20 years of experience with rapid method development and applications, Davenport has a broad and deep background in both chemical and microbial food safety. He earned his bachelor’s degree in chemistry from Spring Arbor University, Ph.D. from the Department of Biochemistry at Rice University, and an M.B.A. from the University of Minnesota.
Ken Davenport, Ph.D. 3M Food Safety
Michele Fontanot is a professional consultant services manager for Latin America at 3M Food Safety. Based in Peru, Fontanot leverages her expertise on food safety to assist customers in the region working to implement 3M products and technologies in ways that effectively meet their processing and manufacturing needs aligned to international regulations and standards. She has earned a bachelor’s degree from Cayetano Heredia University in Lima and a Master of Science from the University of Chile in Santiago.
Michele Fontanot 3M Food Safety, Latin America

Environmental Monitoring Handbook - About the Contributors
105
Thomas Grace is CEO of Bia Diagnostics, one the leading food allergen testing laboratories in North America. Grace holds an honorary position in the Department of Pharmacology at the University of Vermont Medical School. He has worked in various fields from cancer research at Dartmouth College and the University of Vermont Medical Schools, to developing cutting-edge methodologies in microarray and SPR technologies. Grace has co-authored numerous scientific papers, ranging from cellular signal transduction and oncogene regulation to SPR application in quantification of folic acid in foods.
Thomas GraceBia Diagnostics
Dr. Lone Jespersen is principal and founder of Cultivate, an organization dedicated to helping global food manufacturers make safe, great-tasting food through cultural effectiveness. She has significant experience with food manufacturing, having previously spent 11 years with Maple Leaf Foods leading the execution of the company’s food safety strategy and operations learning strategy. Dr. Jespersen holds a Master’s degree in mechanical engineering from Syd Dansk University, Denmark, a Master of Science in food science from the University of Guelph, Canada and a Ph.D. in culture- enabled food safety with Dr. Mansel Griffiths at the University of Guelph, Canada.
Lone Jespersen, Ph.D.Cultivate
Gareth Lang is the professional services manager of Western Europe for 3M Food Safety. With experience in a variety of technical and professional microbiological service roles, he trains and supports a wide range of food and beverage customers and distributors, working closely with their technical teams to address immediate needs and understand emerging issues that aid in the development of new products and services that improve food safety control. Lang studied medical laboratory sciences at Cardiff University, specializing in medical microbiology.
Gareth Lang 3M Food Safety, Europe

Environmental Monitoring Handbook - About the Contributors
106
Cari Lingle is a global technical service microbiologist for at 3M Food Safety specializing in 3M™ Petrifilm™ Plate products. Located in St. Paul, Minn., she provides expert-level technical support and education for 3M Food Safety’s sales, marketing and manufacturing teams, as well as local technical and professional services. Lingle received a Bachelor of Science degree in microbiology from North Dakota State University and a Master of Science in cellular and molecular biology from the University of Missouri-Kansas City.
Cari Lingle 3M Food Safety
Dr. Gabriela Lopez Velasco, based in St. Paul, Minn., has been a senior microbiologist at 3M Food Safety since 2015. She works with the global technical services and application engineer teams leveraging her expertise in food safety to provide technical training and application of the 3M Food Safety portfolio. She currently oversees the 3M™ Allergen Testing platform. She received her doctorate degree in food science and technology from Virginia Polytechnic Institute and State University and worked as a postdoctoral researcher at the University of California, Davis.
Gabriela Lopez Velasco, Ph.D.3M Food Safety
Louise Roberts is the founder and managing director of Alimenti Food Sciences Ltd, an independent food technical consultancy. With a background in microbiology, technical management and supply chain management, Roberts has worked in the manufacturing, retail and food service aspects of the food supply chain. Her professional interests focus on food safety and compliance as well as food fraud and how businesses can protect themselves. She studied applied biology at Plymouth Polytechnic and has an honours degree in microbiology from Polytechnic of North East London. She also holds a post-graduate certificate of education from the University of Worcester and is a Chartered Scientist.
Louise Roberts Alimenti Food Sciences Ltd

Environmental Monitoring Handbook - About the Contributors
107
Dr. Abigail Snyder is an assistant professor at The Ohio State University’s College of Food, Agricultural, and Environmental Sciences. Her research focuses on characterization of spoilage microorganisms and evaluation of methods appropriate for their control. Snyder also works with industry through OSU Extension to provide training and technical support. She completed her doctorate degree at Cornell University.
Abigail Snyder, Ph.D.The Ohio State University
Genevieve Sullivan is a graduate student working toward a doctoral degree in food science at Cornell University. Her current project involves the development of Listeria control strategies for produce facilities by designing, implementing, and evaluating Listeria pathogen environmental monitoring (PEM) and “seek and destroy” programs, utilizing data from whole genome sequencing. Sullivan received a Bachelor of Science in food science from Cornell University.
Genevieve Sullivan Cornell University
Dr. Kelly Stevens is the senior manager for the Global Operations Food Safety and Regulatory team at General Mills. She is accountable for global food safety and regulatory compliance, is a FSPCA Trainer of Trainers and served as General Mills’ FSMA implementation team lead. Stevens joined General Mills in 2004 and has held varying roles in the quality organization, including three field assignments: quality engineering and quality manager, manager of microbiology and quality manager of premiums, licensing and sampling activities. She received M.S. and Ph.D. degrees in food science from North Carolina State University.
Kelly Stevens, Ph.D. General Mills

Environmental Monitoring Handbook - About the Contributors
108
Dr. Martin Wiedmann is the Gellert Family Professor in Food Safety at Cornell University’s College of Agriculture and Life Sciences. With training as both a veterinarian and food scientist, Wiedmann’s academic programs emphasize a comprehensive and interdisciplinary farm-to-table approach to food safety. His research focuses on the transmission and systems biology of bacterial foodborne pathogens and spoilage organisms, and involves the application of a variety of disciplines and collaboration across multiple institutions. He received his veterinary degree and doctorate in veterinary medicine from the Ludwig Maximilian University of Munich, and his Ph.D. in food science from Cornell University.
Martin Wiedmann, Dr. Med. Vet, Ph.D.Cornell University
Dr. Randy Worobo is a professor of food microbiology at the Cornell University College of Agriculture and Life Sciences. The primary objective of his research is alternative approaches to enhance the safety and quality of food, and includes microbial spoilage of foods and beverages, non-thermal processing alternatives for juice and beverages, as well as pathogen transmission and survival on fruits and vegetables. Worobo also engages with the industry through his extensive outreach program, which is accomplished through workshops, conferences and direct contact with food processors around the world. He received his Ph.D. from the University of Alberta.
Randy Worobo, Ph.D. Cornell University
Dr. Burcu Yordem is a senior global technical service scientist at 3M Food Safety overseeing technologies such as the 3M™ Clean-Trace™ Hygiene Monitoring and Management System. Located in St. Paul, Minn., she provides expert-level global technical support for 3M Food Safety’s customers, as well as sales, marketing and manufacturing teams. Yordem received a doctorate degree in crop molecular genetics from the University of Massachusetts, Amherst and held a postdoctoral position at USDA-ARS Cereal Disease Laboratory.
Burcu Yordem, Ph.D. 3M Food Safety

Environmental Monitoring Handbook - About the Contributors
109
John David is the global scientific marketing manager at 3M Food Safety, based in St. Paul, Minn. David leads global customer education initiatives and the creation of impactful scientific content in partnership with industry experts. He has expertise in molecular biology and microbiology, and has held previous roles in diagnostic assay development, systems integration and new product commercialization. David earned both a Bachelor of Science in biotechnology and a Master of Science in molecular biology and genetics at the University of Delaware.
EDITOR
John David3M Food Safety
Scott Egan is the technical specialist for 3M Food Safety Australia/New Zealand. In this role, he keeps abreast of local regulations, emerging trends and industry best practices to help support the local industry while also providing expert support for 3M’s portfolio of food safety products. His undergraduate degree in biomedical science was received from the University of Western Sydney, and he has previously worked in pathology and industrial microbiology laboratories and held quality control, research and development and process improvement roles for the manufacture of diagnostic assays.
EDITOR
Scott Egan 3M Food Safety, Australia

The 3M Environmental Monitoring Handbook is intended to provide general guidance only. The technical information, recommendations and other statements contained in this document are based on experience and information that 3M believes to be reliable, but the accuracy or completeness of such information is not guaranteed. Such information is intended for persons with knowledge and technical skills sufficient to assess and apply their own informed judgement to the information, taking into consideration the nature of their business, existing policies and particular laws and regulations that might apply.
Learn more about environmental monitoring at www.3M.com/EnvironmentalMonitoring
3M Food Safety3M Center, Building 275-5W-05St. Paul, MN 55144-1000 USAPhone 1-800-328-65533M.com/foodsafety
3M CanadaPost Office Box 5757London, Ontario N6A 4T1 Canada
Phone 1-800-364-3577
©3M 2019. All rights reserved. 3M, Clean-Trace and Petrifilm are trademarks of 3M. Used under license in Canada Please recycle. Printed in U.S.A.
70-2011-5169-6