Embed Size (px)
Citation preview
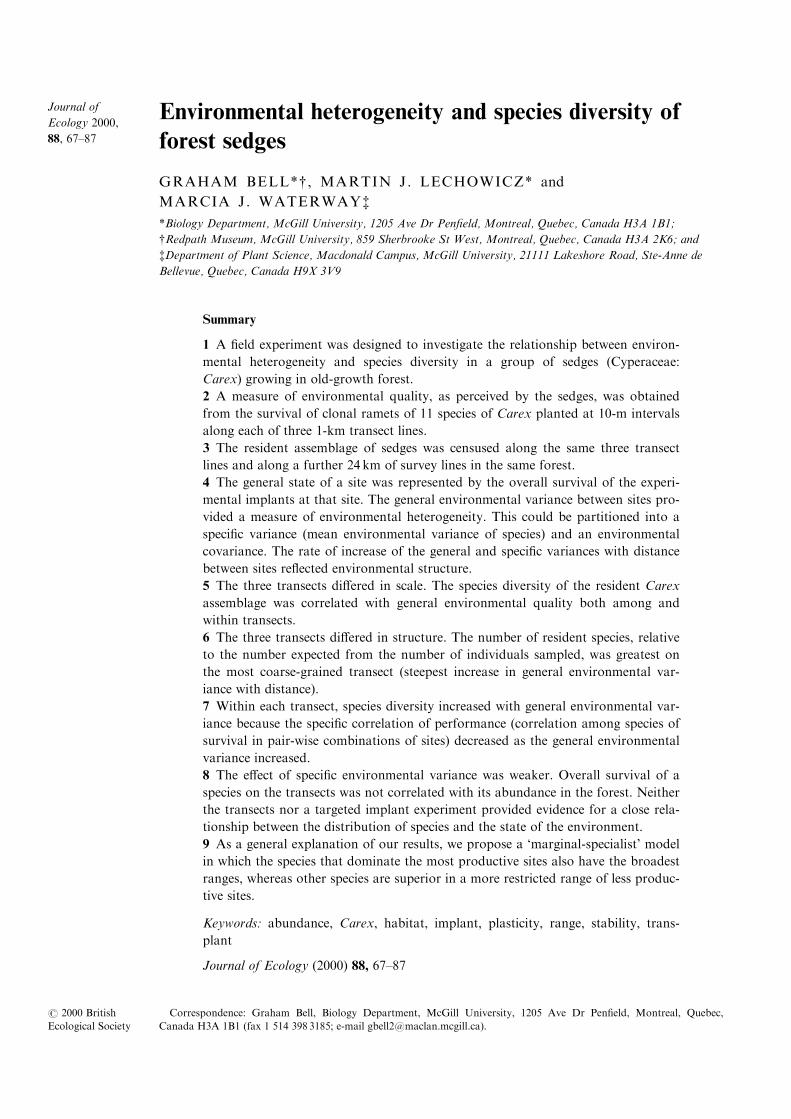
Environmental heterogeneity and species diversity of
forest sedges
GRAHAM BELL*{ , MARTIN J. LECHOWICZ* and
MARCIA J. WATERWAY{*Biology Department, McGill University, 1205 Ave Dr Pen®eld, Montreal, Quebec, Canada H3A 1B1;
{Redpath Museum, McGill University, 859 Sherbrooke St West, Montreal, Quebec, Canada H3A 2K6; and
{Department of Plant Science, Macdonald Campus, McGill University, 21111 Lakeshore Road, Ste-Anne de
Bellevue, Quebec, Canada H9X 3V9
Summary
1 A ®eld experiment was designed to investigate the relationship between environ-
mental heterogeneity and species diversity in a group of sedges (Cyperaceae:
Carex) growing in old-growth forest.
2 A measure of environmental quality, as perceived by the sedges, was obtained
from the survival of clonal ramets of 11 species of Carex planted at 10-m intervals
along each of three 1-km transect lines.
3 The resident assemblage of sedges was censused along the same three transect
lines and along a further 24 km of survey lines in the same forest.
4 The general state of a site was represented by the overall survival of the experi-
mental implants at that site. The general environmental variance between sites pro-
vided a measure of environmental heterogeneity. This could be partitioned into a
speci®c variance (mean environmental variance of species) and an environmental
covariance. The rate of increase of the general and speci®c variances with distance
between sites re¯ected environmental structure.
5 The three transects di�ered in scale. The species diversity of the resident Carex
assemblage was correlated with general environmental quality both among and
within transects.
6 The three transects di�ered in structure. The number of resident species, relative
to the number expected from the number of individuals sampled, was greatest on
the most coarse-grained transect (steepest increase in general environmental var-
iance with distance).
7 Within each transect, species diversity increased with general environmental var-
iance because the speci®c correlation of performance (correlation among species of
survival in pair-wise combinations of sites) decreased as the general environmental
variance increased.
8 The e�ect of speci®c environmental variance was weaker. Overall survival of a
species on the transects was not correlated with its abundance in the forest. Neither
the transects nor a targeted implant experiment provided evidence for a close rela-
tionship between the distribution of species and the state of the environment.
9 As a general explanation of our results, we propose a `marginal-specialist' model
in which the species that dominate the most productive sites also have the broadest
ranges, whereas other species are superior in a more restricted range of less produc-
tive sites.
Keywords: abundance, Carex, habitat, implant, plasticity, range, stability, trans-
plant
Journal of Ecology (2000) 88, 67±87
Correspondence: Graham Bell, Biology Department, McGill University, 1205 Ave Dr Pen®eld, Montreal, Quebec,
Canada H3A 1B1 (fax 1 514 398 3185; e-mail [email protected]).
Journal of
Ecology 2000,
88, 67±87
# 2000 British
Ecological Society
Introduction
The diversity of ecologically similar organisms that
live together has for long been a central issue in
community ecology. The best adapted species should
long ago have replaced all the others, unless the pro-
cess of replacement through competition is continu-
ally obstructed or interrupted. In a heterogeneous
environment where patches o�er di�erent conditions
for growth, or have been disturbed at di�erent times
in the past, competitive exclusion is likely to be very
slow, and might never reach completion (Palmer
1994). More heterogeneous environments would
then be expected to support a greater number of
species (Williams 1964), as many studies have
reported (see general reviews by Shmida & Wilson
1985; Auerbach & Shmida 1987; Hart & Horwitz
1991; Cornell & Lawton 1992; Shorrocks &
Sevenster 1995).
Species diversity seems to be related to the struc-
tural complexity of the environment in many di�er-
ent kinds of system. Early work by MacArthur
showed that bird species diversity is related to the
vertical heterogeneity of the canopy (MacArthur
1958, 1964; Recher 1969). In a rather similar way,
the number of species of soil mites increases with
the complexity of the soil pro®le (Anderson 1978).
Insect diversity is related to the structural or archi-
tectural diversity of their plant hosts (Murdoch et al.
1972; Strong & Levin 1979; Moran 1980), and ®sh
diversity to the structural complexity of aquatic
vegetation (Tonn & Magnuson 1982). The number
of species of lizard is related to the complexity of
the physical environment in desert communities
(Pianka 1967). The diversity of the macrobiota,
although not the microbiota, of the rocky intertidal
is greater at structurally complex sites provided by
seaweed holdfasts or clumps of barnacles than on
bare rock (Thompson et al. 1996). Structural diver-
sity provided by physical or biotic features is asso-
ciated with greater diversity of several groups of
benthic marine organisms, including microbiota
(Pringle 1990), invertebrates (Hewatt 1935) and
snails (Kohn 1967). The number of species of fresh-
water snails also increases with the variety of sub-
strates available (Harman 1972). The number of
bird species increases with number of distinct habi-
tats independently of area in islands of a Finnish
archipelago (Haila 1983; Haila et al. 1983). The
number of species of mammals is greater in western
districts of North America, which are topographi-
cally more heterogeneous than central and eastern
districts (Kerr & Packer 1997). Plant species diver-
sity in the Appalachians increases with the number
of distinct communities and the number of moun-
tain peaks in the survey area, suggesting a similar
link with topographic and ecological heterogeneity
(White & Miller 1988). There is also a certain
amount of experimental evidence for the theory. For
example, Vivian-Smith (1997) manipulated microto-
pography in experimental plots and found that hum-
mock±hollow sites supported more diverse plant
assemblages than ¯at surfaces (Silvertown & Wilkin
1983). The relationship between diversity and the
heterogeneity created by disturbance has been
reviewed at length by Huston (1994).
Not all results are consistent with this view. For
example, Nilsson et al. (1988) found no relationship
between species diversity and the number of types of
habitat for woody plants, carabid beetles and land
snails on islands in a Swedish lake. Moreover, there
is a pervasive di�culty concerning the spatial scale
at which surveys are conducted. BoÈ hning-Gaese
(1997) found that bird species diversity around Lake
Constance was correlated with habitat diversity only
at sampling scales of between 4 and 36 km2, perhaps
because such moderate spatial scales correspond
with the distances over which the activity or disper-
sal of the organisms occurs. Less e�ect of habitat
diversity will be seen either at larger scales or at
smaller scales where immigration may overwhelm
competition. This may be why, in a very careful
study of plant communities of 0.1-ha plots in North
Carolina forests, Palmer (1991) found that species
diversity was related to the mean value of soil nutri-
ents such as magnesium but not to their variance
within plots. The appropriate scale for testing the
theory must therefore be chosen carefully to be
appropriate for the group of organisms being stu-
died.
We aimed to determine the most appropriate
measure of environmental heterogeneity, and to
evaluate its relationship to species diversity. The
simple approach of measuring physical variables
such as pH or nitrate concentration (Lechowicz &
Bell 1991) has the drawback that patterns of varia-
tion in physical factors cannot be translated readily
into terms of plant response. Sowing soil cores
taken from the forest with genetically uniform mate-
rial of barley and Arabidopsis (Bell & Lechowicz
1991) allows environmental variation to be
described in terms of plant response with great pre-
cision, but many of the sources of di�erence among
sites are lost by transferring the soil to the glass-
house bench. A third technique is to take seedlings
of native plants from forest sites, raise them in
exclosures, cross them to create seed families of
known provenance, and then plant the seeds back
into the parental site (Schoen et al. 1994). This is
satisfactory in principle, although in practice the
complications of sexual inheritance and the rapid
loss of a large proportion of the seeds or seedlings
make it di�cult to estimate the state of the environ-
ment with great precision. Despite their drawbacks,
all three techniques have demonstrated that the for-
est ¯oor is heterogeneous at a scale of several
metres, i.e. that there are appreciable di�erences
68Environmental
heterogeneity and
species diversity
# 2000 British
Ecological Society
Journal of Ecology,
88, 67±87
between sites 1±50 m apart. Moreover, the ®rst two
techniques have demonstrated that the forest ¯oor is
structured, i.e. that the variance among sites
increases with separation from 1 to about 50 m. The
object of this study was to use a bioassay approach
to extend our description of the structure of the for-
est ¯oor to a scale of 1 km, using the results to
address the relationship between environmental het-
erogeneity and species diversity.
A given region supports a set of ecologically
equivalent species (in the sense of Bell 1996; species
of the same functional kind, in the sense of Huston
1994), the local species pool. We wished to know
what determines the total number of species
recorded when samples are taken from several sites
within this region, and what causes variation in the
number of species among sites. Consider any two
sites, from which S1 and S2 species, respectively,
have been recorded. The number of species occur-
ring in the two sites combined (S12) will be:
S12=S1 � S2 ÿ S1S2/N ÿ (N ÿ 1) Cov (Xij, Xik)
where N is the number of species in the local pool.
The number of species in each site separately, S1and S2, is an e�ect of scale. It depends on the
number of individuals collected, and it cannot be
analysed further unless the sites can be further sub-
divided. The ®nal term on the right-hand side is the
covariance of occurrence at the two sites among
species: Xij is the occurrence of the ith species at site
j, and Xik its occurrence at the other site, k. We
shall call this the speci®c covariance; it would be
equivalent to a genetic covariance if the species were
treated as genotypes within a population. A low, or
negative, covariance indicates that the composition
of the assemblage at one site is poorly correlated, or
negatively correlated, with its composition at
another. One interpretation of a low speci®c covar-
iance of occurrence is that conditions of growth dif-
fer at the two sites, some species being well-adapted
to the ®rst site and colleagues to the second. The
covariance can then be used as a measure of envir-
onmental heterogeneity in terms of overall plant
response. It can be thought of as quantifying the
concept of among-site or beta diversity (Whittaker
1970), so that the decay of the covariance with dis-
tance measures the `turnover' of assemblage compo-
sition.
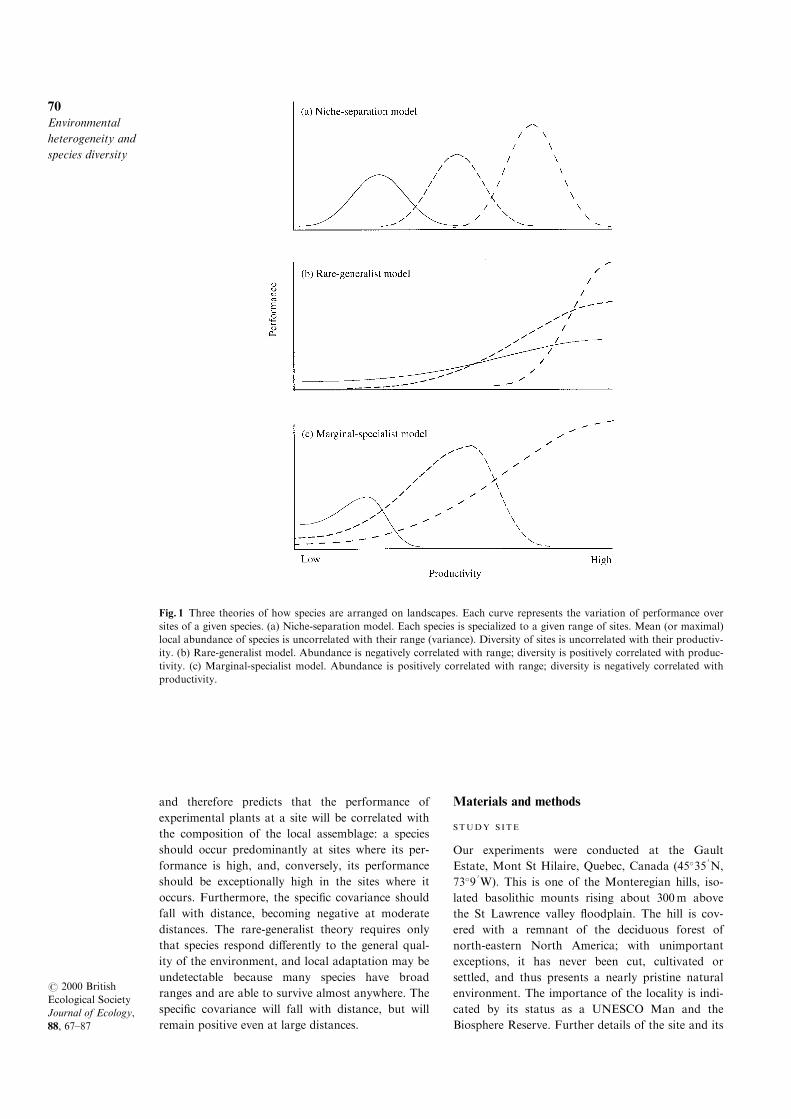
There are at least two competing interpretations
of how species diversity is maintained in spatially
heterogeneous environments, illustrated in the two
upper panels of Fig. 1. The x-axis of each diagram
represents an environmental gradient of some kind,
in this case productivity, so that separation along
this axis represents environmental variance. The y-
axis represents the performance of a given species.
Performance, as used here, is best de®ned as the rate
at which this species increases in frequency in a mix-
ture, but in practice it will usually be de®ned in
terms of the survival, growth or reproduction of iso-
lated plants or pure stands. Although this is often
the only practicable approach, it may be inadequate
when populations are so dense that individuals of
di�erent species compete directly. In the classical
`niche-separation' model (Fig. 1a), each species is
specialized for thriving in a restricted range of con-
ditions, so that species di�er in their mean location
along the environmental axis. The height of its dis-
tribution at any given point represents the perfor-
mance of a species at a given state of the
environment, and the state to which the species is
best adapted is marked by its peak performance.
The variance of each distribution is proportional to
the ecological range occupied by the species; species
do not di�er consistently in range, or at least range
is not correlated with peak performance. Environ-
mental heterogeneity thus sustains species diversity
through local adaptation to qualitatively di�erent
conditions of growth at di�erent sites. In contrast,
in the `rare-generalist' model all species have their
peak performance at the same environmental state
(high productivity), but di�er in variance; peak per-
formance is negatively correlated with variance, so
the species that dominate the most productive sites
have narrow ranges. The most productive sites are
dominated by the most responsive species, which are
best able to exploit favourable conditions of growth,
whereas other species are more stable, being able to
maintain themselves even in unproductive sites. A
third hypothesis, the `marginal-specialist' model, will
be discussed later. Recent accounts of ecological
specialization and variation in plant assemblages
include Sultan et al. (1998) and Svenning (1999).
In both cases, the species±sites interaction of per-
formance is supposed to lead to a process of selec-
tion that sorts species into the sites to which they
are best adapted, and this causes the observed spe-
cies±sites interaction of occurrence. Both theories
predict that species diversity will increase with the
area sampled. This will be in part an e�ect of scale,
because the number of individuals encountered will
increase with area, and in part an e�ect of structure,
because environmental variance will increase with
area. It is possible to distinguish the two; the inge-
nious analysis of forest plant communities by
Palmer & White (1994), for example, showed that
about two-thirds of the overall increase in species
diversity with area was a pure scale e�ect, the
remainder being attributable to function. Both the-
ories predict a pure e�ect of structure independently
of scale: the combined species diversity of two sites
will increase with their distance apart.
Given an objective measure of environmental het-
erogeneity, we would be able to evaluate its relation-
ship with species diversity. The niche-separation
theory requires a high degree of local adaptation,
69G. Bell,
M.J. Lechowicz
& M.J. Waterway
# 2000 British
Ecological Society
Journal of Ecology,
88, 67±87
and therefore predicts that the performance of
experimental plants at a site will be correlated with
the composition of the local assemblage: a species
should occur predominantly at sites where its per-
formance is high, and, conversely, its performance
should be exceptionally high in the sites where it
occurs. Furthermore, the speci®c covariance should
fall with distance, becoming negative at moderate
distances. The rare-generalist theory requires only
that species respond di�erently to the general qual-
ity of the environment, and local adaptation may be
undetectable because many species have broad
ranges and are able to survive almost anywhere. The
speci®c covariance will fall with distance, but will
remain positive even at large distances.
Materials and methods
STUDY S ITE
Our experiments were conducted at the Gault
Estate, Mont St Hilaire, Quebec, Canada (45�350N,
73�90W). This is one of the Monteregian hills, iso-
lated basolithic mounts rising about 300m above
the St Lawrence valley ¯oodplain. The hill is cov-
ered with a remnant of the deciduous forest of
north-eastern North America; with unimportant
exceptions, it has never been cut, cultivated or
settled, and thus presents a nearly pristine natural
environment. The importance of the locality is indi-
cated by its status as a UNESCO Man and the
Biosphere Reserve. Further details of the site and its
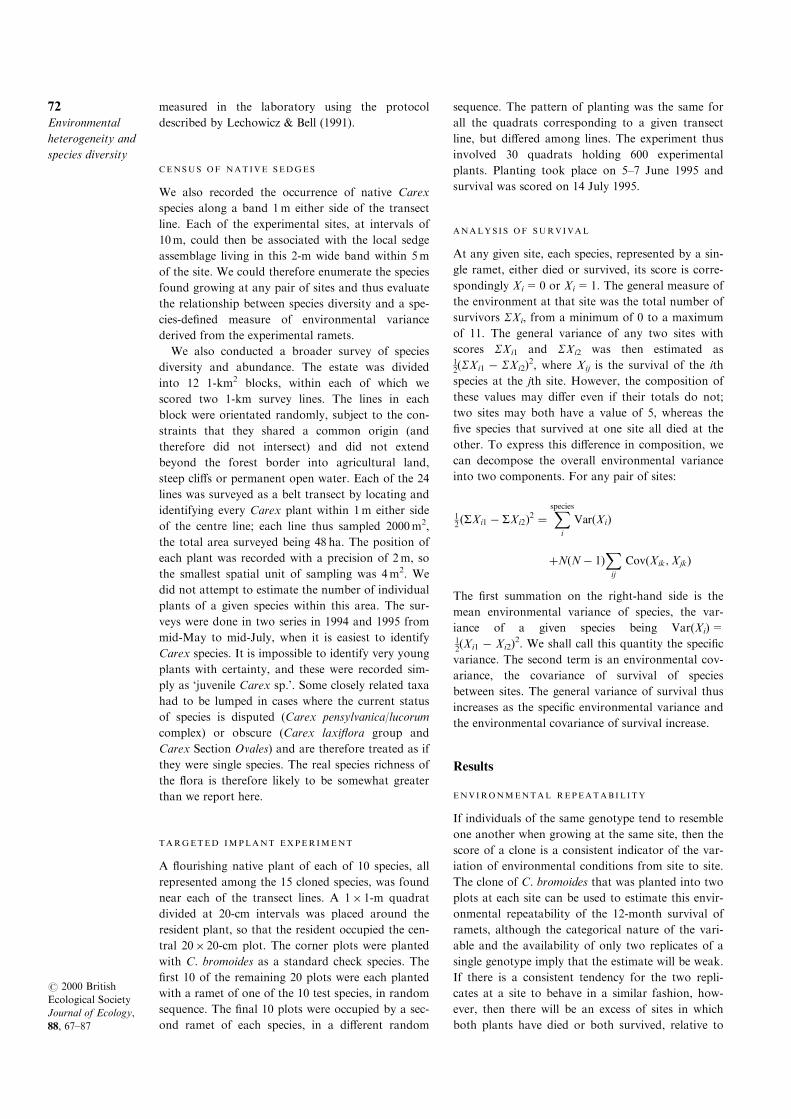
Fig. 1 Three theories of how species are arranged on landscapes. Each curve represents the variation of performance over
sites of a given species. (a) Niche-separation model. Each species is specialized to a given range of sites. Mean (or maximal)
local abundance of species is uncorrelated with their range (variance). Diversity of sites is uncorrelated with their productiv-
ity. (b) Rare-generalist model. Abundance is negatively correlated with range; diversity is positively correlated with produc-
tivity. (c) Marginal-specialist model. Abundance is positively correlated with range; diversity is negatively correlated with
productivity.
70Environmental
heterogeneity and
species diversity
# 2000 British
Ecological Society
Journal of Ecology,
88, 67±87
¯ora are given by Maycock (1961), Ouellet &
LeBlanc (1967) and Holland (1981), and a bibliogra-
phy of research conducted on the mountain has
been published by Levy & Lechowicz (1987).
TRANSECT LINES
We laid out three base ropes, each 1 km in length, in
a remote part of the forest where public access was
prohibited. Two transects (Gorge and Cli� trans-
ects) extended east±west and north±south from a
common origin through upland forest. The third
(Lake transect) ran through a wetter area alongside
the shore of a small lake and formed most of the
third side of the triangle. Side ropes 5m in length
were then strung normal to the base rope, and to
one side of it, at 10-m intervals. We then used small
plastic stakes to de®ne 20 planting positions along
each side rope, alternately to right and left of the
rope, such that no plot was closer than 50 cm to
another. Great care was taken to minimize tram-
pling, and all routine activities were con®ned to the
side of the main rope away from the side ropes.
STUDY SPECIES
Sedges in the genus Carex (Cyperaceae) provide
exceptionally appropriate material for investigations
of diversity. There are more species of Carex than
of any other genus of seed plants in most forest and
wetland habitats in temperate and subarctic regions:
of about 2000 species world-wide, about 500 occur
in North America and over 50 have been recorded
from the 1000-ha of our study site. Furthermore,
they can be propagated as genetically uniform
clones by vegetative proliferation of material col-
lected in the forest, and the ramets can then be used
as biological indicators of the state of the environ-
ment at di�erent sites. This provides estimates of
environmental heterogeneity as perceived by native
plants, which are likely to be superior to those
derived from measurements of physical variables
because they relate directly to the variation in per-
formance on which both the niche-separation and
rare-generalist models are based. They are, however,
much more laborious to obtain. We planted ramets
of several species of Carex at regular intervals along
three transects each 1 km in length. The measure of
the state of the environment was the survival of
these ramets after 12months.
EXPERIMENTAL PROCEDURES
Several large healthy plants of each of 15 Carex spe-
cies were collected in the forest at Mont St Hilaire
and dissociated carefully into ramets, which were
then grown individually in potting soil with regular
watering and fertilization in a shade house at the
McGill University Field Station at Mont St Hilaire.
When large enough, they were again dissociated,
and this procedure continued until we had obtained
about 120 healthy ramets from a single parental
plant; enough, with allowance for loss, to furnish
the 100 sites on one of the three transects. The
experimental ramets were isolated and grown in
1� 1� 2.5-cm cubes of potting soil in a seed tray
until ®rmly rooted. They were then taken to a trans-
ect and one inserted into a single planting position
at each of the 10-m sites and marked with a labelled
plastic tag. We took pains not to disturb the sites in
any way, other than excavating a small hole in the
centre of each plot to receive the soil plug bearing
the experimental ramet. For logistic reasons, a spe-
cies was assigned the same position at each site on a
given transect; however, positions for a given species
were assigned independently on the three transects.
Although a total of 15 species was used in these
experiments, only 11 were common to all three
transects (see the Results). In general, a di�erent
clone of each species was planted on each transect,
in order to complete the experiments within a rea-
sonable period of time. The exception was an unu-
sually proli®c clone of Carex bromoides, which
supplied enough material to set out two replicate
ramets at each site on all three transects. These
ramets were used to estimate the repeatability of our
scores, and are not included in the analyses of envir-
onmental structure, for which other clones of C.
bromoides were available. Planting was carried out
in 1993 and 1994 as material became available, and
the plants were scored for survival 12 months later.
Although more elaborate measurements are possi-
ble, the rapid loss of many of these implants under
®eld conditions reduces their usefulness. The proce-
dure provides information about the response of
each species to environmental variation, but in this
study we were concerned only with the bulk
response of the set of species; the particular response
of individual species will be analysed in a subse-
quent paper. Di�erences between 1993 and 1994,
and between spring (May) and autumn (August)
planting dates, would contribute to the variation
among species on a given transect, or among trans-
ects for a given species, but would not contribute to
the variation among sites within a transect.
PHYS ICAL FACTORS
Various physical features of the environment were
scored at every other site, i.e. at 20-m intervals.
Those analysed here were three scalar variables:
canopy cover, ground cover and soil pH. Canopy
cover vertically above the site was estimated on a
10-point scale in July. At the same time, the fraction
of the ground surface covered by dead leaves was
estimated, again on a 10-point scale. Soil pH was
71G. Bell,
M.J. Lechowicz
& M.J. Waterway
# 2000 British
Ecological Society
Journal of Ecology,
88, 67±87
measured in the laboratory using the protocol
described by Lechowicz & Bell (1991).
CENSUS OF NATIVE SEDGES
We also recorded the occurrence of native Carex
species along a band 1m either side of the transect
line. Each of the experimental sites, at intervals of
10m, could then be associated with the local sedge
assemblage living in this 2-m wide band within 5m
of the site. We could therefore enumerate the species
found growing at any pair of sites and thus evaluate
the relationship between species diversity and a spe-
cies-de®ned measure of environmental variance
derived from the experimental ramets.
We also conducted a broader survey of species
diversity and abundance. The estate was divided
into 12 1-km2 blocks, within each of which we
scored two 1-km survey lines. The lines in each
block were orientated randomly, subject to the con-
straints that they shared a common origin (and
therefore did not intersect) and did not extend
beyond the forest border into agricultural land,
steep cli�s or permanent open water. Each of the 24
lines was surveyed as a belt transect by locating and
identifying every Carex plant within 1m either side
of the centre line; each line thus sampled 2000m2,
the total area surveyed being 48 ha. The position of
each plant was recorded with a precision of 2m, so
the smallest spatial unit of sampling was 4m2. We
did not attempt to estimate the number of individual
plants of a given species within this area. The sur-
veys were done in two series in 1994 and 1995 from
mid-May to mid-July, when it is easiest to identify
Carex species. It is impossible to identify very young
plants with certainty, and these were recorded sim-
ply as `juvenile Carex sp.'. Some closely related taxa
had to be lumped in cases where the current status
of species is disputed (Carex pensylvanica/lucorum
complex) or obscure (Carex laxi¯ora group and
Carex Section Ovales) and are therefore treated as if
they were single species. The real species richness of
the ¯ora is therefore likely to be somewhat greater
than we report here.
TARGETED IMPLANT EXPERIMENT
A ¯ourishing native plant of each of 10 species, all
represented among the 15 cloned species, was found
near each of the transect lines. A 1� 1-m quadrat
divided at 20-cm intervals was placed around the
resident plant, so that the resident occupied the cen-
tral 20� 20-cm plot. The corner plots were planted
with C. bromoides as a standard check species. The
®rst 10 of the remaining 20 plots were each planted
with a ramet of one of the 10 test species, in random
sequence. The ®nal 10 plots were occupied by a sec-
ond ramet of each species, in a di�erent random
sequence. The pattern of planting was the same for
all the quadrats corresponding to a given transect
line, but di�ered among lines. The experiment thus
involved 30 quadrats holding 600 experimental
plants. Planting took place on 5±7 June 1995 and
survival was scored on 14 July 1995.
ANALYS IS OF SURVIVAL
At any given site, each species, represented by a sin-
gle ramet, either died or survived, its score is corre-
spondingly Xi=0 or Xi=1. The general measure of
the environment at that site was the total number of
survivors SXi, from a minimum of 0 to a maximum
of 11. The general variance of any two sites with
scores SXi1 and SXi2 was then estimated as12(SXi1 ÿ SXi2)
2, where Xij is the survival of the ith
species at the jth site. However, the composition of
these values may di�er even if their totals do not;
two sites may both have a value of 5, whereas the
®ve species that survived at one site all died at the
other. To express this di�erence in composition, we
can decompose the overall environmental variance
into two components. For any pair of sites:
12 �SXi1 ÿ SXi2�2 �
Xspecies
i
Var�Xi�
�N�Nÿ 1�Xij
Cov�Xik;Xjk�
The ®rst summation on the right-hand side is the
mean environmental variance of species, the var-
iance of a given species being Var(Xi)=12(Xi1 ÿ Xi2)
2. We shall call this quantity the speci®c
variance. The second term is an environmental cov-
ariance, the covariance of survival of species
between sites. The general variance of survival thus
increases as the speci®c environmental variance and
the environmental covariance of survival increase.
Results
ENVIRONMENTAL REPEATABIL ITY
If individuals of the same genotype tend to resemble
one another when growing at the same site, then the
score of a clone is a consistent indicator of the var-
iation of environmental conditions from site to site.
The clone of C. bromoides that was planted into two
plots at each site can be used to estimate this envir-
onmental repeatability of the 12-month survival of
ramets, although the categorical nature of the vari-
able and the availability of only two replicates of a
single genotype imply that the estimate will be weak.
If there is a consistent tendency for the two repli-
cates at a site to behave in a similar fashion, how-
ever, then there will be an excess of sites in which
both plants have died or both survived, relative to
72Environmental
heterogeneity and
species diversity
# 2000 British
Ecological Society
Journal of Ecology,
88, 67±87
the expected frequency of such sites, given that sur-
vival or death occur at random. Chi-square analysis
showed that this occurred on all three transects and
was highly signi®cant when data from all three
transects were pooled (Table 1). A single-classi®ca-
tion analysis of variance yields estimates of the
among-site or environmental variance s2E and the
within-site or error variance s2e . A quantitative mea-
sure of correlation can then be obtained as the intra-
class correlation coe�cient s2E=�s2E � s2e). It was
moderately large (0.46) on the Lake transect, smaller
(0.24, 0.18) on the other two, and again moderately
large (0.45) in the pooled data.
The overall survival of the set of 11 species can be
used to predict the diversity of the resident assem-
blage in two ways. First, diversity might vary with
scale: there should be more species where there are
more individuals. Sites with high ramet survival
should have many resident individuals and therefore
many resident species. Secondly, diversity might
vary with structure: combinations of sites with
greater environmental variance of survival may sup-
port more resident species. We can also distinguish
between general and speci®c e�ects. Both scale and
structure may refer to the general (overall) survival
of the set of 11 experimental species, or to the speci-
®c survival of each of these species.
GENERAL ENVIRONMENTAL QUALITY
Overall mean survival
The number of surviving individuals of each species
on each transect is given in Table 2. Overall annual
survival was 1166/3300=0.353. This may be com-
pared with the density of natural populations. In
any given area, the number of resident plants np will
be the product of the annual number of incomers niand their annual survival rate u, summed over years:
np � niX1x�1
ux � niu=�1ÿ u�
This number will vary with scale, but there will be
some characteristic dispersal scale at which a single
incomer appears every year, to yield a mean density
of u/(1 ÿ u), equal to 0.546 for our experimental
data. (The incomer is in this case a ramet that has
not only reached a site but has succeeded in estab-
lishing itself there.) The census of the native Carex
¯ora yielded a total of 5460 records (of adult plants
identi®ed to species and of unidenti®ed juveniles)
from 3364 plots. Although each record represented
the presence or absence of a species in the plot
rather than the number of individuals, because vege-
tative growth made it impracticable to recognize or
count individuals where stems were close together,
there was usually only a single individual per plot.
The mean density of records at this scale was thus
5460/12 000=0.455. This was quite close to the
expected value, suggesting that, by chance, our sam-
pling unit of 2� 2m corresponded rather closely to
the characteristic dispersal scale of Carex ramets. If
dispersal were random, one would expect a fraction
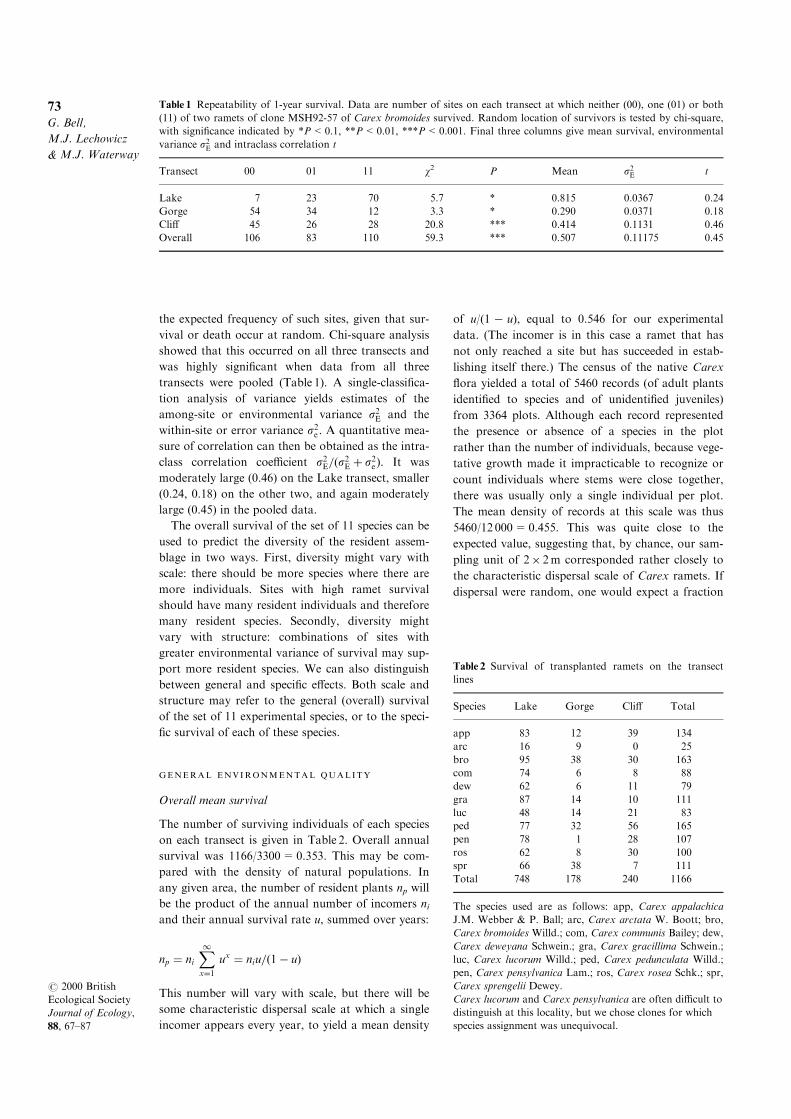
Table 1 Repeatability of 1-year survival. Data are number of sites on each transect at which neither (00), one (01) or both
(11) of two ramets of clone MSH92-57 of Carex bromoides survived. Random location of survivors is tested by chi-square,
with signi®cance indicated by *P<0.1, **P<0.01, ***P<0.001. Final three columns give mean survival, environmental
variance s2E and intraclass correlation t
Transect 00 01 11 w2 P Mean s2E t
Lake 7 23 70 5.7 * 0.815 0.0367 0.24
Gorge 54 34 12 3.3 * 0.290 0.0371 0.18
Cli� 45 26 28 20.8 *** 0.414 0.1131 0.46
Overall 106 83 110 59.3 *** 0.507 0.11175 0.45
Table 2 Survival of transplanted ramets on the transect
lines
Species Lake Gorge Cli� Total
app 83 12 39 134
arc 16 9 0 25
bro 95 38 30 163
com 74 6 8 88
dew 62 6 11 79
gra 87 14 10 111
luc 48 14 21 83
ped 77 32 56 165
pen 78 1 28 107
ros 62 8 30 100
spr 66 38 7 111
Total 748 178 240 1166
The species used are as follows: app, Carex appalachica
J.M. Webber & P. Ball; arc, Carex arctata W. Boott; bro,
Carex bromoides Willd.; com, Carex communis Bailey; dew,
Carex deweyana Schwein.; gra, Carex gracillima Schwein.;
luc, Carex lucorum Willd.; ped, Carex pedunculata Willd.;
pen, Carex pensylvanica Lam.; ros, Carex rosea Schk.; spr,
Carex sprengelii Dewey.
Carex lucorum and Carex pensylvanica are often di�cult to
distinguish at this locality, but we chose clones for which
species assignment was unequivocal.
73G. Bell,
M.J. Lechowicz
& M.J. Waterway
# 2000 British
Ecological Society
Journal of Ecology,
88, 67±87
1 ÿ eÿ 0.455=0.366 of the plots to be occupied by
at least one Carex species. The actual value of 3364/
12 000=0.280 was rather lower, indicating that
Carex tends to be rather strongly aggregated.
Abundance and diversity
Survival varied among species and among transects
(Table 2). Variance among species is relevant to the
problem of abundance: to what extent can the abun-
dance of species in the resident assemblage be pre-
dicted from their performance on the transects?
Variance among transects, or among sites within
transects, is relevant to the problem of diversity: to
what extent can the diversity of the resident assem-
blage be predicted from environmental quality or
environmental heterogeneity as measured by the
transect material?
Species diversity among the transects
The extended quantitative survey of Carex assem-
blages on 24 1-km lines yielded a total of 4758 iden-
ti®able adult individuals belonging to 27 species,
with an average of 12.08 species per line. A similar
survey was carried out along the transects. This
yielded 380 identi®able individuals belonging to 20
species, including nine of the set of 11 species used
to estimate environmental variance. The relationship
between the number of species S and the number of
individuals s among the survey lines was found to
be: logS=0.201 log s � 0.636. The predicted num-
ber of species in a sample of 380 individuals is thus
14.3. The observed excess was largely attributable to
the Lake transect, which had many more species
than predicted (17 vs. 12).
Species diversity and environmental quality
All pair-wise comparisons among the transect lines
showed signi®cant di�erences in total survival at
P<0.01. Survival was much greater on the Lake
transect (u=0.680) than on either of the other two,
the Cli� transect (u=0.218) having a somewhat
greater value than the Gorge transect (u=0.162).
Variation in observed species diversity, relative to
that expected from the number of individuals
scored, was therefore related to variation in environ-
mental quality among transects.
Overall survival also varied from site to site
within each transect (Fig. 2). The correlation
between the number of experimental plants surviv-
ing at a site and the number of individuals or species
of resident plants found at that site was positive and
signi®cant (or very close to signi®cance, at P=0.05)
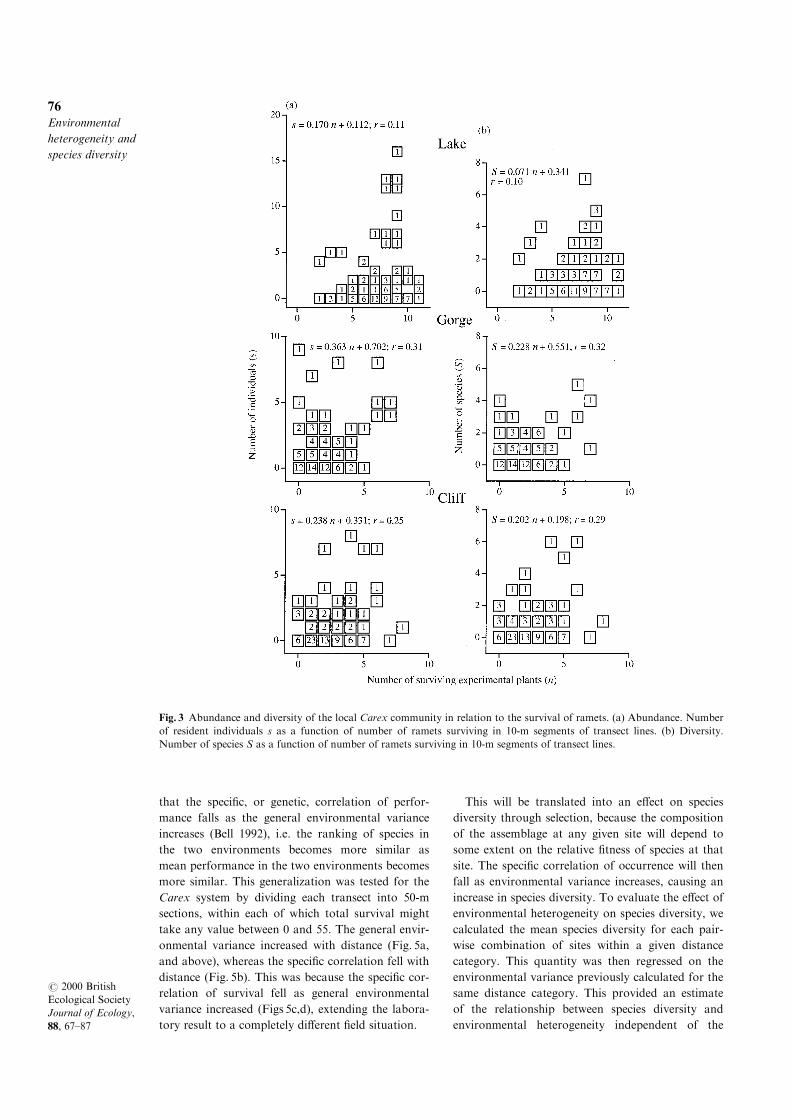
on all three transects (Fig. 3). This demonstrated
some degree of correspondence between plant
response and the native assemblage at a scale of
10m. The correlations were uniformly weak, how-
ever, with shallow slopes and positive intercepts.
General environmental structure
The spatial structure of the environment is expressed
by the way in which the overall environmental var-
iance increases with distance. We regressed log var-
iance, V, on log distance, D, for equal log distance
intervals for all possible pair-wise combinations of
sites to estimate the slope of the power law,
V= aDz (Bell et al. 1993). The null hypothesis of no
systematic tendency for variance to increase with
distance was constructed by re-allocating the 100
values of overall survival to sites at random, then
regressing log variance on log distance; repeating
this simulation 100 times gave a slope and standard
deviation expressing the structure of a random
environment. In all cases, this procedure yielded a
mean value of slope close to zero, as expected. The
slope of the data was positive and signi®cant
(P<0.01) on all three transects, showing them to
be structured on scales between 10m and 1000m
(Fig. 4). However, the slope was much greater on
the Cli� (z= �0.156) and Lake (z= � 0.128)transects than on the Gorge transect (z= �0.065).At a scale of 10m, the Lake and Gorge transects
had about equal variance, and both were more vari-
able than the Cli� transect. Because variance
increased sharply with distance on the Cli� and
Lake transects, but not on the Gorge, the Lake
transect was more variable above 100±200m than
either the Cli� or the Gorge transects, which were
similar at this scale. Another way of expressing this
is to say that the Lake and Cli� transects were rela-
tively coarse-grained, the Lake being the more het-
erogeneous at all scales, whereas the Gorge transect
was a more ®ne-grained environment.
Physical factors
The heterogeneity and structure of the three trans-
ects with respect to canopy cover, ground cover and
soil pH are summarized in Table 3. The ranking of
the transects varied according to the factor consid-
ered. The Lake was the most variable for soil pH,
the Cli� for ground cover, and the Gorge for
canopy cover. The regressions for ground cover and
soil pH were steeper on the Cli� transect than on
the other two, but for canopy cover the regression
was steepest on the Gorge transect.
Species diversity and environmental structure within
the transects
The response of species diversity to environmental
structure hinges on the behaviour of the speci®c cov-
ariance. Laboratory studies of microbes have shown
74Environmental
heterogeneity and
species diversity
# 2000 British
Ecological Society
Journal of Ecology,
88, 67±87
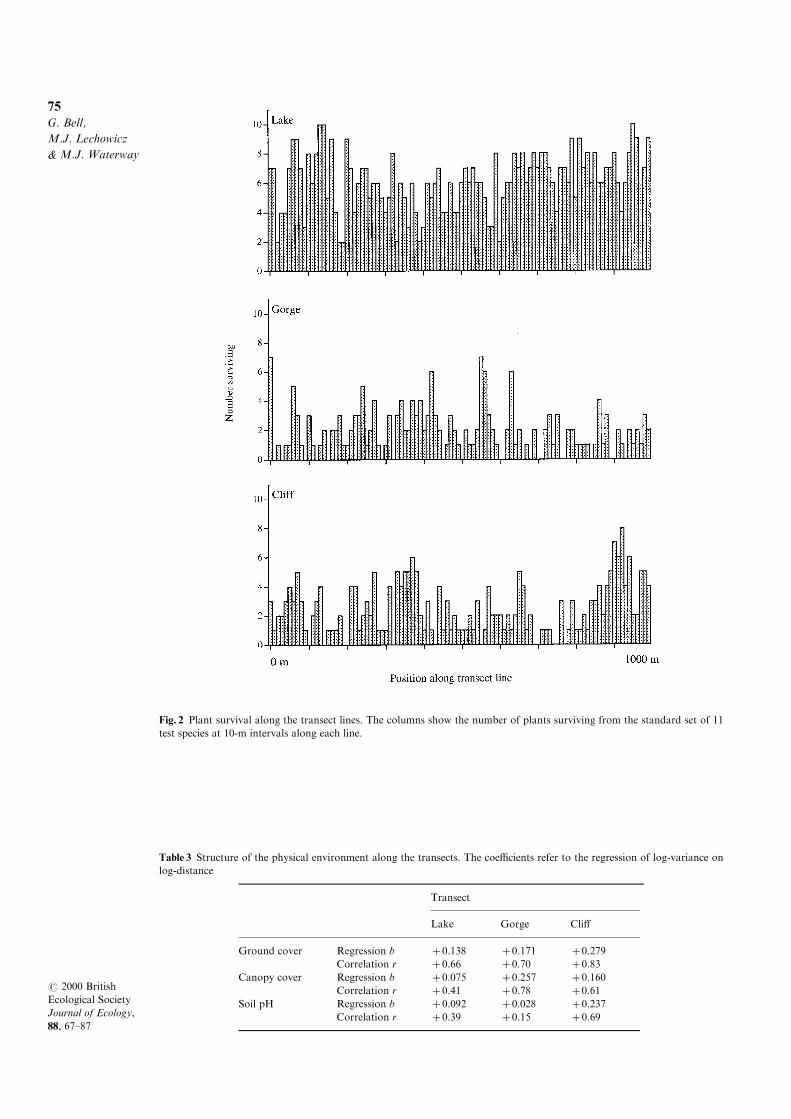
Fig. 2 Plant survival along the transect lines. The columns show the number of plants surviving from the standard set of 11
test species at 10-m intervals along each line.
Table 3 Structure of the physical environment along the transects. The coe�cients refer to the regression of log-variance on
log-distance
Transect
Lake Gorge Cli�
Ground cover Regression b �0.138 � 0.171 �0.279Correlation r �0.66 � 0.70 �0.83
Canopy cover Regression b �0.075 � 0.257 �0.160Correlation r �0.41 � 0.78 �0.61
Soil pH Regression b �0.092 � 0.028 �0.237Correlation r �0.39 � 0.15 �0.69
75G. Bell,
M.J. Lechowicz
& M.J. Waterway
# 2000 British
Ecological Society
Journal of Ecology,
88, 67±87
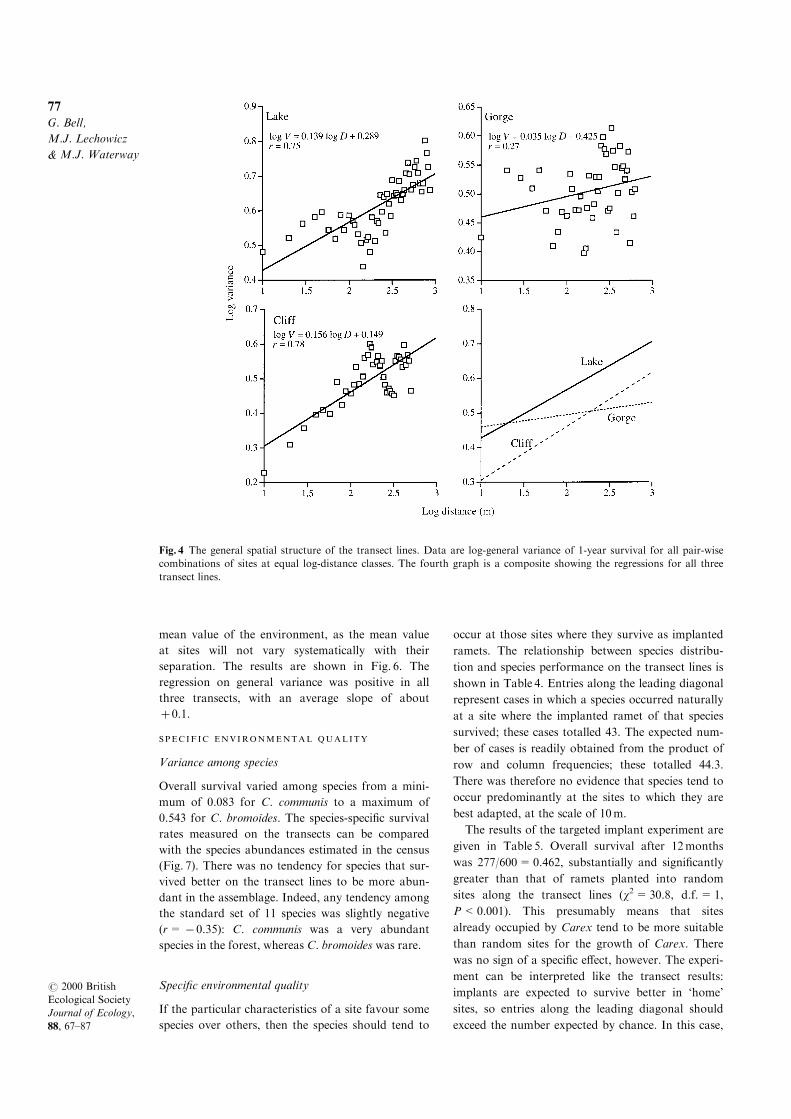
that the speci®c, or genetic, correlation of perfor-
mance falls as the general environmental variance
increases (Bell 1992), i.e. the ranking of species in
the two environments becomes more similar as
mean performance in the two environments becomes
more similar. This generalization was tested for the
Carex system by dividing each transect into 50-m
sections, within each of which total survival might
take any value between 0 and 55. The general envir-
onmental variance increased with distance (Fig. 5a,
and above), whereas the speci®c correlation fell with
distance (Fig. 5b). This was because the speci®c cor-
relation of survival fell as general environmental
variance increased (Figs 5c,d), extending the labora-
tory result to a completely di�erent ®eld situation.
This will be translated into an e�ect on species
diversity through selection, because the composition
of the assemblage at any given site will depend to
some extent on the relative ®tness of species at that
site. The speci®c correlation of occurrence will then
fall as environmental variance increases, causing an
increase in species diversity. To evaluate the e�ect of
environmental heterogeneity on species diversity, we
calculated the mean species diversity for each pair-
wise combination of sites within a given distance
category. This quantity was then regressed on the
environmental variance previously calculated for the
same distance category. This provided an estimate
of the relationship between species diversity and
environmental heterogeneity independent of the
Fig. 3 Abundance and diversity of the local Carex community in relation to the survival of ramets. (a) Abundance. Number
of resident individuals s as a function of number of ramets surviving in 10-m segments of transect lines. (b) Diversity.
Number of species S as a function of number of ramets surviving in 10-m segments of transect lines.
76Environmental
heterogeneity and
species diversity
# 2000 British
Ecological Society
Journal of Ecology,
88, 67±87
mean value of the environment, as the mean value
at sites will not vary systematically with their
separation. The results are shown in Fig. 6. The
regression on general variance was positive in all
three transects, with an average slope of about
� 0.1.SPEC IF IC ENVIRONMENTAL QUALITY
Variance among species
Overall survival varied among species from a mini-
mum of 0.083 for C. communis to a maximum of
0.543 for C. bromoides. The species-speci®c survival
rates measured on the transects can be compared
with the species abundances estimated in the census
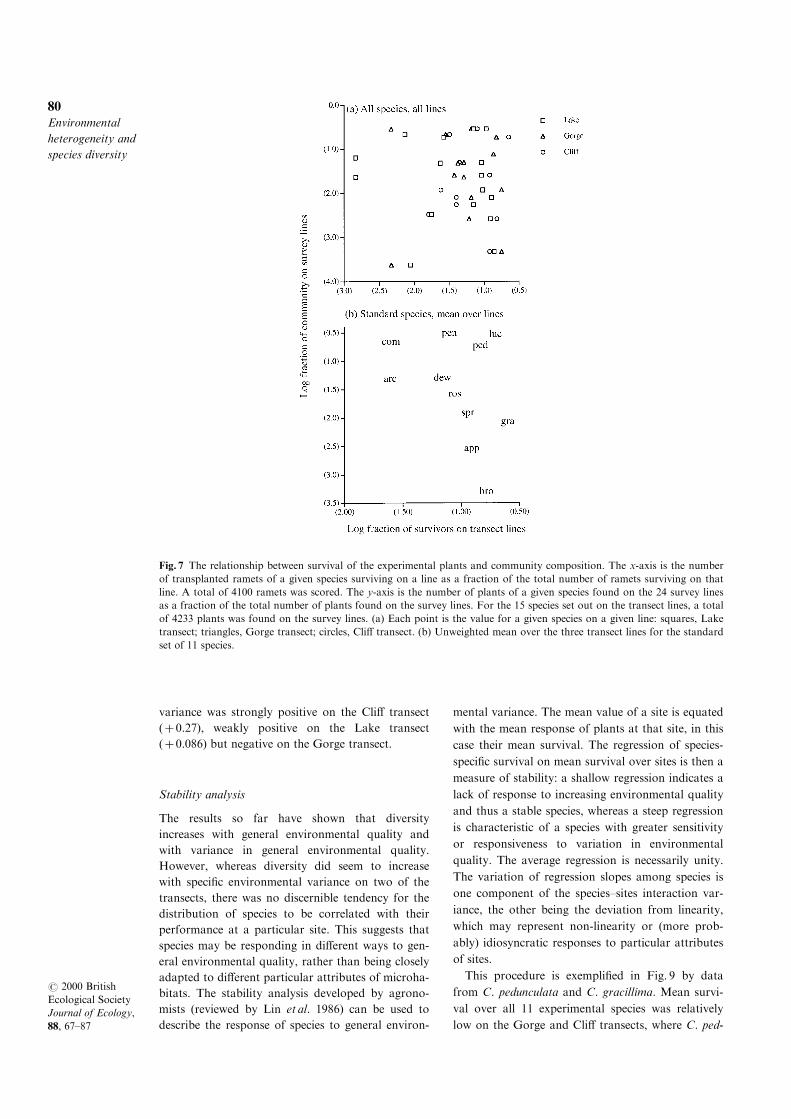
(Fig. 7). There was no tendency for species that sur-
vived better on the transect lines to be more abun-
dant in the assemblage. Indeed, any tendency among
the standard set of 11 species was slightly negative
(r= ÿ 0.35): C. communis was a very abundant
species in the forest, whereas C. bromoides was rare.
Speci®c environmental quality
If the particular characteristics of a site favour some
species over others, then the species should tend to
occur at those sites where they survive as implanted
ramets. The relationship between species distribu-
tion and species performance on the transect lines is
shown in Table 4. Entries along the leading diagonal
represent cases in which a species occurred naturally
at a site where the implanted ramet of that species
survived; these cases totalled 43. The expected num-
ber of cases is readily obtained from the product of
row and column frequencies; these totalled 44.3.
There was therefore no evidence that species tend to
occur predominantly at the sites to which they are
best adapted, at the scale of 10m.
The results of the targeted implant experiment are
given in Table 5. Overall survival after 12months
was 277/600=0.462, substantially and signi®cantly
greater than that of ramets planted into random
sites along the transect lines (w2=30.8, d.f.=1,
P<0.001). This presumably means that sites
already occupied by Carex tend to be more suitable
than random sites for the growth of Carex. There
was no sign of a speci®c e�ect, however. The experi-
ment can be interpreted like the transect results:
implants are expected to survive better in `home'
sites, so entries along the leading diagonal should
exceed the number expected by chance. In this case,
Fig. 4 The general spatial structure of the transect lines. Data are log-general variance of 1-year survival for all pair-wise
combinations of sites at equal log-distance classes. The fourth graph is a composite showing the regressions for all three
transect lines.
77G. Bell,
M.J. Lechowicz
& M.J. Waterway
# 2000 British
Ecological Society
Journal of Ecology,
88, 67±87
these entries totalled 28, against an expected value
of 27.1. The mean survival on home sites, 28/
60=0.467, was in fact as close as possible to the
overall mean survival, 277/600=0.462. Thus, this
experiment failed to demonstrate that species are
best adapted to the sites at which they occur, at the
scale of 1m.
Speci®c environmental structure and species diversity
The speci®c variance (mean environmental variance
of species) also increased with distance on the Lake
and Cli� transects, suggesting that these environ-
ments may be structured in di�erent ways for di�er-
ent species (Fig. 8). Although the ®t of the data to
Fig. 5 The decline of the speci®c correlation of performance with increasing general environmental variance. The analyses
refer to 50-m segments of the transects. Plotted points are means over all three transects, except in (c). (a) The general envir-
onmental variance of two sites increased with their distance (m) apart (cf. Fig. 4). (b) The speci®c correlation of two sites
decreased with their distance (m) apart. (c) The speci®c correlation fell as environmental variance increased on all three
transects. (d) The overall regression of mean values fell as environmental variance increased.
Table 4 Relationship between the survival of experimental ramets of a species and its occurrence in the local community. A
unit entry in the table signi®es that a given species occurred naturally at a 10-m site where the test ramet of that species sur-
vived. The data are pooled over all three transects
Experimental species surviving at site
Resident species arc com dew gra ped pen ros Total
arc 0 4 5 6 13 6 5 39
com 0 12 14 19 21 15 14 95
dew 0 2 3 2 6 1 2 16
gra 0 0 1 1 1 1 1 5
ped 1 11 12 19 26 12 13 94
pen 0 0 1 1 5 0 2 9
ros 3 2 3 1 5 2 1 17
Total 4 31 39 49 77 37 38 275
78Environmental
heterogeneity and
species diversity
# 2000 British
Ecological Society
Journal of Ecology,
88, 67±87
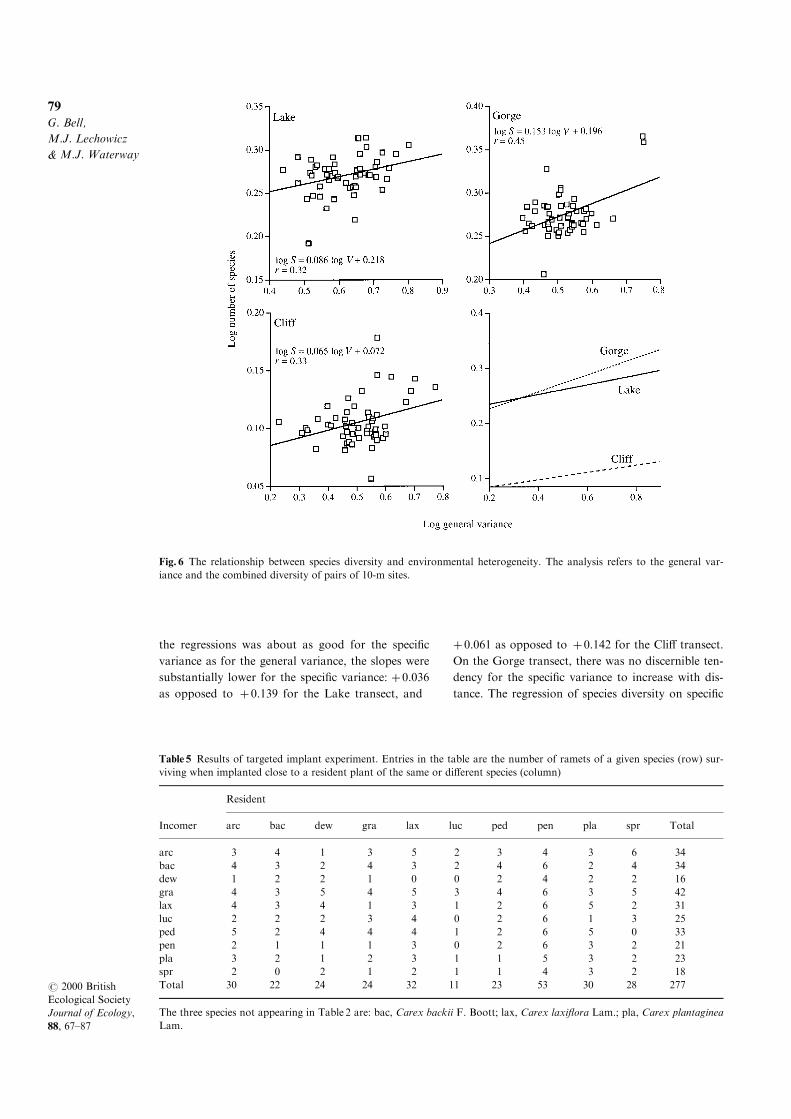
the regressions was about as good for the speci®c
variance as for the general variance, the slopes were
substantially lower for the speci®c variance: �0.036as opposed to � 0.139 for the Lake transect, and
� 0.061 as opposed to �0.142 for the Cli� transect.
On the Gorge transect, there was no discernible ten-
dency for the speci®c variance to increase with dis-
tance. The regression of species diversity on speci®c
Fig. 6 The relationship between species diversity and environmental heterogeneity. The analysis refers to the general var-
iance and the combined diversity of pairs of 10-m sites.
Table 5 Results of targeted implant experiment. Entries in the table are the number of ramets of a given species (row) sur-
viving when implanted close to a resident plant of the same or di�erent species (column)
Resident
Incomer arc bac dew gra lax luc ped pen pla spr Total
arc 3 4 1 3 5 2 3 4 3 6 34
bac 4 3 2 4 3 2 4 6 2 4 34
dew 1 2 2 1 0 0 2 4 2 2 16
gra 4 3 5 4 5 3 4 6 3 5 42
lax 4 3 4 1 3 1 2 6 5 2 31
luc 2 2 2 3 4 0 2 6 1 3 25
ped 5 2 4 4 4 1 2 6 5 0 33
pen 2 1 1 1 3 0 2 6 3 2 21
pla 3 2 1 2 3 1 1 5 3 2 23
spr 2 0 2 1 2 1 1 4 3 2 18
Total 30 22 24 24 32 11 23 53 30 28 277
The three species not appearing in Table 2 are: bac, Carex backii F. Boott; lax, Carex laxi¯ora Lam.; pla, Carex plantaginea
Lam.
79G. Bell,
M.J. Lechowicz
& M.J. Waterway
# 2000 British
Ecological Society
Journal of Ecology,
88, 67±87
variance was strongly positive on the Cli� transect
(� 0.27), weakly positive on the Lake transect
(� 0.086) but negative on the Gorge transect.
Stability analysis
The results so far have shown that diversity
increases with general environmental quality and
with variance in general environmental quality.
However, whereas diversity did seem to increase
with speci®c environmental variance on two of the
transects, there was no discernible tendency for the
distribution of species to be correlated with their
performance at a particular site. This suggests that
species may be responding in di�erent ways to gen-
eral environmental quality, rather than being closely
adapted to di�erent particular attributes of microha-
bitats. The stability analysis developed by agrono-
mists (reviewed by Lin et al. 1986) can be used to
describe the response of species to general environ-
mental variance. The mean value of a site is equated
with the mean response of plants at that site, in this
case their mean survival. The regression of species-
speci®c survival on mean survival over sites is then a
measure of stability: a shallow regression indicates a
lack of response to increasing environmental quality
and thus a stable species, whereas a steep regression
is characteristic of a species with greater sensitivity
or responsiveness to variation in environmental
quality. The average regression is necessarily unity.
The variation of regression slopes among species is
one component of the species±sites interaction var-
iance, the other being the deviation from linearity,
which may represent non-linearity or (more prob-
ably) idiosyncratic responses to particular attributes
of sites.
This procedure is exempli®ed in Fig. 9 by data
from C. pedunculata and C. gracillima. Mean survi-
val over all 11 experimental species was relatively
low on the Gorge and Cli� transects, where C. ped-
Fig. 7 The relationship between survival of the experimental plants and community composition. The x-axis is the number
of transplanted ramets of a given species surviving on a line as a fraction of the total number of ramets surviving on that
line. A total of 4100 ramets was scored. The y-axis is the number of plants of a given species found on the 24 survey lines
as a fraction of the total number of plants found on the survey lines. For the 15 species set out on the transect lines, a total
of 4233 plants was found on the survey lines. (a) Each point is the value for a given species on a given line: squares, Lake
transect; triangles, Gorge transect; circles, Cli� transect. (b) Unweighted mean over the three transect lines for the standard
set of 11 species.
80Environmental
heterogeneity and
species diversity
# 2000 British
Ecological Society
Journal of Ecology,
88, 67±87
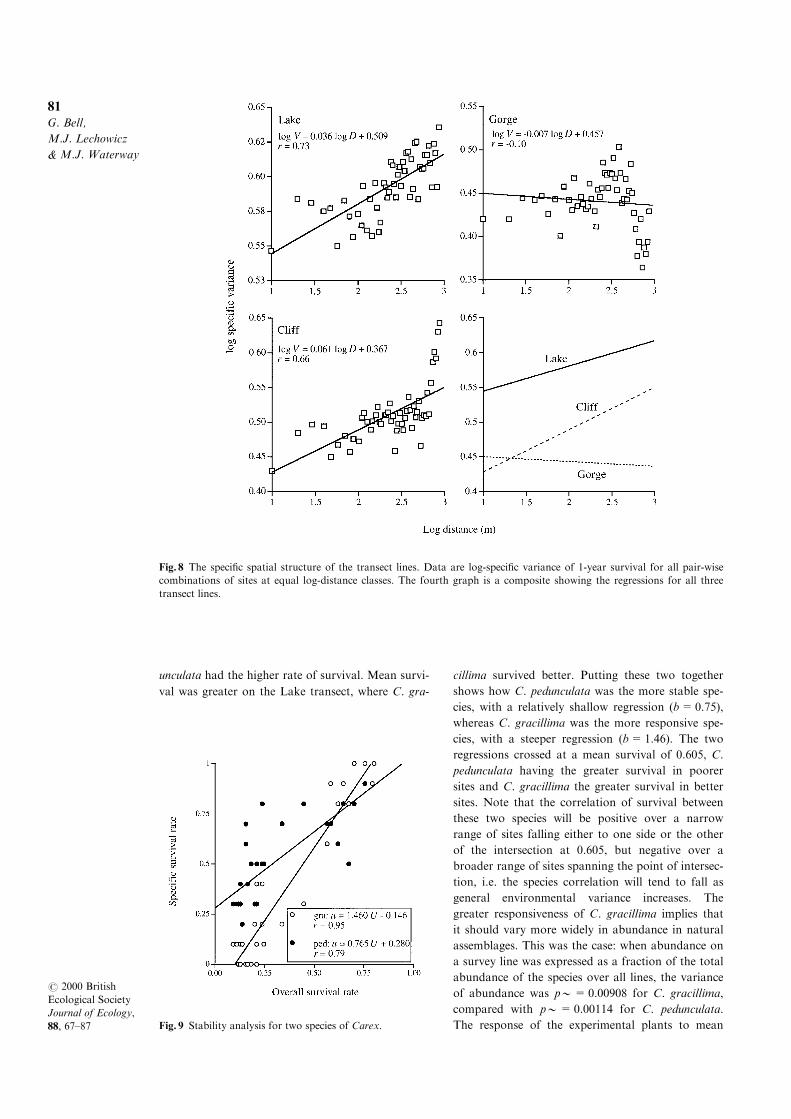
unculata had the higher rate of survival. Mean survi-
val was greater on the Lake transect, where C. gra-
cillima survived better. Putting these two together
shows how C. pedunculata was the more stable spe-
cies, with a relatively shallow regression (b=0.75),
whereas C. gracillima was the more responsive spe-
cies, with a steeper regression (b=1.46). The two
regressions crossed at a mean survival of 0.605, C.
pedunculata having the greater survival in poorer
sites and C. gracillima the greater survival in better
sites. Note that the correlation of survival between
these two species will be positive over a narrow
range of sites falling either to one side or the other
of the intersection at 0.605, but negative over a
broader range of sites spanning the point of intersec-
tion, i.e. the species correlation will tend to fall as
general environmental variance increases. The
greater responsiveness of C. gracillima implies that
it should vary more widely in abundance in natural
assemblages. This was the case: when abundance on
a survey line was expressed as a fraction of the total
abundance of the species over all lines, the variance
of abundance was p0=0.00908 for C. gracillima,
compared with p0=0.00114 for C. pedunculata.
The response of the experimental plants to mean
Fig. 8 The speci®c spatial structure of the transect lines. Data are log-speci®c variance of 1-year survival for all pair-wise
combinations of sites at equal log-distance classes. The fourth graph is a composite showing the regressions for all three
transect lines.
Fig. 9 Stability analysis for two species of Carex.
81G. Bell,
M.J. Lechowicz
& M.J. Waterway
# 2000 British
Ecological Society
Journal of Ecology,
88, 67±87
environmental quality thus predicts the dispersion
of species in natural assemblages.
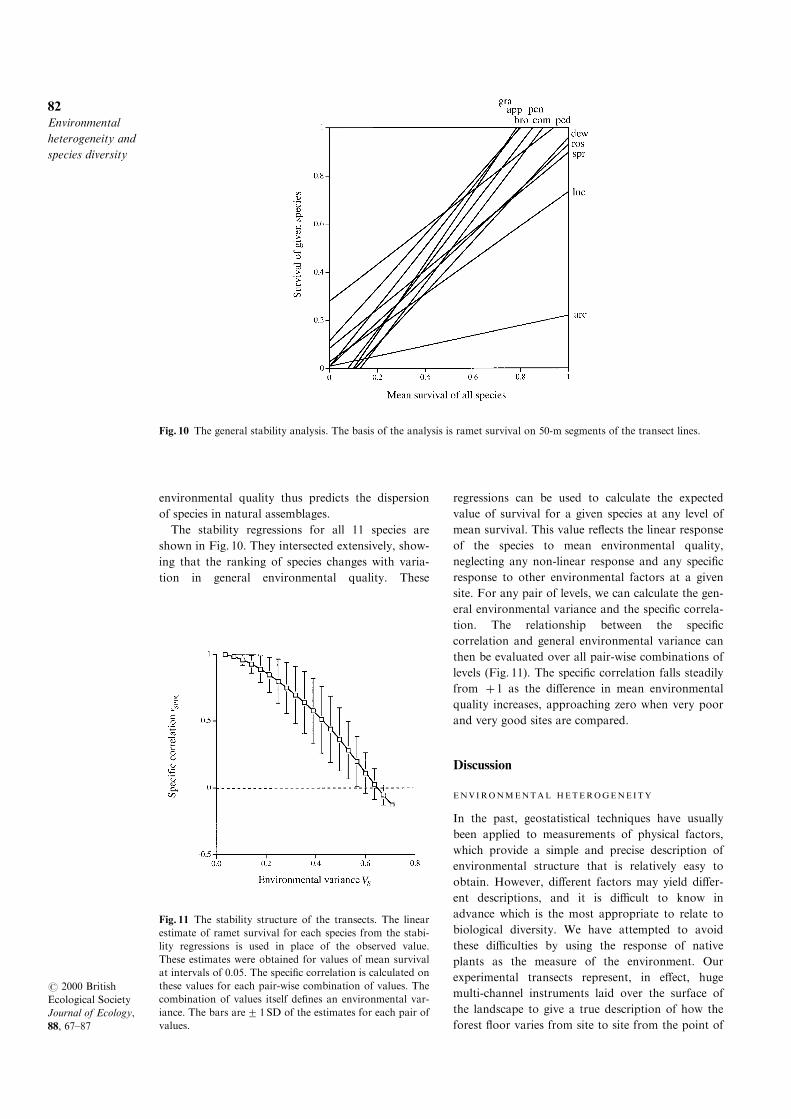
The stability regressions for all 11 species are
shown in Fig. 10. They intersected extensively, show-
ing that the ranking of species changes with varia-
tion in general environmental quality. These
regressions can be used to calculate the expected
value of survival for a given species at any level of
mean survival. This value re¯ects the linear response
of the species to mean environmental quality,
neglecting any non-linear response and any speci®c
response to other environmental factors at a given
site. For any pair of levels, we can calculate the gen-
eral environmental variance and the speci®c correla-
tion. The relationship between the speci®c
correlation and general environmental variance can
then be evaluated over all pair-wise combinations of
levels (Fig. 11). The speci®c correlation falls steadily
from � 1 as the di�erence in mean environmental
quality increases, approaching zero when very poor
and very good sites are compared.
Discussion
ENVIRONMENTAL HETEROGENEITY
In the past, geostatistical techniques have usually
been applied to measurements of physical factors,
which provide a simple and precise description of
environmental structure that is relatively easy to
obtain. However, di�erent factors may yield di�er-
ent descriptions, and it is di�cult to know in
advance which is the most appropriate to relate to
biological diversity. We have attempted to avoid
these di�culties by using the response of native
plants as the measure of the environment. Our
experimental transects represent, in e�ect, huge
multi-channel instruments laid over the surface of
the landscape to give a true description of how the
forest ¯oor varies from site to site from the point of
Fig. 10 The general stability analysis. The basis of the analysis is ramet survival on 50-m segments of the transect lines.
Fig. 11 The stability structure of the transects. The linear
estimate of ramet survival for each species from the stabi-
lity regressions is used in place of the observed value.
These estimates were obtained for values of mean survival
at intervals of 0.05. The speci®c correlation is calculated on
these values for each pair-wise combination of values. The
combination of values itself de®nes an environmental var-
iance. The bars are2 1 SD of the estimates for each pair of
values.
82Environmental
heterogeneity and
species diversity
# 2000 British
Ecological Society
Journal of Ecology,
88, 67±87

view of a particular group of native organisms.
They have shown that the environment is indeed
structured, on scales relevant to the growth and dis-
persal of forest plants. The small-scale heterogeneity
of the environment shown by measurements of phy-
sical factors and explant trials is thereby con®rmed,
and extended to larger scales. Such experiments
enable us to compare the heterogeneity and struc-
ture of areas in a biologically meaningful way; thus,
from the point of view of the sedge assemblage, the
Lake transect is more heterogeneous at all scales
than the Cli� transect, and the Lake and Cli� trans-
ects are more coarse-grained than the Gorge trans-
ect.
We suggest that this approach can be used to pro-
vide species-based de®nitions of habitats and the
assemblages that inhabit them.
1 Two sites represent di�erent habitats with
respect to a de®ned set of organisms if the speci®c
correlation of performance among the members of
this set is negative. From our experimental data, the
speci®c correlation of performance is known to fall
with distance. The distance at which the regression
of correlation on distance reaches zero, i.e. the cor-
relation changes from positive to negative, is the
spatial scale of a habitat. Within a habitat, selection
will be directional and will thus tend to create uni-
formity; among habitats, selection will be to some
extent disruptive, and may sustain diversity.
2 The organisms present at two sites represent
di�erent assemblages if the speci®c correlation of
occurrence is negative. From our observational
data, the speci®c correlation of occurrence also falls
with distance, and the point at which it reaches zero
is the spatial scale of a assemblage.
To the extent that di�erent assemblages occupy
di�erent habitats, we expect the spatial scales of
habitats and assemblages to be related. In our data,
the speci®c correlations of both performance and
occurrence approached zero only at distances
approaching 1 km, the limit of our samples. This
suggests that, from the point of view of Carex, the
forest at Mont St Hilaire is a single habitat support-
ing a single assemblage, despite the quantitative var-
iation among sites within the forest that we have
documented.
DIVERS ITY AND GENERAL ENVIRONMENTAL
VARIANCE
To the extent that species tend to be well-adapted to
the particular sites where they occur, the speci®c
covariance of occurrence among sites will be cre-
ated, through selection, by the speci®c covariance of
performance among sites. Diversity will therefore
increase with environmental heterogeneity only if
the speci®c covariance of performance decreases as
environmental variance increases, and only if this
e�ect is translated into a reduction of the speci®c
covariance of occurrence.
Our experiments have demonstrated for the ®rst
time a correlation between species diversity and a
species-de®ned measure of environmental heteroge-
neity. There is a suggestion that this is apparent
when the three transects are compared: the Lake
transect is the most heterogeneous at all scales, and
the resident assemblage comprises more species,
relative to the number expected from the number of
individuals sampled, than that of the other two
transects. The evidence for a relationship between
species diversity and environmental heterogeneity
within each transect is more convincing, however,
especially for the general variance.
Our results, combined with previous work, lead
us to suggest a general interpretation of species
diversity in our forest Carex system as a series of
linked propositions, which are set out in Fig. 12.
(a) The variance of physical and chemical character-
istics of the environment increases with distance,
creating environmental heterogeneity at scales rele-
vant to the growth and dispersal of forest plants
(Lechowicz & Bell 1991).
(b) Plant growth responds to this heterogeneity in
both glasshouse (Lechowicz & Bell 1991) and ®eld
(Schoen, Bell & Lechowicz 1994) trials.
(c) From (a) and (b) it is expected that the variance
of biologically important characteristics of the envir-
onment should increase with distance, as has been
shown by the survival response of Carex implants
(this paper), yielding a species-de®ned measure of
environmental heterogeneity.
(d) The covariance of ®tness measures among spe-
cies decreases as the general environmental variance
increases, as observed in laboratory trials with
micro-organisms (Bell 1992) and in ®eld trials with
Carex (this paper).
(e) Combining (c) and (d), the speci®c covariance of
performance in any pair of sites decreases with their
distance apart (this paper).
(f) Through selection, (d) will cause the speci®c cov-
ariance of occurrence to fall as environmental var-
iance increases.
(g) The consequence of (f) is that species diversity
will increase as the environmental variance of sites
or combinations of sites of ®xed area increases (this
paper).
(h) Through selection, (e) will cause the speci®c cov-
ariance of occurrence to decrease as the distance
between sites increases.
(i) From (h), the combined diversity of any pair of
sites will tend to increase with their distance apart.
Propositions (g) and (i) are closely related, because
(c), environmental variance, increases with distance.
Furthermore, it follows from (i) that the diversity
of a site will increase with its area, the well-known
species±area rule (j). This is not only a function of
83G. Bell,
M.J. Lechowicz
& M.J. Waterway
# 2000 British
Ecological Society
Journal of Ecology,
88, 67±87
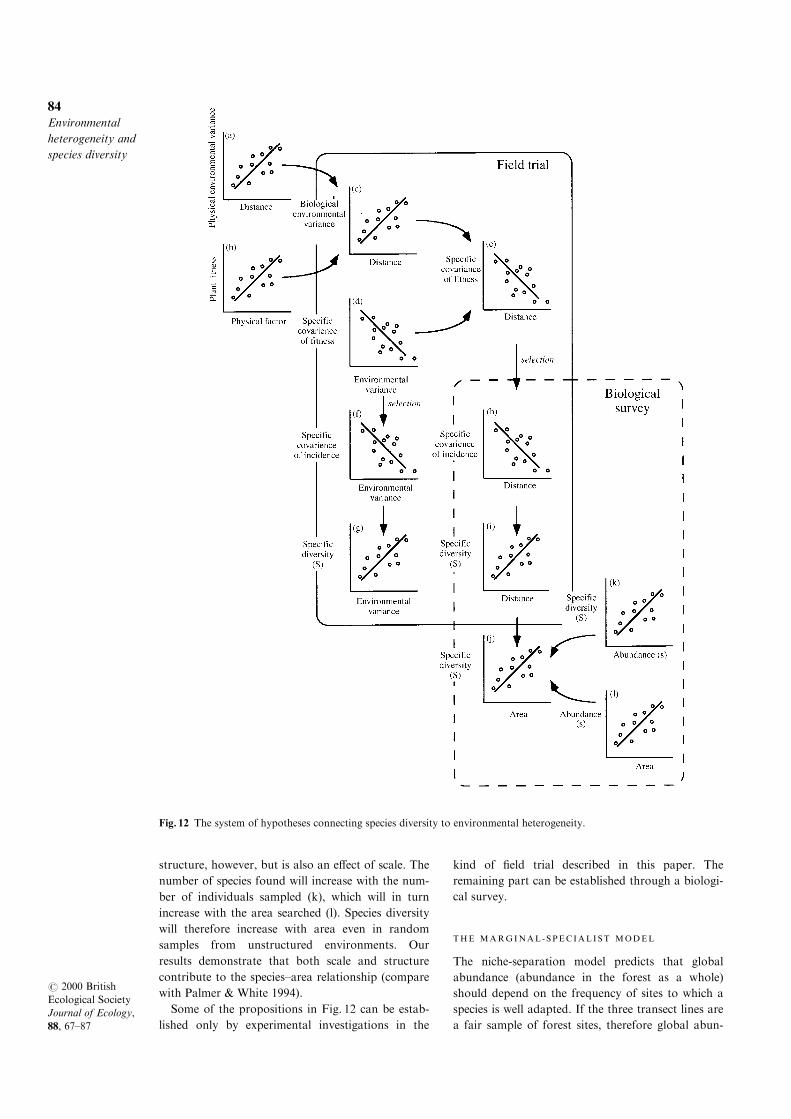
structure, however, but is also an e�ect of scale. The
number of species found will increase with the num-
ber of individuals sampled (k), which will in turn
increase with the area searched (l). Species diversity
will therefore increase with area even in random
samples from unstructured environments. Our
results demonstrate that both scale and structure
contribute to the species±area relationship (compare
with Palmer & White 1994).
Some of the propositions in Fig. 12 can be estab-
lished only by experimental investigations in the
kind of ®eld trial described in this paper. The
remaining part can be established through a biologi-
cal survey.
THE MARGINAL -SPECIAL IST MODEL
The niche-separation model predicts that global
abundance (abundance in the forest as a whole)
should depend on the frequency of sites to which a
species is well adapted. If the three transect lines are
a fair sample of forest sites, therefore global abun-
Fig. 12 The system of hypotheses connecting species diversity to environmental heterogeneity.
84Environmental
heterogeneity and
species diversity
# 2000 British
Ecological Society
Journal of Ecology,
88, 67±87
dance should be predicted by the overall survival of
ramets. This was not the case. Moreover, the theory
also requires the existence of two or more distinct
habitats, and therefore predicts that the speci®c cor-
relation should become negative at intermediate spa-
tial scales. This was not observed. The niche-
separation model therefore does not provide a satis-
factory interpretation of our results.
The productivity of random sites is relatively low,
as shown by the higher survival of the targeted
implants. The other theory outlined in Fig. 1 (the
rare-generalist model) then predicts the lack of cor-
relation between global abundance and the perfor-
mance of random implants. It is also consistent with
the behaviour of the speci®c correlation, which falls
with distance but remains positive, except, perhaps,
near the limit of our experimental design at dis-
tances approaching 1 km. A further prediction made
by this theory, however, is that the species with the
greatest local abundance have the smallest range,
whereas species with broad ranges are everywhere
sparse. There should therefore be a negative correla-
tion between mean local abundance (at those sites
where a given species occurs) and range (the number
of sites occupied). The reverse holds in most cases
(see Gaston 1996; but Thompson et al. 1998 found
no correlation in the British ¯ora), and in our Carex
system in particular range and abundance were posi-
tively correlated. The rare-generalist model must
therefore be rejected.
To explain our results, we have devised a further
model, shown in the lowest panel of Fig. 1. The spe-
cies that dominate the most productive sites also
have the broadest ranges: other species have a super-
ior performance only in a narrow range of unpro-
ductive sites. We call this the marginal-specialist
model. It incorporates a positive correlation between
local abundance and range, as the data require. Like
the rare-generalist model, it predicts the lack of rela-
tionship between global abundance and survival in
random sites, and the tendency for the speci®c cov-
ariance to remain positive at intermediate spatial
scales. It seems to be consistent, therefore, with pat-
terns that are associated with the general environ-
mental variance. It also resembles the rare-generalist
model in predicting the existence of nested subsets
of species (Wright & Reeves 1992; Cook 1995).
DIVERS ITY AND SPECIF IC ENVIRONMENTAL
VARIANCE
The speci®c variance was also structured, but
increased with distance much less rapidly than the
general environmental variance. In other words, the
forest landscape was relatively coarse-grained with
respect to general conditions of growth, and more
®ne-grained with respect to environmental factors
that a�ect species di�erentially. Thus, much of the
environmental heterogeneity to which sedges
respond di�erentially may occur at scales below our
10-m sampling scale. We have no evidence that this
is the case, however. On the contrary, there was no
correspondence between occurrence and perfor-
mance either on the transects, at scales of up to 5m,
or at the targeted implant sites, at scales of 1m or
less. There appears to be no precise local adapta-
tion: the assemblage was not at equilibrium with the
landscape at the taxonomic and geographical scales
that this study encompassed. The failure of these
experiments seems puzzling, in the light of the rela-
tionship between diversity and environmental struc-
ture. It may be attributable simply to their low
power. Given the sample sizes involved and the rate
of survival at non-home sites in the targeted implant
experiment, we can calculate the least value of survi-
val at home sites that would be detected in 90% of
cases at P=0.05 (equations 23.76±23.78 in Zar
1996). The result is a value of 0.70, far in excess of
the value of 0.46 found in non-home sites. The
experiment was therefore capable of detecting only
very pronounced local adaptation. Another way of
expressing this is to ask how large the experiment
would have to be in order to detect a 10% increase
in survival at home sites, from 0.46 to 0.506, at
P=0.05 in 90% of cases. The answer is that it
would be necessary to use 87 replicates of each spe-
cies (rather than three), implanting a total of over
17 000 ramets (rather than 600). Clearly, no practic-
able experiment of this kind can either detect reli-
ably or reject convincingly a modest degree of local
adaptation.
There is better evidence that the species respond
di�erently to general environmental variance, with
some being more stable and others more responsive.
The relative survival rates of the species thus change
as one moves from poor sites with low overall survi-
val to good sites with high overall survival, so that
species composition responds to coarse-grained gen-
eral environmental structure rather than to ®ne-
grained speci®c structure. The consequence of this
component of the species±sites interaction is that the
speci®c correlation of performance falls as the gen-
eral environmental variance increases (Figs 5 and
12). This supplies the mechanism for the observed
increase in species diversity with distance between
sites, and suggests that in this case the marginal-spe-
cialist model might provide a reasonable explanation
for the maintenance of diversity.
In conclusion, we have shown that the forest
environment is structured, that the speci®c correla-
tion of performance falls as general environmental
variance increases, and that species diversity
increases with environmental heterogeneity. At the
same time, we have also shown that the forest ¯oor
is not a simple mosaic of discrete habitats to which
species become di�erently adapted. Instead, species
85G. Bell,
M.J. Lechowicz
& M.J. Waterway
# 2000 British
Ecological Society
Journal of Ecology,
88, 67±87
responded di�erently to continuous variation in
environmental quality. There were cases where this
di�erentiation was relatively strong, and disruptive
selection may maintain some level of diversity (for
example Fig. 9). Nevertheless, we have not been able
to establish convincingly that selection in a hetero-
geneous environment alone provides an adequate
mechanism for the maintenance of observed levels
of diversity. A large part of this diversity seems to
consist of species that are only slightly di�erentiated
and that are not restricted to distinctive kinds of
site. It is presumably maintained by recurrent migra-
tion that is not e�ectively opposed by selection
which is either perennially weak or ¯uctuates in
time. We emphasize that a di�erent result might be
obtained at di�erent scales of investigation. If we
had studied a greater variety of sites, including wet-
land and ruderal sites, or included a greater variety
of taxa, outside the single genus Carex, we might
have observed patterns of assemblage composition
related to di�erential survival. It may be generally
true that related species growing under similar con-
ditions respond primarily to quantitative variation
in the environment in a way best described by the
marginal-specialist model, whereas at larger genetic
and ecological scales qualitative variation in the
environment giving rise to negative speci®c correla-
tions creates stronger and more speci®c selection
that is best described by the niche-separation model.
Acknowledgements
This work was funded by a grant from Fonds pour
les Chercheurs et aÁ l'Aide de la Recherche. We are
grateful to the ®eld assistants who prepared clonal
material and planted and scored the transects:
Natacha Bherer, Heather Campbell, Sarah Dalle,
Tanya Handa, Kathleen Hering, Eliot McIntire,
Philippa McNeil, Charles Mercier, Robin Naidoo,
Brigitte Pinard, Jeanine Rhemtulla, Ulrica Stoklas
and Mark Vellend. We are grateful to Mike Palmer
for criticizing the original manuscript.
References
Anderson, J.M. (1978) Inter- and intra-habitat relation-
ships between woodland Cryptostigmata species diver-
sity and the diversity of soil and litter microhabitats.
Oecologia, 323, 341±348.
Auerbach, M. & Shmida, A. (1987) Spatial scale and the
determinants of plant species richness. Trends in
Ecology and Evolution, 2, 238±242.
Bell, G. (1992) The ecology and genetics of ®tness in
Chlamydomonas. V. The relationship between genetic
correlation and environmental variance. Evolution, 46,
561±566.
Bell, G. (1996) Selection: The Mechanism of Evolution.
Chapman & Hall, New York and London.
Bell, G. & Lechowicz, M.J. (1991) The ecology and genet-
ics of ®tness in forest plants. I. Environmental hetero-
geneity measured by explant trials. Journal of Ecology,
79, 663±685.
Bell, G., Lechowicz, M.J., Appenzeller, A., Chandler, M.,
Deblois, E., Jackson, L., Mackenzie, B., Preziosi, R.,
Schallenberg, M. & Tinker, N. (1993) The spatial
structure of the physical environment. Oecologia, 96,
114±121.
BoÈ hning-Gaese, K. (1997) Determinants of avian species
richness at di�erent spatial scales. Journal of
Biogeography, 24, 49±60.
Cook, R.R. (1995) The relationship between nested sub-
sets, habitat subdivision and species diversity.
Oecologia, 101, 204±210.
Cornell, H.V. & Lawton, J.H. (1992) Species interactions,
local and regional processes, and limits to the richness
of ecological communities: a theoretical perspective.
Journal of Animal Ecology, 61, 1±12.
Gaston, K.J. (1996) The multiple forms of the interspeci®c
abundance±distribution relationship. Oikos, 76, 211±
220.
Haila, Y. (1983) Land birds on northern islands: a sam-
pling metaphor for insular colonization. Oikos, 41,
334±351.
Haila, Y., Jarvinen, S. & Kuudela, S. (1983) Colonization
of islands by land birds: prevalence functions in a
Finnish archipelago. Journal of Biogeography, 10, 499±
531.
Harman, W.N. (1972) Benthic substrates: their e�ect on
freshwater mollusca. Ecology, 53, 271±277.
Hart, D.D. & Horwitz, R.J. (1991) Habitat diversity and
the species±area relationship: alternative models and
tests. Habitat Structure: The Physical Arrangement of
Objects in Space (eds S.S. Bell, E.D. McCoy &
H.R. Mushinsky), pp. 47±68. Chapman & Hall,
London, UK.
Hewatt, W.G. (1935) Ecological succession in the Mytilus
californianus habitat as observed in Monterrey Bay,
California. Ecology, 16, 244±251.
Holland, P.G. (1981) Eleven years of change in the species
composition of permanent quadrats in deciduous forest
on Mont St-Hilaire, Que bec. Naturaliste Canadien,
108, 311±323.
Huston, M.A. (1994) Biological Diversity: The Coexistence
of Species on Changing Landscapes. Cambridge
University Press, Cambridge, UK.
Kerr, J.T. & Packer, L. (1997) Habitat heterogeneity as a
determinant of mammal species richness in high-energy
regions. Nature, 385, 252±254.
Kohn, A.J. (1967) Environmental complexity and species
diversity in the gastropod genus Conus on Indo-West
Paci®c reef platforms. American Naturalist, 101, 251±
260.
Lechowicz, M.J. & Bell, G. (1991) The ecology and genet-
ics of ®tness in forest plants. II. Microspatial heteroge-
neity of the edaphic environment. Journal of Ecology,
79, 687±696.
Levy, A.R. & Lechowicz, M.J. (1987) An Annotated
Bibliography of Research at Mont St Hilaire, Quebec.
UNESCO Canada / Man and the Biosphere Program
Report 18. MAB Committee, Ottawa, Canada.
Lin, C.S., Binns, M.R. & Lefkovitch, L.P. (1986) Stability
analysis: where do we stand? Crop Science, 26, 894±
900.
MacArthur, R.H. (1958) Population ecology of some war-
blers of Northeastern coniferous forests. Ecology, 39,
599±619.
MacArthur, R.H. (1964) Environmental factors a�ecting
bird species diversity. American Naturalist, 98, 387±
397.
86Environmental
heterogeneity and
species diversity
# 2000 British
Ecological Society
Journal of Ecology,
88, 67±87
Maycock, P.F. (1961) Botanical studies on Mont St
Hilaire, Rouville County, Quebec. I. General descrip-
tion of the area and a ¯oristic survey. Canadian
Journal of Botany, 39, 1293±1325.
Moran, V.C. (1980) Interactions between phytophagous
insects and their Opuntia hosts. Ecological
Monographs, 50, 153±164.
Murdoch, W.W., Evans, F.C. & Peterson, C.H. (1972)
Diversity and pattern in plants and insects. Ecology,
53, 819±829.
Nilsson, S.G., Bengtsson, J. & AÂ s, S. (1988) Habitat diver-
sity or area per se? Species richness of woody plants,
carabid beetles and land snails on islands. Journal of
Animal Ecology, 57, 685±704.
Ouellet, J. & LeBlanc, F. (1967) La ¯ore et le ve ge tation
bryologique du Mont Saint-Hilaire, Cte de Rouville,
Que bec. Canadian Journal of Botany, 45, 803±831.
Palmer, M.W. (1991) Patterns of species richness among
North Carolina hardwood forests: tests of two hypoth-
eses. Journal of Vegetation Science, 2, 361±366.
Palmer, M.W. (1994) Variation in species richness: towards
a uni®cation of hypotheses. Folia Geobotanica
Phytotaxonomica, 29, 511±530.
Palmer, M.W. & White, P.S. (1994) Scale dependence and
the species±area relationship. American Naturalist, 144,
717±740.
Pianka, E.R. (1967) On lizard species diversity: North
American ¯atland deserts. Ecology, 48, 333±351.
Pringle, C.M. (1990) Nutrient spatial heterogeneity. E�ects
on community structure, physiognomy and diversity of
stream algae. Ecology, 71, 905±920.
Recher, H.F. (1969) Bird species diversity and habitat
diversity in Australia and North America. American
Naturalist, 103, 75±80.
Schoen, D., Bell, G. & Lechowicz, M.J. (1994) The ecology
and genetics of ®tness in forest plants. IV. Quantitative
genetics of ®tness components in Impatiens pallida.
American Journal of Botany, 81, 232±239.
Shmida, A. & Wilson, M.V. (1985) Biological determinants
of species diversity. Journal of Biogeography, 12, 1±20.
Shorrocks, B. & Sevenster, J.G. (1995) Explaining local
species diversity. Proceedings of the Royal Society of
London B, 260, 305±309.
Silvertown, J. & Wilkin, F.R. (1983) An experimental test
of the role of micro-spatial heterogeneity in the coexis-
tence of congeneric plants. Biological Journal of the
Linnean Society, 19, 1±8.
Strong, D.R. & Levin, D.A. (1979) Species richness of
plant parasites and growth form of their hosts.
American Naturalist, 114, 1±22.
Sultan, S.E., Wilczek, A.M., Hann, S.D. & Brosi, B.J.
(1998) Contrasting ecological breadth of co-occurring
annual Polygonum species. Journal of Ecology, 86,
363±383.
Svenning, J.-C. (1999) Microhabitat specialization in a spe-
cies-rich palm community in Amazonian Ecuador.
Journal of Ecology, 87, 55±65.
Thompson, K., Hodgson, J.G. & Gaston, K.J. (1998)
Abundance±size relationships in the herbaceous ¯ora
of central England. Journal of Ecology, 86, 439±448.
Thompson, R.C., Wilson, B.J., Tobin, M.L., Hill, A.S. &
Hawkins, S.J. (1996) Biologically generated habitat
provision and diversity of rocky shore organisms at a
hierarchy of spatial scales. Journal of Experimental
Marine Biology and Ecology, 202, 73±84.
Tonn, W.M. & Magnuson, J.J. (1982) Patterns in the spe-
cies composition and richness of ®sh assemblages in
northern Wisconsin lakes. Ecology, 63, 1149±1166.
Vivian-Smith, G. (1997) Microtopographic heterogeneity
and ¯oristic diversity in experimental wetland commu-
nities. Journal of Ecology, 85, 71±82.
White, P.S. & Miller, R.I. (1988) Topographic models of
vascular plant richness in the southern Appalachian
high peaks. Journal of Ecology, 76, 192±199.
Whittaker, R.H. (1970) Communities and Ecosystems.
Macmillan, London, UK.
Williams, C.B. (1964) Patterns in the Balance of Nature.
Academic Press, New York, NY.
Wright, D.H. & Reeves, J.H. (1992) On the meaning and
measurement of nestedness of species assemblages.
Oecologia, 92, 416±428.
Zar, J.H. (1996) Biostatistical Analysis. Prentice-Hall, New
Jersey, USA.
Received 6 January 1999
revision accepted 27 July 1999
87G. Bell,
M.J. Lechowicz
& M.J. Waterway
# 2000 British
Ecological Society
Journal of Ecology,
88, 67±87