Embed Size (px)
Citation preview

1
Environmental and Urban
Economics
Lectures on June 12th 2017
Matthew E. Kahn
USC and NBER

Three Lectures
• Green Cities
• Low Carbon Cities
• Climate Change Adaptation and Urbanization

Some Readings
• Kahn ME, Walsh R. Cities and the
Environment. National Bureau of Economic
Research; 2014 Sep 18.
• Zheng S, Kahn ME. A New Era of Pollution
Progress in Urban China?. The Journal of
Economic Perspectives. 2017 Jan 1;31(1):71-
92.

In 1960, Would You Prefer to Live and Work in the U.S
or France? Same Answer in 2017? Why?
• The Standard of Living Debates
• Jones CI, Klenow PJ. Beyond GDP? Welfare
across countries and time. The American
Economic Review. 2016 Sep 1;106(9):2426-
57.
• Nordhaus WD, Tobin J. Is growth obsolete?.
In Economic Research: Retrospect and
Prospect, Volume 5, Economic Growth 1972
Jan 1 (pp. 1-80). Nber.
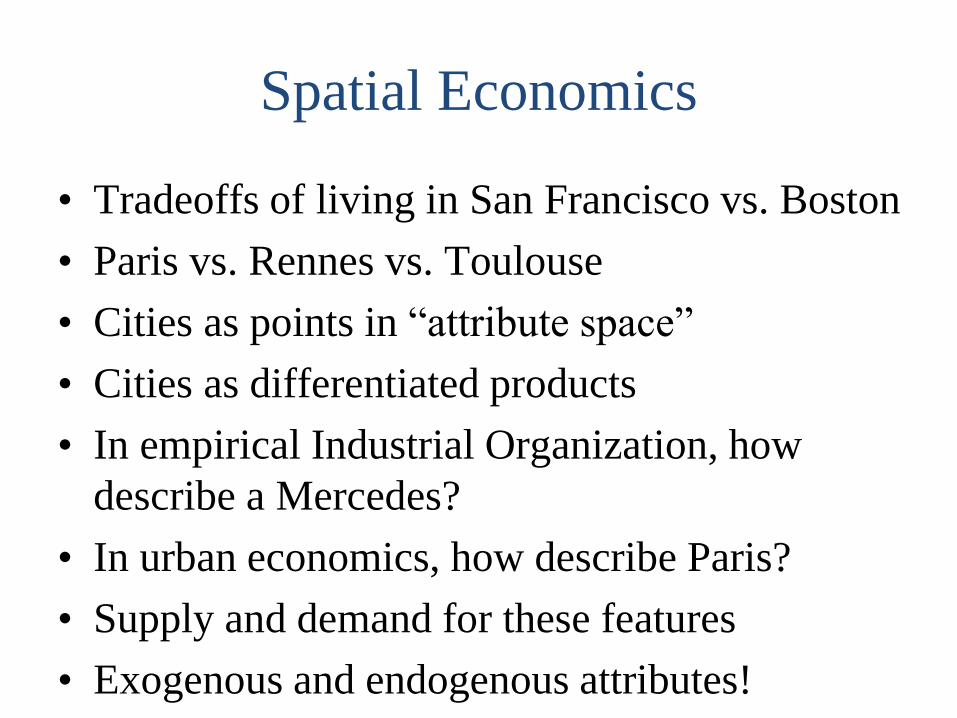
Spatial Economics
• Tradeoffs of living in San Francisco vs. Boston
• Paris vs. Rennes vs. Toulouse
• Cities as points in “attribute space”
• Cities as differentiated products
• In empirical Industrial Organization, how
describe a Mercedes?
• In urban economics, how describe Paris?
• Supply and demand for these features
• Exogenous and endogenous attributes!

PM10 concentration in Beijing
(Los Angeles averages 40)

Definition of a “Green City”?
• Air quality and Water quality
• Physical beauty
• Nice climate
• Good public services (little garbage)
• Ethos of people; bike lanes, greenery, stores,
solar panels, wind turbines
• No one firm chooses to supply this, an
emergent property of the aggregate choices by
households, firms and government

Some Questions
• Back in the 1950s, Pittsburgh was not a green
city
• In 2017, it is a green city.
• What happened?
• In 2017, Beijing is not a green city, in 2050
will it be a green city?
• The role of Industrial structure, household
lifestyle, government policy


Demand for Quality of Life and
Green Cities
• Valuation of non-market local public goods
• Survey Contingent Valuation
• Hedonic real estate methods (Sherwin Rosen)
• Migration studies

A Simple Model of Spatial
Equilibrium
• Assumptions
• Everyone has the same preferences for pizza
and clean air “A”
• Air pollution varies across locations for
exogenous reasons
• Migration costs are zero, pick a city and stay
there
• Everyone is paid the same salary of $12,000 a
year and the price of pizza = $1.

The Identification Problem: Hint
Pizza = 12000-Rent
• The econometrician knows that each person
has a utility function of the form;
• Utility = 𝑃𝑖𝑧𝑧𝑎.5 + β*Pollution
• Solve for β given these data
City Rent Pollution
Level
Paris 4500 88
Toulouse 6200 56

Key Point
• The Theory of Compensating Differentials
• Rosen S. Markets and diversity. The American
Economic Review. 2002 Mar 1;92(1):1.
• Real estate market valuation both across cities
and within cities.

Land and Residential Property Markets in a
Booming Economy: New Evidence from BeijingBy Siqi Zheng and Matthew E. Kahn
Journal of Urban Economics, 63, 2008: 743-757.
Home Price = f (physical
characters, distance to CBD,
distance to infrastructures)
Empirical analysis (Hedonic
model)
log(P) = c0 + c1*X1 + c2*X2 +
c3*X3
New-built commodity residential projects
in Beijing
(2004-2005)

Bus stops and subway stations Primary and middle schools
Parks and air quality Key universities

The Basis for Our “Blue Skies”
Optimism
• Richer, educated people demand “Blue Skies”
• City quality of life evolves over time
(examples of NYC, Chicago, London)
• The rise of consumer cities and the recognition
of the central role of human capital as the
“golden goose” of urban economic growth
(Glaeser 2011, Moretti 2012)

China’s Demand for “Green Cities”
• 4-2-1 Demography
• Low pollution is an investment fostering child
development --- Jim Heckman’s research
agenda
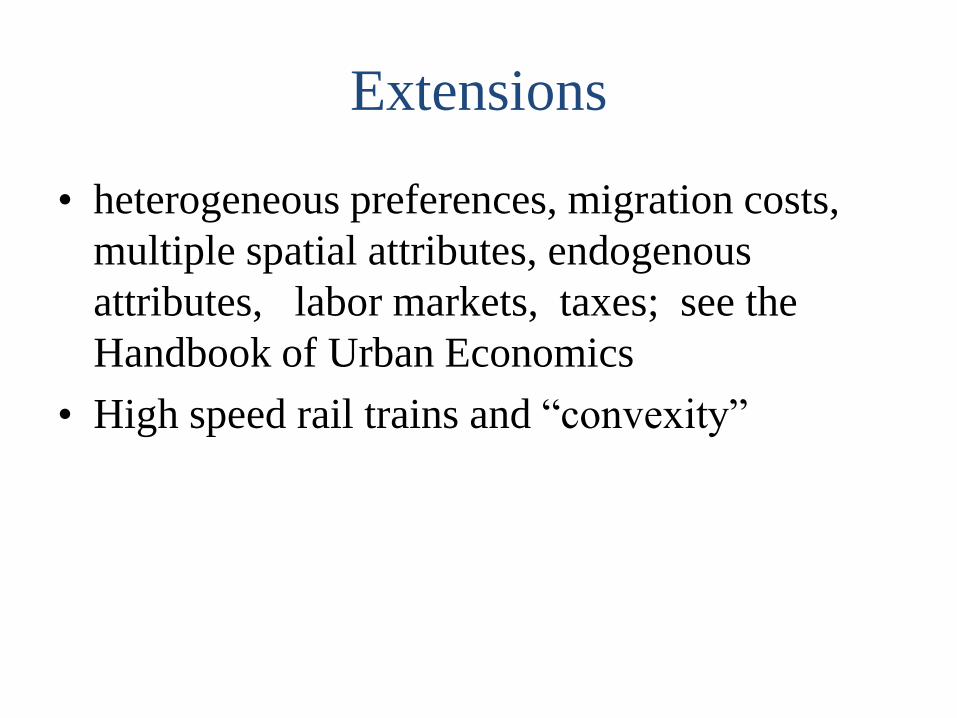
Extensions
• heterogeneous preferences, migration costs,
multiple spatial attributes, endogenous
attributes, labor markets, taxes; see the
Handbook of Urban Economics
• High speed rail trains and “convexity”

The Rise of China’s System of
Cities and the “Menu”
• China’s bullet trains facilitate market
integration and mitigate the cost of megacity
growth (Zheng and Kahn PNAS Plus 2013)

Greater Beijing Area
2006 2010
Langfang 45~60 20
Tianjin 90~120 30
Baoding 90~120 58
Cangzhou 160~180 90
Shijiazhuang 180 120
Hengshui 180
Zhangjiakou 240
Chengde 300
located in “sweet spot”
not located in “sweet spot”
commute time change
between Beijing and
some nearby cities (minute)

Yangtze River Delta
2006 2010
Suzhou 60~90 30
Hangzhou 120~150 50
Nanjing 180~240 100
Shaoxing 150~180 110
Hefei 360~450 180
Huzhou —
Yangzhou 300
Wuhu 420
Nantong 500
located in “sweet spot”
not located in “sweet spot”
commute time change
between Shanghai and
some nearby cities (minute)

Pearl River Delta
2006 2010
Qingyuan 50~60 23
Dongguan 60 30
Jiangmen — 45
Shaoguan 240~280 46
Shenzhen 120 60
Foshan 30
Zhaoqing 100~150
Huizhou 120
Hong Kong 120
located in “sweet spot”
not located in “sweet spot”
commute time change
between Guangzhou and
some nearby cities (minute)

Bullet Train Paper (PNAS 2013)
Findings
• A city’s home price is an increasing function
of local market potential
• Since bullet train connection increases a city’s
market potential, those close but not very close
cities connected by the Bullet Train to the
superstar cities experience price appreciation

Supply
• Why isn’t every city “green”?
• When would a city choose to be “brown”?
• Republican claims about “jobs vs. the
environment”
• The 1% vs. the 99% in the United States and
Don Trump. Are green cities “elitist”?
• As housing prices rise in green cities such as
San Francisco, can the poor afford to live
there?

Local Land Use Regulation and
Green Belts and Gentrification
26

Some Readings
• Glaeser EL, Gyourko J, Saks R. Why is
Manhattan so expensive? Regulation and the
rise in housing prices. The Journal of Law and
Economics. 2005 Oct;48(2):331-69.
• Hilber CA, Vermeulen W. The impact of
supply constraints on house prices in England.

How Did the U.S Become Greener
on Local Pollutants?
• Manufacturing to services transition
• Transition from power plant coal fired to
natural gas and renewables
• Cleaner cars via the Clean Air Act
• Superfund to remediate old toxic dump sites
• Lower center city crime to encourage new
urbanism and public transit use
• More energy efficient buildings

Political Economy
• Incentives for local and national leaders to
prioritize building “green cities”?
• Greater incentive if the median voter is an
educated progressive
• Believes in government, unlikely to be
working in polluting industries, values clean
air, patient and seeking environmental progress
• How test this claim? What would be credible
empirical work?

Dynamics! Boston in the 1970s

Boston in 2017

Final Thoughts
• As a city becomes “greener” who bears the
incidence of this dynamic?
• Land owners gain (Ricardo)
• Renters who don’t value such attributes can
lose (cost of gentrification)
• If the “greening” occurs because of
deindustrialization, low skill displaced workers
lose. (A source of Trump voters in the U.S?)

Transportation Speed
• Speed of movement both within cities and
across cities plays a key role in determining
who can access the best cities vs. who is priced
out.

Replicating Paris and Manhattan?

San Francisco

Implications for LDCs
• New capital vs. old capital and benefits of
developing later
• The demand for suburbanization
• Heavy manufacturing in cities
• Allowing water prices and electricity prices to
reflect market scarcity
• Using information technology to address
Tragedy of the Commons issues (Rome and
Dogs)
• Government “Spare the Air” announcements

The urban economics of climate
change mitigation
• How does urban growth affected a nation’s
greenhouse gas production?
• How can we use the tools of urban planning,
design and economics to build low carbon
cities where people want to live and work ?

Bend the Curve?
Per-Capita Carbon Dioxide Emissionsyear
South Asia World East Asia
1960 1970 1980 1990 2000 2012
0
2
4
6

Carbon Mitigation Promises Made
at the COP 21 Meetings in
December 2015 in Paris
• Despite the warm feelings, the free rider
problem persists in a world eager to consume
more energy
• The Prime Minister of England just disbanded
the nation’s “Department of Energy and
Climate Change”
• President Trump isn’t embracing the “low
carbon” economy, recent retreat

The Global Challenge

Algebra
• Total GHG emissions =
• Population*Income per Person * GHG per $ of
income
• How does urbanization affect each of these
three? No laws of physics here!!

Coal Consumption (1000s of tons)
1980 to 2012
Year
Asia World China
1980 1990 2000 2010
0
2.0e+06
4.0e+06
6.0e+06
8.0e+06

Coal Consumption 1980 to 2012
Year
China India
1980 1990 2000 2010
0
1.0e+06
2.0e+06
3.0e+06
4.0e+06

Coal Consumption 1980 to 2012
Year
South Korea Japan
1980 1990 2000 2010
0
50000
100000
150000
200000

Coal Consumption 1980 to 2012
Year
Pakistan Thailand Vietnam Indonesia
1980 1990 2000 2010
0
20000
40000
60000
80000

Carbon Mitigation Promises Made
at the COP 21 Meetings in
December 2015 in Paris
• INDCs and low-carbon growth strategies in
developing Asia, theme chapter of Asian
Development Outlook 2016 Update by Frank
Jotzo and Luke Kemp

Promises Made by Major Asian
Nations at the COP 21 2015
MeetingNation Overall CO2 Goal GHG Intensity Goal
Bangladesh 5% reduction in BAU by 2030
Cambodia 27% reduction relative to BAU
by 2030
China Peak in 2030 Reduce to 60-65% of 2005
levels by 2030
India 40% of power from
renewables
35% reduction 2005 to 2030
Indonesia 29% reduction relative to BAU
by 2030
Japan 26% reduction below 2013 levels
by 2030
Laos No specifics
Malaysia 45% reduction 2005 to 2030

More Promises
Malaysia 45% reduction 2005 to 2030
Mongolia 14% by 2030 relative to BAU
Myanmar More renewable power
Pakistan No explicit target No target
Philippines 70% by 2030 relative to BAU
Singapore emissions peak in 2030 36% reduction by 2030
compared to 2005 levels
South Korea 37% reduction by 2030
relative to BAU
Thailand 20% reduction by 2030
Vietnam 8% reduction by 2030 relative
to BAU

Some Economics of Creating Low
Carbon Cities
• Power plants
• Transportation
• Industrial activity
• Residential and Commercial Real Estate

Power Generation and GHG
Production
• The Coal to natural gas substitution
• The rise of renewable power and nuclear
power generation
• Ongoing fear of nuclear power

Transportation
• Compact cities in Asia and private
motorization vs. public transit
• If public transit is fast and goes where people
want to go, it keeps its market share
• Glaeser EL, Kahn ME, Rappaport J. Why do the poor
live in cities? The role of public transportation.
Journal of urban Economics. 2008 Jan 31;63(1):1-24.
• Baum-Snow N, Kahn ME, Voith R. Effects of urban
rail transit expansions: Evidence from sixteen cities,
1970-2000. Brookings-Wharton papers on urban
affairs. 2005 Jan 1:147-206.

Technological Fixes
• Electric vehicles and Electric buses charged by
renewable power
• Key is battery storage capacity innovation so
that the production and consumption are in
balance

Urban Real Estate
• Durable capital stock now being built– Zheng S, Wu J, Kahn ME, Deng Y. The nascent market for
“green” real estate in Beijing. European Economic Review.
2012 Jul 31;56(5):974-84.
• Synergy between information on “green
certification” and dynamic pricing for
electricity and water
– Davis LW, Gertler PJ. Contribution of air conditioning
adoption to future energy use under global warming.
Proceedings of the National Academy of Sciences. 2015
May 12;112(19):5962-7.

Political Economy
• Incentives for local and national leaders to
prioritize this goal?
• Coal fired power plants increase local
particulates and this kills and hurts locally
• As per-capita income rises, greater demand for
clean air and greater health

Question #1: Low Carbon Cities
• Why is San Francisco “low carbon”?
• Why is Houston “high carbon”?
56

Some Boring Accounting for every
city in every year
• Aggregate GHG emissions =
• Residential + transport + industry + power
sector
– Residential = natural gas for cooking and heating
– Transport = miles driven*Gallons per mile
– Industry = σ𝑗=1𝑀 𝑗𝑜𝑏𝑠𝑗𝑔𝑡 ∗ 𝐸𝑛𝑒𝑟𝑔𝑦 𝑝𝑒𝑟 𝑗𝑜𝑏𝑗𝑔𝑡
– Power plant average EF = function of shares of
power by source*Emissions factor (i.e coal, natural
gas, renewables) EF= emissions factor
– GHG from power = total KWH*EF

Explanations for San Francisco
• People, lifestyle, jobs, power generation
• Climate conditions
• San Francisco has warm winters and cool
summers low residential fossil fuels
• Good public transit and walkable and dense
• Few industrial jobs (no energy intensive steel)• Kahn ME, Mansur ET. Do local energy prices and regulation
affect the geographic concentration of employment?. Journal
of Public Economics. 2013 May 31;101:105-14.
• Power from renewables, gas and hydro

How Could San Francisco Become
Even Lower Carbon?
• California’s AB32 and low carbon efforts
• Higher electricity prices
• New build energy standards
• Labels on real estate energy efficiency

Some Economics Research
• Brounen D, Kok N. On the economics of energy labels in the
housing market. Journal of Environmental Economics and
Management. 2011 Sep 30;62(2):166-79.
• Kahn ME, Kok N. The capitalization of green labels in the
California housing market. Regional Science and Urban
Economics. 2014 Jul 31;47:25-34.
• Kahn ME, Kok N. Big-box retailers and urban carbon
emissions: The case of wal-mart. National Bureau of
Economic Research; 2014 Feb 20.
A Couple of Economics Ideas
• People want to face low prices for electricity
and water
• But, this reduces their incentive to purchase
energy efficient durables and to engage in
conservation
• How do we convince more people to “opt in”
to face dynamic pricing for increasingly scarce
resources?

Diversity
• In any population, people differ with respect to
their “nimbleness”.
• In Los Angeles, many people have green grass
in their lawns in the middle of a drought
• If they would agree to be exposed to higher
water prices, would take actions to substitute
away
• Aggregate demand for innovations will cause
R&D and new innovations (i.e future Uber)
The Need for Planning
• Transport infrastructure
• Zoning and low carbon optimal density (as
crime falls)
• Anticipating Deflection effects
– if Portland is perfect but expensive does Houston
and Las Vegas grow due to cross-elasticity?
– Glaeser EL, Kahn ME. The greenness of cities:
carbon dioxide emissions and urban development.
Journal of urban economics. 2010 May
31;67(3):404-18.

What Can Planners Learn from
Economists?
• Dynamic pricing for parking
• When we “know that we don’t know” how a
city will develop, how preserve options
without “locking in”?

What can Economists learn from
Planners?
• Durable capital and locking in
• Initial conditions have long run effects
• Layout of Paris
• Preserving Beauty
• Encouraging the use of public space in a
democratic and inclusive way
Low Carbon Suburbs?
• Holian, Matthew J., and Matthew E.
Kahn. Household Demand for Low Carbon
Public Policies: Evidence from California.
JAERE June 2015
• Delmas, Magali A., Matthew E. Kahn, and
Stephen Locke. Accidental Environmentalists?
Californian Demand for Teslas and Solar
Panels. No. w20754. National Bureau of
Economic Research, 2014.
66

Who Cares?
Table 8: Fraction of U.S. population living at various distances from CBD, 1970-2010
0-5 5-10 10-15 15-20 20-25 25-30 30-35 >35
1970 0.316 0.256 0.153 0.095 0.063 0.043 0.024 0.050
1980 0.267 0.239 0.157 0.103 0.072 0.051 0.029 0.083
1990 0.203 0.193 0.137 0.092 0.066 0.047 0.029 0.233
2000 0.187 0.192 0.142 0.098 0.070 0.050 0.031 0.230
2010 0.169 0.188 0.146 0.102 0.073 0.052 0.034 0.235
Each row sums to 1.

A Thought Experiment on
Suburban Sprawl and the Carbon
Footprint• Take any person
• Assign her to live in a center city
• Calculate her transportation and household
carbon footprint --- Call this Carbon_city
• Now Assign her to live in suburb of the same
metro area
• Recalculate her transportation and household
carbon footprint --- Call this Carbon_burbs
• Carbon_burbs – carbon_city >0

Why Could This Be a “Causal
Effect”?
• Monocentric model of urban economics would
predict this --- home prices and density
declines with distance from the CBD
• Walking and public transit use higher when
live and work in the center city
• Larger housing in burbs requiring more
electricity and electricity generated by fossil
fuels
• Heterogeneity with respect to income,
household type, Place of work, and ideology

Self Selection and
Suburbanization?
• People are not randomly assigned to the
suburbs
• Republicans disproportionately live there
• Challenge for enviro and urban researchers
who seek to estimate causal effects using
observational data
• Carbon footprint = a + b*X + c*suburbs + U
• E(U | X , suburbs) = 0?

Figure 4: Political party Membership and Distance from the City Center

Some Facts
• The median voter
• Lives in the suburbs
• Both due to selection and treatment effects,
suburbanites have a larger household carbon
footprint than center city residents
• Suburbanites are aware of this

Do suburbanites vote against cap
and trade legislation?
• Cragg, Michael I., Yuyu Zhou, Kevin Gurney, and
Matthew E. Kahn. "Carbon geography: the political
economy of congressional support for legislation
intended to mitigate greenhouse gas
production." Economic Inquiry 51, no. 2 (2013):
1640-1650.
• Holian, Matthew J., and Matthew E.
Kahn. Household Demand for Low Carbon Public
Policies: Evidence from California. JAERE June
2015

Holian and Kahn (2015)
• Direct Democracy in California
• Prop 23 in 2010 would have ended
California’s AB32 = low carbon legislation
• Merge voting level data at the census block to
Census data and political party of registration
data
• Republicans and suburbanites oppose carbon
pricing

Even in California: Suburban
Opposition
• What is to be done?
• The standard progressive logic is that we need
a carbon tax to incentivize the adoption of
renewable power and EV vehicles
• Delmas, Magali A., Matthew E. Kahn, and
Stephen Locke. Accidental Environmentalists?
Californian Demand for Teslas and Solar
Panels. No. w20754. National Bureau of
Economic Research, 2014.
• Flips the classic logic

Our Tesla Paper
• If suburban households adopt supersized solar
panels that “fuel” their Electric vehicles
(thanks to batteries at night), then we can zero
out the suburban carbon footprint
• Delmas et. al. argue that there is a
complementarity between these products that
will become increasingly attractive to “bottom
line” cost minimizing suburbanites
• EV price per unit of quality is falling!

An Optimistic Hypothesis
• As free market capitalism (and China) fosters
green Evs and solar panels,
• More suburbanites adopt them out of self
interest
• This reduces their carbon footprint
• This reduces their opposition to carbon pricing
• Median voter supports carbon pricing
• US leads in international agreement
• Capitalist progress shift in carbon politics

Urbanization and Fertility in
Vietnam (Becker Revisited)

More Conclusions
• We need more research on learning by doing
and dynamic estimates of the cost of
retrofitting older cities to be Low Carbon cities
• And the cost of building new “low carbon”
cities
• Durable capital that is energy inefficient and
accelerating the replacement cycle

Some Political Economy
• Given President Trump’s COP 21 decision,
local experimentation is now even more
important.
• California as the “Green Guinea Pig”
• Ideas as public goods

My 2010 Climatopolis Book was
not a Best Seller!

Chapter One: Too Much Gas
Per-Capita Carbon Dioxide Emissionsyear
South Asia World East Asia
1960 1970 1980 1990 2000 2012
0
2
4
6
The Climate Adaptation Challenge
• A booming reduced form “macro literature”
examining how temperature and rainfall
impacts macro economic growth
• Dell, Melissa, Benjamin F. Jones and Benjamin A.
Olken. 2014. "What Do We Learn from the Weather?
The New Climate-Economy Literature." Journal of
Economic Literature, 52(3): 740-98.
• Burke M, Hsiang SM, Miguel E. Global non-linear
effect of temperature on economic production.
Nature. 2015 Oct 21.

Places vs. People
• Migration
• Sense of place
• Adjustment costs

Adaptation through Urbanization
• The impact of climate change on rural to urban
migration and the Harris/Todaro Model
• Migration costs
• Gharad Bryan & Shyamal Chowdhury &
Ahmed Mushfiq Mobarak, 2014.
"Underinvestment in a Profitable
Technology: The Case of Seasonal
Migration in Bangladesh," Econometrica,
vol. 82, pages 1671-1748, 09.

Strengths of my 2010 Climatopolis
• Since the world’s population now is
increasingly likely to live in cities, we need to
understand how different cities will adapt to
the emerging new risks
• Within a nation, cities compete against each
other and competition protects urbanites

Rolling Stone Magazine June 2013
• Goodbye, Miami
• By Jeff Goodell
• “By century's end, rising sea levels will turn
the nation's urban fantasyland into an
American Atlantis. But long before the city is
completely underwater, chaos will begin”
• Coastal cities face greater risk and we have
built up a capital stock in such locations.
• Death vs. Capital Destruction and Depreciation

Miami = Atlantis?

The United States as a Coastal
Nation

The Urban Economics of Climate
Adaptation
• Around the world, we have chosen to place
many of our cities in “harm’s way”
• Partially due to;
• 1. productivity effects --- access to shipping
routes
• 2. historical factors
• 3. amenities of water access and climate
amenities

Known Unknowns!
• We know that different geographic areas will
face different threats including;
1. temperature extremes
2. rainfall extremes
3. sea level rise
4. natural disaster frequency and severity
• A series of spatially subscripted random
variables
• Climate Scientists step up and improve and
refine their climate forecasts

Alex Hall’s Research: Where
Should LA Increase Density?

The San Diego Foundation’s 2050
Study
“A Regional Wake Up Call”• 4 degrees (F) hotter on average
• Sea level will be 12-18 inches higher.
• water demand up 37% while supply will down
20%
• Wildfires will be more frequent and intense.
• Public health will be at risk from heat and air
pollution
• Peak electricity consumption up 70%

Learning About New Risks and
Investment
• Information as a public good
• Cities all over the world conduct similar
impact evaluations (and consider worst case
scenarios)
• How do self interested households, Profit
maximizing firms, Local governments,
National government respond to these
forecasts?

Two Adaptation Pathways
Provided by Free Markets
• Migration and City Competition
• Innovation, Investment and experimentation

Quality of Life is the Modern
City’s “Golden Goose”
• Human capital as the engine of modern growth
• In this footloose age, those cities with great
quality of life will attract and retain the skilled.

Defending Against Quality of Life
Threats
• Los Angeles real estate near UCLA is priced at
$1,000 a square foot.
• This price premium is due to amenities not
productivity!
• If climate change poses a QOL threat, home
owners and the Mayor who controls the local
property tax revenue have strong incentives to
play defense!
Escape from San Diego?
• If a city such as San Diego’s quality of life
suffers due to climate change, home owners
there suffer an asset loss
• Households there can migrate to a Detroit or
another city whose quality of life is relatively
better
• Migration breaks the link between urban
places and urban people
• Land owners as an interest group pushing for
adaptation policies

Competition within a System of
Cities in Rich vs. Poor Nations
• The opportunity cost concept
• If San Francisco’s quality of life suffers, its
residents have hundreds of other cities to move
to
– Are they aware of their attributes?
– Can they afford them?
– Can they easily move?

Economic Incidence
• Land owners and places versus people as “new
news” about climate risks arrives
• In 2016, San Francisco home prices are much
higher than Detroit’s
• In the year 2050, could this gap narrow?

Moving to Higher Ground and
Transition Dynamics
• Both within and across cities
• Time to Build?
Las Vegas Metro Area
Census Population
1960 127,016
1970 273,288
1980 528,000
1990 852,737
2000 1,375,765
2010 1,951,269

Air Conditioning and Climate
Change Adaptation
• Barreca, Alan, Karen Clay, Olivier Deschenes,
Michael Greenstone, and Joseph S.
Shapiro. Adapting to Climate Change: The
Remarkable Decline in the US Temperature-
Mortality Relationship over the 20th Century.
Journal of Political Economy 2016

Some Evidence on Adapting to
Heat

Singapore and the Heat
• A very productive Asian city/state exposed to
extreme heat.
• Graff-Zivin, Kahn introduce a model featuring firm
productivity heterogeneity and a complementarity
between worker quality and firm productivity
• Most productive firms invest in air conditioning to
protect their workers and to pay a lower
compensating differential
• Macro economic implications best firms are
insulated from the heat

Agriculture and Cities
• Farmer adaptation strategies
• What will urbanites eat? (substitution and
price effects)
• Government barriers to trade (imports and
tariffs, not enough discussion in Climatopolis)

How Will Firms Respond to
Anticipated Climate Change ?
• One person’s misery = firm’s opportunity
• Directed technological change (Acemoglu and
Linn 2004 QJE)
• Ideas are public goods, worldwide diffusion

The San Diego Foundation’s 2050
Study
“A Regional Wake Up Call”• 4 degrees (F) hotter on average
• Sea level will be 12-18 inches higher.
• water demand up 37% while supply will down
20%
• Wildfires will be more frequent and intense.
• Public health will be at risk from heat and air
pollution
• Peak electricity consumption up 70%

Thom Mayne and Brad Pitt’s
Floatable Homes

How Do We Protect the Urban
Poor?
• Implications of climate change for quality of
life inequality (Piketty revisited?)
• Matt Damon movie Elysium features the rich
colonizing space after Earth is ravaged.
• Zoning
• Information
• Tracking the CPI for adaptation friendly
products ranging from air conditioning to
smart phones to refrigeration to quality
housing

Rational Expectations vs.
Behavioral Economics
• Known unknowns concerning climate change
risk
• The Economics of “Climate Skeptics” and
Deniers
• The man at risk to suffer “doesn’t know that he
doesn’t know”

Three Cases
• Behavioral Economics (UC Berkeley) vs. neo-
classical economics (University of Chicago)
• Spock: New News arrives he reacts =
exposure to new risks declines
• Homer Simpson: New News arrives he
ignores it and like the Titanic he hits the
iceberg

Weaknesses of Climatopolis
• Too little discussion of quality of life in the
rural LDC countryside
• Too little discussion of the quality of life of the
urban poor in rich and poor nations
• Ignored the possible urban productivity loss
associated with higher heat
• An incomplete discussion of the politics of
climate change adaptation

Weaknesses #1
• Too little discussion of quality of life in the
rural LDC countryside
• How cities in Africa can reduce the risk of
natural resource scarcity induced rural
violence (Mad Max revisited)

The System of Cities in Different
Developing Nations
• In a world where it is difficult to move across
nations, domestic migration is a key adaptation
strategy.
• A menu of cities to choose from
• The USA has hundreds of cities
• Different land areas and locations

Weaknesses #2
• Too little discussion of the quality of life of the
urban poor in rich and poor nations
• On extremely hot days, can the poor access
cooler areas?
• Extra suffering from food spoiling and the
inability to work and earn income.

The System of Cities in different
Asian Nations
• Based on Vern Henderson’s data set
• Bangladesh has 31 cities, India has 144 cities
• Indonesia has 54 cities, Vietnam has 25 cities
• Take Zipf’s law seriously; rank j*pop j = pop 1
• 90 million people in Vietnam today
• Suppose that a 70% urbanization rate in 2040
and 110 million people => 77 million urbanites
• If no new cities biggest city has 18 million
people (which one? We will see)

Weaknesses #3
• Ignored the possible urban productivity loss
associated with higher heat
• New research on outdoor workers and indoor
workers concerning how their productivity is
affected by both heat and pollution exposure

Weaknesses #4
• An incomplete discussion of the politics of
climate change adaptation
• Insurance pricing
• Water pricing
• My new Hamilton Project paper for Brookings
• http://www.hamiltonproject.org/papers/protecti
ng_urban_places_and_populations_from_risin
g_climate_risk

How Can Planning Help Our Cities
to Adapt to Climate change?
• Anticipate challenges
• Cooling centers
• Flooding areas
• Infrastructure at risk
• Identify “higher ground”
• Urban resilience

Conclusion
• Competition across cities within a system of
cities and with some international migration
creates incentives for local leaders to adapt
• The system of cities creates a spatially
diversified “portfolio” that can take the
ambiguous punch of climate change

Risk Taking in a Risky World
• When we observe coastal people continue to
live in an increasingly risky place: What
conclusion do we draw?
– Love the view
– Ignorant of the risk
– Able to self protect
– Anticipate a bailout
– Poor and stuck

Winners and Losers
• This is the age of the 1%
• How do we protect the poor? (zoning,
information, economic growth)
• Those who own land in geographic areas that
suffer greatly will suffer an asset loss
• Can government play “too much defense”?
• The case of Hurricane Sandy and New York
City and FEMA
• Moral Hazard and “tough love”

Escape from San Diego?
• What if none of my predictions play out?
• If a city such as San Diego’s quality of life
suffers due to climate change, home owners
there suffer an asset loss
• Households there can migrate to a Detroit or
another city whose quality of life is relatively
better
• Migration acts as an implicit insurance policy
• Internet and “twitter world” keeps us fully
informed about evolving threats

The Moscow Time Line
• Matt finishes writing Climatopolis in April
2010
• Publisher asks him to “name names”
• Moscow Heat Wave of Summer 2010
• Climatopolis published in Fall 2010!
• Fool me once, shame on you
• Fool me twice, shame on me!
• What will happen to Moscow in the next heat
wave?