Embed Size (px)
Citation preview

Screening Assessment for the Challenge
2-Furancarboxaldehyde (Furfural)
Chemical Abstracts Service Registry Number
98-01-1
Environment Canada Health Canada
September 2011

Screening Assessment CAS RN 98-01-1
Synopsis Pursuant to section 74 of the Canadian Environmental Protection Act, 1999 (CEPA 1999), the Ministers of the Environment and of Health have conducted a screening assessment on 2-furancarboxaldehyde, also known as furfural, Chemical Abstracts Service Registry Number 98-01-11. This substance was identified as a high priority for screening assessment and included in the Challenge initiative under the Chemicals Management Plan because it was determined to present a greatest potential for exposure of individuals in Canada and had been classified by other agencies on the basis of carcinogenicity. Furfural also met the ecological categorization criterion for inherent toxicity to aquatic organisms but did not meet the criteria for persistence and bioaccumulation potential. According to information submitted under section 71 of CEPA 1999, between 100 000 and 1 000 000 kg were imported into and used in Canada in 2006. In Canada, all uses of furfural identified as a result of the section 71 survey under CEPA 1999 are industrial uses. Furfural occurs naturally in a variety of foods and beverages (e.g., fruits and vegetables) and can also be formed during the thermal processing of food. It can also be added to foods as a flavouring agent. Based on available information on sources and uses of furfural, the general population is expected to be exposed to furfural predominantly from its naturally occurring presence in food but also from environmental media (ambient and indoor air) and from use of consumer products containing the substance. International agencies have reviewed the collective information on carcinogenicity and have found the evidence limited. On the basis of the available information regarding genotoxicity and conclusions from international agencies, furfural is not likely to be genotoxic and a threshold approach is used for risk characterization. Critical effects for characterization of risk to human health from exposure to furfural via the oral route are liver effects and via the inhalation route are effects on nasal tissue. The focus of risk characterization for human health was on general population exposures to furfural from sources other than its naturally occurring presence in food (indoor and ambient air, consumer products) and margins of exposure were considered adequate to address uncertainties in the health effects and exposure databases. It is, therefore, concluded that furfural is not entering the environment in a quantity or concentration or under conditions that may constitute a danger to human life or health in Canada. Furfural does not meet the criteria for persistence or bioaccumulation potential as set out in the Persistence and Bioaccumulation Regulations. While the substance may have the potential to cause adverse effects in sensitive aquatic organisms exposed to relatively low concentrations for long periods of time, a conservative risk quotient analysis determined
1 The Chemical Abstracts Service Registry Number (CAS RN) is the property of the American Chemical Society and any use or redistribution, except as required in supporting regulatory requirements and/or for reports to the government when the information and the reports are required by law or administrative policy, is not permitted without the prior, written permission of the American Chemical Society.
ii

Screening Assessment CAS RN 98-01-1
iii
that exposure concentrations derived from anthropogenic sources of furfural into the Canadian environment are unlikely to reach levels which elicit adverse effects in organisms. On the basis of low persistence and bioaccumulation potential, as well as low exposure concentrations in the environment, it is concluded that furfural is not entering the environment in a quantity or concentration or under conditions that have or may have an immediate or long-term harmful effect on the environment or its biological diversity or that constitute or may constitute a danger to the environment on which life depends. Based on the information available, furfural does not meet any of the criteria set out in section 64 of CEPA 1999. This substance will be considered for inclusion in the Domestic Substances List inventory update initiative. In addition and where relevant, research and monitoring will support verification of assumptions used during the screening assessment.

Screening Assessment CAS RN 98-01-1
Introduction The Canadian Environmental Protection Act, 1999 (CEPA 1999) (Canada 1999) requires the Minister of the Environment and the Minister of Health to conduct screening assessments of substances that have met the categorization criteria set out in the Act to determine whether these substances present or may present a risk to the environment or to human health. Based on the information obtained through the categorization process, the Ministers identified a number of substances as high priorities for action. These include substances that
• met all of the ecological categorization criteria, including persistence (P), bioaccumulation potential (B) and inherent toxicity to aquatic organisms (iT), and were believed to be in commerce; and/or
• met the categorization criteria for greatest potential for exposure (GPE) or presented an intermediate potential for exposure (IPE) and had been identified as posing a high hazard to human health based on classifications by other national or international agencies for carcinogenicity, genotoxicity, developmental toxicity, or reproductive toxicity.
The Ministers therefore published a notice of intent in the Canada Gazette, Part I, on December 9, 2006 (Canada 2006), that challenged industry and other interested stakeholders to submit, within specified timelines, specific information that may be used to inform risk assessment and to develop and benchmark best practices for the risk management and product stewardship of those substances identified as high priorities. The substance 2-furancarboxaldehyde was identified as a high priority for assessment of human health risk because it was considered to present GPE and had been classified by other agencies on the basis of carcinogenicity. The Challenge for this substance was published in the Canada Gazette on September 26, 2009 (Canada 2009a, 2009b). A substance profile was released at the same time. The substance profile presented the technical information available prior to December 2005 that formed the basis for categorization of this substance. As a result of the Challenge, submissions of information pertaining to the substance were received. Although 2-furancarboxaldehyde was determined to be a high priority for assessment with respect to human health, and also met the ecological categorization criterion for inherent toxicity to aquatic organisms, it did not meet the criteria for persistence or bioaccumulation potential. Screening assessments focus on information critical to determining whether a substance meets the criteria as set out in section 64 of CEPA 1999. Screening assessments examine
1

Screening Assessment CAS RN 98-01-1
scientific information and develop conclusions by incorporating a weight-of-evidence approach and precaution.2 This final screening assessment includes consideration of information on chemical properties, hazards, uses, and exposure, including the additional information submitted under the Challenge. Data relevant to the screening assessment of this substance were identified in original literature, review and assessment documents, stakeholder research reports and from recent literature searches, up to May 2010 for the human health exposure and effects sections of the document and up to May 2010 for exposure, effects, and ecological sections of the document. Key studies were critically evaluated; modelling results may have been used to reach conclusions. Evaluation of risk to human health involves consideration of data relevant to estimation of exposure (non-occupational) of the general population, as well as information on health hazards (based principally on the weight-of-evidence assessments of other agencies that were used for prioritization of the substance). Decisions for human health are based on the nature of the critical effect and/or margins between conservative effect levels and estimates of exposure, taking into account confidence in the completeness of the identified databases on both exposure and effects, within a screening context. The final screening assessment does not represent an exhaustive or critical review of all available data. Rather, it presents a summary of the critical information upon which the conclusion is based. This final screening assessment was prepared by staff in the Existing Substances Programs at Health Canada and Environment Canada and incorporates input from other programs within these departments. The ecological and human health portions of this assessment have undergone external written peer review/consultation. Comments on the technical portions relevant to human health were received from scientific experts selected and directed by Toxicology Excellence for Risk Assessment (TERA), including Dr. Bernard Gadagbui (TERA), Dr. Michael Jayjock (The LifeLine Group), and Dr. Chris Bervans (CJB Consulting). Additionally, the draft of this screening assessment was subject to a 60-day public comment period. While external comments were taken into consideration, the final content and outcome of the screening assessment remain the responsibility of Health Canada and Environment Canada. Approaches used in the screening assessments under the Challenge have been reviewed by an independent Challenge Advisory Panel.
2 A determination of whether one or more of the criteria of section 64 are met is based upon an assessment of potential risks to the environment and/or to human health associated with exposures in the general environment. For humans, this includes, but is not limited to, exposures from ambient and indoor air, drinking water, foodstuffs, and the use of consumer products. A conclusion under CEPA 1999 on the substances in the Chemicals Management Plan (CMP) Challenge Batches 1–12 is not relevant to, nor does it preclude, an assessment against the hazard criteria specified in the Controlled Products Regulations, which is part of regulatory framework for the Workplace Hazardous Materials Information System (WHMIS) for products intended for workplace use. Similarly, a conclusion based on the criteria contained section 64 of CEPA 1999 does not preclude actions being taken under other sections of CEPA or other Acts.
2

Screening Assessment CAS RN 98-01-1
The critical information and considerations upon which the final assessment is based are summarized in the following report.
Substance Identity
Substance Name For the purposes of this document, this substance will be referred to as furfural, derived from the common name. Table 1. Substance identity for furfural
Chemical Abstracts Service Registry Number (CAS RN)
98-01-1
DSL name 2-furancarboxaldehyde
National Chemical Inventories (NCI) namesa
2-furancarboxaldehyde (TSCA, AICS, SWISS, PICCS, ASIA-PAC, NZIoC) 2-furaldehyde (EINECS) furfural (ENCS, ECL, SWISS, PICCS) 2-furancarboxyaldehyde (ECL) furan-2-carboxaldehyde (PICCS)
Other names
α-furole; 2-formylfuran; 2-furanaldehyde; 2-furancarbaldehyde; 2-furancarbonal; 2-furfural; 2-furfuraldehyde; 2-furylaldehyde; 2-furylcarboxaldehyde; 2-furylmethanal; artificial ant oil; fural; furaldehyde; furancarbonal; furfuraldehyde; furfurol; furfurole; furfurylaldehyde; furole; NSC 8841; pyromucic aldehyde; UN 1199; UN 1199 (DOT)
Chemical group (DSL Stream) Discrete organics
Major chemical class or use Low-molecular heterocyclic organic compounds
Major chemical sub-class Furans, aldehydes Chemical formula C5H4O2
Chemical structure
OO
SMILESb O=CC(OC=C1)=C1 Molecular mass 96.09 g/mol
a National Chemical Inventories (NCI) 2009: AICS (Australian Inventory of Chemical Substances); ASIA-PAC (Asia-Pacific Substances Lists); DOT (U.S. Department of Transportation); ECL (Korean Existing Chemicals List); EINECS (European Inventory of Existing Commercial Chemical
3
Screening Assessment CAS RN 98-01-1
Substances); ENCS (Japanese Existing and New Chemical Substances); NZloC (New Zealand Inventory of Chemicals); PICCS (Philippine Inventory of Chemicals and Chemical Substances); SWISS (Giftliste 1 and Inventory of Notified New Substances); and TSCA (Toxic Substances Control Act Chemical Substance Inventory).
b Simplified Molecular Input Line Entry System
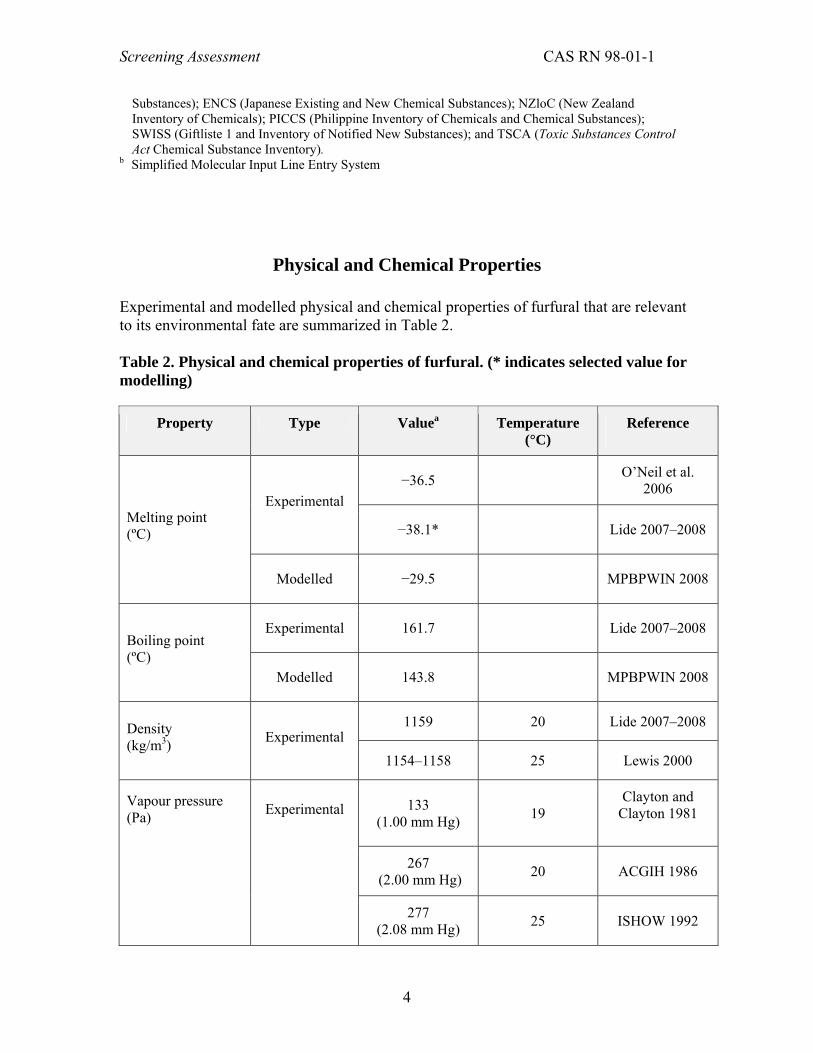
Physical and Chemical Properties Experimental and modelled physical and chemical properties of furfural that are relevant to its environmental fate are summarized in Table 2. Table 2. Physical and chemical properties of furfural. (* indicates selected value for modelling)
Property Type Valuea
Temperature
(°C) Reference
−36.5 O’Neil et al. 2006
Experimental
−38.1* Lide 2007–2008 Melting point (ºC)
Modelled −29.5 MPBPWIN 2008
Experimental 161.7 Lide 2007–2008 Boiling point (ºC)
Modelled 143.8 MPBPWIN 2008
1159 20 Lide 2007–2008 Density (kg/m3) Experimental
1154–1158 25 Lewis 2000
133 (1.00 mm Hg) 19
Clayton and Clayton 1981
267 (2.00 mm Hg) 20 ACGIH 1986
Vapour pressure (Pa) Experimental
277 (2.08 mm Hg) 25 ISHOW 1992
4

Screening Assessment CAS RN 98-01-1
Valuea Property Type Temperature Reference (°C)
295* (2.21 mm Hg) 25 Daubert and
Danner 1989
Modelled 309 (2.32 mm Hg) 25 MPBPWIN 2008
1.36 (1.34 × 10⁻⁵
atm·m3/mol; Bond method)
0.55 (5.48 × 10⁻⁶ atm·m3/mol;
VP/WS methodb)
Henry’s Law constant (Pa·m3/mol)
Modelled
0.38 (3.77 × 10⁻⁶ atm·m3/mol;
VP/WS methodc)
25 HENRYWIN 2008
Experimental 0.41* Hansch et al. 1995
Log Kow (octanol–water partition coefficient) (dimensionless) Modelled 0.83 25 KOWWIN 2008
Experimental 0.815d Study Submission 2010
0.78 (estimated from
Molecular Conductivity
Index)
25 KOCWIN 2008 Log Koc (organic carbon–water partition coefficient) (dimensionless) Modelled
0.92 (estimated from experimental log
Kow of 0.41)
83 000 20 Clayton and Clayton 1981
89 000 20 Lide 2007–2008
Water solubility (mg/L)
Experimental
74 100* 25 Yalkowsky and
5
Screening Assessment CAS RN 98-01-1
Valuea Property Type Temperature Reference (°C)
He 2003
Modelled 53 580 25 WSKOWWIN 2008
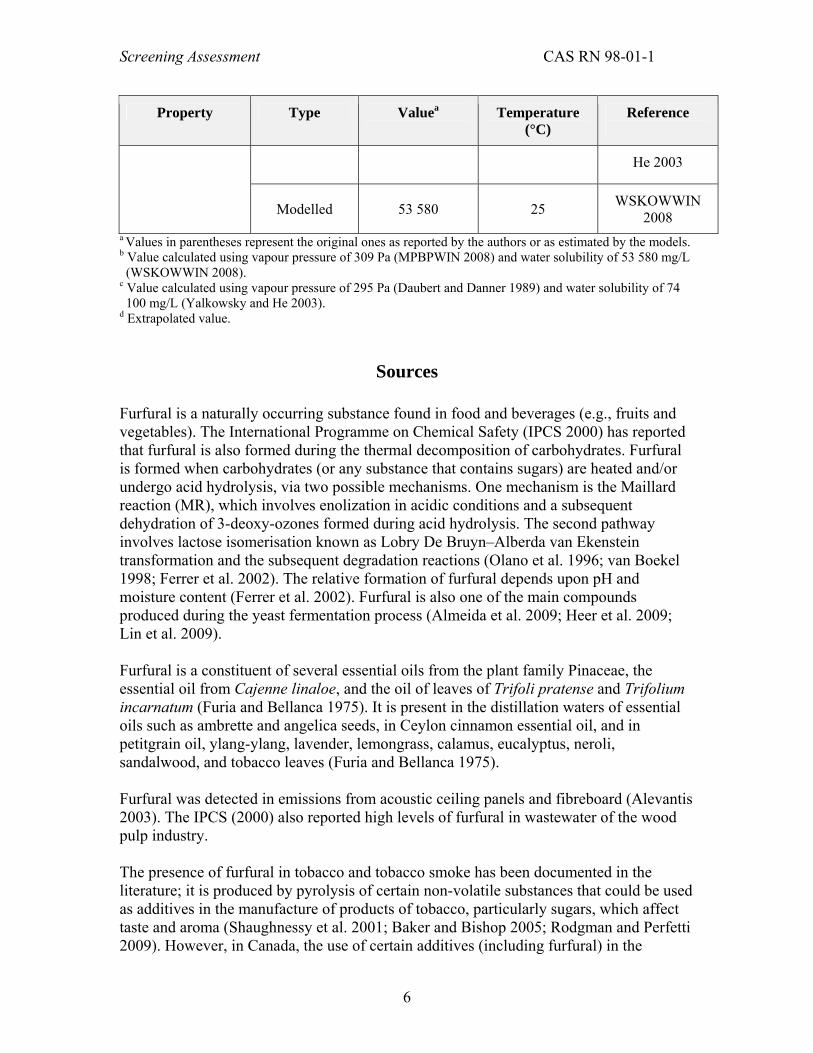
a Values in parentheses represent the original ones as reported by the authors or as estimated by the models. b Value calculated using vapour pressure of 309 Pa (MPBPWIN 2008) and water solubility of 53 580 mg/L (WSKOWWIN 2008).
c Value calculated using vapour pressure of 295 Pa (Daubert and Danner 1989) and water solubility of 74 100 mg/L (Yalkowsky and He 2003).
d Extrapolated value.
Sources Furfural is a naturally occurring substance found in food and beverages (e.g., fruits and vegetables). The International Programme on Chemical Safety (IPCS 2000) has reported that furfural is also formed during the thermal decomposition of carbohydrates. Furfural is formed when carbohydrates (or any substance that contains sugars) are heated and/or undergo acid hydrolysis, via two possible mechanisms. One mechanism is the Maillard reaction (MR), which involves enolization in acidic conditions and a subsequent dehydration of 3-deoxy-ozones formed during acid hydrolysis. The second pathway involves lactose isomerisation known as Lobry De Bruyn–Alberda van Ekenstein transformation and the subsequent degradation reactions (Olano et al. 1996; van Boekel 1998; Ferrer et al. 2002). The relative formation of furfural depends upon pH and moisture content (Ferrer et al. 2002). Furfural is also one of the main compounds produced during the yeast fermentation process (Almeida et al. 2009; Heer et al. 2009; Lin et al. 2009). Furfural is a constituent of several essential oils from the plant family Pinaceae, the essential oil from Cajenne linaloe, and the oil of leaves of Trifoli pratense and Trifolium incarnatum (Furia and Bellanca 1975). It is present in the distillation waters of essential oils such as ambrette and angelica seeds, in Ceylon cinnamon essential oil, and in petitgrain oil, ylang-ylang, lavender, lemongrass, calamus, eucalyptus, neroli, sandalwood, and tobacco leaves (Furia and Bellanca 1975). Furfural was detected in emissions from acoustic ceiling panels and fibreboard (Alevantis 2003). The IPCS (2000) also reported high levels of furfural in wastewater of the wood pulp industry. The presence of furfural in tobacco and tobacco smoke has been documented in the literature; it is produced by pyrolysis of certain non-volatile substances that could be used as additives in the manufacture of products of tobacco, particularly sugars, which affect taste and aroma (Shaughnessy et al. 2001; Baker and Bishop 2005; Rodgman and Perfetti 2009). However, in Canada, the use of certain additives (including furfural) in the
6

Screening Assessment CAS RN 98-01-1
manufacture of cigarettes, small cigars (little cigars), and leaves of envelope (blunt wraps) is prohibited by the Act to amend the Tobacco Act (Canada 2009).
Based upon the information collected through a survey conducted pursuant of section 71 of CEPA 1999, between 100 000 and 1 000 000 kg of furfural were imported into Canada in 2006 and between 100 000 and 1 000 000 kg of the substance were used in Canada in 2006 (Environment Canada 2008).
Uses In Canada, the uses of furfural identified through the section 71 survey (Environment Canada 2008) are industrial. In Canada, furfural is not listed as an approved food additive under the Canadian Food and Drug Regulations (Canada [1978]). However, it may be used as a flavour in some foods, since flavours are not regulated as food additives under the Food and Drug Regulations (April 2010 personal communication from Food Directorate to Risk Management Bureau; unreferenced). In Europe, furfural is used as a flavour in foods such as baked goods, frozen dairies, meat products, candy, puddings, beverages, and gravies (Adams et al. 1997; EU 2008; Burdock 2010). Furfural has been classified as GRAS (Generally Recognized as Safe) by the Flavour Extract Manufacturers Association (FEMA) (Adams et al. 1997). The Joint FAO/WHO Expert Committee on Food Additives (JECFA 1993) has reported that furfural may be present in some foods as a result of its use as an extraction solvent; however, it is not approved for use as an extraction solvent in foods sold in Canada (April 2010 personal communication from Food Directorate to Risk Management Bureau; unreferenced). In Canada, furfural was identified as a starting material used in the manufacture of an ingredient that is intended for one ink product, which is applied on the exterior of food packaging materials. There is, however, no contact with food resulting from this use (April 2010 personal communication from Food Directorate to Risk Management Bureau; unreferenced). Furfural is a constituent of several essential oils which may be used in cosmetic products predominantly as fragrances. In Canada, fragrances from natural sources are typically reported as one ingredient; therefore, the individual components of a fragrance are not necessarily notified under the Canadian Cosmetic Notification System (Health Canada 2009; March 2010 personal communication from Risk Management Bureau to Existing Substances Risk Assessment Bureau; unreferenced). Concentrations varying between 0.0005 and 0.1% furfural in soap, detergents, creams, lotions, and perfumes were reported in an assessment of furfural by European Union (EU 2008). The European Union (EU) Scientific Committee on Cosmetic Products and Non-Food Products (SCCNFP 2004a) concluded that furfural can be “safely used as a fragrance/flavour
7

Screening Assessment CAS RN 98-01-1
ingredient at a maximum concentration of 0.036% in the fragrance compound except for fragrance compounds intended to be used in toothpaste where the limit is 0.002% in the fragrance compound.” In Canada, furfural is listed in the Natural Health Products Ingredients Database (NHPID) as an acceptable non-medicinal ingredient to be used as a flavour enhancer or solvent in natural health products (NHPID 2010). The NHPID specifies an acceptable daily intake of 0.5 mg/kg-body weight (bw) per day (adopted from JECFA 2000) for furfural (NHPID 2010). Furfural is not listed in the Licensed Natural Health Products Database and is not present in any currently licensed natural health products (LNHPD 2010). In Canada, furfural is listed in the Drug Products Database as an active ingredient in two veterinary products, but not in pharmaceutical drugs for human use (DPD 2010). It is not listed in the Therapeutic Products Directorate’s internal Non-Medicinal Ingredients Database as a non-medicinal ingredient in pharmaceutical drugs for human use or in veterinary products (TPD NMI 2010). In Canada, furfural is also an attractant in three pest control products (one rodenticide and two cockroach baits) at concentrations ranging from 0.000025 to 0.0002% (March 2010 personal communication from Risk Management Bureau to Existing Substances Risk Assessment Bureau; unreferenced). The global use pattern of furfural has been described by the European Chemicals Bureau (EU 2008) and includes the following: manufacture of derivatives (furan and tetrahydrofuran types) mainly for the manufacture of furfuryl alcohol, tetrahydrofurfuryl alcohol, and polytetramethylene ether glycols; chemical intermediate in manufacture of furor, hexamethylene diamine, and pyromucic acid (application restricted to laboratory); extractive distillation of C4 and C5 hydrocarbons for the manufacture of synthetic rubber, especially butadiene and isoprene (2-methyl-1,3-butadiene); selective solvent for separating saturated compounds in petroleum lubricating oil, gas oil, and diesel fuel to increase their stability under operation conditions and to improve the viscosity index; solvent and processing aid for separation of anthracene from coal and coal products (out of date application); reactive solvent and wetting agent in the manufacture of abrasive wheels and brake linings and refractories; reactive solvent for phenolic-Novolak and furfuryl alcohol resins; flavour component in a wide range of foods; herbicide, fungicide, insecticide, germicide, and nematicide; decolourization agent for wood resin; ingredient in dyes, polymers, and resins; fragrance in soap, detergent, lotion, cream, and perfume; agent in analytic chemistry; vulcanisation accelerator; solvent for nitrated cotton, cellulose acetate, and gums; road construction and metal refining; component of gas oil marker GOM X.
Releases to the Environment
8
Screening Assessment CAS RN 98-01-1
Furfural may be released to the environment through various waste streams as a result of its production and use as a solvent, a chemical feedstock for furan derivatives, a wetting agent, and a flavouring ingredient (Kottke 2000; Lewis 2003). Furfural may be released to the environment through the final effluent (sulfite evaporator condensate fraction only) of wood pulp mills, owing to incomplete degradation of furfural at wastewater systems (IPCS 2000). Flue gas emissions from a municipal waste incinerator in Germany contained 0.18 µg furfural/m3 (Jay and Stieglitz 1995). Furfural has been identified in smoke from burning wood (Lipari et al. 1984; Kleindienst et al. 1986; McDonald et al. 2000) and wildfires (Materna et al. 1992).
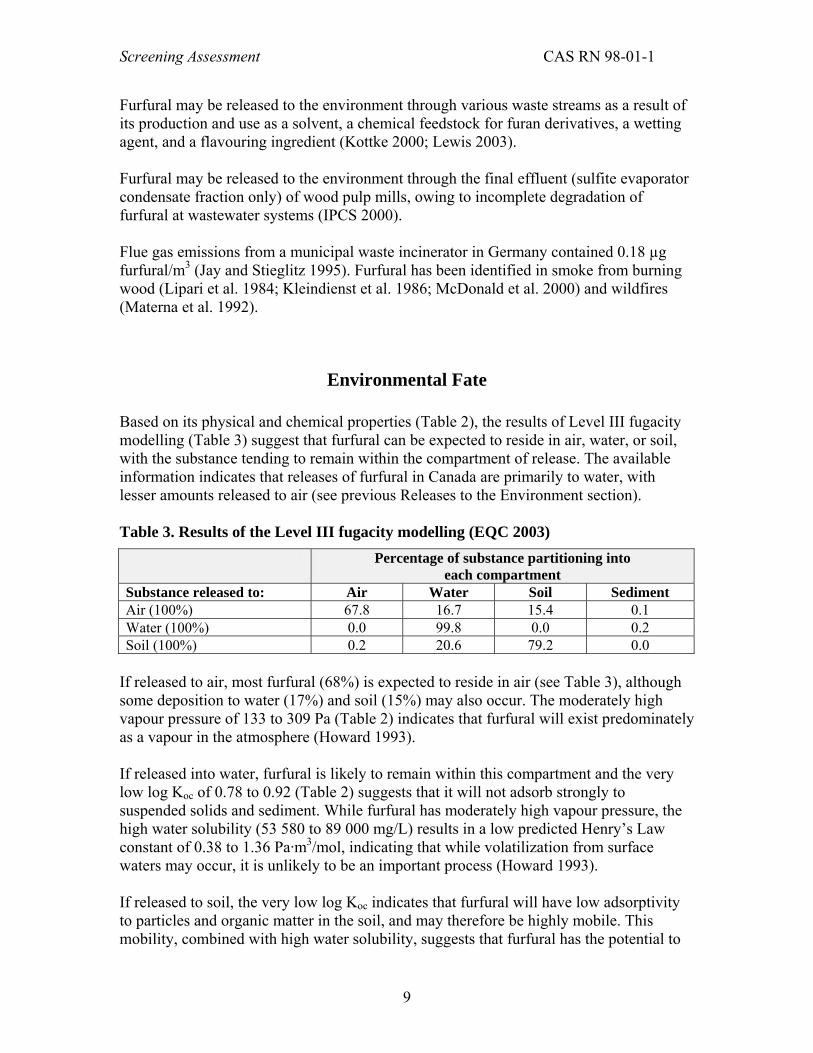
Environmental Fate Based on its physical and chemical properties (Table 2), the results of Level III fugacity modelling (Table 3) suggest that furfural can be expected to reside in air, water, or soil, with the substance tending to remain within the compartment of release. The available information indicates that releases of furfural in Canada are primarily to water, with lesser amounts released to air (see previous Releases to the Environment section). Table 3. Results of the Level III fugacity modelling (EQC 2003)
Percentage of substance partitioning into each compartment
Substance released to: Air Water Soil Sediment Air (100%) 67.8 16.7 15.4 0.1 Water (100%) 0.0 99.8 0.0 0.2 Soil (100%) 0.2 20.6 79.2 0.0
If released to air, most furfural (68%) is expected to reside in air (see Table 3), although some deposition to water (17%) and soil (15%) may also occur. The moderately high vapour pressure of 133 to 309 Pa (Table 2) indicates that furfural will exist predominately as a vapour in the atmosphere (Howard 1993). If released into water, furfural is likely to remain within this compartment and the very low log Koc of 0.78 to 0.92 (Table 2) suggests that it will not adsorb strongly to suspended solids and sediment. While furfural has moderately high vapour pressure, the high water solubility (53 580 to 89 000 mg/L) results in a low predicted Henry’s Law constant of 0.38 to 1.36 Pa·m3/mol, indicating that while volatilization from surface waters may occur, it is unlikely to be an important process (Howard 1993). If released to soil, the very low log Koc indicates that furfural will have low adsorptivity to particles and organic matter in the soil, and may therefore be highly mobile. This mobility, combined with high water solubility, suggests that furfural has the potential to
9

Screening Assessment CAS RN 98-01-1
move rapidly downward through the soil profile, potentially reaching and contaminating groundwater. However, rapid microbial degradation (see Environmental Persistence section) is expected to limit the residence time of the substance in soil, with rapid mineralization probably precluding significant downward movement. While volatilization from both moist and dry soil surfaces may occur owing to the moderately high vapour pressure of the substance, the low Henry’s Law constant suggests that this process will not be important (Howard 1993). These results represent the partitioning of the substance in a hypothetical evaluative environment resulting from intermedia partitioning, and loss by both advective transport (out of the modelled region) and degradation/transformation processes. The partitioning values shown in Table 3 represent the net effect of these processes under conditions of continuous release when a non-equilibrium “steady-state” has been achieved.
Persistence and Bioaccumulation Potential Environmental Persistence Empirical degradation data for furfural is presented in Table 4a. Based on consideration of releases and partitioning behaviour, air, water, and soil are the primary media of interest for this substance. A rate coefficient of 3.51 × 10⁻¹¹ cm3·molecule−1·s−1 was determined for the gas-phase reaction of furfural with photochemically produced hydroxyl radicals at approximately 25°C, corresponding to an upper limit atmospheric residence time of 5.0 hours based on a 12-hour average hydroxyl radical concentration of 1.6 × 10⁶ molecules/cm (Bierbach et al. 1995). Applying methods described in Aronson and Howard (1999), an atmospheric half-life of 0.44 day was calculated from these data (EU 2008), indicating that furfural is unlikely to be persistent in air. In addition, night-time destruction by nitrate radicals may be an important atmospheric degradation process for furfural in urban areas and direct photochemical degradation is also expected to occur (Howard 1993). Empirical photolytic half-lives of 6.72, 6.00, and 6.69 days at pH 5, 7, and 9, respectively, were determined after a 30-day exposure of a 9.81 mg/L concentration to indoor artificial sunlight (Study Submission 2010). Based on these results, furfural is expected to undergo photolysis in natural water bodies, producing multiple photoproducts including succinic acid, malonic acid, 2-ketoglutaric acid, formic acid, and propionic acid. A hydrolysis study performed at 25°C and at pH 5, 7, and 9 found that furfural was hydrolytically stable, with no degradation products detected over the 30-day study period (Study Submission 2010).
10

Screening Assessment CAS RN 98-01-1
NITE (2002) determined furfural to be readily biodegradable in standard ready biodegradation testing, with 93.5% biodegradation occurring over a 2-week period at an exposure concentration of 100 mg/L. Furfural was readily biodegraded by acclimated activated sludge exposed to a test concentration of 200 mg/L in a flow-through aerobic batch culture, with 96.3% degradation occurring within 5 days (Pitter 1976). Biodegradation was also observed with non-acclimated organisms; however, an acclimation period of 4 to 7 days was required before biodegradation occurred (Rowe and Tullios 1980). Table 4a. Empirical data for degradation of furfural
Medium Fate process Degradation value
Degradation endpoint / units Reference
Air Photodegradation 3.51 × 10⁻¹¹ Rate coefficient / cm3·molecule−1·s−1 Bierbach et al. 1995
Water Photodegradation 6.00–6.72 Photolytic half-life / days
Study Submission 2010
93.5 14-day aerobic
biodegradation / % (ultimate)
NITE 2002
96.3 5-day aerobic
biodegradation / % (ultimate)
Pitter 1976 Water Biodegradation
99–100
30-day anaerobic biodegradation / %
(ultimate) Benjamin et al. 1984
79–100
0.7–28.8
63-day aerobic biodegradation / %
(ultimate) Calculated primary
half-life / hours Soil Biodegradation
34.5–66.0
17.8–45.6
183-day anaerobic biodegradation / %
(ultimate) Calculated primary
half-life / hours
Study Submission 2010
Almost complete (100%) biodegradation was reported within 30 days in non-acclimated anaerobic activated sludge systems exposed to 580 mg/L furfural (Benjamin et al. 1984). Biodegradation ceased in the non-acclimated culture at a higher test concentration of 1160 mg/L; however, following exposure to a feed solution of approximately 310 mg/L furfural for a period of 8 months, the acclimated culture was able to biodegrade concentrations up to 2320 mg/L, with 99% removal of the substance observed after 32 days. Extremely rapid primary biodegradation of furfural was reported in aerobic sandy loam soils exposed at an application rate of 150 mg/kg, with calculated half-lives ranging from
11
Screening Assessment CAS RN 98-01-1
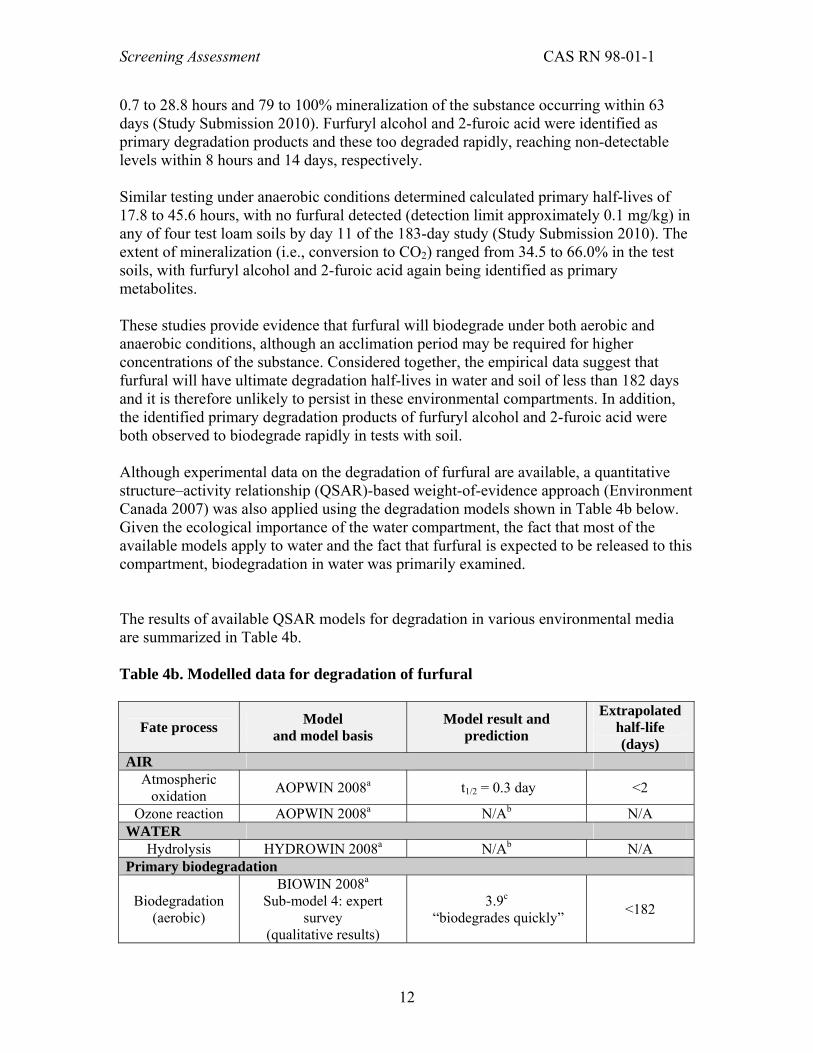
0.7 to 28.8 hours and 79 to 100% mineralization of the substance occurring within 63 days (Study Submission 2010). Furfuryl alcohol and 2-furoic acid were identified as primary degradation products and these too degraded rapidly, reaching non-detectable levels within 8 hours and 14 days, respectively. Similar testing under anaerobic conditions determined calculated primary half-lives of 17.8 to 45.6 hours, with no furfural detected (detection limit approximately 0.1 mg/kg) in any of four test loam soils by day 11 of the 183-day study (Study Submission 2010). The extent of mineralization (i.e., conversion to CO2) ranged from 34.5 to 66.0% in the test soils, with furfuryl alcohol and 2-furoic acid again being identified as primary metabolites. These studies provide evidence that furfural will biodegrade under both aerobic and anaerobic conditions, although an acclimation period may be required for higher concentrations of the substance. Considered together, the empirical data suggest that furfural will have ultimate degradation half-lives in water and soil of less than 182 days and it is therefore unlikely to persist in these environmental compartments. In addition, the identified primary degradation products of furfuryl alcohol and 2-furoic acid were both observed to biodegrade rapidly in tests with soil. Although experimental data on the degradation of furfural are available, a quantitative structure–activity relationship (QSAR)-based weight-of-evidence approach (Environment Canada 2007) was also applied using the degradation models shown in Table 4b below. Given the ecological importance of the water compartment, the fact that most of the available models apply to water and the fact that furfural is expected to be released to this compartment, biodegradation in water was primarily examined. The results of available QSAR models for degradation in various environmental media are summarized in Table 4b. Table 4b. Modelled data for degradation of furfural
Fate process Model and model basis
Model result and prediction
Extrapolated half-life (days)
AIR Atmospheric
oxidation AOPWIN 2008a t1/2 = 0.3 day <2
Ozone reaction AOPWIN 2008a N/Ab N/A WATER
Hydrolysis HYDROWIN 2008a N/Ab N/A Primary biodegradation
Biodegradation (aerobic)
BIOWIN 2008a Sub-model 4: expert
survey (qualitative results)
3.9c “biodegrades quickly” <182
12

Screening Assessment CAS RN 98-01-1
Fate process Model and model basis
Extrapolated Model result and half-life prediction (days) Ultimate biodegradation
Biodegradation (aerobic)
BIOWIN 2008a Sub-model 3: expert
survey (qualitative results)
3.0c “biodegrades quickly” <182
Biodegradation (aerobic)
BIOWIN 2008a Sub-model 5:
MITI linear probability
0.9d “biodegrades quickly” <182
Biodegradation (aerobic)
BIOWIN 2008a Sub-model 6:
MITI non-linear probability
1.0d “biodegrades quickly” <182
Biodegradation (aerobic)
TOPKAT 2004 probability
1d “biodegrades very quickly” <182
Biodegradation (aerobic)
CATABOL c2004–2008 % BOD
(biological oxygen demand)
% BOD = 66.8
“biodegrades quickly” <182
a EPIsuite (2008) b N/A: not applicable; model does not provide an estimate for this type of structure. c Output is a numerical score from 0 to 5. d Output is a probability score. In air, a predicted atmospheric oxidation half-life value (t1/2) of 0.3 day (Table 4b) supports the empirical evidence that suggests rapid oxidation of furfural in air. While no estimate is available for the reaction half-life with other photo-oxidative species in the atmosphere, such as ozone, AOPWIN (2008) notes that reaction with nitrate radicals may be important. However, reaction with hydroxyl radicals is expected to be the most important fate process for this substance in the atmosphere, and with a half-life of 0.3 day via reactions with hydroxyl radicals, furfural is considered to be not persistent in air. No hydrolysis estimate is available for furfural; however, based on the empirical data presented above, the substance is not expected to hydrolyze under environmental conditions. The modelled biodegradation results agree well with data obtained experimentally and predict that furfural will biodegrade rapidly in water with a half-life of much less than 182 days. In addition, the small molecular size and absence of extremely stable functional groups on the molecule (Table 1) provide further support for rapid degradation. BIOWIN (2008) predicts that the primary degradation products, furfuryl alcohol (CAS RN 98-00-0) and 2-furoic acid (CAS RN 88-14-2), will also biodegrade rapidly under both aerobic and anaerobic conditions. Using an extrapolation ratio of 1:1:4 for a water : soil : sediment biodegradation half-life (Boethling et al. 1995), the predicted ultimate biodegradation half-life in soil is then also less than 182 days. As both empirical and modelled data support an ultimate
13

Screening Assessment CAS RN 98-01-1
biodegradation half-life in water of less than 90 days (see Tables 4a and 4b), the predicted half-life in sediments is considered to be less than 365 days. Therefore, based on empirical and modelled data, furfural does not meet the persistence criteria for air, water, soil, or sediment (half-life in air ≥ 2 days, half-lives in soil and water ≥ 182 days, and half-life in sediment ≥ 365 days) as set out in the Persistence and Bioaccumulation Regulations (Canada 2000).
Potential for Bioaccumulation Experimental and modelled log Kow values of 0.41 and 0.83, respectively, for furfural suggest this chemical has low potential to bioaccumulate (see Table 2). Since no experimental bioaccumulation factor (BAF) and/or bioconcentration factor (BCF) data for furfural were available, a predictive approach was applied with available BAF and BCF models as shown in Table 5. According to the Persistence and Bioaccumulation Regulations (Canada 2000), a substance is bioaccumulative if its BCF or BAF is ≥ 5000; however, measures of BAF are the preferred metric for assessing bioaccumulation potential of substances. This is because the BCF may not adequately account for the bioaccumulation potential of substances via the diet, which predominates for substances with log Kow greater than ~4.0 (Arnot and Gobas 2003). Kinetic mass-balance modelling is in principle considered to provide the most reliable prediction method for determining the bioaccumulation potential because it allows for metabolism correction as long as the log Kow of the substance is within the log Kow domain of the model. As the log Kow of furfural is much less than 4.0 (i.e., 0.41 and 0.83), direct uptake from the surrounding aqueous medium, such as that occurring across gill surfaces of aquatic organisms, is expected to predominate over dietary uptake. Although the predictions in Table 5 account for whole-body biotransformation, this loss process is not expected to be a major route of elimination from fish or other aquatic organisms and so has little or no effect on the calculated result. Table 5. Modelled data for bioaccumulation for furfural
Test organism Endpoint Value wet weight (L/kg)
Reference
Fish BAF 1.1 Fish BCF 1.1
BCFBAF 2008 (Arnot and Gobas 2003,
middle trophic level) Fish BCF 3.2 BCFBAF 2008
(regression-based estimate) Fish BCF 3.2 BBM with Mitigating
Factors 2008
Based on the available modelled data, furfural does not meet the bioaccumulation criterion (BAF or BCF ≥ 5000) as set out in the Persistence and Bioaccumulation Regulations (Canada 2000).
14
Screening Assessment CAS RN 98-01-1
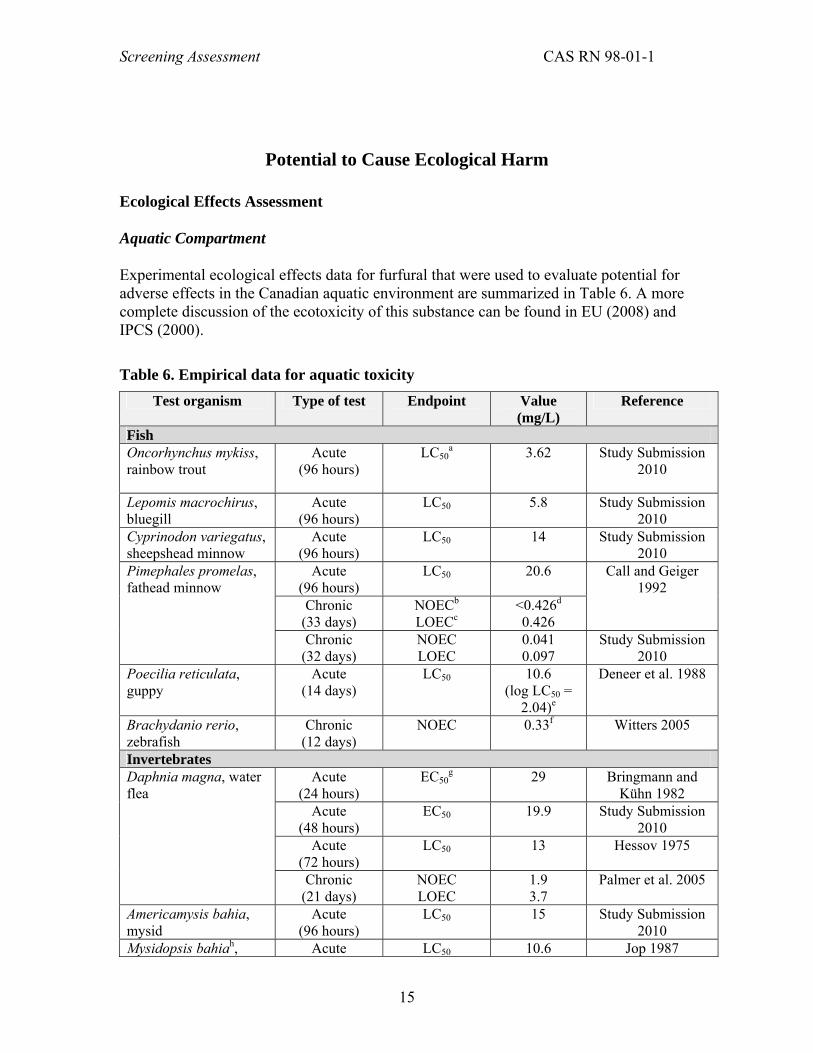
Potential to Cause Ecological Harm Ecological Effects Assessment Aquatic Compartment Experimental ecological effects data for furfural that were used to evaluate potential for adverse effects in the Canadian aquatic environment are summarized in Table 6. A more complete discussion of the ecotoxicity of this substance can be found in EU (2008) and IPCS (2000).
Table 6. Empirical data for aquatic toxicity Test organism Type of test Endpoint Value
(mg/L) Reference
Fish Oncorhynchus mykiss, rainbow trout
Acute (96 hours)
LC50a 3.62 Study Submission
2010
Lepomis macrochirus, bluegill
Acute (96 hours)
LC50 5.8 Study Submission 2010
Cyprinodon variegatus, sheepshead minnow
Acute (96 hours)
LC50 14 Study Submission 2010
Acute (96 hours)
LC50 20.6
Chronic (33 days)
NOECb LOECc
<0.426d 0.426
Call and Geiger 1992
Pimephales promelas, fathead minnow
Chronic (32 days)
NOEC LOEC
0.041 0.097
Study Submission 2010
Poecilia reticulata, guppy
Acute (14 days)
LC50 10.6 (log LC50 =
2.04)e
Deneer et al. 1988
Brachydanio rerio, zebrafish
Chronic (12 days)
NOEC 0.33f Witters 2005
Invertebrates Acute
(24 hours) EC50
g 29 Bringmann and Kühn 1982
Acute (48 hours)
EC50 19.9 Study Submission 2010
Acute (72 hours)
LC50 13 Hessov 1975
Daphnia magna, water flea
Chronic (21 days)
NOEC LOEC
1.9 3.7
Palmer et al. 2005
Americamysis bahia, mysid
Acute (96 hours)
LC50 15 Study Submission 2010
Mysidopsis bahiah, Acute LC50 10.6 Jop 1987
15

Screening Assessment CAS RN 98-01-1
Test organism Type of test Endpoint Value Reference (mg/L)
mysid (96 hours) Crassostrea virginica, Eastern oyster
Acute (96 hours)
EC50 NOEC LOEC
19 8.2 13
Study Submission 2010
Algae Pseudokirchneriella subcapitata, green alga
Chronic (96 hours)
EC50 29 Study Submission 2010
Lemna gibba, duckweed
Chronic (7 days)
EC50 NOEC LOEC
49 0.29 0.80
Study Submission 2010
Skeletonema costatum, diatom Navicula pelliculosa, diatom Anabaena flos-aquae, blue-green alga
Chronic (96 hours)
EC50 46
>42
130
Study Submission 2010
Microcystis aeruginosa, blue-green alga Scenedesmus quadricauda, green alga
Chronic (8 days)
NOEC 2.7
31
Bringmann and Kühn 1978
a LC50 – The concentration of a substance that is estimated to be lethal to 50% of the test organisms. b NOEC – The No Observed Effect Concentration is the highest concentration in a toxicity test not causing a statistically significant effect compared with the controls.
c LOEC – The Lowest Observed Effect Concentration is the lowest concentration in a toxicity test that caused a statistically significant effect compared with the controls.
d Significant effects were observed at the lowest concentration tested, therefore a NOEC could not be established from the study.
e The LC50 was reported as 109.6 µmoles/L. f Value represents the best estimate of the actual exposure concentration, corresponding to a nominal concentration of 0.5 mg/L. Based on this NOEC, the nominal LOEC was 1.0 mg/L.
g EC50 − The concentration of a substance that is estimated to cause some effect on 50% of the test organisms.
h This species was later re-named Americamysis bahia. The moderately high vapour pressure of furfural, as well as evidence of relatively rapid degradation in water, suggest that loss of the test substance may occur during aquatic toxicity testing. For this reason, emphasis has been placed on studies where exposure concentrations are measured. Furfural is an aldehyde and therefore displays greater reactivity and higher toxicity than that seen with a non-polar narcosis mode of toxic action. Acute toxicity endpoint values for fish and aquatic invertebrates are in the range of 3 to 30 mg/L, indicating that furfural is moderately toxic to aquatic species following short-term exposure. Longer exposure periods may elicit toxic effects at relatively low concentrations, as evidenced by endpoint values of less than 1 mg/L for some test species (Table 6). Fathead minnow, Pimephales promelas, fry exposed for 33 days to nominal concentrations of 0.5 to 1.0 mg/L exhibited significantly reduced growth, morphological abnormalities, and lethargy at
16

Screening Assessment CAS RN 98-01-1
concentrations at and above the lowest test concentration of 0.5 mg/L nominal (0.426 mg/L mean measured concentration; Call and Geiger 1992). Study Submission (2010) reported a Lowest Observed Effect Concentration (LOEC) of 0.097 mg/L (mean measured concentration) for significantly reduced larval length in P. promelas exposed for 32 days, while Witters (2005) reported reduced survival and negative effects on egg hatching time, larval behaviour, and morphology in zebrafish, Brachydanio rerio, exposed to nominal concentrations of 0.5 to 15 mg/L furfural over a 12-day period. Significant reductions in reproduction and growth were observed in Daphnia magna exposed for 21 days to a measured concentration of 3.7 mg/L (Palmer et al. 2005). Chronic median effect concentrations (EC50s) for algae range from 29 to 130 mg/L and a LOEC of 0.80 mg/L was reported for significantly reduced frond biomass in duckweed, Lemna gibba, after a 7-day exposure period (Study Submission 2010). These data indicate that furfural has low to moderate chronic toxicity to algal species. Other Environmental Compartments Empirical toxicity data for furfural are available for soil-dwelling species, honeybees, and some bird species (Table 7). The results indicate that furfural exhibits low to moderate toxicity among the species tested. Table 7. Empirical data for terrestrial toxicity
Test organism Type of test Endpoint (units)
Value Reference
Eisenia foetida, earthworm
Acute (14 days)
LC50a
(mg/kg dw)b 406.18 Study Submission
2010 Folsomia candida, collembola (springtail)
Chronic (28 days)
LC50 NOECc LOECd
(mg/kg dw)
54 37.5e
75
Study Submission 2010
Apis melliflera L., honeybee
Acute (oral)f
(contact)g
LD50h
(mg test substance per
bee)
>0.1 >0.1
Study Submission 2010
Colinus virginianus, northern bobwhite
Acutef (oral)
LD50 (mg/kg-bw)i
85 Study Submission 2010
Coturnix japonica, Japanese quail
Acutef (oral)
LD50 (mg/kg-bw)
279.38 Study Submission 2010
Anas platyrhynchus, mallard duck
Acutef (oral)
LD50 (mg/kg-bw)
360.09 Study Submission 2010
Agelaius phoeniceus, red-winged blackbird
Acutef (oral)
LD50 (mg/kg-bw)
>98.0 Schafer et al. 1983
a LC50 – The concentration of a substance that is estimated to be lethal to 50% of the test organisms. b mg of test substance/kg dry weight (dw) soil. c NOEC – The No Observed Effect Concentration is the highest concentration in a toxicity test not causing a statistically significant effect compared with the controls.
17

Screening Assessment CAS RN 98-01-1
d LOEC – The Lowest Observed Effect Concentration is the lowest concentration in a toxicity test that caused a statistically significant effect compared with the controls.
e Study protocol is not directly applicable to volatile substances and therefore results should be treated with caution. As well, exposure concentrations were not measured during the test.
f Testing consisted of a single oral dose followed by a 14-day observation period. g Testing consisted of a single dose applied topically to the abdomen and/or thorax followed by a 48-hour observation period.
h Dose of a substance that causes mortality in 50% of test organisms. i mg of test substance/kg body weight of bird. A median lethal concentration (LC50) of 406.18 mg/kg dry weight (dw) of soil was calculated for earthworms, Eisenia foetida, exposed for 14 days to test concentrations of 225 to 864.4 mg furfural/kg dw of soil (Study Submission 2010). In 28-day testing with springtails, Folsomia candida, significant mortality and reduced juvenile production occurred at soil concentrations of 75 to 600 mg/kg dw (Study Submission 2010). An LC50 of 54 mg/kg dw for mortality and a LOEC of 75 mg/kg dw for both mortality and reproduction were determined from the study; however, the authors note that the results should be interpreted with caution as the protocol used (ISO 11267) specifies that the method is not applicable to volatile substances. For this reason, in the context of this screening assessment, the data are viewed as a qualitative rather than quantitative indicator of the potential for toxicity to soil-dwelling species. Studies for acute oral toxicity (limit test) and contact toxicity were conducted with the honeybee, Apis melliflera L. (Study Submission 2010). For both studies, less than 50% mortality occurred at the highest test concentration of 100 µg (0.1 mg) furfural per bee. The results indicate that furfural is relatively non-toxic to honeybees based on the categories developed by Atkins et al. (1981) that are commonly used to evaluate the toxicity of pesticide products (e.g., OECD 2008). Furfural has demonstrated moderate toxicity in standard toxicity testing that used several bird species, in which acute oral LD50 values ranged from 85 to 360 mg/kg bw (Table 7). In addition, laboratory studies that used rodents and other mammals have been conducted with furfural to evaluate the potential for effects on human health and relevant data from these studies are presented in the Human Health Effects section of this assessment. Ecological Exposure Assessment Relevant North American monitoring data for furfural reported in the published literature are presented in Table 8. As this substance is produced naturally (see Sources section), it is expected that low background levels will always be present in the environment. Because of this, it may sometimes be difficult to determine the relative contribution and sources of anthropogenically produced furfural present in a medium.
18

Screening Assessment CAS RN 98-01-1
Table 8. Concentrations of furfural in the North American environment
Medium Location; year No. of samples Concentration Reference
Air
Outdoor air in suburban area
New Jersey, USA; 1992 in 7 of 36b
2.4 × 10⁻⁴ – 2.7 × 10⁻³ mg/m3
(0.06–0.69 ppb) 6.7 × 10⁻⁴ mg/m3 (mean: 0.17 ppb)
Zhang et al. 1994
Smolder fires (condensate)
Montana, USA; no year 14 80–1600 mg/kg McKenzie et al.
1995 Wood combustion emissions (volatile component)
Colorado, USA; no year 19 4–445 mg/kg McDonald et al.
2000
Water
Surface water Lake Michigan, USA; 1977 in 1 of 13c 0.002 mg/L Konasewich et al.
1978 Surface water near industrial sites
USA; no year in 1 of 204d 0.002 mg/L Ewing et al. 1977
Rubber plant wastewater
Louisiana, USA; no year 1 0.0017 mg/L Keith 1974
Pulp mill wastewatera
Washington, USA: no year 5 179–471 mg/L
(mean: 274 mg/L) Benjamin et al. 1984
a Sulfite evaporator condensate fraction only. b Detection limit, 0.12 ppb. c Detection limit not provided. d Detection limit, 1 ppb. As only limited and potentially outdated water monitoring data are available for furfural, a modelling approach was used to estimate potential concentrations in the Canadian aquatic environment. Since highest potential releases are expected to be to water during industrial use, a conservative industrial release scenario was developed with Environment Canada’s Industrial Generic Exposure Tool – Aquatic (IGETA) to estimate a potential concentration in the Canadian aquatic environment resulting from an industrial discharge. This yielded a predicted environmental concentration (PEC) of 0.008 mg/L. Details regarding the inputs used to estimate this concentration and the output of the model are described in Environment Canada (2009, 2010).
Characterization of Ecological Risk The approach taken in this assessment was to examine the available scientific information and develop conclusions based on a weight-of-evidence approach and using precaution as required under CEPA 1999. Lines of evidence considered include results from a conservative risk quotient calculation, as well as information on the persistence, bioaccumulation, toxicity, sources, and fate of the substance.
19

Screening Assessment CAS RN 98-01-1
As described previously, furfural has been determined to have a relatively short half-life in all environmental compartments (i.e., to degrade readily in the environment). It is also expected to have low bioaccumulation potential. The substance has exhibited low to moderate toxicity in terrestrial wildlife species, although there is evidence of higher toxicity in some rodent species following repeated oral exposures (see Human Health Effects section of this assessment). In the environment, rapid degradation and low bioaccumulation potential will significantly reduce the exposure potential of furfural to wildlife, limiting the possibility of food chain effects. There is also evidence that furfural can cause adverse effects in sensitive aquatic organisms exposed for long periods of time to relatively low concentrations (i.e., chronic effect values for some species are considerably less than 1 mg/L). As release to water was identified as the primary route of entry of furfural into the environment (see Releases to the Environment section), a quantitative analysis of the potential for risk to aquatic species was undertaken. A conservative Predicted No Effect Concentration (PNEC) for water was derived from the lowest aquatic toxicity value identified—a 32-day chronic LOEC for fathead minnow, Pimephales promelas, of 0.097 mg/L (Study Submission 2010). An assessment factor was then applied to this critical toxicity value to account for uncertainties related to interspecies and intraspecies variability in sensitivity and extrapolation from a laboratory effect level to a no-effect value in the field. In light of the substantial empirical database for this substance and because the selected critical toxicity value is only one of two endpoint values falling below 1 mg/L, suggesting it is already a very sensitive endpoint, an assessment factor of 10 was selected. This results in a PNEC of 0.0097 mg/L. The resulting conservative risk quotient (PEC/PNEC) of 0.8 indicates that environmental exposure to furfural is unlikely to be high enough to cause harm to aquatic organisms. Since the majority of releases are expected to be to waters at industrial manufacturing sites, and the results of fugacity modeling indicate that most of the substance discharged to water will remain within that compartment (Table 3), significant exposure of organisms in other media after release of the substance into surface waters is considered unlikely. In addition, highest reported outdoor air concentrations (2.7 × 10⁻³ mg/m3; Table 8) are much lower than the LOEC of 20 mg/m3 reported in laboratory studies with rodents (see Human Health Effects section of this assessment). Based on this information, it is considered unlikely that furfural is causing harm to aquatic or terrestrial organisms in Canada. This conclusion was reached despite conservative assumptions made in response to uncertainties encountered in the assessment. A key uncertainty relates to the lack of empirical data on current environmental concentrations in Canada, including the possible presence of the substance in pulp mill effluents. This uncertainty was addressed by
20

Screening Assessment CAS RN 98-01-1
predicting a conservative concentration in water by means of an industrial exposure model. In addition, the assessment of bioaccumulation potential is limited by the absence of empirical bioaccumulation data and this necessitated the use of predictive models. Although all predictions that use models have some degree of error, the model results are consistent with the known physical and chemical properties of this substance, most notably measured and predicted values for the log Kow.
21
Screening Assessment CAS RN 98-01-1
Potential to Cause Harm to Human Health Exposure Assessment Environmental Media and Food Upper-bound estimates of total daily intake of furfural by the Canadian general population are presented in Appendix 1. The total daily estimates ranged from 1.53 µg/kg-bw per day for breast milk fed infants to 82.47–1306 µg/kg-bw per day for 20–59-year-old adults. Food was found to be the predominant source of exposure. Environmental Media No Canadian data were identified for concentrations of furfural in ambient air. The maximum concentration of 0.69 ppb (2.7 µg/m3)3 detected in 7 of 36 samples of ambient air near six residences in suburban New Jersey in the summer of 1992 (Zhang et el. 1994) was used as the basis of intake from ambient air. A lower concentration of furfural was reported in ambient air in Louisiana (Krause et al. 2009) and in 6 of 15 ambient air samples in Japan (range: 42 to 120 ng/m3) (Japan Environment Agency 1998). Furfural was detected but not quantified in ambient air sampled from a road tunnel in the USA (Hampton et al. 1982), near Pinus halepensis trees in Algeria in 1997 (Yassaa et al. 2000), and above the canopy of the Southern Black Forest in 1984–1985 (Juttner 1986). No Canadian data were identified for indoor air. Data on levels of furfural in indoor air in Finland and the USA are presented in Appendix 2. Furfural was detected in the indoor air of 11 new houses (four new manufactured, seven site-built) in the eastern and southeastern USA in 1997, between 2 and 9.5 months after their completion (geometric mean ranged from 0.5 to <1.5 ppb; 1.965 µg/m3 to <5.895 µg/m3) (Hodgson et al. 2000). In suburban New Jersey in 1992, furfural was detected in 19 of 36 samples of indoor air from six homes; the mean concentration was 0.27 ppb (1.061 µg/m3) (Zhang et al. 1994). Krause et al. (2009) investigated a limited number of homes in Florida and Louisiana for volatile organic compounds. In one home in Florida, furfural was detected in three of six samplings throughout a 24-hour period on the second floor, at concentrations of 1, 1.1, and 1.2 µg/m3. In a second home, concentrations of 2.1 to 2.7 µg/m3 were measured. In sampling of outdoor air, furfural was detected in two of six samples at concentrations of 0.1 and 0.1 µg/m3. In Louisiana, furfural was detected in one of three homes (mean of
3 1 ppm = 3.93 mg/m3 at 25°C (EU 2008).
22

Screening Assessment CAS RN 98-01-1
five samples: 0.49 ppb by volume or 1.926 µg/m3). It was detected in ambient air near that home, in one of four samples (0.253 ppb by volume or 0.994 µg/m3). Furfural was detected in 81% of indoor air samples from 26 homes in Finland (Kostiainen 1995). Subsequently, indoor air was sampled in 50 homes; the mean concentration of furfural was 1.56 µg/m3 (ranging from 0.16 to 6.30 µg/m3). Although limited, the identified data on concentrations of furfural in indoor air were consistent (see Appendix 2). The highest mean concentration4 measured in 11 new homes in the USA (Hodgson et al. 2000) was selected to calculate the upper-bounding estimate of intake of furfural from indoor air. The mean values reported in this study were higher than the mean concentration reported for indoor air in a larger study (n = 50) of homes in Finland (Kostiainen 1995). Concentrations of furfural in drinking water in Canada were not identified. Although furfural has been identified in drinking water supplies in the USA and Europe, no quantitative data were reported (Kool et al. 1982). Furfural has been detected in drinking water in Iowa (Lucas 1984). In 1 of 204 samples of surface water near heavily industrialized areas across the USA, furfural was identified at a concentration of 2 ppb (2 µg/L) (Ewing et al. 1977). It was identified in 1 of 13 samples of surface water from the Lake Michigan basin at a concentration of 2 µg/L (Konasewich et al. 1978). Furfural was not detected in 33 samples of surface water in Japan in 1996 (with a detection limit of 0.4 ng/L) (Japan Environment Agency 1998). The estimate of intake of furfural from drinking water by the general population was based on the concentration of 2 µg/L detected in 1 of 13 samples of surface water from the Lake Michigan basin (Konasewich et al. 1978). Data on concentrations of furfural in soil, sediment, or dust in Canada or elsewhere were not identified. Food Furfural is present in numerous food items. It occurs naturally and can also be formed during thermal processing (i.e., cooking from acid hydrolysis or heating of polysaccharides containing pentose and hexose fragments) (EU 2008). Furfural has been measured at various levels in all food groups, including fruits and vegetables, dairy products, meat and fish, coffee, alcoholic beverages, and bread and bread products. The data found on concentrations of furfural in foods are summarized in Appendices 3 and 4. Estimates of furfural intake from food and beverages are summarized in Appendix 1 and the details of the assessment are presented in Appendices 5 and 6. 4 Ranges of concentrations were not reported by the authors.
23

Screening Assessment CAS RN 98-01-1
The dietary exposure assessment of furfural from food indicated that coffee is the single item, next to wine, resulting in high consumption in the population. Therefore, a range of intakes (based on lower and upper values for coffee) is presented. The food items and corresponding levels of furfural used in the dietary exposure assessment are listed in Appendix 6. Owing to the high variability of furfural levels within each category of food, high variability in intake from food and beverages across the population is expected, with greater intake for those individuals who are consumers of coffee and alcoholic beverages. Furfural has been detected in breast milk (Erickson et al. 1980; Pellizzari et al. 1982); however, no quantitative data are available, and estimates of furfural from breast milk were therefore not considered in the dietary exposure assessment. Total daily intake of furfural from food ranges from 37.76 µg/kg-bw/d in formula fed infants (representing 96.3% of total daily intake from all sources) to 82.41–1306 µg/kg-bw/d (range represents lower and upper values for coffee) for 20- to 59–year-old adults (representing up to 99.9% of total daily intake from all sources). These estimates are of the same magnitude as estimates from FEMA (total potential daily intake of furfural and precursors of furfural from naturally occurring presence in food were estimated to be approximately 300 µg/kg-bw per day) (EU 2008). This dietary intake is an upper-bound estimate based on concentrations found in food items as a result of natural occurrence. It is recognized that furfural could be present in food as a result of its use as a flavouring agent; however, the available information, although limited, indicates that furfural would be intentionally added to food at very low levels. This view is supported by an assessment by the Joint FAO/WHO Expert Committee on Food Additives (JECFA) who assessed the risk associated with the use of furfural as a food additive and estimated “current levels of intake” to be 9 µg/kg-bw per day in the USA and 8 µg/kg-bw per day in Europe (WHO 2001). JECFA considered intake from food additive uses to represent 1 to 3% of total intake from all sources (WHO 1999). The European Union published a risk assessment of furfural in 2008, in which the risk associated with the use of furfural as a food additive was evaluated. Intake of furfural from its use as a flavouring agent, derived by JECFA, was reported as 9 µg/kg-bw per day and a theoretical maximum daily intake of 136 µg/kg-bw per day (EU 2008). This value was based on the assumption that consumers consume all flavoured foods at maximum permitted concentrations of furfural at all times. In the EU report, the maximum daily intake was reported as being a worst-case estimate, which may be orders of magnitude above the actual intake. Consumer Products Reports of furfural as an ingredient in consumer products in Canada were not identified. It may be present as a component of essential oils used as fragrances in cosmetics, personal care products and consumer products.
24
Screening Assessment CAS RN 98-01-1
The EU (2008) presented estimates of intake of furfural from personal care products (Appendix 7). The highest intake was 0.36 µg/kg-bw per day for application of eau de toilette by a 60-kg individual; the total estimated intake from personal care products was approximately 1 µg/kg-bw per day. The Danish Environmental Protection Agency (2004) reported that furfural was released from both ignited and unignited incense. Vapours from six types of burning incense were analyzed. The predicted concentrations in a hypothetical room of 20 m3 ranged from 2.2 to 16.7 µg/m3. Englund et al. (1996) measured emissions from wooden floors treated with oils and waxes. Furfural was detected in one of three products (a wax). The emission rate was 0.003 mg/m2/hour, 3 days after treatment. None was detected 14 days after treatment. The Danish Environmental Protection Agency (2005) carried out analyses of 15 surface-coated wooden toys intended for children up to 3 years of age. The study focused on toys that were coated with paint, wood stain, or lacquers. Samples of 2 g were placed in artificial saliva for 2 hours and then analyzed. Over 100 substances were identified. Furfural was detected in 4 of 15 samples, at concentrations ranging from 0.5 to 4.6 µg/g. Based upon analyses of the surface coatings of toys, the Danish Environmental Protection Agency (2005) estimated that the highest intake of furfural from this source by children up to 3 years of age would be 1.5 µg/kg-bw per day. Health Effects Assessment A summary of the available health effects information for furfural is presented in Appendix 8. The International Agency for Research on Cancer (IARC 1995) has classified furfural as a Group 3 carcinogen, i.e., “not classifiable as to its carcinogenicity to humans,” based upon “inadequate evidence in humans and limited evidence in experimental animals for the carcinogenicity of furfural.” The European Union (EU 2008) has classified the chemical as a Category 3 carcinogenic substance (R40 – limited evidence of a carcinogenic effect). These classifications were based principally on observation of some increases in tumour incidences in experimental animals. In an oral carcinogenicity study, mice were administered furfural in corn oil by gavage at doses of 0, 50, 100, or 175 mg/kg-bw per day for 103 weeks (Irwin 1990). An increased incidence of hepatocellular adenomas in male and female mice, and an increased incidence of hepatocellular carcinomas in male mice were observed at the highest dose. Despite a high incidence of spontaneous liver tumours in the control groups, tumour incidences were considered to be treatment related. There was also a dose-dependent increase in the incidence of chronic inflammation of the liver in treated mice. No carcinogenic effects were observed in female rats when administered at doses of 0, 30 or 60 mg/kg-bw per day in corn oil by gavage for 103 weeks; a less common type of
25
Screening Assessment CAS RN 98-01-1
cholangiocarcinomas and bile duct dysplasia with fibrosis (considered by the author as an early stage in the development of cholangiocarcinoma), were observed in 2 out of 50 male rats at the highest dose tested (Irwin 1990). In a 1-year inhalation study, hamsters were exposed to furfural at levels ranging from 0 to 1550 mg/m3 for 12 months followed by 29 weeks without further exposure (Feron and Kruysse 1978). No evidence of carcinogenicity to the respiratory tract was observed in the treated animals. Feron and Kruysse (1978) also tested furfural for co-carcinogenic effects. Hamsters in a separate test group were intratracheally instilled with 0.35 or 0.70 mg benzo(a)pyrene (B(a)P) weekly for 12 months, or treated with subcutaneous injection of 0.125 μL diethyl-nitrosamine (DENA) every 3 weeks for 12 months while exposed to furfural at 970 or 1550 mg/m3. Furfural did not enhance carcinogenic effects due to B(a)P or DENA (Feron and Kruysse 1978). In another limited co-carcinogenicity inhalation study, hamsters were treated by intratracheal instillation of furfural (3 mg) with or without B(a)P (1 mg), or B(a)P alone, weekly for 36 weeks (Feron 1972). Treatment with furfural alone did not induce tumours, but treatment with furfural and B(a)P, in comparison with the treatment with B(a)P alone, caused earlier development of metaplastic changes of the tracheobronchial epithelium, a shorter latent period for tracheobronchial tumours, and a few more squamous cell carcinomas at bronchiolar and at lung sites. These results suggested a co-carcinogenic effect of furfural on the respiratory tract of hamsters (Feron 1972). Miyakawa et al. (1991) conducted a co-carcinogenicity dermal study. Mice were treated topically with furfural (4.8 mg), twice a week, for 5 weeks with or without subsequent treatment with the promoter 12-O-tetradecanoyl phorbol-13- acetate (TPA, 2.5 µg) twice a week for the following 47 weeks. In this two-stage mouse skin carcinogenesis study, increased skin tumour incidences were observed in the furfural plus TPA group in comparison with the TPA alone group. No skin tumours were observed in the furfural alone group. This result suggests that furfural might possess tumour initiating activity in the presence of a promoting agent. The EU has also examined health effects of furfural and has concluded that the evidence for carcinogenicity is limited. In examining the results of the NTP study (Irwin 1990), the EU report noted the limitations of gavage applications, which can generate high peak exposures, and the limitations of the use of corn oil as a vehicle, which has been associated with morphological changes in the liver of experimental animals after prolonged exposure (EU 2008). The genotoxicity of furfural has been tested in a range of in vitro and in vivo assays. A detailed overview of the available genotoxicity studies is presented in Appendix 8; these data are briefly summarized here. Furfural did not induce bacterial mutation in Salmonella typhimurium TA98, TA102, TA104, TA1535, or TA1537 with or without metabolic activation, and overall results for mutation in S. typhimurium TA100 were equivocal. In mammalian cells, furfural induced gene mutation at the thymidine kinase (tk) locus of L5178Y mouse lymphoma cells in the
26

Screening Assessment CAS RN 98-01-1
absence of metabolic activation. It induced chromosomal aberrations in Chinese hamster ovary (CHO) and V79 lung cells, and sister chromatid exchange in CHO cells and human lymphocytes in the absence of metabolic activation. In a cell-free system, it induced strand breaks in duplex calf thymus DNA. It was also reported that inhibition of DNA synthesis was observed in Hela S3 cells and a high frequency of activated oncogene was detected in B6C3F1 mouse liver treated with furfural. However, there was no indication of unscheduled DNA synthesis (UDS) in treated human liver and rat nasal epithelial tissues. Furfural was not genotoxic in vivo. In a transgenic mouse mutation assay, no treatment-related induction of mutation in hepatocytes was observed in male CD2F1 transgenic mice treated with furfural orally for 28 days. No induction of UDS was observed in the liver of B6C3F1 mice and F344 rats treated orally with single doses of furfural. The frequencies of chromosome aberrations and sister chromatid exchange were not increased in the bone-marrow cells of B6C3F1 male mice injected intraperitoneally with single doses of furfural. Injection, but not feeding, of furfural to adult Drosophila melanogaster induced sex-linked recessive lethal mutation but did not induce heritable reciprocal translocations. In another study in D. melanogaster fed or injected with furfural, complete or partial loss of X or Y chromosomes were observed in male germ cells after mating with repair-deficient females, but not with repair-proficient females. However, inhalation of furfural caused significant increases in small single spots and total spots in somatic cells of treated Drosophila in a dose-dependent manner, which was considered as an indication of the induction of mutation. On the basis of available evidence on mutagenicity, the IARC (1995) working group concluded that furfural induced weak or no mutagenicity in bacteria but damaged DNA in vitro. The EU concluded that although the mode of action by which tumours observed in repeated-dose studies has not been fully elucidated, it does not involve genotoxicity. Additionally, the EU noted a potential role for chronic cytotoxicity found in conjunction with the induction of tumours and considered that the observed liver tumours were induced via mechanisms involving liver toxicity, and that at levels at which no liver toxicity is induced, tumours would not occur. Liver effects were considered to be the critical effect for risk characterization by the EU (EU 2008). Exposure to furfural has also induced non-cancer effects in experimental animals. In rats exposed to furfural by gavage at doses of 0 to 60 mg/kg-bw per day for 103 weeks, centrilobular necrosis in the liver of male rats and increased incidences of congestion in the lungs of female rats were observed at 30 mg/kg-bw per day and higher dose group (Irwin 1990). The dose level of 30 mg/kg-bw per day is considered to be the lowest oral lowest-observed-adverse-effect level (LOAEL) for repeated-dose oral exposure. In a 14-day oral study, reduced plasma alanine aminotransferase activity with increased liver weight was observed in rats exposed furfural in diet at 180 mg/kg-bw (the highest dose tested) (Jonker 2000a, cited in EU 2008). In a range-finding study, rats and mice were administered furfural by gavage for 13 weeks. In rats, treated with furfural from 0 to 180
27
Screening Assessment CAS RN 98-01-1
mg/kg-bw per day, an increased incidence of mild cytoplastic vacuolization of hepatocytes was observed in males at 11 mg/kg-bw per day and higher doses, but without a dose-dependent increase in severity. In mice treated with furfural at doses ranging from 0 to 1200 mg/kg-bw per day, centrilobular necrosis and multifocal subchronic inflammation of the liver were observed in males at 150 mg/kg-bw per day. These adverse liver effects were observed in both males and female at doses of 300 mg/kg-bw per day and higher (Irwin 1990). In another13-week study, male rats were administered furfural in diet from 0 to 160 mg/kg-bw per day, while females were treated at doses ranging from 0 to 170 mg/kg-bw per day. Minor liver changes (including cells with less coarse cytoplasm and increased clumping of eosinophils) and slight blood effects were observed in males at 82 mg/kg-bw per day and higher doses (Jonker 2000b, 2000c, cited in EU 2008). However, in two separate 28-day oral studies, no treatment-related effects were observed in F344 rats at doses ranging from 0 to 192 mg/kg-bw per day (Appel 2001), and no treatment-related effects were observed in Sprague-Dawley rats at doses ranging from 0 to 100 mg/kg-bw per day (Chengelis 1997). Increased mortalities were also observed in rats and mice exposed to furfural by gavage for 16 days. In rats administered furfural at doses ranging from 0 to 240 mg/kg-bw/d, and in mice treated at doses ranging from 0 to 400 mg/kg-bw per day, increased mortality was observed at the highest doses (240 and 400 mg/kg-bw per day, respectively) in both rats and mice (Irwin 1990). Local respiratory effects and increased mortality were observed in experimental animals administered furfural by inhalation. In a short-term inhalation study, rats were exposed to furfural at concentrations ranging from 0 to 1280 mg/m3 for 4 weeks. Metaplasia and hyperplasia of transitional respiratory epithelium in the anterior part of the nose were observed at 20 and 40 mg/m3. Treatment-related mortality was observed at 640 mg/m3. A level of 20 mg/m3 is considered to be the lowest lowest-observed-adverse-effect concentration (LOAEC) for repeated-dose inhalation exposure (Muijser 2001; Arts et al. 2004, all cited in EU 2008). In a 13-week inhalation study, hamsters were exposed to furfural at concentrations ranging from 0 to 2165 mg/m3. Treatment-related effects on nasal tissue, including atrophy of olfactory epithelium, accumulation of sensory cells in lamina propria, and occurrence of cyst-like structures, were observed at 448 mg/m3 and higher dose (Feron et al. 1979, 1984). One repeated-dose dermal study was identified. Furfural was applied to the clipped skin of rats at doses of 0 to 1000 mg/kg-bw per day for 28 days. Adverse clinical signs that included hypothermia, hypoactivity, and hind limb immobility in male rats and increased mortality in both males and females were observed at 500 and 1000 mg/kg-bw per day. No dermal effects, however, were observed in exposed rats (cited in US EPA 2010). No adequate reproductive studies were identified. In a developmental toxicity study, Sprague-Dawley rats were administered to furfural by gavage at doses of 0 to 150 mg/kg-bw per day on gestation days (GDs) 6–15. Deaths of 3/25 (3 out of 25) and 16/25 females in the mid- and high-dose groups, respectively, during GDs 6–18, were reported. The LOAEL for maternal toxicity was 50 mg/kg-bw per day. At the highest dose (150 mg/kg-bw per day), a reduction in mean foetal body weight was observed; the significance of
28

Screening Assessment CAS RN 98-01-1
this effect could not be evaluated properly because of the low survival of the females at the highest dose tested, suggesting that foetal effect may be secondary to maternal toxicity. No teratogenic effects were observed (Nemec 1997). Nomier et al. (1992) conducted a study to examine toxicokinetics of furfural in rats when administered via oral route. The results indicated that furfural was rapidly absorbed through the gastrointestinal (GI) tract at doses of 0.1 to 200 mg/kg-bw and virtually totally excreted mainly in the urine within 24 hours. In another toxicokinetic study in humans via inhalation and dermal routes, metabolites of furfural in humans were determined to be similar to those found in rats, and the half-life of absorbed furfural in humans was found to be approximately 2–2.5 hours (Flek and Sedivec 1978). These data indicate that absorbed furfural will be excreted from the human body rapidly. Three epidemiological studies in occupational settings were identified. In a case-control study, 65 workers in a furfural producing plant were examined. Air concentrations of furfural varied from less than 10 mg/m3 to 10 mg/m3 (hydrolyzing section), 20–30 mg/m3 (near hydrolyzers), and 50–70 mg/m3 for short periods of time upon opening of hydrolyzers for cleaning purposes. Health complaints reported by workers were headache, dizziness, general weakness, irritation, and symptoms of dyspepsia. Twenty-six workers showed decreased blood chlorine contents. There was some depression of cholinesterase activity in the blood plasma and erythrocytes. It was not clear whether the symptoms commenced after contact with furfural or if they existed previously. No details were provided on the control group, study design details, or methodology used to monitor air concentrations of furfural (Vinogradova et al. 1968, cited in EU 2008). In the second study, a population-based mortality surveillance of employees in carbon products manufacturing plants, 2219 male employees were followed up for mortality from 1974 to 1983. Among the six locations studied, there was one location with an excess of deaths from respiratory cancer (5 observed, 1.4 expected). This excess was not accounted for by regional differences in death rates. The primary concerns at this location were exposure to formaldehyde, silica, furfural, furfuryl alcohol, and asbestos. No data were available on the air concentration of these substances. The subjects were smokers and had worked at least 25 years at the plant. The potential role of furfural in the finding of excess lung cancers is unknown as there was multiple chemical exposure and confounding factors (Teta et al. 1987). In a study with limited data on exposure, Gomez-Arroyo and Souza (1985) reported that no significant difference was found between the incidences of sister chromatid exchanges in unexposed controls and workers occupationally exposed to furfural. The confidence in the health effects database for furfural is considered to be moderate, as information was available to identify critical effects for risk characterization, although no reproductive toxicity studies were identified. In addition, there was a lack of dermal studies for chronic toxicity and a lack of inhalation and dermal studies for developmental toxicity. Furthermore, only limited epidemiological studies were available. Characterization of Risk to Human Health
29

Screening Assessment CAS RN 98-01-1
IARC (1995) has classified furfural as a Group 3 carcinogen, i.e., “not classifiable as to its carcinogenicity to humans” based upon “inadequate evidence in humans and limited evidence in experimental animals for the carcinogenicity of furfural.” The European Union (EU 2008) has classified the chemical as a Category 3 carcinogenic substance based on limited evidence of carcinogenicity. On the basis of available information regarding genotoxicity, and conclusions from international agencies, furfural is considered unlikely to be genotoxic. Although some in vitro assays showed positive results, no genotoxic activity was observed in in vivo studies. In particular, furfural did not induce gene mutation in the liver of transgenic mice, and it did not induce UDS in the liver of mice and rats, where tumours were observed. The EU has concluded that although the mode of action has not been fully elucidated, the available data indicated that observed liver tumours in experimental animals were induced via a mechanism involving liver toxicity, rather than a genotoxic mode of action and at levels where no liver toxicity is induced, tumours would not occur (EU 2008). Therefore, a threshold approach is used to characterize risk to human health. With respect to non-cancer effects, the lowest LOAEL for oral exposure to furfural was 30 mg/kg-bw/d based on centrilobular necrosis observed in the liver of rats in a 2-year study; whereas the lowest LOAEC for inhalation exposure was 20 mg/m3 based on metaplasia and hyperplasia observed in transitional respiratory epithelium in the anterior part of the nose in rats in a 4-week study. The predominant source of exposure to furfural for the general population is expected to be through the diet. Based on the available data, it is expected that furfural from naturally occurring sources represents up to 99.9% of the total intake for all age groups in Canada. Intakes of 37.76 µg/kg-bw in infants to 81.17–1305 µg/kg-bw in adults are expected from food and beverages. Since the predominant source of dietary exposure to furfural is from its naturally occurring presence in food, the derivation of margins of exposure from the diet was not considered to be meaningful. Environmental Media Other sources of exposure to furfural for the general population are expected to be from environmental media (ambient air, indoor air and drinking water). Exposure from environmental media via the oral route (i.e., drinking water) is expected to be minimal compared with background levels in food. Comparison of the lowest LOAEC (20 mg/m3) to the highest concentration of furfural measured in indoor air (i.e., 5.895 µg/m3) results in a margin of exposure of approximately 3400 for inhalation exposure. This margin is considered to be adequate to address uncertainties in the health effects and exposure databases. Consumer Products
30

Screening Assessment CAS RN 98-01-1
Although furfural was not identified in consumer products in Canada, it has been identified in consumer products in Europe. The EU (2008) estimated the total intake from personal care products to be approximately 1 µg/kg-bw per day. The Danish Environmental Protection Agency (2005) also estimated the highest intake of furfural from toys by children up to 3 years of age to be 1.5 µg/kg-bw per day. Comparison of the lowest LOAEL (30 mg/kg-bw per day) to the exposure levels of furfural from consumer products result in margins of exposure of approximately 30 000 for the personal care products and 20 000 for toys. These margins are considered to be adequate to address uncertainties in the health effects and exposure databases. Uncertainties in Evaluation of Risk to Human Health The screening assessment does not include a full analysis of the mode of induction of effects, including potential carcinogenicity associated with exposure to furfural. The available human data were limited because of the lack of details on study protocols and exposure conditions, and because of confounding factors. There is moderate confidence in the database upon which the estimates of intake are based. Although a limited number of studies were identified on concentrations of furfural in indoor air, the range of concentrations reported was consistent across the studies. There are sufficient data to conclude that the values selected represent most food groups and would result in reasonable upper-bounding estimates of intake. However, food is the major source of intake for all age groups in the general population and few data on foods in Canada were identified. In particular, reports of furfural in powdered infant formula were limited to data from Spain. There is also uncertainty with respect to the high estimated intakes from beverages as few data were identified for non-alcoholic beverages. Overall, given that there is considerable variation in the level of furfural occurring naturally in most food groups, there is high uncertainty in the estimates of dietary intake, and even within a specific food item, there is considerable variation (for example, coffee or wine). As well, there is uncertainty related to thermal processing of food and the extent to which it may contribute to dietary exposure. In view of these factors, significant variation in the intake from food was observed across all age groups.
31
Screening Assessment CAS RN 98-01-1
Conclusion Based on the information available, it is concluded that furfural is not entering the environment in a quantity or concentration or under conditions that have or may have an immediate or long-term harmful effect on the environment or its biological diversity or that constitute or may constitute a danger to the environment on which life depends. Additionally, furfural does not meet the criteria for persistence and bioaccumulation potential as set out in the Persistence and Bioaccumulation Regulations (Canada 2000). On the basis of the adequacy of the margins between upper-bounding estimates of exposure to furfural and critical effect levels, it is concluded that furfural is not entering the environment in a quantity or concentration or under conditions that constitute or may constitute a danger in Canada to human life or health. It is therefore concluded that furfural does not meet any of the criteria under section 64 of CEPA 1999. This substance will be considered for inclusion in the Domestic Substances List inventory update initiative. In addition and where relevant, research and monitoring will support verification of assumptions used during the screening assessment.
32

Screening Assessment CAS RN 98-01-1
References
[ACGIH] American Conference of Governmental Industrial Hygienists. 1986. Documentation of threshold limit values and biological exposure indices. Cincinnati (OH): American Conference of Governmental Hygienists.
Adams T, Doull J, Goodman J, Munro I, Newberne P, Portoghese P, Smith R, Wagner B, Weil C, Woods L, Ford R. 1997. The FEMA GRAS assessment of furfural used as a flavour ingredient. Food Chem Toxicol 35(18):739–751.
Aeschbacher HU, Wolleb, U, Loliger, J, Spadone, JC, Liardon, R. 1989 Contribution of coffee aroma constituents to the mutagenicity of coffee.. Food Chem Toxicol 27(4):227–232 [cited in NLM 2009].
Alevantis L. 2003. Building material emissions study. Sacramento (CA): State of California Integrated Waste Management Board. [accessed 2010 March 29]. Available at: http://www.calrecycle.ca.gov/Publications/GreenBuilding/43303015.pdf
Almeida J, Bertilsson M, Gorwa-Grauslund M, Gorsich S, Liden G. 2009. Metabolic effects of furaldehydes and impacts on biotechnological processes. Appl Microbiol Biotechnol 82(4):625–638.
[AOPWIN] Atmospheric Oxidation Program for Windows [Estimation Model]. 2008. Version 1.92. Washington (DC): US Environmental Protection Agency, Office of Pollution Prevention and Toxics; Syracuse (NY): Syracuse Research Corporation. www.epa.gov/oppt/exposure/pubs/episuite.htm
Appel MJ. 2001. Sub-acute (28-day) oral toxicity study with furfural in rats. Zeist (NL): TNO Nutrition and Food Research. TNO report V3155. [cited in EU 2008].
Arnot JA, Gobas FAPC. 2003. A generic QSAR for assessing the bioaccumulation potential of organic chemicals in aquatic food webs. QSAR Comb Sci 22(3):337–345.
Aronson D, Howard PH. 1999. Evaluating potential POP/PBT compounds for environmental persistence. North Syracuse (NY): Syracuse Research Corp., Environmental Science Centre. Report No.: SRC-TR-99-020.
Arts JHE, Muijser H, Appel JA, Bessems JGM, Woutersen RA. 2004. Sub-acute (28-day) toxicity of furfural in Fischer 344 rats: a comparison of the oral and inhalation route. Food Chem Toxicol 42(9):1389–1399 [cited in EU 2008].
Atkins EL, Kellum D, Atkins KW. 1981. Reducing pesticide hazards to honey bees: mortality prediction techniques and integrated management strategies. Riverside (CA): University of California, Division of Agricultural Sciences. Univ Calif Div Agric Sci Leafl 2883.
Baker RR, Bishop LJ. 2005. The pyrolysis of non-volatile tobacco ingredients using a system that simulates cigarette combustion conditions. J Anal Appl Pyrolysis 74:145–170.
[BBM with Mitigating Factors] Baseline Bioaccumulation Model with Mitigating Factors. 2008. Gatineau (QC): Environment Canada, Ecological Assessment Division. [Model developed based on Dimitrov et al. 2005]. [cited 2010 Feb]. Available upon request.
[BCFBAF] Bioaccumulation Program for Windows [Estimation Model]. 2008. Version 3.00. Washington (DC): US Environmental Protection Agency, Office of Pollution Prevention and Toxics; Syracuse (NY): Syracuse Research Corporation. Available from: www.epa.gov/oppt/exposure/pubs/episuite.htm
33

Screening Assessment CAS RN 98-01-1
Benjamin MM, Woods SL, Ferguson JF. 1984. Anaerobic toxicity and biodegradability of pulp mill waste constituents. Water Res 18(5):601–607.
Bierbach A, Barnes I, Becker KH. 1995. Product and kinetic study of the OH-initiated gas-phase oxidation of furan, 2-methylfuran and furanaldehydes at ≈ 300 K. Atmos Environ 29(19):2651–2660.
Binder R, Flath R. 1989. Volatile Components of Pineapple Guava. J Agric Food Chem 37:734–736 [cited in NLM 2009].
[BIOWIN] Biodegradation Probability Program for Windows [Estimation Model]. 2008. Version 4.10. Washington (DC): US Environmental Protection Agency, Office of Pollution Prevention and Toxics; Syracuse (NY): Syracuse Research Corporation. www.epa.gov/oppt/exposure/pubs/episuite.htm
Boethling RS, Howard PH, Beauman JA, Larosche ME. 1995. Factors for intermedia extrapolations in biodegradability assessment. Chemosphere 30(4):741−752.
Bringmann G, Kühn R. 1978. Limiting values for the noxious effects of water pollutant material to blue algae (Microcystis aeruginosa) and green algae (Scenedesmus quadricauda) in cell propagation inhibition tests [in German]. Vom Wasser 50:45–60 [cited in EU 2008]. Bringmann G, Kühn R. 1982. Results of toxic action of water pollutants on Daphnia magna Straus tested by an improved standardized procedure [in German]. Z Wasser Abwasser Forsch 15(1):1–6 [cited in EU 2008].
Burdock G. 2010. Fenaroli’s handbook of flavor ingredients. 6th ed. Boca Raton (FL): CRC Press. Furfural. p. 705–706.
Buttery RG, Ling, LC and Stern, DJ. 1994. Studies on flavour volatiles of some sweet corn products. J Agric Food Chem 42:791–794.
Buttery RG, Stern, DJ, and Ling, LC.. 1997. Studies on popcorn aroma and flavour volatiles. J Agric Food Chem 45(3):837–843.
Buttery RG, Orts, WJ, Takeoka, GR, and Nam, Y.. 1999. Volatile flavour components of rice cakes. J Agric Food Chem 47(10):4353–4356.
Buttery RG, Seifert RM, Guadagni DG, Ling LC. 1969. Characterization of some volatile constituents of bell peppers. J Agric Food Chem 17(6):1322–1327.
Buttery RG, Seifert RM, Guadagni DG, Ling LC. 1971. Characterization of additional volatile components of tomato. J Agric Food Chem 19(3):524–529.
Call DJ, Geiger DL. 1992. Subchronic toxicities of industrial and agricultural chemicals to fathead minnows (Pimephales promelas). Vol. I. Superior (WI): Center for Lake Superior Environmental Studies, University of Wisconsin–Superior.
Canada, Dept. of the Environment, Dept. of Health. 2006. Canadian Environmental Protection Act, 1999: Notice of intent to develop and implement measures to assess and manage the risks posed by certain substances to the health of Canadians and their environment. Canada Gazette, Part I, vol. 140, no. 49, p. 4109–4117. Available from: http://www.gazette.gc.ca/archives/p1/2006/2006-12-09/pdf/g1-14049.pdf
Canada, Dept. of the Environment, Dept. of Health. 2009a. Canadian Environmental Protection Act, 1999: Notice of eleventh release of technical information relevant to substances identified in the Challenge. Canada Gazette, Part I, vol. 143, no. 39, p. 2858–2863. Available from: http://gazette.gc.ca/rp-pr/p1/2009/2009-09-26/pdf/g1-14339.pdf# page=8
34

Screening Assessment CAS RN 98-01-1
Canada, Dept. of the Environment. 2009b. Canadian Environmental Protection Act, 1999: Notice with respect to Batch 11 Challenge substances. Canada Gazette, Part I, vol. 143, no.39, p. 2865–2888. Available from: http://gazette.gc.ca/rp-pr/p1/2009/2009-09-26/pdf/g1-14339.pdf# page=8
Canada. [1978]. Food and Drug Regulations. C.R.C. c. 870. Available from: http://laws.justice.gc.ca/eng/C.R.C.-c.870/index.html
Canada. 1999. Canadian Environmental Protection Act, 1999. S.C., 1999, c. 33, Canada Gazette. Part III, vol. 22, no. 3. Available from: http://www.gazette.gc.ca/archives/p3/1999/g3-02203.pdf
Canada. 2000. Canadian Environmental Protection Act, 1999: Persistence and Bioaccumulation Regulations, P.C. 2000-348, 23 March, 2000, SOR/2000-107, Canada Gazette, Part II, vol. 134, no. 7, p. 607−612. Available from: http://www.gazette.gc.ca/archives/p2/2000/2000-03-29/pdf/g2-13407.pdf
Canada. 2009. Statutes of Canada 2009, Chapter 27, An Act to amend the Tobacco Act (Bill C-32). http://www2.parl.gc.ca/content/hoc/Bills/402/Government/C-32/C-32_4/C-32_4.PDF
[CATABOL] Probabilistic assessment of biodegradability and metabolic pathways [Computer Model]. c2004−2008. Version 5.10.2. Bourgas (BG): Bourgas Prof. Assen Zlatarov University, Laboratory of Mathematical Chemistry. Available from: http://oasis-lmc.org/?section= software&swid=1
Cha Y, Cadwaller K. 1995. Volatile components in salt-fermented fish and shrimp pastes. J Food Sci 60(1):19–24.
Chang S, Peterson R. 1977. Symposium: The basis of quality in muscle foods. Recent developments in the flavour of meat. J Food Sci 42(92):298–305.
Chang S, Vallese F, Hwang L, Hseih O, Min D. 1977. Apparatus for the isolation of trace volatile constituents from foods. J Agric Food Chem 25(3):450–455.
Chavez-Servin J, Castellote A, Lopez-Sabater M. 2005. Analysis of potential and free furfural compounds in milk-based formulae by high-performance liquid chromatography. Evolution during storage. J Chromatogr A 1076:133–140.
Chavez-Servin J, Castellote A, Lopez-Sabater M. 2006. Evolution of potential and free furfural compounds in milk-based infant formula during storage. Food Res Int 39:536–543.
Chavez-Servin J, Castellote A, Martin M, Chifre R, Lopez-Sabater M. 2009. Stability during storage of LC-PUFA-supplemented infant formula containing single cell oil of egg yolk. Food Chem 113:484–492.
Chengelis CP. 1997. A 28-day repeated dose oral toxicity study of furfural in rats. Ashland (OH): WIL Research Laboratories, Inc., Project number WIL-12367 [cited in EU 2008].
Chung H. 1999a. Volatile Components in Crabmeats of Charybdis feriatus. J Agric Food Chem 47:2280–2287. [cited in NLM 2009].
Chung H. 1999b. Volatile Components in Fermented Soybean (Glycine max) Curds. J Agric Food Chem 47:2690–2696. [cited in NLM 2009].
CIVO-TNO. 1994. Volatile components in food – qualitative and quantitative data. Maarse H, Visscher C, editors. Vol. III. 6th ed. Zeist (NL): TNO. [cited in Adams et al. 1997].
Clayton GD, Clayton FE. 1981. Patty’s industrial hygiene and toxicology. 3rd ed (revised). Hoboken (NJ): J. Wiley and Sons, Inc.
35

Screening Assessment CAS RN 98-01-1
Coleman EC, Ho, CT and Chang, SS. 1981. Isolation and identification of volatile compounds from baked potatoes. J Agric Food Chem 29:42–48.
Crain W, Tang C. 1975. Volatile components of roasted macadamia nuts. J Food Sci 41(1):207–208.
Danish Environmental Protection Agency. 2004. Survey and emission of chemical substances from incense. Taastrup (DK): Danish Technological Institute. Survey of Chemical Substances in Consumer Products No. 39.
Danish Environmental Protection Agency. 2005. Migration and health assesement of chemical substances in surface treated wooden toys. Taastrup (DK): Danish Technological Institute. Survey of Chemical Substances in Consumer Products No. 60.
Daubert TE, Danner RP. 1989. Physical and thermodynamic properties of pure chemicals. Data compilation. Washington (DC): Taylor and Francis [cited in HSDB 1983 – ].
Day E, Anderson D. 1965. J Agric Food Chem 13:2–4. [cited in NLM 2009].
Deck R, Pokorny J, Chang S. 1973. Isolation and identification of volatile compounds from potato chips. J Food Sci 38(2):345–349.
Deneer JW, Seinen W, Hermens JLM. 1988. The acute toxicity of aldehydes to the guppy. Aquat Toxicol 12:185–192.
Diaz C, Conde J, Claverie C, Diaz, Trujillo J. 2003. Conventional enological parameters of bottled wines from the Canary Islands (Spain). J Food Comp Anal 16:49–56.
Dillon DM, McGregor DB, Combes RD, Zeiger E. 1992. Detection of mutagenicity in Salmonella of some aldehydes and peroxides. Environ Mol Mutagen 19(Suppl 20):15 [cited in EU 2008].
Dimitrov S, Dimitrova N, Parkerton T, Comber M, Bonnell M, Mekenyan O. 2005. Base-line model for identifying the bioaccumulation potential of chemicals. SAR QSAR Environ Res 16(6):531–554.
DPD (Drug Product Database). 2010. Available at: http://webprod.hc-sc.gc.ca/dpd-bdpp/index-eng.jsp
Elss S, Preston C, Appel M, Heckel F, Schreier P. 2006. Influence of technological processing on apple aroma analysed by high resolution gas chromatography–mass spectrometry and on-line gas chromatography–combustion/pyrolysis-isotope ratio mass spectrometry. Food Chem 98(2):269–276.
Engel KH, Flath, RA, Buttery, RG, Mon, TR, Ramming, DW and Teranishi, R. 1988. Investigation of volatile constituents in nectarines. 1. Analytical and sensory characterization of aroma components in some nectarine cultivars. J Agric Food Chem 36(3):549–553.
Englund F, Larsen A, Funch L, Saarela K, Tirkkonen T. 1996. Emissions of VOC from wooden floors, surface treated with oils and waxes. In: Indoor Air ’96: Proceedings of the 7th International Conference on Indoor Air Quality and Climate, Nagoya, Japan. Vol. 3. p. 89–94.
Environment Canada. 2007. Guidance for conducting ecological assessments under CEPA, 1999. Science Resource Technical Series, Technical Guidance Module: QSARs. Reviewed Draft Working Document. Gatineau (QC): Environment Canada, Ecological Assessment Division. Available upon request.
Environment Canada. 2008. Data for Batch 11 substances collected under the Canadian Environmental Protection Act, 1999, Section 71: Notice with respect to Batch 11 Challenge substances. Data prepared by: Environment Canada, Existing Substances Program.
36
Screening Assessment CAS RN 98-01-1
Environment Canada. 2009. Guidance for conducting ecological assessments under CEPA, 1999. Science Resource Technical Series, Technical Guidance Module: The Industrial Generic Exposure Tool – Aquatic (IGETA). Working document. Gatineau (QC): Environment Canada, Ecological Assessment Division. Available upon request.
Environment Canada. 2010. IGETA report: CAS RN 98-01-1, 2010-04-22. Unpublished report. Gatineau (QC): Environment Canada, Ecological Assessment Division. Available upon request.
[EPIsuite] Estimation Programs Interface Suite for Microsoft Windows [Estimation Model]. 2008. Version 4.0. Washington (DC): US Environmental Protection Agency, Office of Pollution Prevention and Toxics; Syracuse (NY): Syracuse Research Corporation. Available from: http://www.epa.gov/oppt/exposure/pubs/ episuitedl.htm
[EQC] Equilibrium Criterion Model. 2003. Version 2.02. Peterborough (ON): Trent University, Canadian Environmental Modelling Centre. Available from: http://www.trentu.ca/academic/aminss/envmodel/models/EQC2.html
Erikson MD, Harris, BSH, Pellizzari, ED, Tomer, KB, Waddell, RD, Whitaker, DA. 1980. Acquisition and chemical analysis of mother’s milk for selected toxic substances. Washington (DC): US Environmental Protection Agency Office of Pesticides and Toxic Substances. EPA-560/13-80-029. p. 152. [cited in NLM 2009].
EU (European Union). 2008. Risk assessment on Furfural, CAS-No.: 98-01-1, EINECS-No.: 202-627-7. Final report of February 2008. R050_0802_env_hh. Available at : http://ecb.jrc.ec.europa.eu/DOCUMENTS/Existing-Chemicals/RISK_ASSESSMENT/REPORT/2furaldehydereport050.pdf
EU (European Union). 2004. Risk Assessment on Furfural, CAS-No.: 98-01-1, EINECS-No.: 202-627-7. Draft of October 2004. R050_0410_hh. Available via http://ecb.jrc.it/existing-chemicals
Ewing BB, Chian ESK, Cook JC, Evans CA, Hopke PK. 1977. Monitoring to detect previously unrecognized pollutants in surface waters. Appendix: Organic analysis data. Washington (DC): United States Environmental Protection Agency, Office of Toxic Substances. USEPA-560/6-77-015A. [cited in HSDB 1983 – , cited in NLM 2009].
Feron VJ. 1972. Respiratory tract tumours in hamsters after intratracheal instillations of benzo(a)pyrene alone and with furfural. Cancer Res 32:28–36 [cited in EU 2008].
Feron VJ, Kruysse A. 1978. Effects of exposure to furfural vapour in hamsters simultaneously treated with benzo(a)pyrene or diethylnitrosamine. Toxicology 11:127–144 [cited in EU 2008].
Feron VJ, Kruysse A, Dreef-van der Meulen H. 1979. Repeated exposure to furfural vapour: 13-week study in syrian golden hamsters. Zbl Bakt Hyg I Abt Orig B 168:442–451 [cited in EU 2008].
Feron VJ, Woutersen RA, Appelman LM. 1984. Epithelial damage and tumours of the nose after exposure to four different aldehydes by inhalation. In: P. Grosdanoff et al., editors. Problems of inhalatory toxicity studies. Munchen (DE): MMV Medizin Verlag. p. 587–610 [cited in EU 2008].
Ferrer E, Alegria A, Farre R, Abellan P, Romero F. 2002. High-performance liquid chromatographic determination of furfural compounds in infant formulas. Changes during heat treatment and storage. J Chromatogr A 947:85–95.
Ferrer E, Alegria A, Farre R, Abellan P, Romero F. 2005. High-performance liquid chromatographic determination of furfural compounds during full shelf-life. Food Chem 89:639–645.
37

Screening Assessment CAS RN 98-01-1
Flek J, Sedivec V 1978. The absorption, metabolism and excretion of furfural in man. Int Arch Occup Environ Health 41:159–168.
Frattini C, Bicchi C, Barettini C, Nano G. 1977. Volatile flavor components of licorice. J Agric Food Chem 25(6):1238–1241.
Furia T, Bellanca N, editors. 1975. Fenaroli’s handbook of flavor ingredients. Vol. 2. 2nd ed. Cleveland (OH): The Chemical Rubber Co. [cited in NLM 2009].
Galloway SM, Bloom AD, Resnick M, Margolin BH, Nakamura F, Archer P, Zeiger E. 1985. Development of standard protocol for in vitro cytogenetic testing with Chinese hamster ovary cells: comparison of results for 22 compounds in two laboratories. Environ Mutagen 7:1–51 [cited in EU 2008].
Garde-Cerdan T, Lorenzo C, Carot J, Jabaloyes J, Esteve M, Salinas M. 2008. Statistical differentiation of wines of different geographic origin and aged in barrel according to some volatile components and ethylphenols. Food Chem 111(4):1025–1031.
Gaspar E, Lopes F. 2009. Simple gas chromatographic method for furfural analysis. J Chromatogr A 1216(14):2762–2767.
Giordano L, Calabrese R, Davoli E, Rotilio D. 2003. Quantitative analysis of 2-furfural and 5-methylfurfural in different Italian vinegars by headspace solid-phase microextraction coupled to gas chromatography-mass spectrometry using isotope dilution. J Chromatogr A 1017(1–2):141–149.
Godelmann R, Limmert S, Kuballa T. 2008. Implementation of headspace solid-phase-microextraction-GC-MS/MS methodology for determination of 3-alkyl-2-methoxypyrazines in wine. Eur Food Res Technol 227:449–461.
Gomez-Arroyo S, Souza V. 1985. In vitro and occupational induction of sister-chromatid exchanges in human lymphocytes with furfuryl alcohol and furfural. Mutat Res 156:233–238 [cited in EU 2008].
Gudi R, Schadly EH. 1996. In vitro mammalian cytogenetic test with an independent repeat assay. Bethesda (MD): Microbiological Associates, Inc. Laboratory Study Number G96AS33.335 [cited in EU 2008].
Hadi SM, Shahabuddin, Rehman A. 1989. Specificity of the interaction of furfural with DNA. Mutat Res 225:101–106 [cited in EU 2008].
Hampton C, Pierson W, Harvey T, Updegrove W, Marano R. 1982. Hydrocarbon gases emitted from vehicles on the road. I. A qualitative gas-chromatography mass-spectrometry survey. Environ Sci Technol 16:287–298 [cited in IPCS 2000].
Hansch C, Leo A, Hoekman D. 1995. Exploring QSAR. Hydrophobic, electronic, and steric constants. Washington (DC): American Chemical Society.
Health Canada. 1998. Exposure factors for assessing total daily intake of priority substances by the general population of Canada. Unpublished report. Ottawa (ON): Health Canada, Environmental Health Directorate.
Health Canada. 2009. Guide for completing cosmetic notification forms. Version 2.0. Ottawa (ON): Health Canada, Consumer Product Safety Directorate. Available from: http://www.hc-sc.gc.ca/cps-spc/alt_formats/hecs-sesc/pdf/person/cosmet/info-ind-prof/_notification/guide-eng.pdf
38

Screening Assessment CAS RN 98-01-1
HeerD, Heine D, Sauer U. 2009. Resistance of Saccaromyces cerevisiae to high concentrations of furfural is based on NADPH-dependent reduction by at least two oxireductases. Appl Environ Microbiol 75(24):7631–7638.
Heil J, Reifferscheid G. 1992. Detection of mammalian carcinogens with an immunological DNA synthesis-inhibition test. Carcinogenesis 13:2389–2394 [cited in EU 2008].
[HENRYWIN] Henry’s Law Constant Program for Microsoft Windows [Estimation Model]. 2008. Version 3.20. Washington (DC): US Environmental Protection Agency, Office of Pollution Prevention and Toxics; Syracuse (NY): Syracuse Research Corporation. Available from: www.epa.gov/oppt/exposure/pubs/episuite.htm
Hessov I. 1975. Toxicity of 5-hydroxymethylfurfural and furfural to Daphnia magna. Acta Pharmacol Toxicol 37:94–96.
Ho CT, Lee, KN, Jin, QZ,. 1983. Isolation and Identification of Volatile flavour compounds in fried bacon. J Agric Food Chem 31:336–342 [cited in NLM 2009].
Hodgson A, Rudd A, Beal D, Chandra S. 2000. Volatile organic compound concentrations and emission rates in new manufactured and site-built homes. Indoor Air 10(3):178–192.
Howard PH. 1993. Handbook of environmental fate and exposure data for organic chemicals. Volume IV. Solvents 2. Chelsea (MI): Lewis Publishers.
[HSDB] Hazardous Substances Data Bank [database on the Internet]. 1983 – . Bethesda (MD): US National Library of Medicine. [revised 2006 Aug 30; cited 2009 Oct 27]. Available from: http://toxnet.nlm.nih.gov/cgi-bin/sis/html
Hunter G, Bucek W, Radford T. 1974. Volatile components of canned alphonso mango. J Food Sci 39(5):900–903.
[HYDROWIN] Hydrolysis Rates Program for Microsoft Windows [Estimation Model]. 2008. Version 2.00. Washington (DC): US Environmental Protection Agency, Office of Pollution Prevention and Toxics; Syracuse (NY): Syracuse Research Corporation. Available from: http://www.epa.gov/oppt/exposure/pubs/ episuite.htm
IARC (International Agency for Research on Cancer). 1995. Dry cleaning, some chlorinated solvents and other industrial chemicals. IARC Monographs on the evaluation of carcinogenic risks to humans Volume 63. Lyon (FR): IARC.
IPCS (International Programme on Chemical Safety). 2000. Concise international chemical assessment document (CICAD) No. 21 on 2-furaldehyde. Available at: http://www.inchem.org/pages/cicads.html
Irwin R. 1990. NTP technical report on the toxicology and carcinogenesis studies of furfural in F344/N rats and B6C3F1 mice (gavage studies). Research Triangle Park (NC). US National Toxicology Program. NIH publication No. 90-2837. [cited in EU 20084].
[ISHOW] Information System for Hazardous Organics in Water. 1992. Computerized database developed by U.S. EPA and University of Minnesota. Duluth (MN): U.S. Environmental Protection Agency and University of Minnesota.
Japan Environment Agency. 1998. Chemicals in the environment. 1997 ed. Tokyo (JP): Japan Environment Agency, Environmental Health and Safety Division. [cited in IPCS 2000].
39

Screening Assessment CAS RN 98-01-1
Jay K, Steiglitz L. 1995. Identification and Quantification of Volatile Organic components in emissions of waste incineration plants. Chemosphere 30:1249–1260. [cited in NLM 2009].
JECFA (Joint FAO/WHO Expert Committee on Food Additives). 1993. WHO Food Additives Series 30. No. 761: Furfural. Available at: http://www.inchem.org/documents/jecfa/jecmono/v30je16.htm
JECFA (Joint FAO/WHO Expert Committee on Food Additives). 2000. Summary of evaluations performed by the Joint FAO/WHO Expert Committee on Food Additives. Furfural. Latest evaluation, 2000. Available at: http://www.inchem.org/documents/jecfa/jeceval/jec_873.htm
JECFA (Joint FAO/WHO Expert Committee on Food Additives). 2001. WHO Food Additives Series 46, No, 995: Furfural (addendum). Available at: http://www.inchem.org/documents/jecfa/jecmono/v46je02.htm
Johnson B, Waller G, Foltz R. 1971. Volatile components of roasted peanuts: neutral fraction. J Agric Food Chem 19(5):1025–1027.
Jonker D. 2000a. Dose-range finding study (14-day) with micro-encapsulated fufural in F344 rats. Unpublished report Zeist (NL): TNO. TNO report V98.1173. [cited in EU 2008].
Jonker D. 2000b. Amendment 1 to the TNO-report V99.520: sub-chronic (13 week) oral toxicity study in rats with micro-encapsulated furfural. Unpublished report. Zeist (NL): TNO. TNO report V99.520. [cited in EU 2008; JECFA 2001].
Jonker D. 2000c. Sub-chronic (13 week) oral toxicity study in rats with micro-encapsulated furfural. Unpublished report. Zeist (NL): TNO. TNO report V99.520. [cited in EU 2008].
Jop K. 1987. Mysid static acute bioassay with 2-furaldehyde. Toxicity test report. Duxbury (MA): Battelle Ocean Sciences. 1987 May 8. 2 p. Attached: Battelle New England Marine Research Laboratory. 1987. Protocol for static acute toxicity tests with the mysid Mysidopsis bahia. Submitted to US Environmental Protection Agency. 1987 March. 11 p.
Joseph SA. 2003. Acute dermal toxicity study of furfural in rats. Valvada, Gujrat (IN): Jai Research Foundation, Department of Toxicology. Study No. 3950, dated 2003 May 23. MRID 46011010.
Juttner F. 1986.Analysis of Organic Compounds (VOC) in the forest air of the Southern Black Forest. Chemosphere 15:985–992. [cited in NLM 2009].
Keith LH. 1974. Chemical characterization of industrial wastewaters by gas chromatography–mass spectrometry. Sci Total Environ 3:87–102.
Kermasha S, Goetghebeur M, Dumont J, CoutureR. 1995. Analyses of phenolic and furfural compounds in concentrated and non-concentrated apple juices. Food Res Int 28(3):245–252.
Kinlin T, Muralidhara, R, Pittet, A, Sanderson, A, Walradt, J.. 1972. Volatile components of roasted filberts. J Agric Food Chem 20(5):1021–1028.
Kleindienst T, Shepson P, Edney E, Claxton L, Cupitt L. 1986. Wood smoke – measurement of the mutagenic activity of its gas-phase and particulate-phase photooxidation products. Environ Sci Technol 20:493–501. [cited in IPCS 2000].
[KOCWIN] Organic Carbon Partition Coefficient Program for Windows [Estimation Model]. 2008. Version 2.00. Washington (DC): US Environmental Protection Agency, Office of Pollution Prevention and Toxics; Syracuse (NY): Syracuse Research Corporation. Available from: www.epa.gov/oppt/exposure/pubs/episuite.htm
40

Screening Assessment CAS RN 98-01-1
Konasewich D, Traversy W, Zar H. 1978. Status report on organic and heavy metal contaminants in the Lakes Erie, Michigan, Huron and Superior basins. Windsor (ON): Great Lakes Water Quality Board [cited in HSDB 1983; NLM 2009].
Kool HJ, van Kreijl, CF and Zoeteman, BCJ. 1982. Toxicology assessment of organic compounds in drinking water. CRC Crit Rev Env Control 12(4):307–357.
Kostiainen R. 1995. Volatile organic compounds in the indoor air of normal and sick houses. Atmos Environ 29(6):693–702.
Kottke R. 2000. Kirk-Othmer encyclopedia of chemical technology. 2005 ed. Furan derivatives. New York (NY): John Wiley and Sons. [online posting date 2000 Dec 4]. [cited in NLM [2009].
[KOWWIN] Octanol-Water Partition Coefficient Program for Microsoft Windows [Estimation Model]. 2008. Version 1.67. Washington (DC): US Environmental Protection Agency, Office of Pollution Prevention and Toxics; Syracuse (NY): Syracuse Research Corporation. Available from: www.epa.gov/oppt/exposure/pubs/episuite.htm
Krause D, Salazar R, Eldrege C. 2009. Results of indoor air testing in two homes experiencing copper corrosion associated with corrosive imported drywall. Performed for the Florida Department of Health. [accessed 2010 Mar 9]. Available at: http://www.cpsc.gov/info/drywall/TabC.pdf
Lake BG, Edwards AJ, Price RJ, Phillips BJ, Renwick AB, Beamond JA, Adams TB. 2001. Lack of effect of furfural on DNA unscheduled DNA synthesis in the in vivo rat and mouse hepatocyte DNA repair assays and in precision-cut human liver slices. Food Chem Toxicol 39:999–1011 [cited in EU 2008].
Lewis RJ Sr, editor. 2000. Sax’s dangerous properties of industrial materials. 10th ed. New York (NY): John Wiley & Sons, Inc.
Lewis R, editor. 2003. Hawley’s condensed chemical dictionary. 14th ed. New York (NY): John Wiley and Sons. [cited in NLM 2009].
Lide DR. 2007–2008. CRC handbook of chemistry and physics. 88th edition. Boca Raton (FL): CRC Press.
Lin FM, Tan Y, Yuan YJ. 2009. Temporal quantitative proteomics of Saccaromyces cerevisiae in response to a nonlethal concentration of furfural. Proteomics 9(24):5471–5483.
Linko Y, Johnson J, Miller B. 1962. The origin and fate of certain carbonyl compounds in white bread. Cereal Chem 39(6):468–476.
Lipari F, Dasch J, Scruggs W. 1984. Aldehyde emissions from wood-burning fireplaces. Environ Sci Technol 18:326–330. [cited in IPCS 2000]. LNHPD (Licensed Natural Health Products Database). 2010. Health Canada. Available from: http://205.193.93.55/lnhpd-bdpsnh/start-debuter.do Loquet C, Toussaint C, LeTalaer JY. 1981. Studies on mutagenic constituents of apple brandy and various alcoholic beverages collected in western France, a high incidence area for oesophageal cancer. Mutat Res 88:155–164 [cited in EU 2008].
Lucas S. 1984. GC/MS analysis of organics in drinking water concentrates and advanced waste treatment concentrates. Vol. 3. Columbus (OH): US Environmental Protection Agency. USEPA-600/1-84-020. [cited in NLM 2009].
41

Screening Assessment CAS RN 98-01-1
Matejicek D, Mikes O, Klejdus B, Sterbova D, Kuban V. 2005. Changes in contents of phenolic compounds during maturing of barrique red wines. Food Chem 90(4):791–800.
Materna BL, Jones, JR, Sutton, PM, Rothman, N, Harrison, RJ.. 1992. Occupational exposures in California wildland fire fighting. Am Ind Hyg Assoc J 53(1): 69–76. [cited in NLM 2009].
McDonald JD, Zielinska B, Fujita EM, Sagebiel JC, Chow JC, Watson JG. 2000. Fine particle and gaseous emission rates from residential wood combustion. Environ Sci Technol 34:2080–2091.
McGregor DB, Brown A, Cattanach P, Edwards I, McBride D, Caspary WJ. 1988. Responses of the L5178Ytk+/tk- mouse lymphoma cell forward mutation assay II: 18 coded chemicals. Environ Mol Mutag 11:91–118 [cited in EU 2008].
McKenzie LM, Hao WM, Richards GN, Ward DE. 1995. Measurement and modeling of air toxins from smoldering combustion of biomass. Environ Sci Technol 29:2047–2054.
Miyakawa Y, Nishi Y, Kato K, Sato H, Takahashi M, Hayashi Y. 1991. Initiating activity of eight pyrolysates of carbohydrates in a two-stage mouse skin tumorigenesis model. Carcinogenesis 12(7):1169–1173 [cited in EU 2008].
[MPBPWIN] Melting Point Boiling Point Program for Microsoft Windows [Estimation Model]. 2008. Version 1.43. Washington (DC): US Environmental Protection Agency, Office of Pollution Prevention and Toxics; Syracuse (NY): Syracuse Research Corporation. Available from: www.epa.gov/oppt/exposure/pubs/episuite.htm
Muchalal M, Crouzet J. 1985. Agric Biol Chem 49:1583–1589. [cited in NLM 2009].
Muijser H. 2001. A sub-acute (28-day) inhalation toxicity study with furfural in rats. Zeist (NL): TNO. TNO report V2874. [cited in EU 2008].
Mussinan C, Walradt P. 1974. Volatile constituents of pressure cooked pork liver. J Agric Food Sci 22(5):827–831.`
[NCI] National Chemical Inventories [database on CD-ROM]. 2009. Issue 1. Columbus (OH): American Chemical Society. [cited 2009 Oct 28]. Available from: http://www.cas.org/products/cd/nci/index.html
Nemec A. 1997. Developmental toxicity study of furfural in rats; Ashland (OH): WIL Research Laboratories, Inc. Laboratory study number WIL-12378. [cited in EU 2008]. NHPID (Natural Health Products Ingredients Database) 2010. Health Canada. Available from: http://webprod.hc-sc.gc.ca/nhpid-bdipsn/search-rechercheReq.do
NHW (Dept. of National Health and Welfare). 1990. Present patterns and trends in infant feeding in Canada. Ottawa (ON): Department of National Health and Welfare. NHW Cat. No. H39-199/1990E. [cited in Health Canada 1998].
[NITE] National Institute of Technology and Evaluation [database on the Internet]. 2002. Comprehensive information for CAS RN 98-01-1. Tokyo (JP): NITE. [cited 2009 Nov 6]. Available from: http://www.safe.nite.go.jp/english/Haz_start.html
Nishi Y, Miyakawa Y, Kato K. 1989. Chromosome aberrations induced by pyrolysates of carbohydrates in Chinese hamster V79 cells. Mutat Res 227:117–123 [cited in EU 2008].
NLM (National Library of Medicine). 2009. Hazardous substances databank (HSDB). Furfural. HSDB No. 542. [accessed 2010 Mar 9]. Available at: http://toxnet.nlm.nih.gov/
42
Screening Assessment CAS RN 98-01-1
Nomeir AA, Silveira DM, McComish MF, Chadwick M. 1992. Comparative metabolism and disposition of furfural and furfuryl alcohol in rats. Drug Metabolism and disposition 20(2): 198-204
Nozal M, Bernal J, Toribio L, Jimenez J, Martin M. 2001. High-performance liquid chromatographic determination of methyl anthranilate, hydroxymethylfurfural and related compounds in honey. J Chromatogr A 917(1–2):95–103.
[NTP] National Toxicology Program (US). 1990. TR-382. Toxicology and carcinogenesis studies of furfural (CAS No. 98-01-1) in F344/N rats and B6C3F1 mice (gavage studies). Available at: http://ntp-apps.niehs.nih.gov/ntp_tox/index.cfm
[OECD] Organisation for Economic Co-operation and Development. 2008. Draft report to the UN sub-committee of experts on the GHS: terrestrial environmental hazards. Annex. Classification of hazards to the terrestrial environment. A review. Paris (FR): OECD. ENV/JM/HCL(2008)3. Available from: http://www.oecd.org/dataoecd/13/18/41344882.pdf.
O’Neil MJ, Heckelman PE, Koch CB, Roman KJ. 2006. The Merck index. An encyclopedia of chemicals, drugs, and biologicals. 14th ed. Whitehouse Station (NJ): Merck & Co., Inc.
Opdyke DLJ. 1978. Monographs on fragrance raw materials: furfural. Food Cosmet Toxicol 16:759 [cited in EU 2004].
Ortega-Heras M, Gonzalez-Sanjose M, Gonzalez-Huerta C. 2007. Consideration of the influence of aging process, type of wine and oenological classic parameters on the levels of wood volatile compounds present in red wines. Food Chem 103(4):1434–1448.
Palmer SJ, Kendall TZ, Krueger HO. 2005. Furfural: a flow-through life-cycle toxicity test with the cladoceran (Daphnia magna). Easton (MD): Wildlife International Ltd. Final report. Project Number: 566A-105A. [cited in EU 2008].
Pareles S, Chang S. 1974. Identification of compounds responsible for baked potato flavour. J Agric Food Chem 22(2):339–340.
Pellizzari E, Hartwell T, Harris B, Waddell R, Whitaker D, Erikson M. 1982. Purgeable organic compounds in mothers’ milk. Bull Environ Contam Toxicol 28:322–328 [cited in IPCS 2000].
Peterson R, Izzo H, Jungermann E, Chang S. 1975. Changes in volatile flavour compounds during the retorting of canned beef stew. J Food Sci 40:948–954.
Pitter P. 1976. Determination of biological degradability of organic substances. Water Res 10:231–235.
Poisson L, Schmalzried F, Davidek T, Blank I, KerlerJ. 2009. Study on the role of precursors in coffee flavour formation using in-bean experiments. J Agric Food Chem 57(21):9923–9931.
Reynolds SH, Stowers SJ, Patterson RM, Maronport RR, Aaronson SA, Anderson MW. 1987. Activated oncogens in B6C3F1 mouse liver tumours: Implications for risk assessment. Science 237:1309–1316 [cited in EU 2004].
Rodgman A, Perfetti TA. 2009. The chemical components of tobacco and tobacco smoke. Boca Raton (FL): CRC Press. p. 239.
Rodriguez-Arnaiz R, Romas-Morales P, Zimmering S. 1992. Evaluation in Drosophila melanogaster of the mutagenic potential of furfural in the mei-9a test for chromosome loss in germ-line cells and the wing spot test for mutational activity in somatic cells. Mutat Res 280:75–80 [cited in EU 2004].
43
Screening Assessment CAS RN 98-01-1
Rowe EH, Tullos LF Jr. 1980. Lube solvents no threat to waste treatment. Hydrocarbon Process 59:63–65.
SCCNFP (Scientific Committee on Cosmetic Products and Non-Food Products). 2004a. Information Letter 696. Europe – SCCNFP opinions on acetaldehyde, furfural, musk ketone and musk xylene. [accessed 2010 Apr 1]. Available at: http://www.ifraorg.org/files/documentspublished/1/en--us/IFLET/21547_IFLET_2004_06_28_IL696_-_Europe_--SCCNFP_opinions_on_Acetaldehyde,_Furfural,_Musk_ketone_and_musk_xylene.pdf
SCCNFP (Scientific Committee on Cosmetic Products and Non-Food Products). 2004b. Opinion of the Scientific Committee on Cosmetic Products and Non-Food Products intended for consumers concerning FURFURAL. Adopted by the SCCNFP during the 28th plenary meeting of 2004 May 25. SCCNFP/0822/04/ [cited in EU 2008].
SCF (Scientific Committee on Food). 2003. Opinion on furfural and furfural diethylacetal (expressed on 2002 Dec 2). [Internet]. Available at: http://europa.eu.int/comm/food/fs/sc/scf/outcome_en.html> SCF/CS/FLAV/FLAVOUR/11 ADD1 Final, 22 January.
Schafer EW Jr, Bowles WA Jr, Hurlbut J. 1983. The acute oral toxicity, repellency, and hazard potential of 998 chemicals to one or more species of wild and domestic birds. Arch Environ Contam Toxicol 12:355–382.
SCHER (Scientific Committee on Health and Environmental Risks). 2005. SCHER opinion on: “Risk Assessment Report on Furfural Human Health Part” CAS No. 98-01-1, EINECS No. 202-627-7. Adopted by the SCHER during the 3rd plenary meeting of 2005 Jan 28.
Schreyen L, Dirinck P, Van Wassenhove F, Schamp N. 1976. Volatile flavour components of leek. J Agric Food Chem 24(2):336–341.
Schultheiss J, Jensen D, Galensa R. 2000. Determination of aldehydes in food by high-performance liquid chromatography with biosensor coupling and micromembrane suppressors. J Chromatogr A 880(1–2):233–242.
Shahhidi F, Rubin L, D’Souza L. 1986. Meat flavor volatiles: a review of the composition, techniques of analysis, and sensory evaluation. CRC Crit Rev Food Sci Nutr 24:141–243.
Shaughnessy R. et al. 2001. Environ Sci Technol 35:2758–2764. [cited in NLM 2009].
Shibamato T. et al. 1981. J Agric Food Chem 29:57–63. [cited in NLM 2009].
Shimizu A, Kanisawa M. 1986. Experimental studies on hepatic cirrhosis and hepatocarcinogenesis, I. Production of hepatic cirrhosis by furfural administration. Acta Pathol Jpn 36(7):1027–1038 [cited in EU 2008; SCF 2003].
Steenwinkel M-JST, Krul CAM. 2003. In vivo gene mutation study by use of λlacZ transgenic mice with furfural. Zeist (NL): TNO Nutrition and Food Research. TNO Report V3934. [cited in EU 2008].
Stich HF, Rosin MP, Wu CH, Powrie WD. 1981. Clastogenicity of furans found in food. Cancer Lett 13:89–95 [cited in EU 2004].
Study Submission. 2010. Unpublished confidential studies submitted to Environment Canada under the Chemicals Management Plan Challenge initiative. Available as Robust Study Summary, Identification No. 13365Submission021. Gatineau (QC): Environment Canada, Program Development and Engagement Division.
44

Screening Assessment CAS RN 98-01-1
Tatum J, Nagh S, Berry R. 1975. Degradation products formed in canned single-strength orange juice during storage. J Food Sci 40(4):707–709.
Teta MJ, Ott MG, Schnatter AR. 1987. Population based mortality surveillance in carbon products manufacturing plants. Br J Ind Med 44:344–350 [cited in EU 2004].
Thomas A. 1973. An analysis of the flavour of the dried mushroom, Boletus edulis. J Agric Food Chem 21(6):955–958.
[TOPKAT] TOxicity Prediction by Komputer Assisted Technology [Internet]. 2004. Version 6.1. San Diego (CA): Accelrys Software, Inc. Available from: http://www.accelrys.com/products/topkat/index.html
TPD NMI (Therapeutic Products Directorate’s Non-Medicinal Ingredients database). 2010. Health Canada. Proprietary database.
Tressel R, Bahri D, Holzer M, Kossa T. 1977. Formation of flavour components in asparagus. 2. Formation of flavour components in cooked asparagus. J Agric Food Chem 25(3):459–463.
Underwood J. 1971. Effect of heat on the flavouring components of maple syrup: a preliminary study by gas chromatography. J Food Sci 36(2):228–230.
US EPA (United States Environmental Protection Agency). 2010. Furfural. Human health risk assessment for use on golf course turf (tees and greens) and sod farms. Office of Prevention, Pesticides and Toxic Substances. Available at: http://www.regulations.gov/search/Regs/home.html#docketDetail?R=EPA-HQ-OPP-2009-0722
Van Boekel MAJS. 1998. Effect of heating on Maillard Reactions in milk. Food Chem 62:403.
Van Boekel MAJS, Rehman Z. 1987. Determination of hydroxymethylfurfural in heated milk by high-performance liquid chromatography. Neth Milk Dairy J 41:297–306.
Vanderhaegen B, Neven H, Coghe S, Verstrepen K, Verachtert H, Derdelinckx G. 2003. Evolution of chemical and sensory properties during aging of top-fermented beer. J Agric Food Chem 51(23):6782–6790.
Vesely P, Lusk L, Basarova G, Seabrooks J, Ryder D. 2003. Analysis of aldehydes in beer using solid-phase microextraction with on-fiber derivatization and gas chromatography/mass spectrometry. J Agric Food Chem 51(24):6941–6944.
Vinogradova VK, Smirnova VG, Belyakov AA, Chernova LN, Osokina AP. 1968. Problems of labour hygiene and state of health of workers engaged in furfurol production. Gig Tr Prof Zabol 12:7–10 [English translation cited in EU 2004].
Walradt J, Pittet A, Kinlin T, Muralidhara R, Sanderson A. 1971 Volatile components of roasted peanuts. J Agric Food Chem 19(5):972–979.
Wang P, Odell G. 1972. Characterization of some volatile constituents of roasted pecans. J Agric Food Chem 20(2):206–210.
WHO (World Health Organization). 1999. WHO food additive series, no. 42, furaldehyde. Geneva (CH): WHO. p. 33–56.
Wilmer JWGM, Leeman WR, Splinter A, Feron VJ. 1987. Induction of DNA repair in nasal epithelium by formaldehyde and other irritant aldehydes. In: Tyhiak E, Gullner G, editors. Proceedings of the 2nd
45

Screening Assessment CAS RN 98-01-1
International Conference on the role of formaldehyde in biological systems. Keszthely Hungary, 79 [cited in EU 2004].
Witters H. 2005. Fish, short-term toxicity test on embryo and sac-fry stages of zebrafish, Brachydanio rerio. Test substance: furfural. Mol (BE): Vlaamse Instelling voor Technologisch Onderzoek (VITO). Study report VITO FST 04001. [cited in EU 2008].
Woodruff RC, Mason JM, Valencia R, Zimmering S. 1985. Chemical mutagenesis testing in Drosophila. V. Results of 53 coded compounds tested for the National Toxicology Program. Environ Mutat 7:677–702 [cited in EU 2004].
[WSKOWWIN] Water Solubility for Organic Compounds Program for Microsoft Windows [Estimation Model]. 2008. Version 1.41. Washington (DC): US Environmental Protection Agency, Office of Pollution Prevention and Toxics; Syracuse (NY): Syracuse Research Corporation. Available from: www.epa.gov/oppt/exposure/pubs/episuite.htm
Yalkowsky SH, He Y. 2003. Handbook of aqueous solubility data: an extensive compilation of aqueous solubility data for organic compounds extracted from the AQUASOL database. Boca Raton (FL): CRC Press LLC.
Yanagimoto K, Ochi H, Lee K, Shibamoto T. 2003. Antioxidative activities of volatile extracts from green tea, Oolong tea and black tea. J Agric Food Chem 51(25):7396–7401.
Yassaa N., Brancaleoni, E. 2000. Atmospheric Measurement Techniques Atmos Environ 34:2809–2816. [cited in NLM 2009].
Yasuhara A, Kawada, K, Shibamoto, T. G. 1998.Gas chromatographic/Mass Spectrometric Method for Analysis of Trace Carbonyl Compounds in Foods and Beverages. J Agric Food Chem 46:2664–2670. [cited in NLM 2009].
Zdzienicka M, Tudek B, Zieleńska M, Szymczyk T. 1978. Mutagenic activity of furfural in Salmonella typhimurium TA100. Mutat Res 58:205–209 [cited in EU 2008].
Zhang J, Lioy PJ, He Q. 1994. Characteristics of aldehydes: concentrations, sources, and exposures for indoor and outdoor residential microenvironments. Environ Sci Technol 28(1):146–152.
46

Screening Assessment CAS RN 98-01-1
Appendix 1. Upper-bounding estimates of daily intakes of furfural for various age groups in the Canadian population
Estimated intake (µg/kg-bw/d) of furfural by various age groups 0–0.5 yearsa,b,c
Route of exposure Breast
milk fed
Formula fed
Not formula
fed
0.5–4 yearsd
5–11 yearse
12–19 yearsf
20–59 yearsg
60+ yearsh
Ambient airi 0.09 0.09 0.09 0.20 0.16 0.09 0.08 0.027 Indoor airj 1.44 1.44 1.44 3.09 2.41 1.37 1.18 1.02 Drinking waterk N/An N/A 0.08 0.09 0.07 0.04 0.04 0.04
Soill N/A N/A N/A N/A N/A N/A N/A N/A Food and beveragesm N/A 37.76 189.9 to
190.0 139.7 to
171.9 112.4 to
205.4 72.39 to
404.4 81.17 to
1305 66.06 to
1003 Total daily intake
1.53 39.29
191.5 to 191.6
143.1 to 175.3
115.0 to 209.0
73.89 to 406.0
82.47 to 1306
67.19 to 1005
a No quantitative data were identified for concentrations of furfural in breast milk. b Assumed to weigh 7.5 kg, breathe 2.1 m3 of air per day, drink 0.8 L of water per day (formula fed) or 0.3
L/day (not formula fed), and ingest 30 mg of soil per day (Health Canada 1998). c For exclusively formula-fed infants, intake from water is synonymous with intake from food. For non-
formula-fed infants, approximately 50% are introduced to solid foods by 4 months of age and 90% by 6 months of age (NHW 1990).
d Assumed to weigh 15.5 kg, breathe 9.3 m3 of air per day, drink 0.7 L of water per day, and ingest 100 mg of soil per day (Health Canada 1998).
e Assumed to weigh 31.0 kg, breathe 14.5 m3 of air per day, drink 1.1 L of water per day, and ingest 65 mg of soil per day (Health Canada 1998).
f Assumed to weigh 59.4 kg, breathe 15.8 m3 of air per day, drink 1.2 L of water per day, and ingest 30 mg of soil per day (Health Canada 1998).
g Assumed to weigh 70.9 kg, breathe 16.2 m3 of air per day, drink 1.5 L of water per day, and ingest 30 mg of soil per day (Health Canada 1998).
h Assumed to weigh 72.0 kg, breathe 14.3 m3 of air per day, drink 1.6 L of water per day, and ingest 30 mg of soil per day (Health Canada 1998).
i Furfural was detected in 7 of 36 samples of ambient air near six residences in suburban New Jersey in the summer of 1992 (Zhang et al. 1994). Maximum concentration: 0.69 ppb (2.7 µg/m3); range: 0.06 to 0.69 ppb. A lower concentration was reported in a single measurement in Louisiana (Krause et al. 2009). Other reports of furfural in ambient air were limited to qualitative detection (Hampton et al. 1982; Juttner 1986; Yassaa et al. 2000). Lower concentrations were reported by the Japan Environment Agency (1998).
j Furfural was identified in the indoor air of eleven new houses in the USA in 1997 between 2 and 9.5 months after their completion (Hodgson et al. 2000). Geometric mean concentrations ranged from 0.5 to <1.5 ppb (1.965 to 5.895 µg/m3). Estimates of intake are based upon the latter concentration. Although a slightly higher (6.30 µg/m3) individual value in values ranging from 0.16 to 6.30 ug/m3 was measured in a study in Finland ( Kostiainen et al 1995) the mean value in that study (1.56 µg/m3) was lower than those reported by Hodgson et al. (2000). Lower concentrations of furfural in indoor air were reported by Zhang et al. (1994) and Krause et al. (2009).
k Concentrations of furfural in drinking water were not identified. Furfural was identified in 1 of 13 samples of surface water from the Lake Michigan basin at a concentration of 2 µg/L (Konasewich et al. 1978). This value is used as a surrogate for a concentration in drinking water. Other sources of information on furfural in water were Ewing et al. (1977), Kool et al. (1982), Lucas (1984), and Japan Environment Agency (1998).
l Concentrations of furfural in soil in Canada or elsewhere were not identified. m See Appendix 5 for detailed information on Dietary Exposure Assessment.
47

Screening Assessment CAS RN 98-01-1
n N/A: information not available.
48
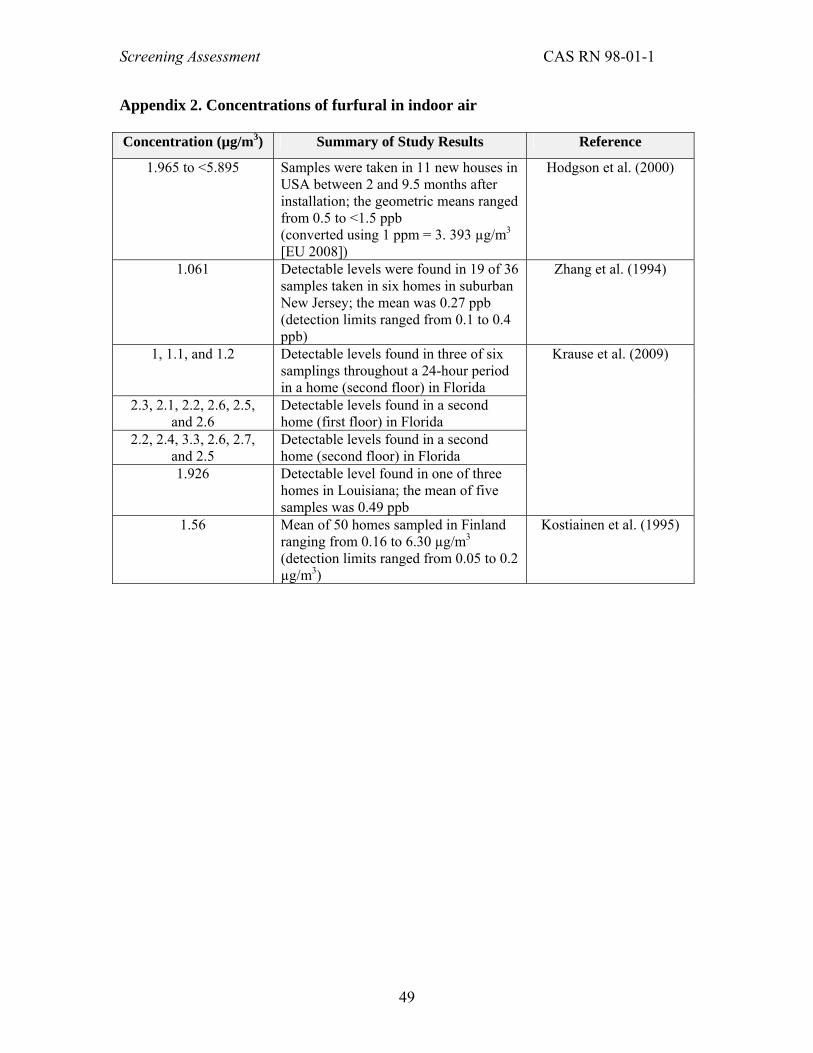
Screening Assessment CAS RN 98-01-1
Appendix 2. Concentrations of furfural in indoor air Concentration (µg/m3) Summary of Study Results Reference
1.965 to <5.895 Samples were taken in 11 new houses in USA between 2 and 9.5 months after installation; the geometric means ranged from 0.5 to <1.5 ppb (converted using 1 ppm = 3. 393 µg/m3 [EU 2008])
Hodgson et al. (2000)
1.061 Detectable levels were found in 19 of 36 samples taken in six homes in suburban New Jersey; the mean was 0.27 ppb (detection limits ranged from 0.1 to 0.4 ppb)
Zhang et al. (1994)
1, 1.1, and 1.2 Detectable levels found in three of six samplings throughout a 24-hour period in a home (second floor) in Florida
2.3, 2.1, 2.2, 2.6, 2.5, and 2.6
Detectable levels found in a second home (first floor) in Florida
2.2, 2.4, 3.3, 2.6, 2.7, and 2.5
Detectable levels found in a second home (second floor) in Florida
1.926 Detectable level found in one of three homes in Louisiana; the mean of five samples was 0.49 ppb
Krause et al. (2009)
1.56 Mean of 50 homes sampled in Finland ranging from 0.16 to 6.30 µg/m3
(detection limits ranged from 0.05 to 0.2 µg/m3)
Kostiainen et al. (1995)
49
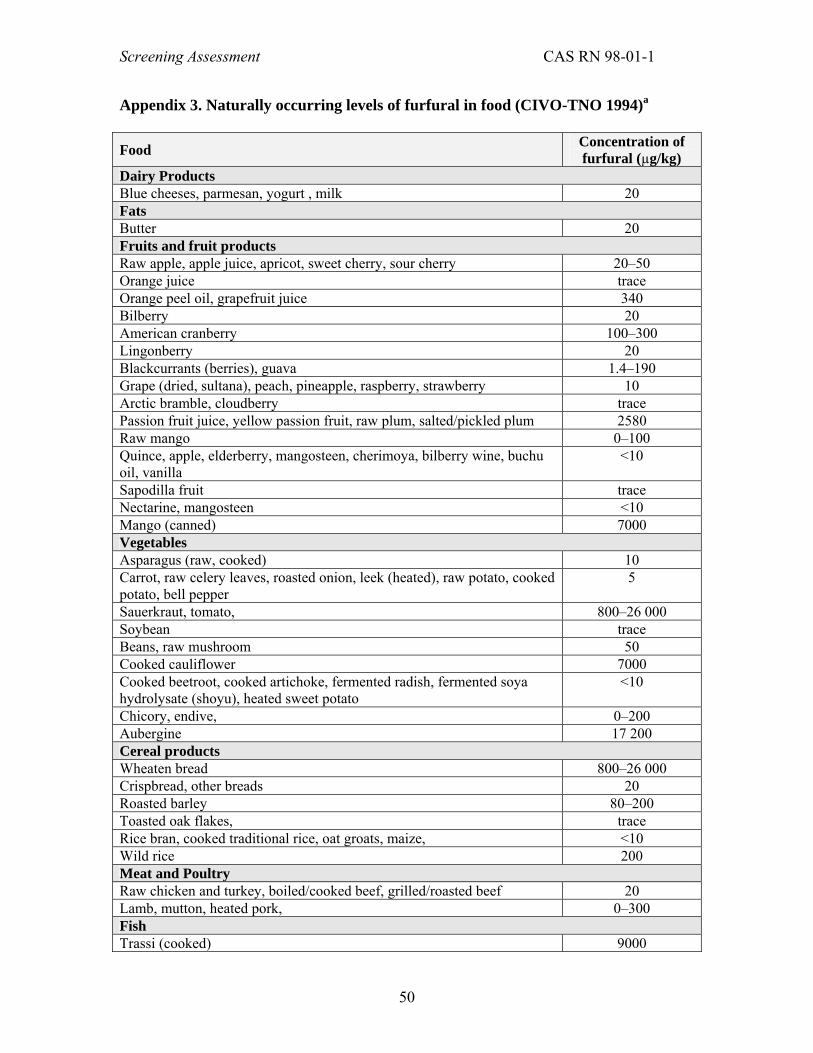
Screening Assessment CAS RN 98-01-1
Appendix 3. Naturally occurring levels of furfural in food (CIVO-TNO 1994)a Food Concentration of
furfural (µg/kg) Dairy Products Blue cheeses, parmesan, yogurt , milk 20 Fats Butter 20 Fruits and fruit products Raw apple, apple juice, apricot, sweet cherry, sour cherry 20–50 Orange juice trace Orange peel oil, grapefruit juice 340 Bilberry 20 American cranberry 100–300 Lingonberry 20 Blackcurrants (berries), guava 1.4–190 Grape (dried, sultana), peach, pineapple, raspberry, strawberry 10 Arctic bramble, cloudberry trace Passion fruit juice, yellow passion fruit, raw plum, salted/pickled plum 2580 Raw mango 0–100 Quince, apple, elderberry, mangosteen, cherimoya, bilberry wine, buchu oil, vanilla
<10
Sapodilla fruit trace Nectarine, mangosteen <10 Mango (canned) 7000 Vegetables Asparagus (raw, cooked) 10 Carrot, raw celery leaves, roasted onion, leek (heated), raw potato, cooked potato, bell pepper
5
Sauerkraut, tomato, 800–26 000 Soybean trace Beans, raw mushroom 50 Cooked cauliflower 7000 Cooked beetroot, cooked artichoke, fermented radish, fermented soya hydrolysate (shoyu), heated sweet potato
<10
Chicory, endive, 0–200 Aubergine 17 200 Cereal products Wheaten bread 800–26 000 Crispbread, other breads 20 Roasted barley 80–200 Toasted oak flakes, trace Rice bran, cooked traditional rice, oat groats, maize, <10 Wild rice 200 Meat and Poultry Raw chicken and turkey, boiled/cooked beef, grilled/roasted beef 20 Lamb, mutton, heated pork, 0–300 Fish Trassi (cooked) 9000
50

Screening Assessment CAS RN 98-01-1
Concentration of Food furfural (µg/kg) Bonito (dried) <10 Foods primarily sugar Honey trace Nuts and seeds Roasted filbert, roasted peanut, roasted pecan, 80–200 Roasted macadamia nut, roasted sesame seed 0–100 Roasted pistachio nut 17 200 Roasted almond 9000 Soft drinks and alcohol Hop oil, beer 0–300 Cognac 600–33 000 Armagnac 2000 Weinbrand 200–4300 Grape brandy, other brandies, rums, rum volatiles 22 000 Rum volatiles trace–25 000 Rum volatiles trace Bourbon whisky 2000–11 600 Irish whiskey 800–13 600 Malt whisky 10 000–37 000 Scotch blended whisky 1100–30 000 Canadian whisky 300–800 Japanese whisky 500–4500 Cider, sherry, white wine trace–10 300 Red wine 5–50 Rosé wine, port wine 2000–34 000 Special wine, botrytized wine 130 Cocoa, coffee 55 000–255 000 Black tea 2000–7000 green tea 100 Microbial fermented tea, brewed tea 300–800 Plum brandy 9000 Pear brandy 7000 Apple brandy, gin, strawberry wine, sake, malt, peated malt, bilberry wine
<10
Arrack 17 200 Ouzo 0–200 Miscellaneous Cinnamon, cloves, Mentha species 800–26 000 Popcorn, American potato chips 80–200 Tamarind 7000 Bacuri, cupuacu, muruci, sukiyaki, licorice, matsutake, wort, cherimoya, buchu oil, vanilla
<10
a Secondary source did not specify whether analyses of coffee, tea, and cocoa were for beans/leaves or beverage.
51

Screening Assessment CAS RN 98-01-1
Appendix 4. Naturally occurring levels of furfural in food reported in additional sources
Food Concentration Country Reference Breast milk Breast milk Detected in two of eight
samples of milk volatiles USA Erickson et al. (1980);
Pellizzari et al. (1982) Infant formula Starter and follow-up powdered formula; stored for 0 to 12 months at 20 and 37°C
Adapted formula, 20°C; total furfural:
0 month: 31.88 ± 5.43 µg/100 g 3 month: 16.79 ± 1.33 µg/100 g 6 month: 44.25 ± 3.59 µg/100 g 9 month: 50.23 ± 3.93 µg/100 g
12 month: 51.14 ± 4.18 µg/100 g
Adapted formula, 37°C; total furfural:
0 month: 31.88 ± 5.43 µg/100 g 3 month: 19.14 ± 2.26 µg/100 g 6 month: 40.91 ± 2.67 µg/100 g 9 month: 56.78 ± 6.82 µg/100 g
12 month: 55.58 ± 3.93 µg/100 g
Spain Ferrer et al. (2002)
Powdered formula; measured in formula stored as 20 and 37°C for 15 to 24 months
Adapted formula, 20 degrees C; total furfural: 15 month: 36 ± 0.1 µg/100 g 18 month: 28 ± 1 µg/100 g 21 month: 19 ± 2 µg/100 g 24 month: 86 ± 1 µg/100 g
Adapted formula, 37°C;
total furfural: 15 month: 38 ± 2 µg/100 g 18 month: 33 ± 1 µg/100 g 21 month: 24 ± 2 µg/100 g 24 month: 87 ± 4 µg/100 g
Spain Ferrer et al. (2005)
Powdered formula; measured levels in powdered infant formulas supplemented with long-chain polyunsaturated fatty acids stored at 25 and 37°C, from 0 to 12 months of storage
Supplemented formula, 25°C:
0 month: 167.88 ± 4.98 µg/100 g 3 month: 214.53 ± 8.54 µg/100 g 6 month: 234.68 ± 5.93 µg/100 g 9 month: 192.71 ± 6.91 µg/100 g 12 month: 186.40 ± 17.3 µg/100 g
Supplemented formula,
37°C: 0 month: 167.13 ± 4.98 µg/100 g 3 month: 232.06 ± 5.39 µg/100 g 6 month: 199.74 ± 11.27 µg/100 g 9 month: 201.77 ± 9.68 µg/100 g 12 month: 198.22 ± 7.97 µg/100 g
Control formula (i.e., not supplemented formula),
25°C: 0 month: 170.29 ± 7.44 µg/100 g
Spain Chavez-Servin et al. (2006)
52

Screening Assessment CAS RN 98-01-1
Food Concentration Country Reference 3 month: 147.17 ± 6.66 µg/100 g 6 month: 153.86 ± 10.92 µg/100 g 9 month: 156.09 ± 3.11 µg/100 g 12 month: 212.21 ± 18.9 µg/100 g
Powdered formula; measured levels in powdered formula containing egg phospholipids and long-chain polyunsaturated fatty acids; stored at 25 and 40°C for 0 to 18 months
Formula supplemented with egg yolk phospholipids,
stored at 25°C: 0 month: 92.51 ± 7.21 µg/100 g
1 month: 113.84 ± 7.50 µg/100 g 3 month: 131.10 ± 6.80 µg/100 g 6 month: 108.04 ± 3.29 µg/100 g 9 month: 116.54 ± 14.67 µg/100 g 12 month: 74.72 ± 20.23 µg/100 g 15 month: 84.10 ± 10.86 µg/100 g 18 month: 82.94 ± 5.09 µg/100 g
Results for formula stored at 40°C
not presented.
Formula supplemented with docosahexaenoic acid and arachidobic acid, stored at
25°C: 0 month: 78.21 ± 6.24 µg/100 g
1 month: 150.06 ± 6.22 µg/100 g 3 month: 132.61 ± 12.91 µg/100 g 6 month: 106.08 ± 3.70 µg/100 g 9 month: 109.53 ± 13.01 µg/100 g 12 month: 109.31 ± 21.45 µg/100
g 15 month: 111.45 ± 19.77 µg/100
g 18 month: 121.63 ± 3.71 µg/100 g
Results for formula stored at 40°C
not presented.
Spain Chavez-Servin et al. (2009)
Powdered milk formula, used primarily by pregnant women; stored from 0 to 15 months at 25 and 37°C
Formula stored at 25 degrees C:
0 month: 128.40 ± 2.6 µg/100 g 5 month: 216.61 ± 13 µg/100 g 9 month: 162.55 ±7.7 µg/100 g
12 month: 249.84 ± 5.5 µg/100 g 15 month: 345.36 ± 5.6 µg/100 g
Spain Chavez-Servin et al. (2005)
Fruit Pineapple guava fruit 0.02 µg/g California Binder and Flath
(1989) Nectarines Identified as volatile
flavour component USA Engel et al. (1988)
Mango (canned puree from India)
Qualitatively identified India Hunter et al. (1974)
Nuts Roasted filberts Identified as volatile
flavour component USA Kinlin et al. (1972)
Roasted peanuts Identified as volatile flavour component
USA Johnson et al. (1971); Walradt et al. (1971)
53

Screening Assessment CAS RN 98-01-1
Food Concentration Country Reference Roasted pecans Identified as volatile
flavour component USA Wang and Odell
(1972) Roasted macadamia nuts Identified as volatile
flavour component USA Crain and Tang
(1975) Vegetables Sweet corn (canned cream) Sweet corn (canned kernel) Sweet corn (frozen kernel) Sweet corn (fresh kernel)
8 ppb
7 ppb
2 ppb
<1 ppb
USA Buttery et al. (1994)
Rice cake volatile 700 and 800 ppb USA Buttery et al. (1999) Baked potatoes Identified as volatile
flavour component USA Coleman et al. (1981);
Pareles and Chang (1974)
Detected in volatiles in two of three commercial fermented soybean curds
11.9 and 283.5 µg/kg (dry sample)
Hong Kong Chung (1999a)
Asparagus Qualitatively identified Germany Tressel et al. (1977) Leek Qualitatively identified as
volatile component Belgium Schreyen et al. (1976)
Bell pepper Qualitatively identified as volatile component
USA Buttery et al. (1969)
Tomatoes Qualitatively identified as volatile component
USA Buttery et al. (1971)
Dried mushrooms Qualitatively identified Switzerland Thomas (1973) Meat and Fish Crab meat, legs Crab meat, body Crab meat, carapace
0.5 µg/kg (dry sample) 0.9 µg/kg (dry sample)
10.2 µg/kg (dry sample)
Hong Kong Chung (1999b)
Salt-fermented herring Shrimp paste
3760 ng/g 599 ng/g
Korea Cha and Cadwaller (1995)
Fried bacon Identified as volatile flavour component
Ho et al. 1983
Pork liver, pressure cooked
Qualitatively identified USA Mussinan and Walradt (1974)
Cooked beef Qualitatively identified USA Chang et al. (1977) Mutton and beef Identified as a component
of volatiles Shahidi et al. (1986).
Canned beef stew Qualitatively identified USA Peterson et al. (1975); Chang and Peterson (1977)
Dairy Blue cheese fat Identified in aroma fraction Day and Anderson
(1965) Ice cream, ices 13 ppma Furia and Bellanca,
(1975)
54

Screening Assessment CAS RN 98-01-1
Food Concentration Country Reference Beverages Identified in coffee aroma
Aeschbacher et al. (1989)
Non-alcoholic beverages 4 ppmb Furia and Bellanca (1975)
Alcoholic beverages 10 ppmc Furia and Bellanca, (1975)
Seven commercial brands of saki
68 to 933 ng/mL; median = 280 ng/mL
Japan Yasuhara et al. (1998)
12 red wines Quantitative data not presented
Spain Ortega-Heras et al. (2007)
267 bottles of red wine sampled (89 brands, a bottle sampled from each of three lots)
Mean = 4.56 mg/L (range: 0 to 22.72 mg/L)
A density of 0.99 has been assigned to red wine (Diaz et al. 2003; Godelmann et
al. 2008). Mean = 4.51 mg/kg (range:
0 to 22.5 mg/kg)
Spain Garde-Cerdan et al. (2008)
Red wine Not detected at day 1; concentrations after 207
days in five different types of barrels:
0.098 mg/L 0.104 mg/L 0.091 mg/L 0.094 mg/L 0.115 mg/L
Czech Republic
Matejicek et al. (2005)
Beer, fresh 48.1 µg/L Belgium Vanderhaegen et al. (2003)
Beer, 6 months storage Ranged from 65.0 µg/L (0°C and CO2 in headspace) to 2535 mg/L (40°C and air
in headspace)
Belgium Vanderhaegen et al. (2003)
Beer 28.8 ppb in beer stored at 0°C for 12 weeks; 458.3
ppb in beer stored at 30°C for 12 weeks
USA Vesely et al. (2003)
Roasted green tea 7.67 mg/kg Japan Yanagimoto et al. (2003)
Coffee powder (n = 5) Instant coffee powder (n = 8) Sherry Fruit juice
70 to 160 mg/kg 14 to 95 mg/kg
1 mg/L
0.3 mg/L
Germany Schultheiss et al. (2000)
Roasted green coffee beans
165.8 mg/kg dry matter Switzerland Poisson et al. (2009)
Apple juice Not detected in three Canada Kermasha et al.
55
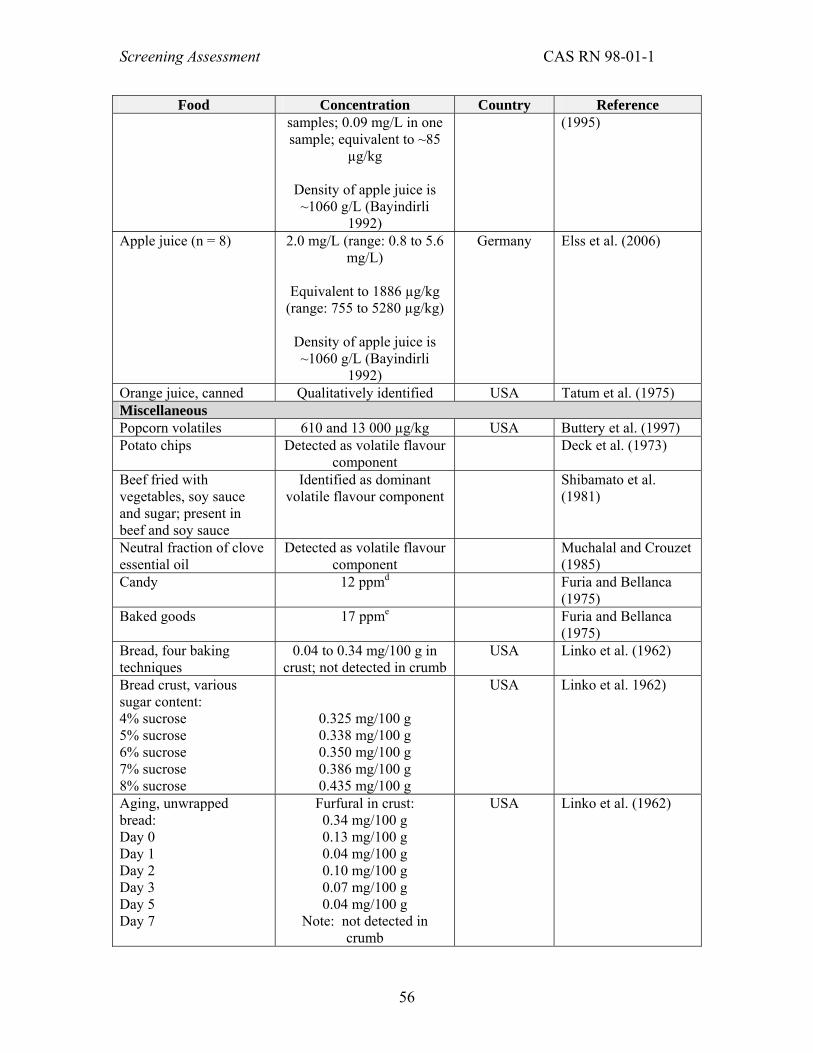
Screening Assessment CAS RN 98-01-1
Food Concentration Country Reference samples; 0.09 mg/L in one sample; equivalent to ~85
µg/kg
Density of apple juice is ~1060 g/L (Bayindirli
1992)
(1995)
Apple juice (n = 8) 2.0 mg/L (range: 0.8 to 5.6 mg/L)
Equivalent to 1886 µg/kg
(range: 755 to 5280 µg/kg)
Density of apple juice is ~1060 g/L (Bayindirli
1992)
Germany Elss et al. (2006)
Orange juice, canned Qualitatively identified USA Tatum et al. (1975) Miscellaneous Popcorn volatiles 610 and 13 000 µg/kg USA Buttery et al. (1997) Potato chips Detected as volatile flavour
component Deck et al. (1973)
Beef fried with vegetables, soy sauce and sugar; present in beef and soy sauce
Identified as dominant volatile flavour component
Shibamato et al. (1981)
Neutral fraction of clove essential oil
Detected as volatile flavour component
Muchalal and Crouzet (1985)
Candy 12 ppmd Furia and Bellanca (1975)
Baked goods 17 ppme Furia and Bellanca (1975)
Bread, four baking techniques
0.04 to 0.34 mg/100 g in crust; not detected in crumb
USA Linko et al. (1962)
Bread crust, various sugar content: 4% sucrose 5% sucrose 6% sucrose 7% sucrose 8% sucrose
0.325 mg/100 g 0.338 mg/100 g 0.350 mg/100 g 0.386 mg/100 g 0.435 mg/100 g
USA Linko et al. 1962)
Aging, unwrapped bread: Day 0 Day 1 Day 2 Day 3 Day 5 Day 7
Furfural in crust: 0.34 mg/100 g 0.13 mg/100 g 0.04 mg/100 g 0.10 mg/100 g 0.07 mg/100 g 0.04 mg/100 g
Note: not detected in crumb
USA Linko et al. (1962)
56
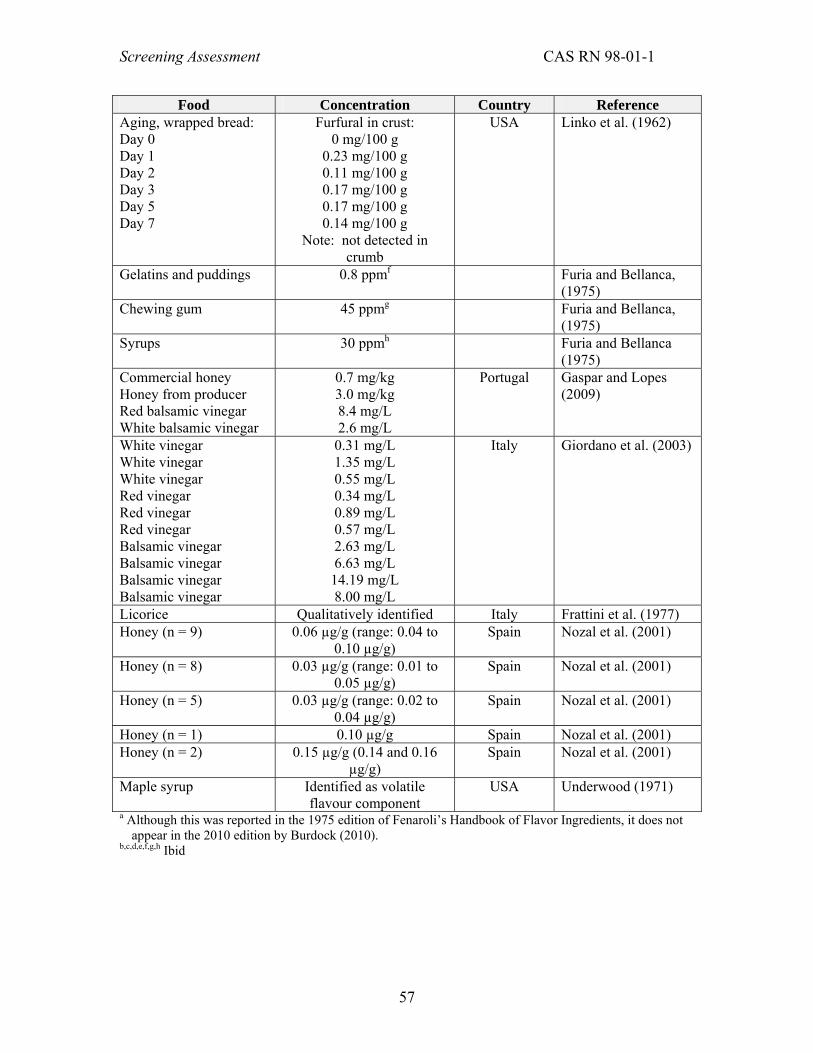
Screening Assessment CAS RN 98-01-1
Food Concentration Country Reference Aging, wrapped bread: Day 0 Day 1 Day 2 Day 3 Day 5 Day 7
Furfural in crust: 0 mg/100 g
0.23 mg/100 g 0.11 mg/100 g 0.17 mg/100 g 0.17 mg/100 g 0.14 mg/100 g
Note: not detected in crumb
USA Linko et al. (1962)
Gelatins and puddings 0.8 ppmf Furia and Bellanca, (1975)
Chewing gum 45 ppmg Furia and Bellanca, (1975)
Syrups 30 ppmh Furia and Bellanca (1975)
Commercial honey Honey from producer Red balsamic vinegar White balsamic vinegar
0.7 mg/kg 3.0 mg/kg 8.4 mg/L 2.6 mg/L
Portugal Gaspar and Lopes (2009)
White vinegar White vinegar White vinegar Red vinegar Red vinegar Red vinegar Balsamic vinegar Balsamic vinegar Balsamic vinegar Balsamic vinegar
0.31 mg/L 1.35 mg/L 0.55 mg/L 0.34 mg/L 0.89 mg/L 0.57 mg/L 2.63 mg/L 6.63 mg/L
14.19 mg/L 8.00 mg/L
Italy Giordano et al. (2003)
Licorice Qualitatively identified Italy Frattini et al. (1977) Honey (n = 9) 0.06 µg/g (range: 0.04 to
0.10 µg/g) Spain Nozal et al. (2001)
Honey (n = 8) 0.03 µg/g (range: 0.01 to 0.05 µg/g)
Spain Nozal et al. (2001)
Honey (n = 5) 0.03 µg/g (range: 0.02 to 0.04 µg/g)
Spain Nozal et al. (2001)
Honey (n = 1) 0.10 µg/g Spain Nozal et al. (2001) Honey (n = 2) 0.15 µg/g (0.14 and 0.16
µg/g) Spain Nozal et al. (2001)
Maple syrup Identified as volatile flavour component
USA Underwood (1971)
a Although this was reported in the 1975 edition of Fenaroli’s Handbook of Flavor Ingredients, it does not appear in the 2010 edition by Burdock (2010).
b,c,d,e,f,g,h Ibid
57

Screening Assessment CAS RN 98-01-1
Appendix 5. Parameters used in the assessment of dietary exposure of various age groups in the Canadian population. A dietary exposure assessment was conducted based on naturally occurring levels of furfural in foods and beverages reported in the literature (see Appendices 3 and 4 for a list of identified studies) and using the exposure methodology in Health Canada (1998) “Exposure Factors for assessing total daily intake of Priority Substances by the General Population of Canada.” The dietary exposure assessment was made with 181 foods, which included infant formulas, dairy products, fats, fruit and fruit products, vegetables, cereal products, meat and poultry, fish, eggs, foods that are primarily sugar, mixed dishes and soups, nuts and seeds, soft drinks, and alcohol. Notes below describe the rationale for selecting specific values and range of values used in the intake assessment; these values are summarized in Appendix 6. Infant formula: The maximum concentration of furfural in powdered formula (234.68 µg/100 g powdered formula) was identified in a study of formulae in Spain (Chavez-Servin et al., 2006). The intake was based upon preparation by adding 15 g of formula to 100 mL of water (Ferrer et al. 2002). Other reports of furfural in formulas included Ferrer et al. (2005) and Chavez-Servin et al. (2005, 2009). Data for formulae stored at 37 and 40°C were not considered adequate for use in the estimation of intake. Dairy: The intake was based upon a concentration of 0.02 ppm (20 µg/kg) reported to occur naturally in blue cheeses, parmesan, yogurt, and milk, by CIVO-TNO (1994). A higher concentration was reported to occur in ice cream and ices (13 ppm, or 13 000 µg/kg) in the 1975 edition of Fenaroli’s Handbook of Flavor Ingredients (Furia and Bellanca 1975), but this was not reported in the 2010 edition (Burdock 2010). Nonetheless, this value was used in the estimate. No other data on concentrations in dairy foods were identified. Fats: The intake was based on a concentration of 0.02 ppm (20 µg/kg) reported to occur naturally in butter by CIVO-TNO (1994). No other data for fats were identified. Fruits: In Canada, furfural was detected in one of four samples of apple juice, at a concentration of 85 µg/kg (Kermasha et al. 1995). In the USA, 20 µg/kg was detected in pineapple guava fruit (Binder and Flath 1989). Up to approximately 5 mg/kg (5000 µg/kg) was identified in orange juice in Germany (Elss et al. 2006). The remaining quantitative data for fruit were reported by CIVO-TNO (1994) and are not identifiable with respect to country of origin. Of approximately 30 fruit and fruit products, 11 were reported to contain up to 10 µg/kg. With the exception of high levels in canned mango (7000 µg/kg), passion fruit/juice, plums (2580 µg/kg), and apple juice (5280 µg/kg), the remaining values were in the range of approximately 50 to 300 µg/kg. As a conservative approach, the intake of fruit and fruit products was based upon using the actual data reported for each fruit and assigning a value of 2580 µg/kg for the fruits that did not have a reported value, since the levels in fruit had a large variation (trace to 7000 µg/kg). A higher value was used in the calculation of intakes from fruits to account for higher levels reported in canned fruits and juice products. Vegetables: No quantitative data were identified from Canada. In the USA, the maximum concentration reported in four samples of sweet corn was 8 µg/kg. Almost all of approximately 20 vegetables reported by CIVO-TNO (1994) contained less than 10 µg/kg, with exceptionally high values reported for cooked cauliflower (7000 µg/kg), sauerkraut and tomato (800 to 26 000 µg/kg), and aubergine (eggplant) (17 200 µg/kg). Reports for soybean curds ranged from 119 to 2835 µg/kg. In the modelling of intakes, reported maximum values were used for foods that had a reported value, and the value of 50 µg/kg reported for beans and raw mushrooms has been used to calculate intakes of furfural from vegetables that did not have a value specified. Cereal products: No Canadian data were identified. In the USA, results of analyses of bread crust have been reported (Linko et al. 1962), but it was noted that furfural was detected in the crust only, i.e., not in
58

Screening Assessment CAS RN 98-01-1
crumb. CIVO-TNO (1994) reported that furfural was present in crispbread and other breads at a concentration of 20 µg/kg, but the values for wheaten bread were reported to be as high as 26 000 µg/kg. The values reported for cereal products range from as low as 0–200 µg/kg in wild rice to as high as 26 000 µg/kg in wheaten bread. Baked goods were reported to have levels of 17 ppm (17 000 µg/kg) and this value was used for intakes from cakes and cookies. Rice cakes are reported to have furfural levels of 700–800 µg/kg. For any cereal product that had a reported value, the maximum value was used in the calculation, and for all other cereal products, a value of 800 µg/kg was used in the estimate of intakes. Meat and poultry: Quantitative data were limited to reports by Chung (1999b) and CIVO-TNO (1994). The latter reported the highest concentration (300 µg/kg for lamb, mutton, and pork), which has been used to calculate the intake. For any food that had a reported value in Appendices 2 and 3, the maximum value was used in the intake calculation, and for all other meat and poultry products, a value of 300 µg/kg was used. Fish: Limited reports on concentrations of furfural in fish was identified. Values reported for bonito (<10 µg/kg) and in shrimp paste (599 µg/kg), salt-fermented canned herring (3760 µg/kg), and cooked trassi (9000 µg/kg) were considered. Bonito was considered to be representative of most fresh fish and a value of 10 µg/kg was used for all marine fishes that did not have an assigned value in the modelling. Crab meat was reported to contain from 0.5 to 10.2 µg/kg and a value of 0.5 was used as a surrogate for other shellfish. Eggs: No data were identified. Although there were no values reported for eggs, a value of 300 µg/kg was also used to estimate furfural levels from eggs. As eggs contain significant amounts of protein and carbohydrates, similar to meats, levels contained in meats was considered to be a surrogate for eggs. Foods, primarily sugar: No quantitative North American data were identified. Intakes are based upon the highest reported concentration of furfural (0.16 µg/g) in honey from Spain (Nozal et al. 2001). This study reported the results of duplicate analyses and was chosen over a single report of a high concentration of furfural in honey from Portugal (Gaspar and Lopes 2009). Concentrations of furfural in other high sugar-containing foods were identified in Frattini et al. (1977) and Underwood (1971). Values for chewing gum at 45 ppm or 45 000 µg/kg, syrups at 30 ppm (30 000 µg/kg), candy at 12 ppm (12 000 µg/kg), and gelatins and puddings at 0.8 ppm (800 µg/kg) were also used in the calculations. Mixed dishes and soups: No quantitative data were identified. Furfural was qualitatively identified in canned beef stew in the USA (Peterson et al. 1975; Chang and Peterson 1977) and in beef fried with vegetables and soy sauce (Shibamato et al. 1981). Since many of these dishes contain both vegetables and meats, a value of 300 µg/kg (from meats) was used as a surrogate for these type of foods. Nuts and seeds: Limited quantitative data were identified. A wide range of concentrations from 0 to 17 200 µg/kg (roasted pistachio nuts) was reported for a group of foods that included almonds (9000 µg/kg), popcorn (13 000 µg/kg), and potato chips (200 µg/kg). The majority of other values (roasted filbert, peanuts, pecans, and sesame seeds) were in the 80 to 200 µg/kg range; hence, a value of 200 µg/kg has been used to calculate intakes from other nuts without a specified value for nuts that have been qualitatively reported. Soft drinks, alcohol, coffee and tea: Most of the identified data pertained to analyses of beer, wine, and whisky and a wide range of values from 0 to 881 000 µg/kg are reported. Few data were identified for non-alcoholic beverages. The highest furfural levels are reported in coffee (255 000 µg/kg), but it is not clear whether this is for roasted beans or for brewed coffee. Other reports for coffee indicate lower values of 95 µg/g for instant coffee powder. A standard dilution of 1 tablespoon (15 g) powder to 1 cup (250 mL) of brewed coffee yields a value of 5.7 µg/g. As intake of furfural from coffee constituted the majority (>80%) of beverages for the adult group, a range of values (5.7 µg/g to upper level of 255 000 µg/g or 255 µg/kg) has been used in the estimate of intakes to present a lower and upper intake from coffee. Data used for cocoa and brewed tea were 55 000 µg/kg and 0.8 µg/kg, respectively. A value of 22 500 µg/kg representing the range of both red and white wines was used to represent wines (red wines range from 2000 to 34 000 µg/kg and white wines from trace to 10 300 µg/kg). For hard liquor products and liqueurs, a value of 33
59

Screening Assessment CAS RN 98-01-1
000 µg/kg was used. A value of 300 µg/kg was used for beer. For powdered beverage drinks, a value of 345 µg/kg was used as a surrogate from the reported values for milk powders for pregnant women, which was reported by the Spain researchers who also reported on furfural levels in powdered infant formulae.
60
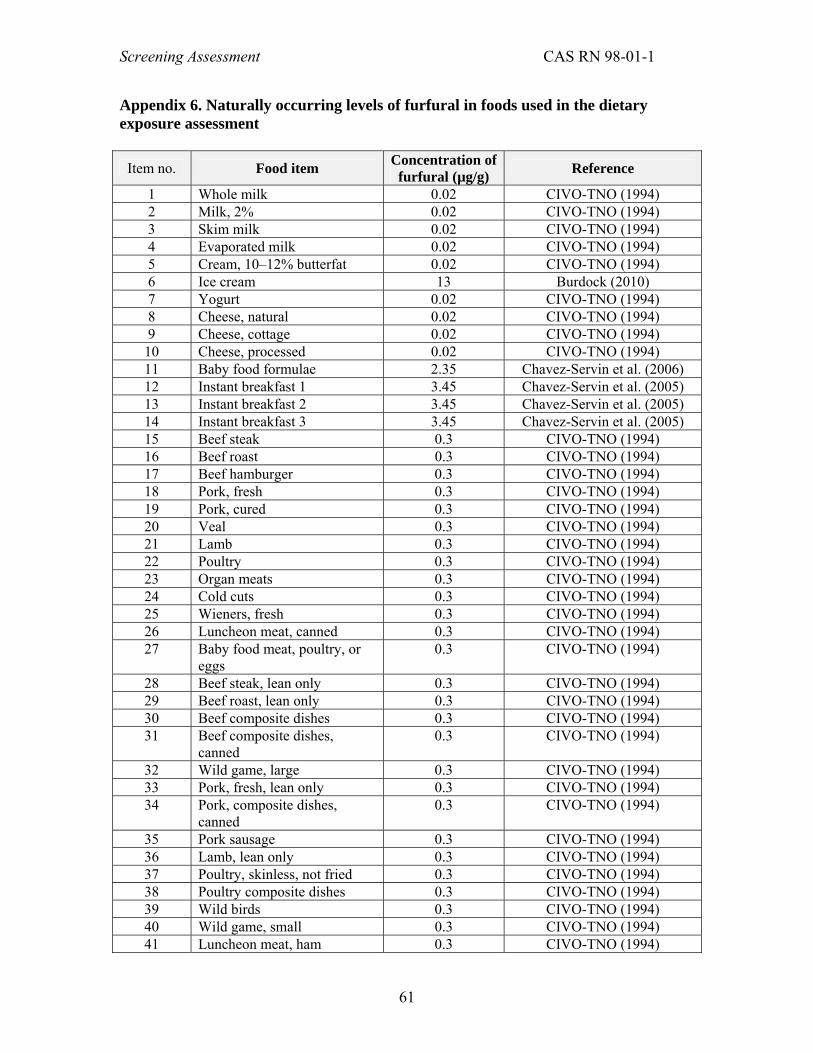
Screening Assessment CAS RN 98-01-1
Appendix 6. Naturally occurring levels of furfural in foods used in the dietary exposure assessment
Item no. Food item Concentration of furfural (µg/g) Reference
1 Whole milk 0.02 CIVO-TNO (1994) 2 Milk, 2% 0.02 CIVO-TNO (1994) 3 Skim milk 0.02 CIVO-TNO (1994) 4 Evaporated milk 0.02 CIVO-TNO (1994) 5 Cream, 10–12% butterfat 0.02 CIVO-TNO (1994) 6 Ice cream 13 Burdock (2010) 7 Yogurt 0.02 CIVO-TNO (1994) 8 Cheese, natural 0.02 CIVO-TNO (1994) 9 Cheese, cottage 0.02 CIVO-TNO (1994)
10 Cheese, processed 0.02 CIVO-TNO (1994) 11 Baby food formulae 2.35 Chavez-Servin et al. (2006) 12 Instant breakfast 1 3.45 Chavez-Servin et al. (2005) 13 Instant breakfast 2 3.45 Chavez-Servin et al. (2005) 14 Instant breakfast 3 3.45 Chavez-Servin et al. (2005) 15 Beef steak 0.3 CIVO-TNO (1994) 16 Beef roast 0.3 CIVO-TNO (1994) 17 Beef hamburger 0.3 CIVO-TNO (1994) 18 Pork, fresh 0.3 CIVO-TNO (1994) 19 Pork, cured 0.3 CIVO-TNO (1994) 20 Veal 0.3 CIVO-TNO (1994) 21 Lamb 0.3 CIVO-TNO (1994) 22 Poultry 0.3 CIVO-TNO (1994) 23 Organ meats 0.3 CIVO-TNO (1994) 24 Cold cuts 0.3 CIVO-TNO (1994) 25 Wieners, fresh 0.3 CIVO-TNO (1994) 26 Luncheon meat, canned 0.3 CIVO-TNO (1994) 27 Baby food meat, poultry, or
eggs 0.3 CIVO-TNO (1994)
28 Beef steak, lean only 0.3 CIVO-TNO (1994) 29 Beef roast, lean only 0.3 CIVO-TNO (1994) 30 Beef composite dishes 0.3 CIVO-TNO (1994) 31 Beef composite dishes,
canned 0.3 CIVO-TNO (1994)
32 Wild game, large 0.3 CIVO-TNO (1994) 33 Pork, fresh, lean only 0.3 CIVO-TNO (1994) 34 Pork, composite dishes,
canned 0.3 CIVO-TNO (1994)
35 Pork sausage 0.3 CIVO-TNO (1994) 36 Lamb, lean only 0.3 CIVO-TNO (1994) 37 Poultry, skinless, not fried 0.3 CIVO-TNO (1994) 38 Poultry composite dishes 0.3 CIVO-TNO (1994) 39 Wild birds 0.3 CIVO-TNO (1994) 40 Wild game, small 0.3 CIVO-TNO (1994) 41 Luncheon meat, ham 0.3 CIVO-TNO (1994)
61

Screening Assessment CAS RN 98-01-1
Item no. Concentration of Food item Reference furfural (µg/g) 42 Wieners canned 0.3 CIVO-TNO (1994) 43 Eggs, medium 0.3 44 Fish, marine 0.01 CIVO-TNO (1994) 45 Fish, fresh 0.01 CIVO-TNO (1994) 46 Fish, canned 3.76 Cha and Cadwaller (1995) 47 Shellfish 0.5 Chung (1999b) 48 Shellfish, canned 10.2 Chung (1999b) 49 Soups, meat, canned 0.3 CIVO-TNO (1994) 50 Soups, vegetable 0.3 CIVO-TNO (1994) 51 Soups, tomato 0.3 CIVO-TNO (1994) 52 Soups, dehydrated 0.3 CIVO-TNO (1994) 53 Baby food, cereal +
vegetables + meat 0.3 CIVO-TNO (1994)
54 Baby food, meat or poultry + vegetables
0.3 CIVO-TNO (1994)
55 Sauces and gravies 0.3 CIVO-TNO (1994) 56 Soups, shellfish 0.5 Chung (1999b) 57 Bread, white 0.8 Buttery et al. (1999) 58 Bread whole wheat 0.8 Buttery et al. (1999) 59 Rolls and biscuits 0.8 Buttery et al. (1999) 60 Flour, wheat 0.8 Buttery et al. (1999) 61 Cake 17 Furia and Bellance (1975) 62 Cookies 17 Furia and Bellance (1975) 63 Danish pastry and donuts 17 Furia and Bellance (1975) 64 Crackers 0.8 Buttery et al. (1999) 65 Pancakes 0.8 Buttery et al. (1999) 66 Cereals, wheat, cooked 0.8 Buttery et al. (1999) 67 Cereals, oatmeal 0.8 Buttery et al. (1999) 68 Cereals, dry corn 0.8 Buttery et al. (1999) 69 Cereal, dry wheat and bran 0.8 Buttery et al. (1999) 70 Rice, cooked 0.8 Buttery et al. (1999) 71 Pie, apple 17 Furia and Bellance (1975) 72 Pie, other 17 Furia and Bellance (1975) 73 Pizza 17 Furia and Bellance (1975) 74 Pasta mixed 0.8 Buttery et al. (1999) 75 Pasta, plain 0.8 Buttery et al. (1999) 76 Muffins 17 Furia and Bellance (1975) 77 Baby food cereal 0.8 Buttery et al. (1999) 78 Cereal, oatmeal, dry 0.8 Buttery et al. (1999) 79 Rice, dry 0.8 Buttery et al. (1999) 80 Pasta dishes, canned 0.8 Buttery et al. (1999) 81 Corn, fresh 0.05 CIVO-TNO (1994) 82 Potatoes, raw 0.05 CIVO-TNO (1994) 83 Potatoes, baked 0.05 CIVO-TNO (1994) 84 Potatoes, boiled with skin 0.05 CIVO-TNO (1994) 85 Potatoes, boiled, no skin 0.05 CIVO-TNO (1994) 86 Potatoes, French fries 0.2 CIVO-TNO (1994)
62

Screening Assessment CAS RN 98-01-1
Item no. Concentration of Food item Reference furfural (µg/g) 87 Potato chips 0.2 CIVO-TNO (1994) 88 Cabbage 0.05 CIVO-TNO (1994) 89 Celery 0.05 CIVO-TNO (1994) 90 Peppers 0.05 CIVO-TNO (1994) 91 Lettuce 0.05 CIVO-TNO (1994) 92 Cauliflower 0.05 CIVO-TNO (1994) 93 Broccoli 0.05 CIVO-TNO (1994) 94 Beans, green, fresh 0.05 CIVO-TNO (1994) 95 Peas, green, fresh 0.05 CIVO-TNO (1994) 96 Carrots, fresh 0.05 CIVO-TNO (1994) 97 Onions 0.05 CIVO-TNO (1994) 98 Rutabaga or turnip 0.05 CIVO-TNO (1994) 99 Tomatoes, fresh 0.8 CIVO-TNO (1994)
100 Tomato juice, canned 0.8 CIVO-TNO (1994) 101 Tomatoes, canned 0.8 CIVO-TNO (1994) 102 Mushrooms, fresh 0.05 CIVO-TNO (1994) 103 Cucumber 0.05 CIVO-TNO (1994) 104 Beans, mature, home-made 0.05 CIVO-TNO (1994) 105 Beets, fresh 0.05 CIVO-TNO (1994) 106 Baby food, vegetable 0.05 CIVO-TNO (1994) 107 Potatoes, canned 0.05 CIVO-TNO (1994) 108 Asparagus, canned 0.05 CIVO-TNO (1994) 109 Greens, canned 0.05 CIVO-TNO (1994) 110 Beans, green, canned 0.05 CIVO-TNO (1994) 111 Peas, canned 0.05 CIVO-TNO (1994) 112 Carrots, canned 0.05 CIVO-TNO (1994) 113 Tomato condiments 0.8 CIVO-TNO (1994) 114 Mushrooms, canned 0.05 CIVO-TNO (1994) 115 Cucumber condiments 0.05 CIVO-TNO (1994) 116 Squash 0.05 CIVO-TNO (1994) 117 Beans, mature, canned 0.05 CIVO-TNO (1994) 118 Beets, canned 0.05 CIVO-TNO (1994) 119 Corn, canned 0.05 CIVO-TNO (1994) 120 Popcorn 13 Buttery et al. (1997) 121 Citrus fruit, fresh 2.58 CIVO-TNO (1994) 122 Citrus fruit, canned 5.28 Elss et al. (2006) 123 Citrus juice, fresh 2.58 CIVO-TNO (1994) 124 Citrus juice, canned 5.28 Elss et al. (2006) 125 Apples, raw 2.58 CIVO-TNO (1994) 126 Fruit juice, canned 5.28 Elss et al. (2006) 127 Apple products, canned 5.28 Elss et al. (2006) 128 Bananas 2.58 CIVO-TNO (1994) 129 Grapes 2.58 CIVO-TNO (1994) 130 Grape juice, bottled 2.58 CIVO-TNO (1994) 131 Peaches, fresh 2.58 CIVO-TNO (1994) 132 Pears, fresh 2.58 CIVO-TNO (1994) 133 Plums and prunes, fresh 2.58 CIVO-TNO (1994)
63

Screening Assessment CAS RN 98-01-1
Item no. Concentration of Food item Reference furfural (µg/g) 134 Cherries, fresh 2.58 CIVO-TNO (1994) 135 Melons 2.58 CIVO-TNO (1994) 136 Strawberries, fresh 2.58 CIVO-TNO (1994) 137 Blueberries, fresh 2.58 CIVO-TNO (1994) 138 Pineapple, fresh 2.58 CIVO-TNO (1994) 139 Dried fruit 2.58 CIVO-TNO (1994) 140 Baby food fruit 2.58 CIVO-TNO (1994) 141 Rhubarb 2.58 CIVO-TNO (1994) 142 Peaches, canned 2.58 CIVO-TNO (1994) 143 Pears, canned 2.58 CIVO-TNO (1994) 144 Mixed fruit, canned 2.58 CIVO-TNO (1994) 145 Plums, canned 2.58 CIVO-TNO (1994) 146 Cherries, canned 2.58 CIVO-TNO (1994) 147 Cherries, processed 2.58 CIVO-TNO (1994) 148 Raspberries, fresh 2.58 CIVO-TNO (1994) 149 Raspberries, canned 2.58 CIVO-TNO (1994) 150 Strawberries, canned 2.58 CIVO-TNO (1994) 151 Berries, other, fresh 2.58 CIVO-TNO (1994) 152 Berries, other, canned 2.58 CIVO-TNO (1994) 153 Blueberries, canned 2.58 CIVO-TNO (1994) 154 Pineapple, canned 2.58 CIVO-TNO (1994) 155 Vegetable fats and oils 0.02 CIVO-TNO (1994) 156 Margarine 0.02 CIVO-TNO (1994) 157 Butter 0.02 CIVO-TNO (1994) 158 Cooking fats, animal 0.02 CIVO-TNO (1994) 159 Peanuts 0.2 CIVO-TNO (1994) 160 Peanut butter 0.2 CIVO-TNO (1994) 161 Nuts and seeds 0.2 CIVO-TNO (1994) 162 Sugar, white 0.16 Nozal et al. (2001) 163 Syrup, pancake 30 Furia and Bellanca (1975) 164 Jams 0.16 Nozal et al. (2001) 165 Honey 0.16 Nozal et al. (2001) 166 Puddings 0.8 Furia and Bellanca (1975) 167 Candy, chocolate bars 12 Furia and Bellanca (1975) 168 Candy, other 45 Furia and Bellanca (1975) 169 Gelatine dessert 0.8 Furia and Bellanca (1975) 170 Baby food dessert 0.16 Nozal et al. (2001) 171 Coffee 5.7 µg/g brewed
coffee (based on 95 µg/g in instant coffee powder) to
255* µg/g
Schultheiss et al. (2000) CIVO-TNO (1994)*
172 Tea 0.8 CIVO-TNO (1994) 173 Soft drinks 0.8 CIVO-TNO (1994) 174 Wine, red 22.5 Diaz et al. (2003) 175 Beer, bottled 0.3 CIVO-TNO (1994) 176 Alcohol drink spirits 33 CIVO-TNO (1994)
64

Screening Assessment CAS RN 98-01-1
Item no. Concentration of Food item Reference furfural (µg/g) 177 Soft drinks, low-calorie 0.01 CIVO-TNO (1994) 178 Miscellaneous beverage mix 4 Furia and Bellanca (1975) 179 Unclassified 4 Furia and Bellanca (1975) 180 Miscellaneous condiment 0.8 Furia and Bellanca (1975) 181 Miscellaneous food 0.3 CIVO-TNO (1994)
65

Screening Assessment CAS RN 98-01-1
Appendix 7. Estimated intake of furfural from personal care products (SCCNFP 2004b in EURAR 2008) Type of product
Application quantity
(grams per application)
Application frequency
per day
Retention factor (%)
Fragrance compound in product
(%)
Furfural in
fragrance compound
(%)
Furfural in
product (ppm)
Amount of
furfural (µg/day)
Intake of 60-
kg person (µg/kg-bw per
day) Body lotion
8 1 100 0.4 0.036 1.44 11.52 0.192
Face cream
0.8 2 100 0.3 0.036 1.08 1.728 0.029
Eau de toilette
0.75 1 100 8.0 0.036 28.8 21.6 0.36
Fragrance cream
5 0.29 100 4.0 0.036 14.4 20.8 0.348
Deodorant 0.5 1 100 1.0 0.036 3.6 1.8 0.03 Shampoo 8 1 1 0.5 0.036 1.8 0.14 0.002 Bath products
17 0.29 1 2.0 0.036 7.2 0.355 0.006
Shower gel
5 2 1 1.2 0.036 4.3 0.432 0.007
Toilet soap
0.8 6 1 1.5 0.036 5.4 0.259 0.004
Hair spray 5 2 1 0.5 0.036 0.13 0.18 0.003 Toothpaste 1.4 2 17 1.0 0.002 0.2 0.095 0.002 Total 0.983
66

Screening Assessment CAS RN 98-01-1
Appendix 8. Summary of health effects information for furfural
Endpoints Lowest effect levelsa / results Laboratory animals and in vitro Acute toxicity Oral LD50 (rats) = 50–149 mg/kg-bw (Castelli et al. 1967 cited in EU 2004).
Other oral LD50 (mice) = 400–500 mg/kg-bw; (guinea pigs) = 541 mg/kg-bw; (dog) = 650–950 mg/kg-bw (EU 2008). Oral LOAEL (rats) = 50 mg/kg-bw based on evidence of liver damage (scattered eosinophilic globular formation and increase mitotic figures without zonal or massive necrosis) observed 6 hours after exposure to furfural by gavage (Shimizu and Kanisawa 1986). Inhalation LC50 (mice, 6 hours) = 490 mg/m3 (Marhold 1972 cited in EU 2004) Other inhalation LC50 (rats, 4 hours) = 600 mg/m3 (EU 2008). Dermal LD50 (rats) = 192 mg/kg-bw (Joseph 2003, cited in EPA 2010) Other dermal LD50 (rabbits ) >310 mg/kg-bw (Moreno 1976 cited in EU 2004); (guinea pigs) <10 000 mg/kg-bw (EU 2008).
67

Screening Assessment CAS RN 98-01-1
Endpoints Lowest effect levelsa / results Short-term repeated-dose toxicity
Oral LOAEL (rats ) = 180 mg/kg-bw per day based on reduced plasma alanine aminotransferase activity with increased liver weight in female rats exposed to furfural microencapsulated in diet daily at 0, 30, 60, 90, 120, or 180 mg/kg-bw per day, for 14 days (Jonker 2000a, cited in EU 2008). Inhalation LOAEC (rats) = 20 mg/m3 based on metaplasia and hyperplasia of transitional respiratory epithelium of the anterior part of the nose in Fischer 344 rats (five per group per sex) exposed to furfural vapour by inhalation at concentrations of 0, 20, 40, 80, 160, 320, 640, or 1280 mg/m3, 6 hours/day, 5 days/week, for 4 weeks. Treatment-related mortality was observed at 640 and 1280 mg/m3. The authors indicated that the adverse effects were more dependent on duration of exposure than concentration (Muijser 2001; Arts et al. 2004, all cited in EU 2008). Dermal LOAEL (rats) = 500 mg/kg-bw per day based on adverse clinical signs (including hypothermia, hypoactivity, and hind limb immobility), an increase in motor activity in males, and increased mortality in both males and females exposed to furfural by applying the chemical to the clipped skin of rats (Crl:Wistar, 10 per sex per dose) at 0, 100, 250, 500, or 1000 mg/kg-bw per day, 6 hours/day, 5 days/week, for 28 days. No dermal effects were observed in exposed rats (cited in US EPA 2010). Oral LOAEL(rats) = 240 mg/kg-bw per day based on increased mortality and laboured breathing in rats exposed by gavage at 0, 15, 30, 60, 120, or 240 mg/kg-bw, 5 days per week, for 12 doses over 16 days (Irwin 1990). Oral LOAEL (mice) = 400 mg/kg-bw per day based on the death of mice exposed by gavage at 0, 25, 50, 100, 200, or 400 mg/kg-bw, 5 days per week, for 12 doses over 16 days (Irwin 1990) Oral NOAEL (rats) = 96 mg/kg-bw per day, exposed by gavage at doses of 6, 12, 24, 48, 96, or 192 mg/kg-bw per day for 28 days. No treatment related effects were observed except the increased mortality and liver-weight in females of the highest dose group; this latter observation could not be properly interpreted due to the small size of this group (only two surviving rats). (Appel 2001). Oral NOAEL (rats) = 100 mg/kg-bw per day, exposed by gavage at doses of 0, 30, 55 or 100 mg/kg per day for 28 days. No treatment related effects were observed. (Chengelis 1997).
68

Screening Assessment CAS RN 98-01-1
Endpoints Lowest effect levelsa / results Subchronic toxicity
Oral LOAEL (mice) = 75 mg/kg-bw per day based on increased relative liver weight observed in female B6C3F1 mice exposed by gavage at 0, 75, 150, 300, 600, or 1200 mg/kg-bw per day, 5 days per week, for 13 weeks. At 150 mg/kg-bw per day, centrilobular necrosis and multifocal subchronic inflammation of the liver were observed in males only, and at 300 mg/kg-bw per day, the same liver effects were observed both in males and females (Irwin 1990). Inhalation LOAEC (hamsters) = 448 mg/m3 based on effects on nasal tissue (atrophy of olfactory epithelium, accumulation of sensory cells in lamina propria, occurrence of cyst-like structures) observed in Syrian golden hamsters (18–30 per sex per dose) administered furfural by inhalation at 0, 77, 448, or 2165 mg/m3, 6 hours/day, 5 days/week, for 13 weeks (Feron et al. 1979, 1984). Oral LOEL (rats) = 11 mg/kg-bw per day based on increased incidence of minimal to mild cytoplastic vacuolization of hepatocytes in Fisher 344 rats exposed by gavage at 0, 11, 22, 45, 90, or 180 mg/kg-bw per day, 5 days a week, for 13 weeks. This was a range-finding study to determine the doses to be used in a 2-year carcinogenicity study with limited design and observations (Irwin 1990). The U.S. Environmental Protection Agency selected a LOAEL at 90 mg/kg-bw per day from this study based on significantly increased liver and kidney weights and cytoplastic vacuolization of hepatocytes in exposed male rats (US EPA 2010). Oral LOAEL (rats) = 82 mg/kg-bw per day based on minor liver changes (5/10, mainly in the perilobular region, including cells with less coarse cytoplasm and increased clumping of eosinophils) and slight blood effects (increased corpuscular volume or mean corpuscular haemoglobin) in males. Fischer 344 rats (10/sex/dose) were administered microencapsulated furfural via the diet at 0, 26, 53, 82, or 160 mg/kg-bw per day for the males; and 0, 28, 57, 86, or 170 mg/kg-bw per day for the females (nominal doses were 0, 30, 60, 90, or 180 mg/kg-bw per day for both sexes), for 13 weeks. At high dose (160 mg/kg-bw per day), decreased red blood count, increased liver weight and slight microscopic changes in the liver (10/10), but no gross pathological changes were observed in the males. No liver effects, however, were observed in females (Jonker 2000b,c, cited in EU 2008). No dermal studies were identified.
Chronic toxicity/ carcinogenicity
Oral carcinogenicity in rats: F344/N rats (50 per sex per dose) were administered furfural by gavage (in corn oil) at 0, 30, or 60 mg/kg-bw per day, 5 days /week, for 103 weeks. In male rats, uncommon cholangiocarcinomas and bile duct dysplasia with fibrosis were observed at 60 mg/kg-bw per day in two animals out of 50. No evidence for carcinogenicity was observed in female rats (Irwin 1990). Non-neoplastic effects: LOAEL (rats) = 30 mg/kg-bw per day based on centrilobular necrosis observed in the liver of male F344/N rats (3/50, 9/50, and 12/50) and the increased incidences of congestions in the lungs of the females (6/50, 6/50,
69

Screening Assessment CAS RN 98-01-1
Endpoints Lowest effect levelsa / results and 23/50) administered furfural (in corn oil) by gavage at 0, 30, or 60 mg/kg-bw per day, 5 days/week, for 103 weeks (Irwin 1990). Oral carcinogenicity in mice: B6C3F mice (50 per sex per dose) were administered furfural by gavage (in corn oil) at 0, 50, 100, or 175 mg/kg-bw per day, 5 days/week, for 103 weeks. An increased incidence of hepatocellular adenomas was found in male and female mice (9/50, 13/50, 11/49, and 19/50 (P = 0.008) for males; 1/50, 3/50, 5/50, and 8/50 (P = 0.017) for females); and an increased incidence of hepatocellular carcinomas was found in male mice (7/50, 12/50, 6/49, and 21/50 [P = 0.001]). The author concluded that despite the high incidence of spontaneous liver tumours in control groups, the liver tumours in the high dose males were attributed to treatment with furfural, and chronic inflammation of the liver may have been influential in tumour production (Irwin 1990). Non-neoplastic effects: LOAEL (mice) = 100 mg/kg-bw per day based on mild liver toxicity (chronic inflammation and pigmentation) observed in B6C3F1 mice (50 per sex per dose) (in males: 0/50, 0/50, 8/49, 18/50; in females: 0/50, 0/50, 1/50, 8/50) administered furfural by gavage at 0, 50, 100, or 175 mg/kg-bw per day, 5 days/week, for 103 weeks (Irwin 1990). Inhalation carcinogenicity in hamsters: Syrian golden hamsters (18–30 per sex per dose) were administered furfural vapour by inhalation at 970 or 1550 mg/m3, 7 hours/day, 5 days/week, for 12 months followed by 29 weeks without further exposure. No evidence of carcinogenicity to the respiratory tract was observed (Feron and Kruysse 1978). Co-carcinigenicity inhalation studies: In the same study as described above (Feron and Kruysse 1978), separate groups were intratracheally instilled with 0.35 or 0.70 mg benzo(a)pyrene (B(a)P) (in 0.2 mL 0.9% NaCl) weekly for 12 months, or subcutaneous injection of 0.125 μL diethyl-nitrosamine (in 0.2 mL 0.9% NaCl) every 3 weeks for 12 months while exposed to furfural at 970 or 1550 mg/m3. No evidence of enhancement of carcinogenicity to the respiratory tract was observed. In another limited co-carcinogenicity inhalation study, Syrian golden male and female hamsters (35 per sex per group) were administered an intratracheal instillation of furfural (3 mg in 0.2 mg 0.9% NaCl), with or without 1 mg B(a)P, or B(a)P alone, weekly for 36 weeks followed by recovery period up to 78 weeks. Compared with B(a)P alone, which induced respiratory tumours in 41 out of 62 hamsters, intratracheal instillations of B(a)P and furfural resulted in earlier development of metaplastic changes of the tracheaobronchial epithelium, a shorter latent period for tracheobronchiolar tumours, and a few more squamous cell carcinomas at bronchiolar sites (males and females combined: 3 per 61 versus 0 per 62 B(a)P controls) and at lung sites (males: 2 per 32 versus 1 per 32 B(a)P controls). These results suggest a co-carcinogenic effect of furfural on the
70
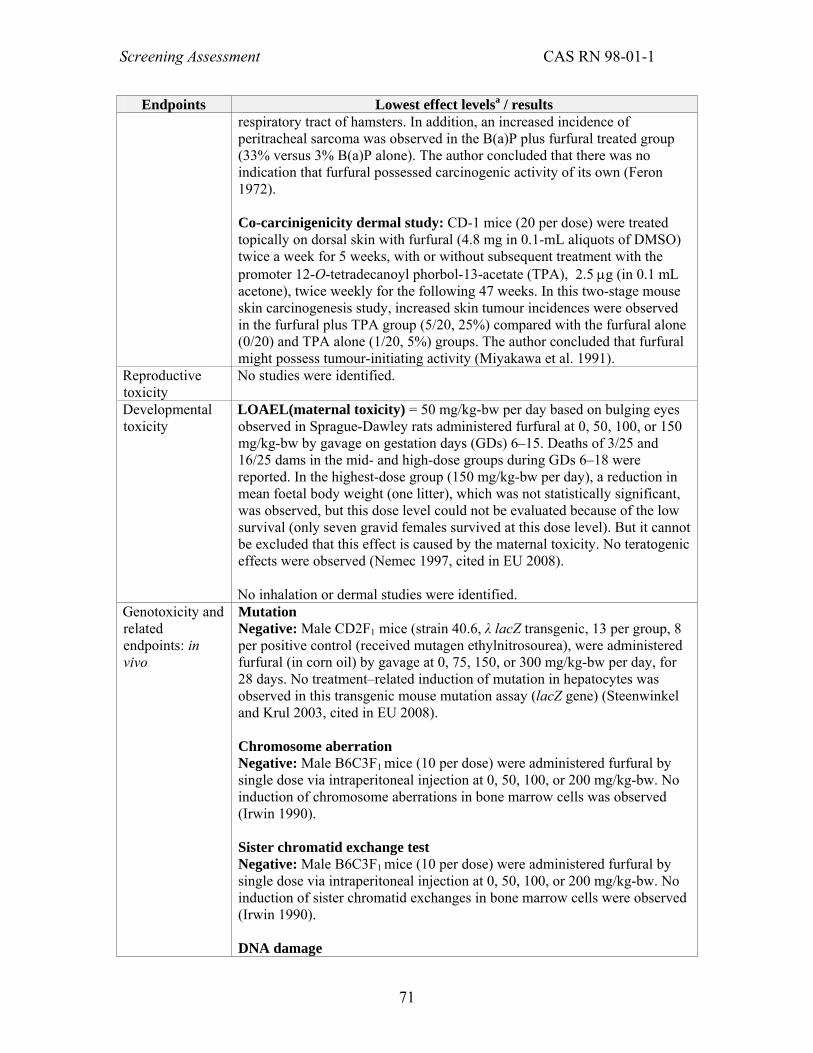
Screening Assessment CAS RN 98-01-1
Endpoints Lowest effect levelsa / results respiratory tract of hamsters. In addition, an increased incidence of peritracheal sarcoma was observed in the B(a)P plus furfural treated group (33% versus 3% B(a)P alone). The author concluded that there was no indication that furfural possessed carcinogenic activity of its own (Feron 1972). Co-carcinigenicity dermal study: CD-1 mice (20 per dose) were treated topically on dorsal skin with furfural (4.8 mg in 0.1-mL aliquots of DMSO) twice a week for 5 weeks, with or without subsequent treatment with the promoter 12-O-tetradecanoyl phorbol-13-acetate (TPA), 2.5 μg (in 0.1 mL acetone), twice weekly for the following 47 weeks. In this two-stage mouse skin carcinogenesis study, increased skin tumour incidences were observed in the furfural plus TPA group (5/20, 25%) compared with the furfural alone (0/20) and TPA alone (1/20, 5%) groups. The author concluded that furfural might possess tumour-initiating activity (Miyakawa et al. 1991).
Reproductive toxicity
No studies were identified.
Developmental toxicity
LOAEL(maternal toxicity) = 50 mg/kg-bw per day based on bulging eyes observed in Sprague-Dawley rats administered furfural at 0, 50, 100, or 150 mg/kg-bw by gavage on gestation days (GDs) 6–15. Deaths of 3/25 and 16/25 dams in the mid- and high-dose groups during GDs 6–18 were reported. In the highest-dose group (150 mg/kg-bw per day), a reduction in mean foetal body weight (one litter), which was not statistically significant, was observed, but this dose level could not be evaluated because of the low survival (only seven gravid females survived at this dose level). But it cannot be excluded that this effect is caused by the maternal toxicity. No teratogenic effects were observed (Nemec 1997, cited in EU 2008). No inhalation or dermal studies were identified.
Genotoxicity and related endpoints: in vivo
Mutation Negative: Male CD2F1 mice (strain 40.6, λ lacZ transgenic, 13 per group, 8 per positive control (received mutagen ethylnitrosourea), were administered furfural (in corn oil) by gavage at 0, 75, 150, or 300 mg/kg-bw per day, for 28 days. No treatment–related induction of mutation in hepatocytes was observed in this transgenic mouse mutation assay (lacZ gene) (Steenwinkel and Krul 2003, cited in EU 2008). Chromosome aberration Negative: Male B6C3F1 mice (10 per dose) were administered furfural by single dose via intraperitoneal injection at 0, 50, 100, or 200 mg/kg-bw. No induction of chromosome aberrations in bone marrow cells was observed (Irwin 1990). Sister chromatid exchange test Negative: Male B6C3F1 mice (10 per dose) were administered furfural by single dose via intraperitoneal injection at 0, 50, 100, or 200 mg/kg-bw. No induction of sister chromatid exchanges in bone marrow cells were observed (Irwin 1990). DNA damage
71

Screening Assessment CAS RN 98-01-1
Endpoints Lowest effect levelsa / results Negative: B6C3F1 mice were administered furfural by gavage (single dose) at 0, 50, 175, or 320 mg/kg-bw. No induction of unscheduled DNA synthesis in hepatocytes was observed (Lake et al. 2001). Negative: Male F344 rats were administered furfural by gavage (single dose) at 0, 5, 16.7, or 50 mg/kg-bw. No induction of unscheduled DNA synthesis in hepatocytes was observed (Lake et al. 2001). Chromosome loss test Equivocal: Adult male Drosophila melanogaster were fed or injected with furfural at 0, 3750, and 5000 ppm, then mated with repair-deficient or repair-proficient females. Complete loss and partial loss of X or Y chromosomes were observed in male germ cells after mating with repair-deficient females, but negative results were found in male germ cells after mating with repair-proficient females (Rodriguez-Arnaiz et al. 1992). Wing spot test Positive: Drosophila melanogaster were administered furfural by inhalation at 0, 3750, 5000, or 7500 ppm. Significant increases in small single spots and total spots were observed in somatic cells of treated Drosophila in a dose-dependent manner at all doses, which was an indication of induction of mutation (Rodriguez-Arnaiz et al. 1992). Sex-linked recessive lethal test Equivocal: Drosophila melanogaster were administered furfural by injection with a single dose at 0 or 100 ppm, or by feeding at 0 or 1000 ppm for 3 days. Induction of mutations was observed in the injection group, but not in the feeding group, and it did not induce reciprocal translocation in the flies (Woodruff et al. 1985).
Genotoxicity and related endpoints: in vitro
Mutagenicity in bacteria Equivocal in Salmonella typhimurium TA100, with or without metabolic activation (Zdzienicka et al.1978; Loquet et al.1981; US NTP 1990; Dillon et al. 1992, all cited in EU 2008). Negative in Salmonella typhimurium TA98, TA102, TA104, TA1535, or TA1537 with or without metabolic activation (Zdzienicka et al.1978; Loquet et al., 1981; US NTP 1990; Dillon et al. 1992, all cited in EU 2008). Mutagenicity in mammalian cells Positive in mouse lymphoma L5178Ycells, tk locus, without metabolic activation (McGregor et al. 1988). Chromosomal aberration Positive in Chinese hamster V79 cells without metabolic activation (Nishi et al. 1989, cited in EU 2008) Positive in Chinese hamster ovary cells with and without metabolic activation (Stich et al. 1981; Galloway et al. 1985; Gudi et al. 1996, all cited in EU 2008).
72

Screening Assessment CAS RN 98-01-1
Endpoints Lowest effect levelsa / results Unscheduled DNA synthesis Negative in human liver tissue or in rat nasal epithelial tissue (Wilmer et al. 1987; Lake et al. 2001). Sister chromatid exchange Positive in human lymphocytes without metabolic activation (Gomez-Arroyo and Souza 1985). Positive in Chinese hamster ovary cells with or without metabolic activation (Galloway et al. 1985). Alkaline unwinding assay Positive: An increased number of strand breaks in duplex calf thymus DNA were observed (Hadi et al. 1989). Other: DNA synthesis-inhibition test Positive: Inhibition of DNA synthesis was observed in a test using Hela S3 cells treated with furfural (Heil and Reifferscheid 1992). Activation of oncogenes Positive: A high frequency of activated oncogenes was detected in B6C3F1 mouse liver treated with furfural (Reynolds et al. 1987).
73
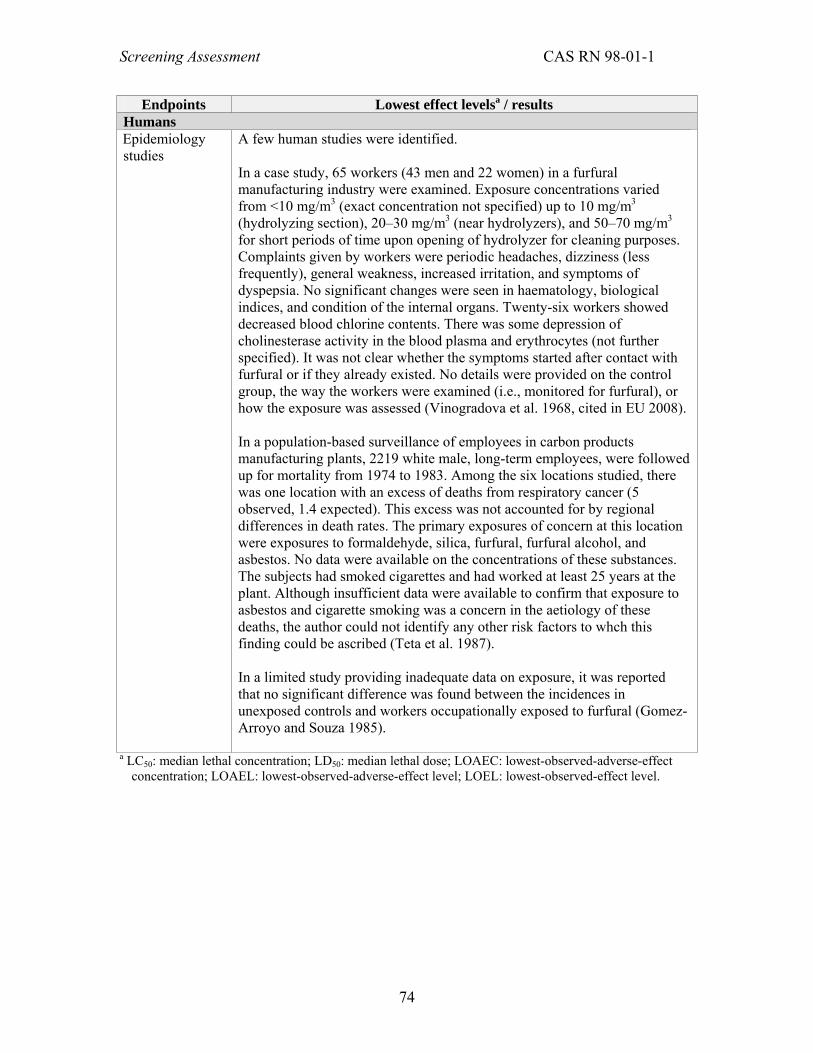
Screening Assessment CAS RN 98-01-1
74
Endpoints Lowest effect levelsa / results Humans Epidemiology studies
A few human studies were identified. In a case study, 65 workers (43 men and 22 women) in a furfural manufacturing industry were examined. Exposure concentrations varied from <10 mg/m3 (exact concentration not specified) up to 10 mg/m3 (hydrolyzing section), 20–30 mg/m3 (near hydrolyzers), and 50–70 mg/m3 for short periods of time upon opening of hydrolyzer for cleaning purposes. Complaints given by workers were periodic headaches, dizziness (less frequently), general weakness, increased irritation, and symptoms of dyspepsia. No significant changes were seen in haematology, biological indices, and condition of the internal organs. Twenty-six workers showed decreased blood chlorine contents. There was some depression of cholinesterase activity in the blood plasma and erythrocytes (not further specified). It was not clear whether the symptoms started after contact with furfural or if they already existed. No details were provided on the control group, the way the workers were examined (i.e., monitored for furfural), or how the exposure was assessed (Vinogradova et al. 1968, cited in EU 2008). In a population-based surveillance of employees in carbon products manufacturing plants, 2219 white male, long-term employees, were followed up for mortality from 1974 to 1983. Among the six locations studied, there was one location with an excess of deaths from respiratory cancer (5 observed, 1.4 expected). This excess was not accounted for by regional differences in death rates. The primary exposures of concern at this location were exposures to formaldehyde, silica, furfural, furfural alcohol, and asbestos. No data were available on the concentrations of these substances. The subjects had smoked cigarettes and had worked at least 25 years at the plant. Although insufficient data were available to confirm that exposure to asbestos and cigarette smoking was a concern in the aetiology of these deaths, the author could not identify any other risk factors to whch this finding could be ascribed (Teta et al. 1987). In a limited study providing inadequate data on exposure, it was reported that no significant difference was found between the incidences in unexposed controls and workers occupationally exposed to furfural (Gomez-Arroyo and Souza 1985).
a LC50: median lethal concentration; LD50: median lethal dose; LOAEC: lowest-observed-adverse-effect concentration; LOAEL: lowest-observed-adverse-effect level; LOEL: lowest-observed-effect level.


![27849394 Canada and Environment[1]](https://img.dokumen.tips/doc/110x75/577d38d41a28ab3a6b9892da/27849394-canada-and-environment1.jpg)