Embed Size (px)
Citation preview

Environment and the Productive WorkplaceEnvironment and the Productive Workplace
Professor Derek Clements-CroomeSchool of Construction Management and Engineering
The University of Reading

Embodied, Operational Energy and the Opportunity for Productivity Gains in an OfficeEmbodied, Operational Energy and the Opportunity for Productivity Gains in an Office
Lovins A., 2000, Natural Capitalism: The Next Industrial Revolution, March, Rocky Mountain Institute, Snowmass, Colorado.
Embodied Operational
Spend more SaveMuchmore P
roductivity
Ener
gy G
J/m
2
1-2 Design
5 Construction 50 Operation 200 Occupation
Life
time
alte
ratio
ns
Ligh
ts&
sm
all
pow
er
Hea
ting
&
vent
ilatio
n
30
25
20
15
10
5
0

Costs of OrganisationsCosts of Organisations
Construction2% Maintenance and operations
6%
Salary costs over buildings life cycle92%
A well designed office can increase productivity by as much as 15% of a
worker’s annual salary
Source: Using Office Design to increase ProductivityBuffalo Organization for Social and Technical Innovation
Michael Brill, President (1987)

The relationship between cost and performance on productivityThe relationship between cost and performance on productivity
PeoplePeopleInvestorInvestor
(high quality)(high quality)
HighlyHighlyproductiveproductive
(added value)(added value)
PoorPoorproductivityproductivity(low value)(low value)
CostCostCutterCutter
(low quality)(low quality)
Perf
orm
ance
High
Low
CostHigh Low
Source: Oseland, Bartlett, 1999
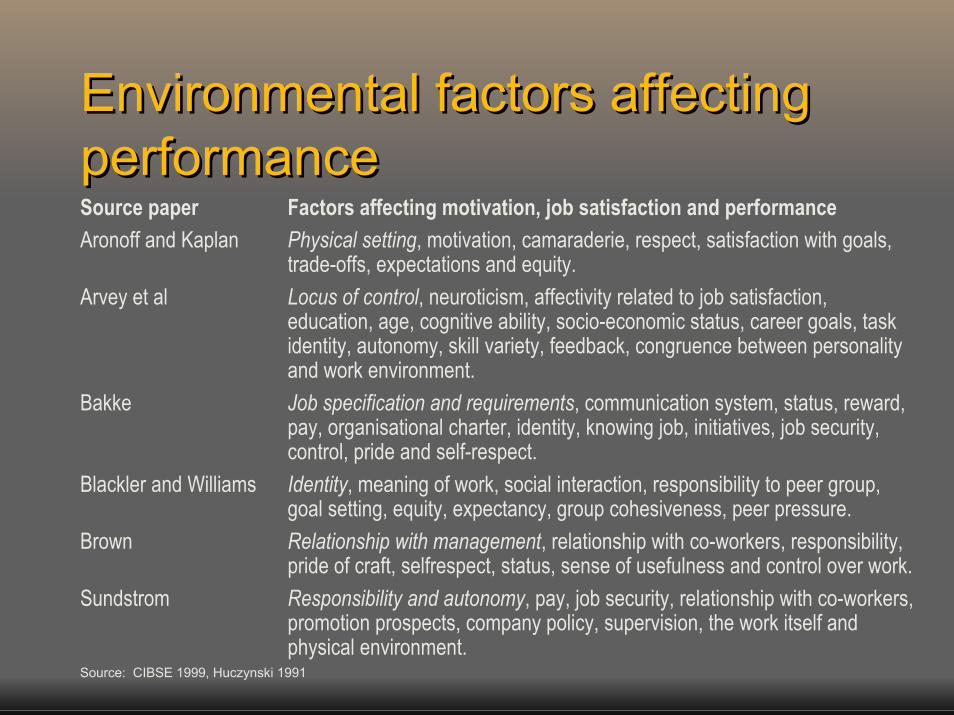
Environmental factors affecting performanceEnvironmental factors affecting performanceSource paperAronoff and Kaplan
Arvey et al
Bakke
Blackler and Williams
Brown
Sundstrom
Factors affecting motivation, job satisfaction and performancePhysical setting, motivation, camaraderie, respect, satisfaction with goals, trade-offs, expectations and equity.Locus of control, neuroticism, affectivity related to job satisfaction, education, age, cognitive ability, socio-economic status, career goals, task identity, autonomy, skill variety, feedback, congruence between personality and work environment.Job specification and requirements, communication system, status, reward, pay, organisational charter, identity, knowing job, initiatives, job security, control, pride and self-respect.Identity, meaning of work, social interaction, responsibility to peer group, goal setting, equity, expectancy, group cohesiveness, peer pressure.Relationship with management, relationship with co-workers, responsibility, pride of craft, selfrespect, status, sense of usefulness and control over work.Responsibility and autonomy, pay, job security, relationship with co-workers, promotion prospects, company policy, supervision, the work itself and physical environment.
Source: CIBSE 1999, Huczynski 1991

Achieving Maslow’s hierarchy of needs in the workplaceAchieving Maslow’s hierarchy of needs in the workplaceNeedPhysiological
Safety
Social
Esteem
Self-actualisation
Achieved byGood working conditions, attractive salary, subsidised housing, free cateringPrivate health care, pension, safe working conditions, job security.Good relationships, team spirit, company sports, office parties, informal activities, open communication.Regular positive feedback, prestige job titles, write-up in company news sheets, promotion and reward.Challenging job, discretion over work activity, promotion on opportunities, encouraging creativity, autonomy and responsibility
Source: (CIBSE 1999, Huczynski 1991)

Deficiencies in these areas can rapidly fatigue office workersDeficiencies in these areas can rapidly fatigue office workers
Aural/acoustic qualityVisual illumination qualityThermal qualityAir qualityBuilding amenitiesFunctional ergonomics
Source: Public Works Canada Study (1985)
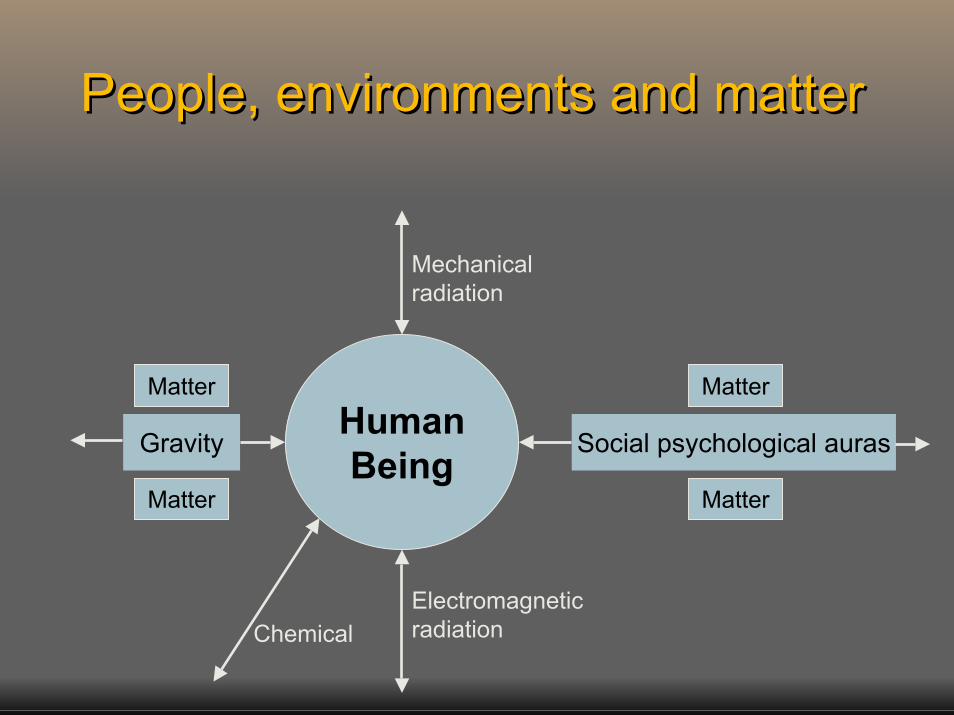
People, environments and matterPeople, environments and matter
Mechanicalradiation
Matter MatterHumanBeing
Gravity Social psychological auras
Matter Matter
ChemicalElectromagneticradiation

Effects of partial climatesEffects of partial climates
Light
Sound
Smell
Heat
Air quality
Electric climate
Partial climate InducesOrganic
Reactions
StimulatesSensorsOrgans
CreateAssociations
DescribesThe
Environment

Holistic Environmental ModelHolistic Environmental ModelSustainability
HolisticEnvironment
BuiltForm &Services
Management
PollutionErgonomics
Well-being
Interiordesign
Mission
workplacework flow
furniture
computer
indoorair quality
aesthetics
lighting spacetextures
colour
sound
electro-magnetic
noisechemical particulate
Ecologicaldesign
energy materials wasterecycling
water
Forminfrastructure
structures
utilities
intralinks
policiesresourcesstrategies
imageBusinesses
systemsprocess
planning
monitoringfinance
Workingculture
integration
creativitysocial
production
innovation
ionisationhumidity Human
Sensestemperature
Hum
an
Management

Lorsch and Abdou (1994b)Lorsch and Abdou (1994b)
Conclude that temperatures which provide optimum comfort may not necessarily give rise to maximum efficiency in terms of work output.
The difficulty here is that this may be true for relatively short periods of time, but if a person is feeling uncomfortable over a long period of time it may lead to a decrement in work performance.

The relationship between temperature and performanceThe relationship between temperature and performance
Cha
nge
in p
rodu
ctiv
ity p
erce
ntag
e
+50
+40
+30
+20
+10
0
-10
-20
-30
-40
-60
Accidents
25201510
Speed and sensitivity
of figure
Manual dexterity
Work rate
Mental performance
Temperature (ºC)
-50
ComfortZone
Source: Wyon 1986, CIBSE, 1999
30

Indoor Environment and ProductivityIndoor Environment and Productivity
Traditionally thermal comfort has been emphasised as being necessary in buildings, but is comfort compatible with health and well-being? The mind and body need to be in a state of health and well-being for work and concentration. This is a prime prerequisite for productivity. High productivity brings a sense of achievement for the individual as well as increased profits for the work organization.

Good IAQ:Occupancy density/ventilation rate:temperature
Theoretical study based on Fanger’s work
Kosenen and Tan (2003)(Finland, Singapore)
fatigueClimate chamberTanabe (2003) (Japan)
Individual control of air gives less fatigue
Climate chamber using typing tasks
Nishihara et al (2003)(Japan)
Low light levels (3 lux)can cause fatigue
Voice patternsNiskikawa et al (2003)(Japan)
good IAQlow pollutants:fresh air:temperature control: effective use of space
review Leyten and Booerstra (2003)(Holland)
Temperatures higher than240C
Self reported productivityKorhonen et al (2003)(Finland)
Wheezingshortness of breath:
high temperature andrelative humidity
Epidemiological longitudinal study using computer test
Chao et al (2003) (Taiwan, USA)
Increased space and daylight: reduce complaints
Self-reported productivityRohr and Brightman (2003) (USA)
Productivityincrease decrease
MethodResearcher

Subjective Well-beingSubjective Well-being
AwarenessSatisfaction with lifeComfort – discomfortGood body – mental health

Architecture and the sensesArchitecture and the senses
Although the five basic senses are often studies as individual systems covering visual, auditory, taste–smell, orientation and the haptic sensations, there is an interplay between the senses.

In Buddhism there are nine levels of consciousness (Allwright, 1998)
In Buddhism there are nine levels of consciousness (Allwright, 1998)
The five senses felt by the eyes, ears, nose mouth and skinThe integration of senses using reason and logicRational thought expressed via self awareness and intuitionThe stores of experience in the long and short term memoriesPure consciousness within the inner self; this also involves emotion.
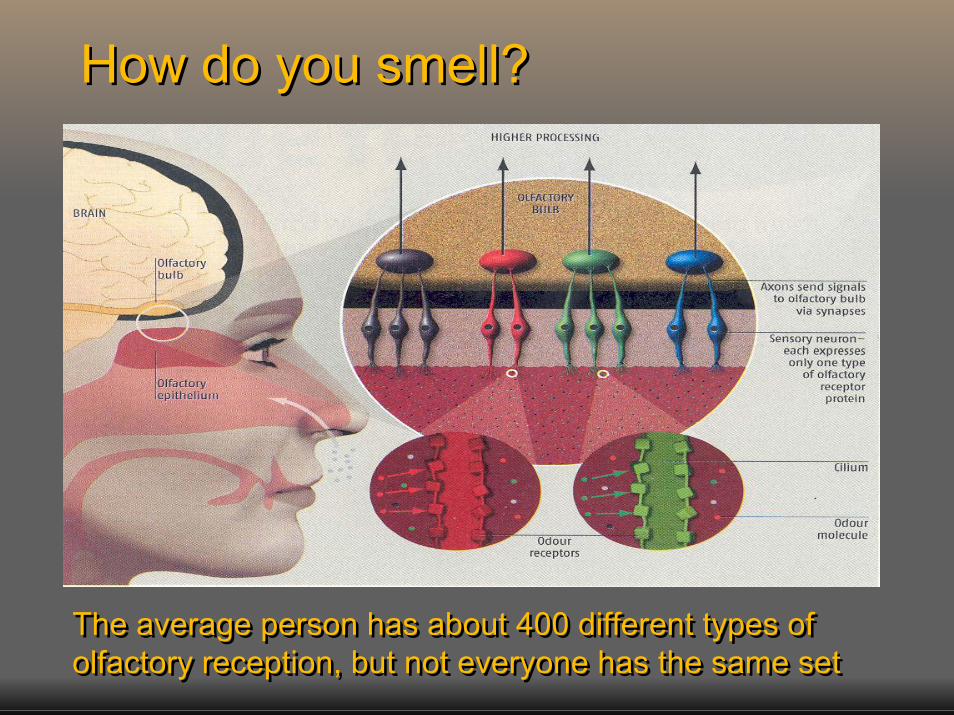
How do you smell?How do you smell?
The average person has about 400 different types of olfactory reception, but not everyone has the same setThe average person has about 400 different types of olfactory reception, but not everyone has the same set

Atrium fragrance control system for Kajima building in TokyoAtrium fragrance control system for Kajima building in Tokyo
T H
T
TT
H
AirHandlingUnit
Spray Fan
Atrium
EssenceContainer
Thermostat
Humidistat
Regulating Valve
Spray Nozzle
Ambient Air
Heat Exchanger
Control Unit

Atrium fragrance and control scenario for Kajima building in TokyoAtrium fragrance and control scenario for Kajima building in Tokyo
COME LUNCH BREAK
TO OFFICE WORK WORK LEAVE THE OFFICESCHEDULE
FRAGRANCE & IMAGE OVER-TIME WORK
No 1 WOOD
No 2 FLORAL
No 3 CITRUS
SPLAY PATTERN
Health Affects ProductivityHealth Affects Productivity
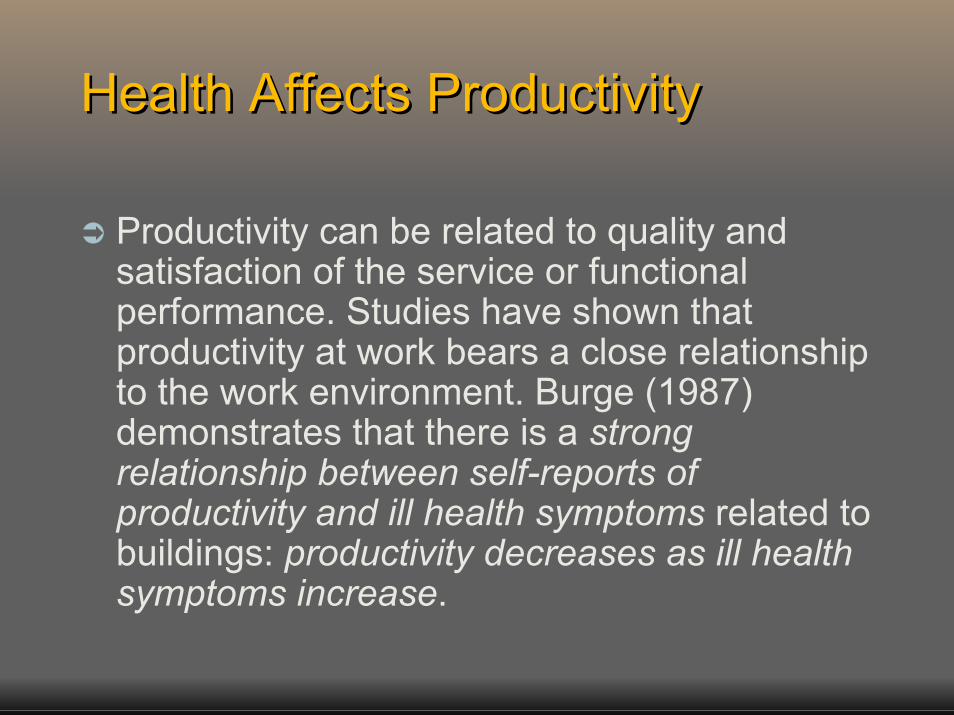
Productivity can be related to quality and satisfaction of the service or functional performance. Studies have shown that productivity at work bears a close relationship to the work environment. Burge (1987) demonstrates that there is a strong relationship between self-reports of productivity and ill health symptoms related to buildings: productivity decreases as ill health symptoms increase.
Burge (1987)Burge (1987)
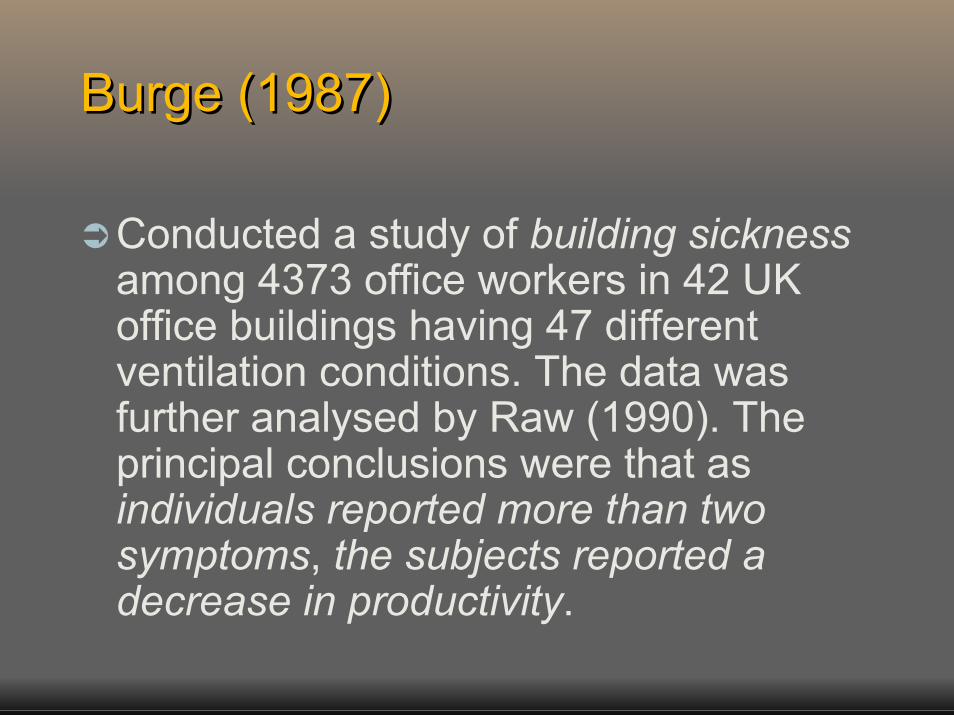
Conducted a study of building sicknessamong 4373 office workers in 42 UK office buildings having 47 different ventilation conditions. The data was further analysed by Raw (1990). The principal conclusions were that as individuals reported more than two symptoms, the subjects reported a decrease in productivity.

Buildings by health category(Dorgan, 1994)Buildings by health category(Dorgan, 1994)
Perc
enta
ge o
f tot
al b
uild
ing
Problem unknown
Problem known
50
40
30
20
10
01. Healthy 2. Generally
Healthy3. Unhealthy 4. Unhealthy 5. SBS & BRI

Estimated potential gains from improvements in indoor environments (Fisk, 1999)
Estimated potential gains from improvements in indoor environments (Fisk, 1999)
Source ofProductivity Gain
Reduced respiratorydisease
Reduced allergies and asthma
Reduced sick buildingsyndrome symptoms
Improved worker performance from changes in thermal environment and lighting
Potential AnnualHealth Benefits
16 to 37 million avoidedcases of common cold or influenza
10% to 30% decrease in symptoms within 53million allergy sufferersand 16 million asthmatics
20% to 50% reductionin SBS health symptoms experienced frequentlyat work by approximately15 million workers
Not applicable
Potential U.S. Annual Savings or Productivity Gain (1996 $U.S.)
$6 - $14 billion
$2 - $4 billion
$15 - $38 billion
$20 - $200 billion

Relationship between self-reports of productivity and levels of control over temperature, ventilation, lighting and overall control
Relationship between self-reports of productivity and levels of control over temperature, ventilation, lighting and overall control
Temperature
Ventilation
LightingOverall Control
Degree of Control (low = 1, high = 7)7410
1.0
0.8
0.6
0.4
0.2
0.0
-0.2
Mor
e or
less
pro
duct
ive
than
ave
rage

Assessment of Productivity (Ilgen, 1991)Assessment of Productivity (Ilgen, 1991)
states that the methods of performance measurement can be classified into three categories:
PhysiologicalObjectiveSubjective

Indicators of increased productivityIndicators of increased productivity
• Performing tasks more accurately• Performing faster without loss of accuracy• Capability to perform longer without tiring• Learning more effectively• Being more creative• Sustaining stress more effectively• Working together more harmoniously• Being more able to cope with unforeseen circumstances• Feeling healthier and so spending more time at work• Accepting more responsibility• Responding more positively to requests
Source: NEMA, 1989

Average downtime attributedto a range of factorsAverage downtime attributedto a range of factors
Repeating work due to glare
Walking to pick up consumables
Repeating work due to poor IT
Waiting for archive material
Extra work due to software incompatibility
Repeating due to feeling too warm
Walking to pick up documents
Searching for paperwork
Walking/waiting at fax
Repeating work due to interruptions
0 .5 1 1.5 2 2.5 3
Mean downtime (percentage of work time)
Source: Oseland, Bartlett, 1998

Productivity MeasuresProductivity MeasuresAt an ASHRAE Workshop on Indoor Quality held in Baltimore in September 1992 the following productivity measures were recommended as being significant.
Absence from work, or work station.Health costs including sick leave, accidents and injuries.Interruptions to work.Controlled independent judgements of work quality.Self assessments of productivity.Speed and accuracy of work.Output from pre-existing work groups.Cost for the product or service.Exchanging output in response to graded reward.Volunteer overtime.Cycle time from initiation to completion of process.Multiple measures at all organisational levels.Visual measures of performance, health and well-being at work.Development of measures and patterns of change over time.

Measures of ProductivityMeasures of Productivity
Absolute Methods
Direct
Indirect
Comparative Methods
Objective measurese.g. work output quality and speed
Physiological measurese.g. brain rhythms
Rating scales, questionnaires,semi structured interviews
Measurement of ProductivityMeasurement of Productivity
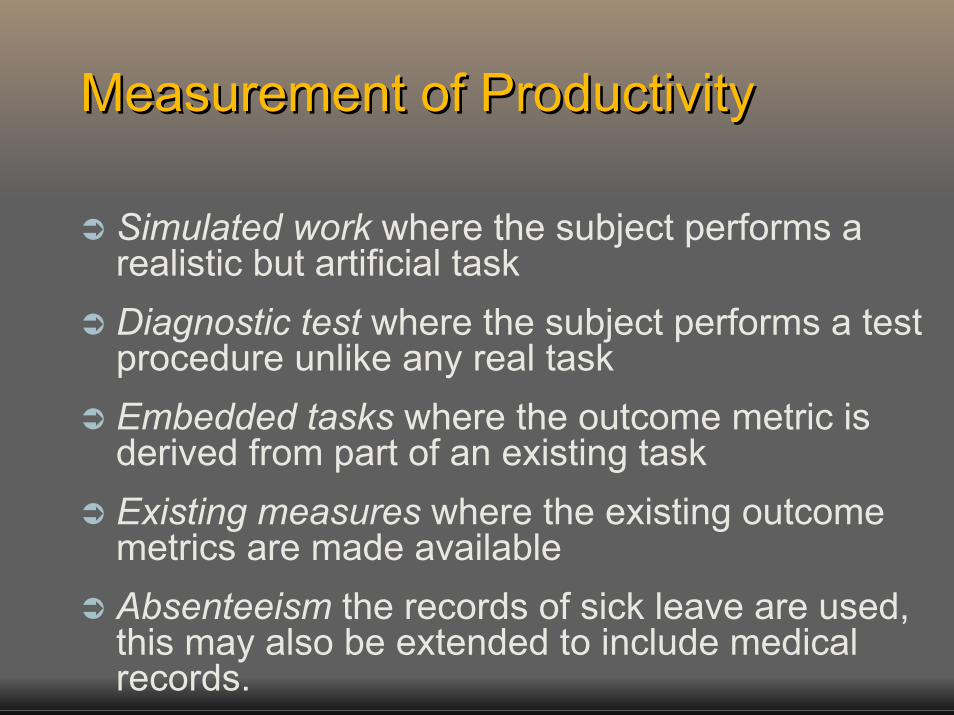
Simulated work where the subject performs a realistic but artificial taskDiagnostic test where the subject performs a test procedure unlike any real taskEmbedded tasks where the outcome metric is derived from part of an existing taskExisting measures where the existing outcome metrics are made availableAbsenteeism the records of sick leave are used, this may also be extended to include medical records.

Physiological MeasuresPhysiological Measures
Brain waves
Muscle tension
Eye pupil dilation
Speech patterns
Cerebral blood oxygenation
QuestionnaireQuestionnaire
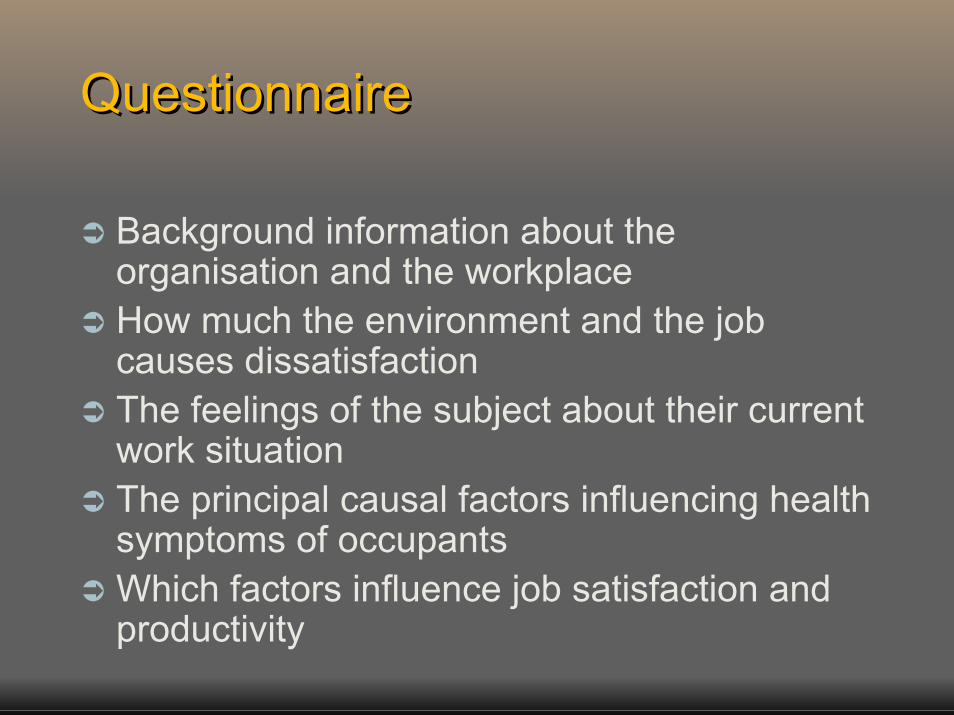
Background information about the organisation and the workplaceHow much the environment and the job causes dissatisfactionThe feelings of the subject about their current work situationThe principal causal factors influencing health symptoms of occupantsWhich factors influence job satisfaction and productivity

The Analytic Hierarchy ProcessThe Analytic Hierarchy Process
Main Factors WhichInfluence ProductivityMain Factors Which
Influence ProductivityLevel 1
Well-BeingWell-Being MotivationMotivation JobSatisfaction
JobSatisfaction
TechnicalCompetence
TechnicalCompetence
Ability toPerform
Ability toPerform
Level 2 -Human Factorsof the Individual
Level 3 -Systems FactorsandPersonalCircum-stanceswhichinfluenceHuman Factors
Level 4
Level 5
OccupationOccupationOrganisationOrganisation PersonalCircumstances
PersonalCircumstances
Facilities &Services
Facilities &Services
OutdoorEnvironment
OutdoorEnvironment
Environmental factors which influenceSystem Factors Temperature and Humidity,
Ventilation, Lighting, Crowding
IndoorEnvironment
IndoorEnvironment
Health factors which influence System FactorsRespiratory, Skin, Nervous,Nasal and Related Problems
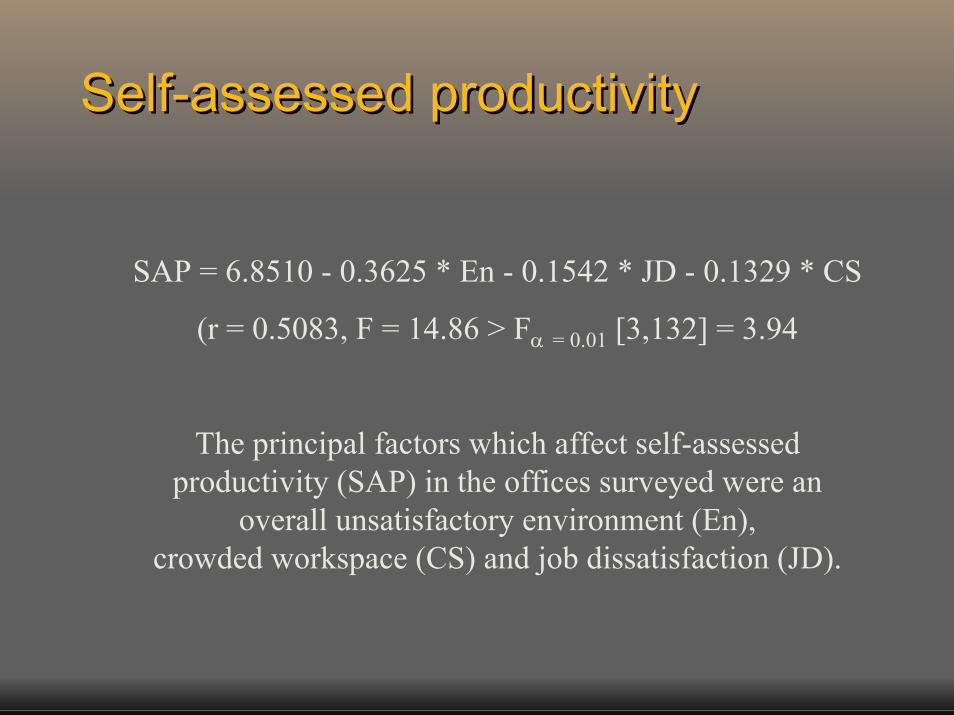
Self-assessed productivitySelf-assessed productivity
SAP = 6.8510 - 0.3625 * En - 0.1542 * JD - 0.1329 * CS
(r = 0.5083, F = 14.86 > Fα = 0.01 [3,132] = 3.94
The principal factors which affect self-assessedproductivity (SAP) in the offices surveyed were an
overall unsatisfactory environment (En),crowded workspace (CS) and job dissatisfaction (JD).

PRODUCTIVITY
Social Organisation
Personal Environment
Managerial roleOrganisational structureRelationship with others
Conceptual basis for impact of environment on productivityConceptual basis for impact of environment on productivity
Indoor climateWorkplaceIAQ
Career AchievementHome/Work interfaceIntrinsic to job

Measures for workplace evaluationMeasures for workplace evaluation
Expression and identity issuesSustainability and corporate social responsibilityEfficiency and effectiveness
EFFICIENCY
EFFECTIVENESS
EXPESSION
1980s 1990s 2000+
DEGW 2004
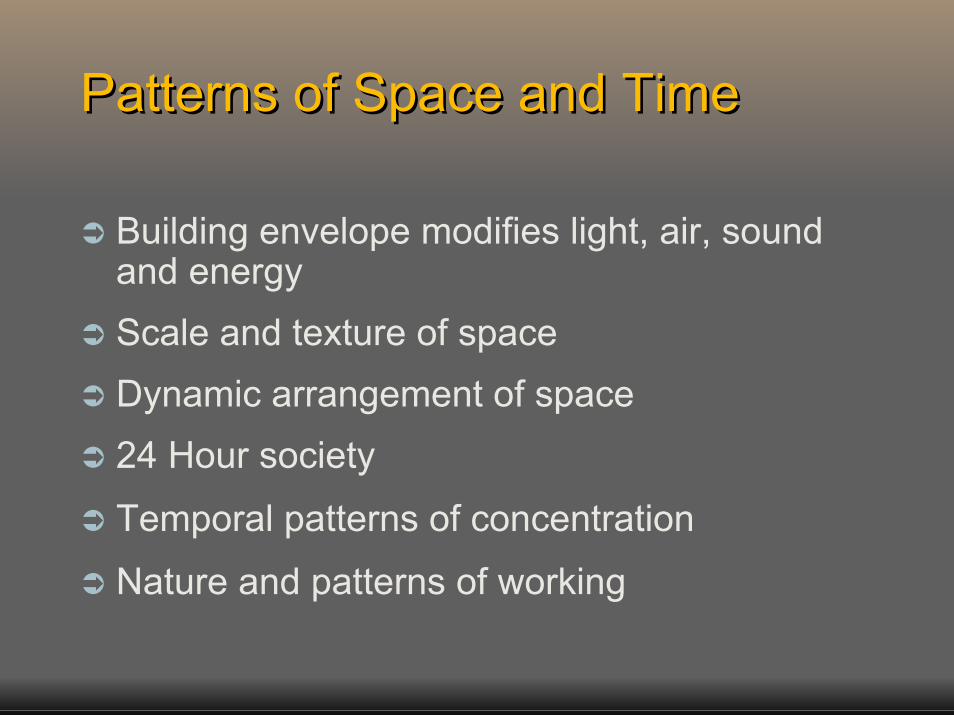
Patterns of Space and TimePatterns of Space and Time
Building envelope modifies light, air, sound and energyScale and texture of spaceDynamic arrangement of space24 Hour society
Temporal patterns of concentration
Nature and patterns of working

Examples of human intelligence and building properties (Lehto, 2002)
Examples of human intelligence and building properties (Lehto, 2002)
own space(concentration peace)
Intelligence
Logical-mathematical
cabling integratedcontrol
buildingautomationsilence
Inter-personal
silence
buildingautomation
userinterface
backgroundmusic
Musical
interiordesign
ergonomicsBodily-kinaesthetic
empty space
Tradition:Energy centres
Inter-personal
signs
sensoring
speechrecognition Linguistic
beauty
measures forspatial instinct
Visual-spatial
Functionalcentres

IB intervention stagesIB intervention stagesOrganisational and technology change
High
Change the technology
Change the occupants
Change the technology
Change the occupants
HighLow
Organisational demand on the building
Technology level
DEGW 2004

IB Technologies scoring matrixIB Technologies scoring matrix
Showcase IB
Advanced technologies not linked to organisational requirements
Business Value IB(low tech)
Good match between organisational demand and technology provision
Business Value IB(high tech)
Good match between organisational demand and technology provision
Underachieving IB
BuildingConstraining the organisation
0 10% 20% 30% 40% 50% 60% 70% 80% 90%100%
100%
90%
80%
70%
60%
50%
40%
30%
20%
10%
0
HighNon routine workWide range of settingsGroup work
Low basic systemslimited integration;building management focus
Technology Level
Highadvanced systemsextensive integration;building management focus
DEGW 2004
Organisational Demands on the building
LowRoutine workIndividual workLimited work settings

IB Intervention StagesIB Intervention StagesSite and shell issues
Redevelop of the building
Change the use of the site
Improve the infrastructure
High
Siteaccessibility
Low
Shell adaptability High
DEGW 2004

Building Quality Assessment Category Descriptors (Williams 2000)
Building Quality Assessment Category Descriptors (Williams 2000)
Presentation: Appearance of the building & impression created Space Functionality: Factors that detemline operation of spaces Access & Circulation: Matters Concerned with access's of people & goods Amenities: Facilities or spaces for people Business Services: Electrical services & in formation technology.Working Environment: Working conditions of people in their work spaces Health & Safety: Mandatory & other health or safety requirements Structural Considerations: Building structure, construction & condition Building Operations: Short & long term management of the building

Overall BQA StructureOverall BQA Structure
Scoring PlateauxFactors (137)
Sections
Categories (9)
Scores Weightings
Scores Weightings
Scores Weightings
BQAScore

Benchmarking Quality of Buildings and Educational Achievements – Primary Schools Study in Kent
Benchmarking Quality of Buildings and Educational Achievements – Primary Schools Study in Kent
HighHighB
QA
Sco
reB
QA
Sco
re
LowLow HighHighEducational AchievementEducational Achievement

Clients Views of Their BuildingsClients Views of Their Buildings
Containers built for a cheap price with no respect for the impact of the built environment on performancePrestige Symbols in which the exterior is the key status factor than internal working conditions.Vehicles for Industrial Relations in which a healthy work environment is viewed as important for the workforceInstruments of Efficiency in which work investment expenditure is related to the rate of return of money not staff welfareOperational Force for which the function and the symbolic roles are reflected in the management and design.

Comparison of energy and staff costs for North American officesComparison of energy and staff costs for North American offices
5–4.332-3.752.25Equivalent productivity costs (min/day per person)
1.20.91.00.5-0.90.5Energy as proportion of productivity costs (%)
87118100114-218200Ration of staff to energy costs
1.5221-21.5Energy costs ($/ft2/year)
2.91262-10–HVAC running costs ($/ft2/year)
130237200218300Staff costs ($/ft2/year)
BOMA (1988)
Woods (1989)
EPA (1989)
Abdou & Lorsch (1994)
Rosenfeld (1989)Costs

Relationship between the loss of productivity, PPD and the PMVRelationship between the loss of productivity, PPD and the PMV
-1.5
80
60
40
20
0
Predicted Mean Vote (PMV)
Percentage of dissatisfied (PPD)
Loss
of P
rodu
ctiv
ity (p
erce
ntag
e)
-1 -0.5 10 1.50.5 2-20
Loss of Productivity and PPDas a function of the PMV
Source: Roelofsen, 2001
PPD
25
20
15
10
5

Loss of productivity per employeeStandard Office South FacingLoss of productivity per employeeStandard Office South Facing
9
44
6
59
15
71
10
61
24
79
49
103
0
20
40
60
80
100
120
7.2 4.4 3.7 4.6 3.4 2.8
Cooling (Comfort categories in accordance with NPR-CR 1752)
No Mechanical Cooling
Ventilation Rate [m3/(m3.h)]
Loss
of p
rodu
ctiv
ity[H
ours
/Yea
r]
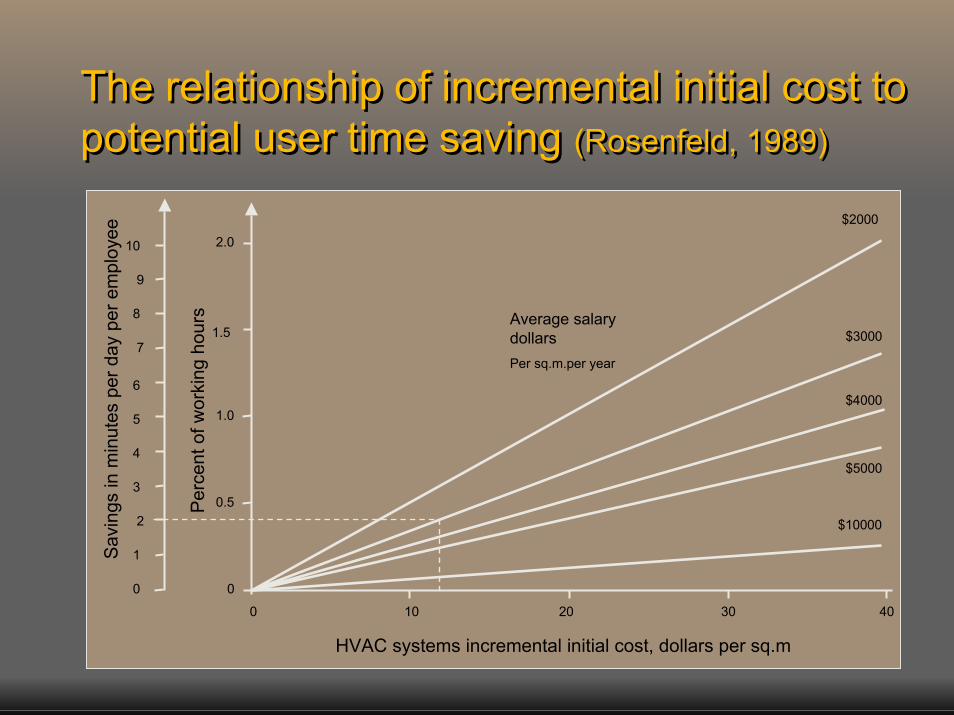
The relationship of incremental initial cost to potential user time saving (Rosenfeld, 1989)
The relationship of incremental initial cost to potential user time saving (Rosenfeld, 1989)
Average salary dollarsPer sq.m.per year
$2000
$3000
$4000
$5000
$10000
0 10 20 30 40
00
0.5
1.0
1.5
2.0
1
2
3
4
5
6
7
8
9
10
HVAC systems incremental initial cost, dollars per sq.m
Per
cent
of w
orki
ng h
ours
Sav
ings
in m
inut
es p
er d
ay p
er e
mpl
oyee

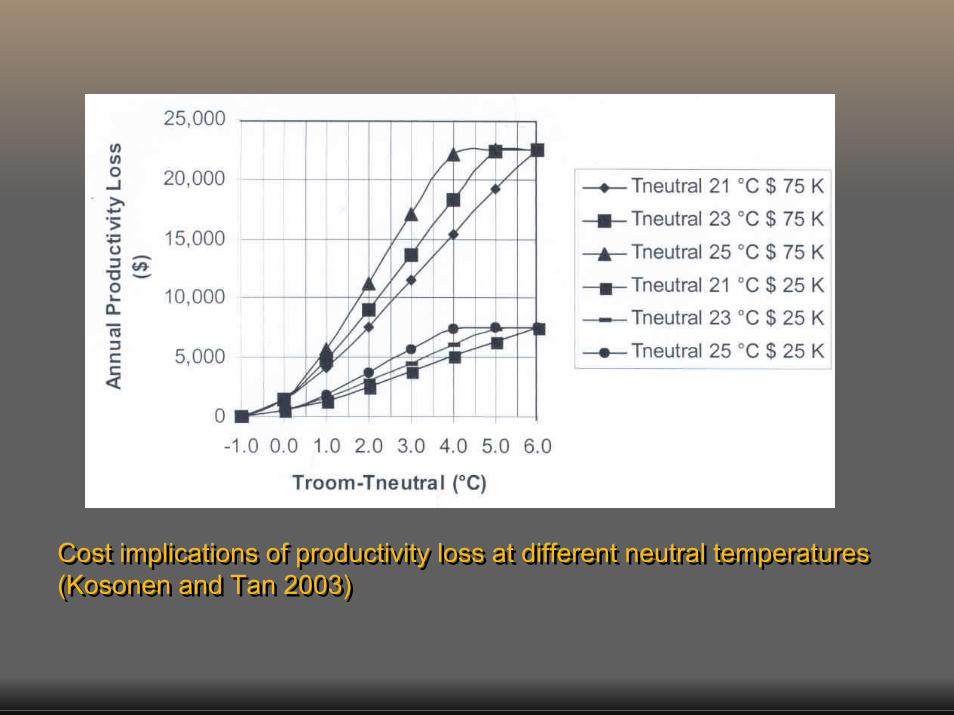
Cost implications of productivity loss at different neutral temperatures (Kosonen and Tan 2003)Cost implications of productivity loss at different neutral temperatures (Kosonen and Tan 2003)

Summary of IB break-even periodsSummary of IB break-even periods
Business Benefit
Standard IB
Advanced IB
Efficiency + 10%Productivity gain
Efficiency + 8%Productivity gain
Efficiency + 5%Productivity gain
Efficiency + 3%Productivity gain
Efficiency only
0 5 10 15 20 25 30 35 40 45 50
IB Payback period (years)
Source: IB Asia

Sustainability Strategy ModelSustainability Strategy ModelValue of sustainability
The make-up of the work force
Achievement of appropriate competences
Percentage of employees receiving appraisals
Absenteeism of our people
Reportable accidents and incident rate
Grievance raised of an ethical nature (internal and external)
Corporate community investment
Percentage of sustainability targets achieved
Positive/negative media comment on environmental and community
activities
Percentage volume of materials from sustainable sources
Percentage of suppliers with ISO 14001
Customers satisfaction levels
Customer retention
How we willmeasure performance
Key Performanceindicators
The diversity of our people
Satisfaction of our people
Health and safety performance
Human rights
Corporate approach to social responsibility
Energy costs
Costs of waste
Environmental performance
Customer satisfaction
Fairer treatment of people and communities
More fulfilled people and communities
Better environment to live in
More resources for future generations
Increased business
Reduce waste
Social progress
Protection of the environment and prudent use of natural resources
Economic growth and Prosperity
How society will benefitWhat we will manage Sustainability objectives
Sustaining prosperity
Sustainingthe environment
Sustainingcommunities
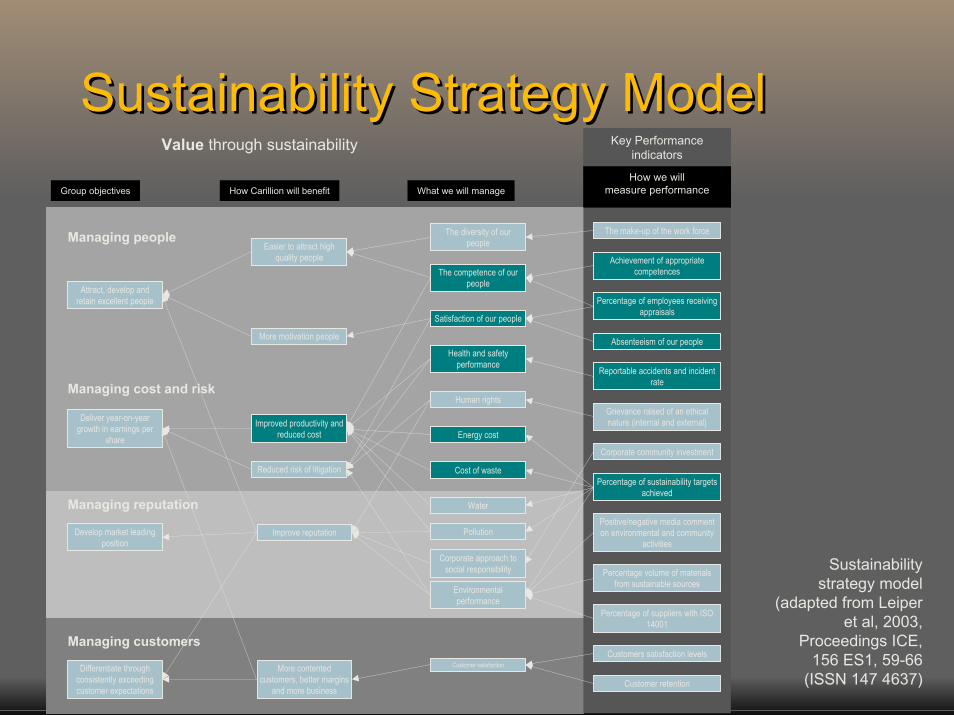
Sustainability strategy model (adapted from Leiper et al, 2003, Proceedings ICE, 156 ES1, 59-66 (ISSN 147 4637)
Sustainability Strategy ModelSustainability Strategy Model
Sustainability strategy model
(adapted from Leiperet al, 2003,
Proceedings ICE, 156 ES1, 59-66
(ISSN 147 4637)
The make-up of the work force
Achievement of appropriate competences
Percentage of employees receiving appraisals
Absenteeism of our people
Reportable accidents and incident rate
Grievance raised of an ethical nature (internal and external)
Corporate community investment
Percentage of sustainability targets achieved
Positive/negative media comment on environmental and community
activities
Percentage volume of materials from sustainable sources
Percentage of suppliers with ISO 14001
Customers satisfaction levels
Customer retention
The diversity of our people
The competence of our people
Satisfaction of our people
Health and safety performance
Human rights
Energy cost
Cost of waste
Water
Pollution
Corporate approach to social responsibility
Environmental performance
Customer satisfaction
Easier to attract high quality people
More motivation people
Improved productivity and reduced cost
Reduced risk of litigation
Improve reputation
More contented customers, better margins
and more business
Attract, develop andretain excellent people
Deliver year-on-year growth in earnings per
share
Develop market leading position
Differentiate through consistently exceeding customer expectations
Managing people
Managing cost and risk
Managing reputation
Managing customers
Group objectives What we will manageHow Carillion will benefit
Key Performanceindicators
Value through sustainability
How we willmeasure performance

Sustainability Strategy ModelSustainability Strategy ModelValue through sustainability Value of sustainabilityKey Performance
indicators
The make-up of the work force
Achievement of appropriate competences
Percentage of employees receiving appraisals
Absenteeism of our people
Reportable accidents and incident rate
Grievance raised of an ethical nature (internal and external)
Corporate community investment
Percentage of sustainability targets achieved
Positive/negative media comment on environmental and community
activities
Percentage volume of materials from sustainable sources
Percentage of suppliers with ISO 14001
Customers satisfaction levels
Customer retention
The diversity of our people
Satisfaction of our people
Health and safety performance
Human rights
Corporate approach to social responsibility
Energy costs
Costs of waste
Environmental performance
Customer satisfaction
The diversity of our people
The competence of our people
Satisfaction of our people
Health and safety performance
Human rights
Energy cost
Cost of waste
Water
Pollution
Corporate approach to social responsibility
Environmental performance
Customer satisfaction
Fairer treatment of people and communities
More fulfilled people and communities
Better environment to live in
More resources for future generations
Increased business
Reduce waste
Social progress
Protection of the environment and prudent use of natural resources
Economic growth and Prosperity
Easier to attract high quality people
More motivation people
Improved productivity and reduced cost
Reduced risk of litigation
Improve reputation
More contented customers, better margins and more
business
Attract, develop andretain excellent people
Deliver year-on-year growth in earnings per share
Develop market leading position
Differentiate through consistently exceeding customer expectations
Managing people
Managing cost and risk
Managing reputation
Managing customers
Sustaining prosperity
Sustainingthe environment
Sustainingcommunities
How we willmeasure performanceGroup objectives How Carillion will benefit What we will manage What we will manage How society will benefit Sustainability objectives
Sustainability strategy model (adapted from Leiper et al, 2003, Proceedings ICE, 156 ES1, 59-66 (ISSN 147 4637)