Embed Size (px)
Citation preview

Environment and Innovation Ofgem Report 2018/19
2WPD’s Environment and Innovation Report aims to provide all of our stakeholders with a transparent and public account of our environmental and innovation performance over the last twelve months.
We will use this report to provide an all-inclusive overview that includes clear justification for our actions and the benefits to our customers.
Reducing our impact on the environment and embracing the increase in low carbon technologies is one of our key RIIO-ED1 outputs. To this end throughout 2018-19 we have achieved the following improvements:
Executive Summary
Environmental highlights
• Significant reduction in wastebeing disposed of to landfill
• Continued reduction in ourBusiness Carbon Footprint
• Significant reduction innetwork losses across all fourWPD licence areas
• Successful inaugural WPDEnvironment Conferenceheld in WPD West Midlands
• Appointment of a newISO14001:2015 managementsystem auditor, NQA
Innovation highlights
• Over 14,000 previously hidden LCTs identified as part of our LCT Detection Project
• As part of the Entire Project 47MWh of flexibility was utilised and led toour Flexible Power work
• On average an electric vehicle user charges their vehicle every two days
• 21 NIA projects have been delivered in 2018/19
• We received 54 submissions to NIA third party call
Challenges
• Maintaining and improving progress in RIIO-ED1 business environmental outputs –specifically our output for fluid filled cableleaks and SF6 emissions.
• Investment in solutions to help identify andremove PCB contaminated equipment acrossthe UK distribution network
• Maintaining and improving our environmentalperformance and compliance record with theenvironmental regulators
• Investment in the development of alternativesto SF6

31.0 Introduction
1.1 Who we are and what we do 4
1.2 Our network 5
1.3 Improvement opportunities 6
1.4 Stakeholder engagement 7
2.0 Managing our environmental impact
2.1 Introduction 11
2.2 Protected landscapes 11
2.3 Oil leakage 12
2.4 Carbon impact and climate change 14
2.5 Other environment related activities 26
3.0 Smart grids, innovation and our role in the low carbon transition
3.1 Introduction 36
3.2 Progress of the innovation strategy 37
3.3 Roll-out of smart grids and innovation into business as usual 44
Appendices
Appendix A
East Midlands RRP environmental innovation 2018/19 56
South Wales RRP environmental innovation 2018/19 56
South West RRP environmental innovation 2018/19 56
West Midlands RRP environmental innovation 2018/19 56
Appendix B
RRP Environmental innovation commentary 2018/19 56
Contents

4
Cardiff
Birmingham
Isles of Scilly
Coventry
Nottingham
Plymouth
Bristol
1.1 Who we are and what we do
We are one of the six Distribution Network Operators (DNOs) who deliver electricity to homes and businesses across England, Wales and Scotland. Our network, which serves 7.9m customers, is the largest in the UK, operating from the Lincolnshire coast, across the Midlands, South Wales and the South West to the Isles of Scilly.
Our four key business tasks are:
1. Operating our network assets to ensure we‘keep the lights on’ for all of our customers
2. Maintaining the condition and thereforereliability of our assets
3. Fixing our assets should they get damagedor if they are faulty
4. Upgrading the existing network or buildingnew ones to provide additional electricitysupply or capacity to our customers
Our role is simple
We are not a supplier. We do not buy and sell electricity, or directly bill customers. Our costs account for around 18% of an average annual domestic electricity bill which customers pay to their supplier.
We deliver electricity to over 7.9 million customers over a 55,000 square kilometre service area and we employ over 6500 staff.
1.0 Introduction
7.9MOur network, which serves 7.9m customers, by area in the UK

51.2 Our network
The electricity network we operate includes:
• Transformers that convert electricity from onevoltage to another
• Underground cables and overhead lines thatcarry electricity across long distances
• Switches to turn the electricity on or off,or to alter its route
• Service connections to take the electricityinto customers’ premises
• Our network sits between the National Gridtransmission network and the end customer
1.0 Introduction
Asset Type Units WPD Total
Overhead lines Km 90,000
Underground cable Km 135,000
Transformers Each 188,000
Switchgear Each 299,000
Poles Each 1,374,000
Towers (pylons) Each 15,000
Customer numbers Each 7,875,000

61.3 Improvement Opportunities
We are committed to ensuring that we meet all of our compliance obligations while minimising the overall impact that our activities have on the environment in which we work and operate.
Wherever possible we aim to adopt best practice to continually improve on our environmental performance.
As such during RIIO-ED1 we have committed to achieve the following environmental improvements (outputs) throughout our business:
1.0 Introduction
A reduction in technical network losses
• Installing oversized transformers when replacing assets at highly loaded locations
• Using larger sized cables when installing new network in Low Carbon Technology(LCT) hotspots
• Undertaking innovation projects specifically related to technical losses£
A reduction in our carbon footprint
• All replacement vehicles to have lower CO2 emissions than those they are replacing
• Ensuring all new or refurbished WPD buildings achieve a minimum rating of ‘Excellent’for new build and ‘very good’ for refurbishment under the BREEAM* rating
• Reducing the amount of waste we produce and send to landfill
Reduction in the leaks from our equipment, specifically;
• The volume of oil lost through leaks from fluid filled cable
• The volume of SF6 gas that is lost from switchgear
• Installing effective oil containment ‘bunds’ around plant containing high volumes of oil
*Building Research Establishment Environmental Assessment Method
71.4 Stakeholder Engagement
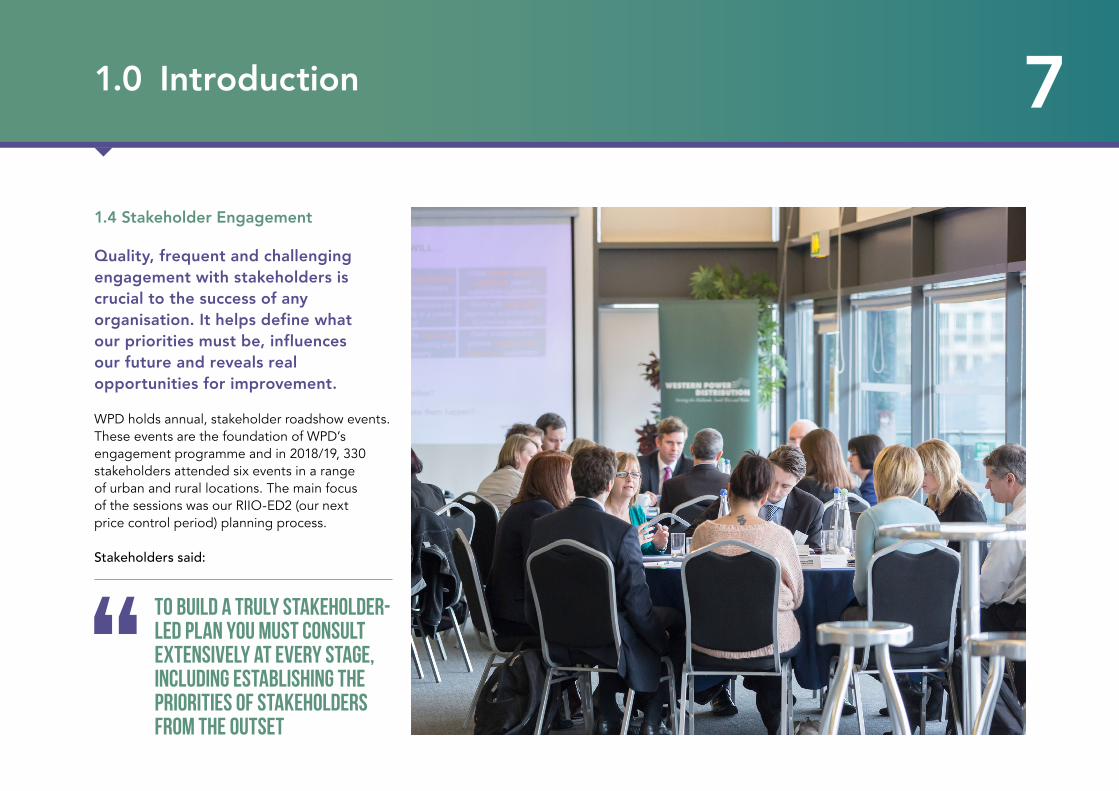
Quality, frequent and challenging engagement with stakeholders is crucial to the success of any organisation. It helps define what our priorities must be, influences our future and reveals real opportunities for improvement.
WPD holds annual, stakeholder roadshow events. These events are the foundation of WPD’s engagement programme and in 2018/19, 330 stakeholders attended six events in a range of urban and rural locations. The main focus of the sessions was our RIIO-ED2 (our next price control period) planning process.
Stakeholders said:
1.0 Introduction
To build a truly stakeholder-led plan you must consult extensively at every stage, including establishing the priorities of stakeholders from the outset

81.0 Introduction
Building a smart network scored very highly, with stakeholders citing connection of more renewable energy to the grid, the transition to Distribution System Operator (DSO) and increased flexibility on the network as key factors in its prominence.
Innovation and new services, electric vehicles (EVs) and environment also contributed to the list, with our decarbonisation agenda, the current climate emergency and investment in storage all being raised as points of interest.
Stakeholders said:
In response to stakeholder feedback, WPD have committed to create a map illustrating how we are building a smarter network by providing examples of how customers are using offerings such as flexible power and EV charge points.
The concept of a social contract was also discussed with stakeholders, including which elements it should take account of. An excellent environmental performance and community / environmental benefits were two areas that were endorsed by stakeholders and confirmed by WPD for inclusion.8420 106
Network Reliability 8.46
7.94
7.87
7.41
7.26
6.83
6.82
6.77
6.70
6.66
6.65
6.23
6.21
5.79
Build a Smart Network
Network Resilience
Cyber Resilience
Innovation and New Services
Vulnerable Customers
Whole Systems Approach
Connections
Customer Service
Electric Vehicles
Environment
Affordability
Workforce Resilience
Fuel Poverty
When asked to identify the priority areas that mattered most, our stakeholders told us:
the number of EV charge points installed and progress on the rollout of flexibility services should be published on the WPD website, with maps to make the information as accessible as possible

9Electric Vehicles (EVs)
An opportunity to discuss the projected increase in EV take-up was a recurrent factor cited by stakeholders for why they wanted to engage with us at these events.
When asked, many stakeholders could see themselves buying an EV in the future:
Specific surgeries around EVs and wider innovation were held at the events to give stakeholders the opportunity to discuss these topics in more detail with WPD.
Stakeholders expressed concern about:
• The need for more capacity on the network for EV charging
• The accessibility of charging hubs
• Disruption caused in urban locations by installation of new charge points
Many supported WPD having some control over EV charging, as this would negate the need for traditional reinforcement. Stakeholders also encouraged a greater collaboration between WPD and local authority representatives.
In response to this feedback, WPD has committed to undertake at least one EV workshop in each of the four licence areas with Local Enterprise Partnerships (LEPs) / Local Authorities (LAs) to guide, educate and inform stakeholders on the progress.
0 5 10 15 20 25 30 35 40
6%
25%
37%
17%
14%
Already own one
As a domestic customer, how likely are you topurchase an electric vehicle? (select one option)
Likely in the next 5 years
Likely in the next 5-10 years
Likely in over 10 years time
Never/highly unlikely
1.0 Introduction

101.0 Introduction
Distribution System Operator (DSO)
We have been engaging with stakeholders on our transition to DSO since 2016, becoming the first DNO to publish a fully-costed DSO transition strategy.
In 2018/19 we built on this previous engagement, consulting our broadest range of stakeholders yet - 18,200 with varying degrees of knowledge / interest - in order to develop a forward looking action plan with specific timescales and deliverables.
Some of the actions taken to date include:
• Over 11,000 EV charge points installed without network reinforcement
• DSO forward plan action plan published, containing 48 actions – co-created with stakeholders
• New ‘Flexible Power’ brand launched with 3 flexibility services offered
• 10 new Constraint Management Zones (CMZ) launched, bringing thetotal to 13
WPD has an ongoing commitment to stakeholders that their input will drive change, and their insight and feedback is fundamental in driving new services and improvements that benefit all our customers.
Nice strategy, but tell us the plan…
Engagement can only be deemed meaningful and worthwhile if it leads us to do things differently

112.1 Introduction
We are committed to the protection of the environment and ensuring that all of our operational activities have minimal impact upon it. Our company wide ISO14001 environmental management system helps us to ensure that any potential risk to the environment and the communities in which we operate is minimised and that we continually manage and improve our environmental performance.
2.2 Protected Landscapes
We operate 90,000km of overhead lines predominantly in rural locations.
While overhead lines are widely accepted as being part of the countryside, there are a number of protected landscapes, including National Parks and Areas of Natural Beauty (“AONB”) across our geographical footprint where removing our overhead lines and replacing them with underground cables would visually improve matters.
We coordinate the undergrounding of overhead lines with established steering groups consisting of representatives from AONBs and National Parks who help us identify and prioritise where work will take place. We provide information and appropriate assistance to stakeholders to help them in scheme selection including budget costing and feasibility assessments.
The years in which funds are spent are dependent on the views of the steering group, as well as the timescales needed to develop and implement the schemes.
As part of the Ofgem-approved voluntary initiative, following stakeholder engagement and feedback, our approved business plan for the regulatory period 2015-2023 includes a total sum of £7.6m for undergrounding of overhead lines in National Parks and AONBs.
The £7.6m is the total for our four licence areas for eight years and is split according to Ofgem’s allowance caps for each electricity network licence area across England and Wales as follows:
• West Midlands: £2.3m
• South West: £3.0m
• East Midlands: £0.9m
• South Wales: £1.4m
The work carried out by licence area is as follows:
Table 2.2 – Undergrounding in National Parks and AONB’s (km)
2.0 Managing our environmental impact
Target for RIIO-ED1
Completed (to date)
West Midlands 14 5.3
East Midlands 10 8.3
South Wales 10 2.5
South West 21 1.4
WPD Total 55 17.5

122.0 Managing our environmental impact
2.3 Oil Leakage
Older styles of electricity cables contain oil to improve their insulation properties and to enhance cooling. Occasionally, from time to time, these older cables leak when equipment is damaged, seals deteriorate or as a result of changing ground conditions. When this happens we take steps to ensure that any damage to the environment is minimised and that the leak is fixed as quickly as possible. We’re also putting in place measures to help to reduce the overall number of leaks that we have across our network.
The risks associated with operating fluid filled cable (FFC) and related assets can be reputational, regulatory and financial. The primary risk is associated with the leakage of insulation oil into the environment causing pollution. Leaks typically occur as the cable sheath deteriorates with age, at joint failures or as a result of third-party damage.
To minimise environmental damage we aim to ensure that:
• Fluid levels in all our cables are monitoredremotely, the loss of pressure triggering analarm in our Control Centres. This enablesus to react quickly to any leak event.
• Leaks are located quickly preferably usingperfluorocarbon tracer (PFT) and repaired.
• Cables with a history of high leak rates areselected for replacement.
Additional mitigation may range from visual inspection or PFT tracing, to spot repair, sectional drain and seal or the full extraction of the cable.
All leak rates are recorded and a database of leak and cable information held centrally. Monthly reports of fluid filled cable leaks are submitted to both the Environment Agency and Natural Resources Wales.
2.3.1 Improving leak location
A tagging system has been introduced which uses a small amount of Perfluorocarbon tracer (PFT) chemical. This is incorporated into the fluid and if a leak occurs can be readily detected above ground to pinpoint leaks quickly and to speed up the repair process. This reduces costs, inconvenience to customers and the volume of oil lost to the environment.
During RIIO-ED1 WPD committed to applying PFT to cables with a history of leakage and internal policy reflects this requirement.
2.3.2 WPD Fluid Filled Cable Reported Information
Since 2014/15 we have achieved the following:
5%Total length of FFC in service has reduced by 40km or 5%
21%Total volume of oil in service (FFC) has reduced by 447,122 litres or 21%

13FFC oil leakage – all WPD
We have seen increases in the volume of oil leaked from fluid filled cable during 2018/19. Fluid filled cable leaks occur more frequently in the autumn and winter months, as a result of changes in ground conditions.
During 2018/19 there was an increase of approximately 50% in the number of leaks that occurred, peaking in November 2018, potentially as a result of the lengthy dry summer that we experienced in 2018. Approximately 60% of the oil leaked across WPD was attributable to only five circuits. Two circuits in the South West accounted for 66% of the leakage. These cables have previously been tagged with PFT to enable leak location.
The leak was found and repaired and we anticipate that leakage rates for the South West should return to lower levels. In the West Midlands, two circuits contributed to 67% of leakage. Again PFT was used to enable leak location and these cables have now been fully repaired.
0
2016
-17
2014
-15
2020
-21
2021
-22
2022
-23
2023
-24
2018
-19
2017
-18
2015
-16
2019
-20
50,000
40,000
30,000
20,000
10,000
Total Leak (Litres) 75% RIIO-ED1Reduction Target
FFC oil leakage - All WPD
2.0 Managing our environmental impact
142.0 Managing our environmental impact
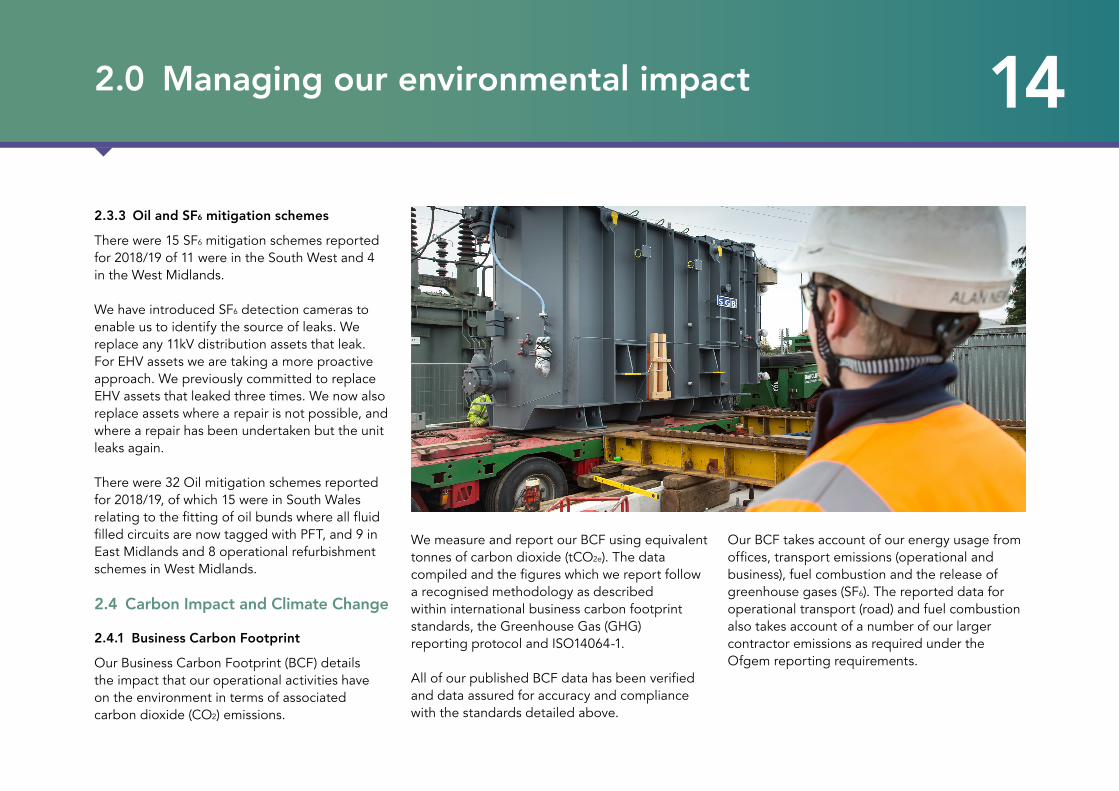
2.3.3 Oil and SF6 mitigation schemes
There were 15 SF6 mitigation schemes reported for 2018/19 of 11 were in the South West and 4 in the West Midlands.
We have introduced SF6 detection cameras to enable us to identify the source of leaks. We replace any 11kV distribution assets that leak. For EHV assets we are taking a more proactive approach. We previously committed to replace EHV assets that leaked three times. We now also replace assets where a repair is not possible, and where a repair has been undertaken but the unit leaks again.
There were 32 Oil mitigation schemes reported for 2018/19, of which 15 were in South Wales relating to the fitting of oil bunds where all fluid filled circuits are now tagged with PFT, and 9 in East Midlands and 8 operational refurbishment schemes in West Midlands.
2.4 Carbon Impact and Climate Change
2.4.1 Business Carbon Footprint
Our Business Carbon Footprint (BCF) details the impact that our operational activities have on the environment in terms of associated carbon dioxide (CO2) emissions.
We measure and report our BCF using equivalent tonnes of carbon dioxide (tCO2e). The data compiled and the figures which we report follow a recognised methodology as described within international business carbon footprint standards, the Greenhouse Gas (GHG) reporting protocol and ISO14064-1.
All of our published BCF data has been verified and data assured for accuracy and compliance with the standards detailed above.
Our BCF takes account of our energy usage from offices, transport emissions (operational and business), fuel combustion and the release of greenhouse gases (SF6). The reported data for operational transport (road) and fuel combustion also takes account of a number of our larger contractor emissions as required under the Ofgem reporting requirements.

152.0 Managing our environmental impact
Table 2.4.1a Annual BCF Reporting
WPD Carbon Footprint Report (tCO2e)
Aspect Scope 2014/15 Total tCO2e
2015/16 Total tCO2e
2016/17 Total tCO2e
2017/18 Total tCO2e
2018/19 Total tCO2e
Buildings energy usage
Buildings – electricity 2 12,454.4 10,997.7 10,622.2 7,633.5 6,454.16
Buildings – Other fuels 1 207.6 193.1 192.5 220.2 246.48
Substation electricity 2 27,578.7 25,813.8 22,981.6 19,618.6 17,260.18
Operational transport*
Road 1 40,018.8 37,804.8 34,902.6 33,329.5 30,569.11
Rail 1 0.0 0.0 0.0 0.0 0.0
Sea 1 2.4 2.4 0.24 0.24 2.41
Air 1 1,428.1 1,831.0 2,163.5 2,113.6 1,643.74
Business transport
Road 3 3,304.0 5,116.2 3,196.5 3,395.3 3,174.81
Rail 3 21.6 20.6 21.97 21.8 20.66
Sea 3 0.0 0.3 0.97 0.1 0.00
Air 3 106.4 41.5 92.37 124.1 241.05
Fugitive emissions SF6 1 8,282.1 14,307.5 9,545.7 10,689.5 10,933.90
Fuel Combustion* Diesel / Gas oil 1 8,574.1 7,100.9 7,041.6 6,382.3 9,217.60
Total Carbon (tCO2e) 101,978.1 103,229.8 90,761.7 83,528.7 79,764.10
Network Losses 1 1,906,640.7 1,687,342.2 1,530,164.6 1,377,491.8 1,004,502.202
Total carbon (tCO2e) including losses 2,008,618.8 1,790,572.0 1,620,926.3 1,461,020.5 1,084,843.54
Scope relates to definitions in DEFRA guidance and is detailed in the commentary at Appendix B. *Includes contractor emissions

162.0 Managing our environmental impact
Since 2014/15 our annual BCF (excluding losses) has reduced by 22% or 22,214 tCO2e – the approximate equivalent carbon footprint of heating 8013 average UK households.
Since 2014/15 our annual BCF (including losses) has reduced by 46% or 923,775 tCO2e - the approximate equivalent carbon footprint of heating 342,138 average UK households
Fig.2.4.1a Annual BCF (tCO2e) excluding network losses
0
40,000
60,000
100,000
20,000
2014
/15
2014
/15
2018
/19
2018
/19
2016
/17
2016
/17
2022
/23
2022
/23
2020
/21
2020
/21
2015
/16
2015
/16
2019
/20
2019
/20
2017
/18
2017
/18
2021
/22
2021
/22
80,000
120,000
WPD emissions
Contractor emissions
RIIO-ED1 5% Reduction Target
24%Reduction in operational road use since 2014/15
Fig.2.4.1b Annual BCF (tCO2e) including network losses
0
1,000,000
1,500,000
2,500,000
500,000
2,000,000
3,000,000
WPD emissions
Losses
Contractor emissions
RIIO-ED1 5% Reduction Target
48%Reduction in building electricity use since 2014/15

172.0 Managing our environmental impact
As shown below, and similar to 2017/18, the main contributors to our Business Carbon Footprint (excluding losses) is Building energy use (38%) and Operational Transport (35%).
Throughout the remainder of ED1 we will focus on reducing the impact which both building energy use (including energy use at substations) and operational transport has on our overall business carbon footprint.
Fig.2.4.1c Business Carbon Footprint - WPD
We continue to have the following initiatives in place to try to improve overall BCF performance:
• Fugitive emissions (SF6 gas leakage) make up 17% of the total BCF for2018/19, an increase of 4% on the previous year. We remain committedto investigating and finding alternatives to SF6 and have put to good usethe infrared SF6 detection cameras which enable us to quickly pinpoint thesource of leaks.
• Building energy use (operational and non-operational) accounts for38% of 2018/19 BCF. We are continuing to install low energy lighting andenergy efficient heating / cooling systems throughout our propertyportfolio as well as undertaking an energy efficiency review at many of ournon-operational and operational sites.
• 37% reduction in operational transport (35,443 tCO2e 2017/18 comparedto 22,658 tCO2e 2018/19). To further improve our emissions associatedwith our operational transport activities we will continue to replace oldervehicles with more fuel efficient alternatives and improve awareness ofthe impacts of driving style on fuel efficiency and vehicle emissions.
17% 38%
35%
5%
5%
Buildings energy usage
Operational transport
Business Transport
Fugitive emissions
Fuel combustion

182.0 Managing our environmental impact
Reducing Emissions from Vehicles
Our network is spread over an area of 55,000km2 so we need to operate a significant fleet of vehicles to serve this territory effectively.
Emissions are reported as part of our BusinessCarbon Footprint and are calculated based on fuel usage data, in line with the published2018 DEFRA conversion factors. Procurement processes are used to ensure that when ourvehicles reach the end of their useful lives, they are replaced with more efficient options.An example of replacements for some of our most commonly used operational vehiclesshows this process in practice (data comes from the vehicle registration certificate).
In 2018/19, 390 operational vehicles were replaced with lower emission alternatives as per the Table 2.4.1b, an increase of 42% on the number of vehicles replaced in the previous year, 2017/18.
Table 2.4.1b Emissions variations for operational vehicle replacements
Emissions – operational vehicle replacements
Previous Vehicle CO2 emissions (grams per km) Current vehicle (2019) CO2e emissions
(grams per km)
Vauxhall Corsa 94 Ford Fiesta Van 1.5 Euro 6 96
Transit Connect SWB 115 Transit Connect SWB Euro 6 123
Transit Connect LWB 115 Transit Connect LWB Euro 6 123
Isuzu DMAX 183Isuzu D Max MEWP 183
Ford Ranger Euro 6 179
Isuzu DMAX MEWP 183 Isuzu DMAX MEWP Euro 6 183
Transit 350 MWB RWD 185
Transit 350 MWB RWD Euro 6 185
Transit 350 MWB FWD Euro 6 185
Transit 320 Custom Euro 6 161

192.0 Managing our environmental impact
Fig. 2.4.1d WPD vehicle fuel use (litres) per year Fig. 2.4.1e Total WPD fuel use (litres) per year
2,000
2,200
2,300
2,500
2,100
2016
/17
2022
/23
2020
/21
2018
/19
2017
/18
2015
/16
2021
/22
2019
/20
2,400
2,600
Annual fuel use per WPD vehicle – litres
RIIO-ED1 Target 5% Reduction Target
7,500,000
2016
/17
2022
/23
2020
/21
2018
/19
2017
/18
2015
/16
2021
/22
2019
/20
Total annual fuel use – litres
RIIO ED1 Target 5% Reduction Target8,000,000
8,500,000
9,500,000
9,000,000
We measure the contribution of vehicle emissions to our overall BCF performance in terms of fuel usage converted to equivalent tonnes of carbon dioxide (tCO2e). We have demonstrated good performance during 2018/19 with reductions in both the litres of fuel used per WPD vehicle and the total volume of fuel used for operational road vehicles across the business.
By continuing with our vehicle replacement programme and raising awareness of the impact of driving style we hope to continue to make good progress towards meeting our RIIO-ED1 5% reduction target for annual fuel use.

202.0 Managing our environmental impact
Building Energy Use
We operate from 59 offices that vary in age and construction. We know that when refurbishment of these buildings takes place, there are opportunities to improve their energy efficiency.
In West and East Midlands, many offices were new or refurbished to the BREEAM standard of ‘excellent’ or ‘very good’ when facilities were being developed for our local team based operational structure, and all new builds achieved the ‘excellent’ rating.
In the South West and South Wales our properties are older, with more scope to implement energy savings measures. Whenever refurbishment work is planned we ensure, where appropriate, that it is carried out to the “very good” standard under BREEAM to reduce energy consumption. The “very good” standard is the highest which can be achieved for a refurbished building.
Local improvements include:
• Installation of motion sensors
• Improvements to air conditioning units
• Low energy lighting
The property redevelopments improved employee awareness and energy efficiency measures, are leading to energy savings. This is evident in the electricity usage we recorded in our overall BCF reporting. We propose to save around 5% of electricity used in offices and depots over the RIIO-ED1 period. As demonstrated we are more than meeting this target with a reduction of almost 50% since 2014/15.
Current PerformanceFig. 2.4.1f Company building electricity use (tCO2e) – taken from depot SMART meter.
0
2015
/16
2022
/23
2020
/21
2018
/19
2017
/18
2016
/17
2021
/22
2019
/20
Company Electricity use (tCO2e)
RIIO ED1 Target 5% Reduction Target
4,000
6,000
10,000
12,000
14,000
2,000
8,000

212.0 Managing our environmental impact
2.4.2 Sulphur Hexafluoride (SF6)
A gas which is used throughout our industry as an insulating medium in switchgear, SF6 provides many tangible benefits however it is a potent greenhouse gas. There are currently no viable alternative gasses to SF6 and so it is replaced when necessary on a like for like basis.
Fig. 2.4.2a shows that the volume of SF6 leaked annually is very small at less than 0.6% and has decreased from the reported leak rate in 2017/18 but is still above our ED1 target leak rate.
0
0.00%
0.20%
400
0.80%
1.00%
800
600
1.20%
200
0.40%
0.60%
2016
/17
2022
/23
2020
/21
2018
/19
2018
/19
2017
/18
2015
/16
2016
/17
2017
/18
2015
/16
2021
/22
2019
/20
Fig. 2.4.2b Annual SF6 emissions (kg)
Fig 2.4.2a Actual percentage loss of SF6 to total bank of SF6 on the WPD network
*Includes all top-ups, units returned to manufacturers’ and scrapped units
WPD have made changes and improvements to our SF6 leakage reporting process during this price control period.
Emission data, shown in Fig 2.4.2b is now collated from the following data sources:
• SF6 top-up figures as reported on our company asset database
• Scrapped units returned empty to our company plant centres
• Units returned empty to manufacturers
SF6 Leakage rate (%)
Target leakage rate (%)

222.4.3 Distribution Losses
Introduction to Losses
The importance of reducing electrical losses on distribution networks is growing as a result of the increase in intermittent distributed generation and higher production costs.
The energy lost in distribution creates a financial cost which is paid for by the customer. DNO’s are obliged, as part of their licence, to reduce losses on their networks as far as reasonably practicable. The energy lost which includes theft, accounts for unnecessary carbon emissions, which impacts climate change. Reducing losses effectively increases the network capacity. This is crucial with energy consumption likely to increase sharply over the next 15 years, as a result of The Carbon Plan and the uptake of new technologies such as electric vehicles and heat pumps become more common. This means loading will increase, which will increase losses, as explained in the variable losses section. Losses may increase further due to the increase in distributed generation. By reducing losses wherever possible, it could reduce the need for costly network reinforcement projects.
In addition to the environmental effect, the financial cost of losses contributes to customers bills. All of the financial savings that loss reduction produces are passed on to consumers directly. Reducing losses can also effectively increase the capacity of our network, as less power needs to be delivered to produce the same output.
Causes of LossesDistribution network losses can be broadly defined as the difference between the electrical energy entering the distribution network, from base generation or embedded generators either upstream / same level / downstream networks, and the electrical energy exiting the distribution network, for consumption purposes and properly accounted for it, in percentage terms for a particular period.
Distribution network losses are conventionally broken down into two categories:
• Technical losses;
• Non-technical losses.
2.0 Managing our environmental impact

232.0 Managing our environmental impact
Losses StrategyThe traditional heart of the WPD loss-reduction programme lies in asset replacement.
WPD intends to:
• meet or exceed the Ecodesign 2015 directivewith all new transformers purchased;
• oversize the 11kV ground-mountedtransformers which are highly loaded enoughthat replacement is economically justified;
• replace the entire complement of pre-1958ground-mounted distribution transformers;
• install a minimum size of 25kVA for single-phasepole-mounted transformers and 50kVA forthree-phase units;
• discontinue 4 & 16mm2 Cu. LV service cables;
• discontinue 95mm2 LV Wavecon mains cablesand 95mm2 Al. triplex 11kV cables; and
• standardise on 185/300/400/630 and 800mm2
Cu. single core cables for the 33kV network.
WPD aims to continue working alongside suppliers to investigate transactional theft; to perform regular random audit checks in order to monitor unmetered supplies and to investigate theft in conveyance by comparing the metering records
to Ordnance Survey records and investigating properties without meters.
In 2018/19 we extended the reach of our loss reduction programme to prepare for the effect of electric vehicles and other LCT demands.
WPD intends to investigate:
• Electric Vehicle Charging
• LV phase imbalance correction
• Desktop studies of the LV networkand customer connections
• Conversion of legacy networks
• Substation Footprint
• Car Park Charging
WPD has multiple innovation projects which are likely to lead to great advancements in network design. A lot of these advances will rely on the smart-meter roll out, which the company is preparing for. By using the data from the smart meters alongside the real-time network control tools this will ensure the network is working in the most efficient manner at all times.
It is envisaged that when the end of the RIIO-ED1 period is reached, it will be these network design and active network control measures that will be the focus of the loss-reduction activities.
Assessment of our Losses PerformanceWPD is now at a point where most of the straight-forward actions that can be taken to reduce losses have been initiated. WPD has put the replacement of almost all assets, for which it would be economically beneficial to do so, into the policy documents, although CBA’s will need to be repeated as costs and savings will change over time. WPD’s shift of approach to electric vehicles will bring a new range of initiatives in the coming years.
Forthcoming PlansAn important part of the losses strategy is to plan for the coming year. WPD has identified a number of areas in which the focus of efforts will be applied for the coming year and beyond, they are described below:
WPD has created a losses specific page for the WPD and Policy section websites. These sites will explain the basic issues regarding losses, what is being done to reduce them and who interested parties should contact regarding losses issues.

24A substantial task which will continue in the next 12 months is working through the 26 recommendations made in the SOHN Associates report on losses and deciding which of them are feasible. Many of these recommendations are likely to lead to further research, so this task may start off new innovation projects. Appendix 1 contains the full list of these recommendations and identifies whether each one has been adopted, rejected or is a current or future consideration.
WPD is looking at a project supplying street lights from a dedicated three phase 4 core Wavecon LV mains cable and also providing dual three phase electric vehicle charging points from each street light position on the project. This will entail designing a small IPC connector / joint for the connection. In addition WPD is in discussion with the Welsh street lighting authority on this issue.
With the UK government stating that by 2040 only new electric vehicles shall be available to purchase this will have a large impact on the electricity network, WPD is looking to consider this and are undertaking projects to best manage this impact to the network as a whole. Working with a developer to future proof their development by providing three phase supplies to all the houses on the various sites.
WPD is in discussion with a manufacturer on producing a dynamic switching device which would look at each three phase circuit supplied from a substation and balance the single phase loads across the three phases.
WPD has investigated the option to have a larger unit substation footprint as this will give rise to installation of rapid electric vehicle chargers which are connected to the 11kV network to reduce losses.
2.0 Managing our environmental impact

25Table 2.4.3a Summary of losses and benefits from activities in RIIO-ED1.
Proposal Interventions per Annum
Savings per Annum (kWh)
Interventions through RIIO-ED1
Savings through RIIO-ED1 (MWh)
Transformers
Replace pre-1958 transformers 250 2,694,543 1,996 21,556
Install a minimum size of pole-mounted transformer 575 68,072 4,600 545
Discontinue 315kVA ground-mounted transformers 448 1,140 3,584 9
Cables
Discontinue small size service cables 343 km 412,629 2,744 3,301
Upsizing LV cables 694 km 3,049,799 5,552 24,398
Discontinue small size 11kV cables 448 km 951,421 3,584 7,611
Imbalance
Correct Imbalance at LV substations Per substation 1,014 Per substation
2.0 Managing our environmental impact

262.0 Managing our environmental impact
Five key approaches on the new ISO 14001:2015
2.5 Other environment related activities
2.5.1 ISO14001:2015 CertificationSince 2015 we have been certified to ISO14001, the international standard for environmental management systems (EMS), across all four of our licence areas.
During this time we have found having the certification beneficial in a number of ways;
• Validates how we manage our operational activities via our own EMSto ensure minimal impact on the environment
• Provides confidence to interested parties and industry regulators
• Ensures that we meet all of our compliance obligations
• Provides a consistent and recognisable approach to how we manageenvironmental issues across our entire business
• Demonstrates our value of good environmental stewardship
• Encourages our business to improve our environmental performanceand to look to future developments in environmental managementand sustainability
During 2018/19 we had one ISO14001 surveillance visit by our external certification body. No major non-conformances were raised during the visit and the minor non-conformances identified have all now been closed out and accepted by our auditors. During 2019/20 external surveillance visits will continue however during the year we will be changing our external auditors and preparing for our re-certification to the ISO14001 standard in 2020.
Greater commitment from the top management
An increased alignment with unique context, strategic direction and risk orientation
Driven through a communication strategy and its effectiveness
Proactive initiatives, objective measurements & improving environmental performances
Each stage of a product or service; from development to end-of-life is on focus
Emphasis on leadership Focus on strategic fit & risk management
Effective communication & awareness
Greater protection for environment Life cycle perspective1 2 3 4 5

272.5.2 Waste Management We continue to work closely with all of our waste contractors ensuring that where possible waste streams are diverted from landfill and that we always apply the principle of the waste hierarchy. As a result in 2018/19 we have seen a dramatic decrease in the percentage and tonnage of waste which we send to landfill across the entire WPD network – see Fig 2.5.2.f.
Redundant cabling and metal work, a significant waste stream within WPD, is segregated at our depots and collected by one of three dedicated contractors who we have worked with for many years. We receive monthly revenue for the collected metal/cable and this waste is, in turn, processed and eventually returned to the marketplace for re-use.
One of our largest waste stream by weight, wooden poles are replaced throughout our network and are collected from many of our non-operational depots. We continue to dispose of the poles via a waste to energy plant in the north of England, avoiding expensive and prohibitive landfill costs while ensuring that we comply with the waste hierarchy.
During 2018/19 we have continued to develop a small scale creosote removal trial in South Wales which would, if successful potentially remove the creosote from wood poles and therefore re-classify the waste as non-hazardous and therefore reusable. We are continuing discussions with the Welsh Government and Natural Resources Wales, both of which are supportive of the project and we look to commence and further develop the trial in 2019/20.
2.0 Managing our environmental impact
We continue to segregate our waste at all of our depot locations and transport units into the following waste streams:
Metal Cable Dry mixed recyclables(Cardboard/paper/plastics)
General waste
Wood Organics Redundant wood poles
Hazardous waste
(Batteries/contaminated rags/ used electrical insulating oil/ aerosols/fluorescent tubes)

28In 2018/19 we awarded new waste management contracts across each of the WPD licence areas. A key performance requirement of the new contracts is to reduce the weight of waste that we send to landfill while as a business WPD need to focus on reducing the overall tonnage of waste that we produce.
We are managing our waste better in terms of the waste hierarchy and the percentage of this waste which has been disposed to landfill has significantly reduced to approximately 14%, the vast majority of our waste is now recycled or recovered at waste to energy plants.
There are a number of challenges moving forward; firstly to reduce the amount of waste we produce we need to engage with a number of our manufacturers and suppliers to investigate how we can reduce the amount of packaging and ancillary waste which enters our business in the first place. Secondly we need to continue to increase the amount of waste we send for recycling. While sending waste for recovery is better than disposal to landfill we must work with our waste contractors and encourage them to look for alternative recyclable disposal routes to waste streams which currently are traditionally disposed of to landfill or recovery.
2.0 Managing our environmental impact
Fig. 2.5.2a Percentage breakdown of WPD Waste 17/18 (not including metal and cable)
73.7%
1.3%0.2%
4.0%8.3%
5.8% 1.6%2.9%
2.1%
7.8%
C&D
Inert
General waste (landfill)
PlasticGeneral waste (not landfill)
Wood
Hazardous
Green waste
Treated woodCardboard
Mixed recycling

292.0 Managing our environmental impact
8,000.00 4,000.00
4,000.00 2,000.00
2,000.00 1,000.00
6,000.00 3,000.00
0 0
2016
/17
2016
/17
2014
/15
2014
/15
2013
/14
2013
/14
Bas
e
2013
-14
2014
-15
2022
-23
2021
-22
2020
-21
2019
-20
2018
-19
2017
-18
2016
-17
2015
-16
2015
/16
2015
/16
2.5.2.b Tonnage of waste to non-landfill 2.5.2.c Tonnage of waste to landfill
2.5.2.d Annual percentage waste to landfill vs. non-landfill
% Waste non-landfilled
% Waste landfilled
100.00
80.00
40.00
20.00
60.00
0.00
2013
/14
2014
/15
2015
/16
2016
/17
2017
/18
2018
/19
2017
/18
2017
/18
2018
/19
2018
/19
2.5.2.e Percentage of waste to landfill
Although the % age of our waste sent to landfill has increased this year, we are still on target to achieve
our RIIO-ED1 target by 2022-23. What is encouraging is that the actual tonnage of waste we produce
has reduced for the first time since we started reporting on RIIO-ED1 performance.
40%
50%
60%
20%
10%
30%
0%

30
Know where to throw
If in doubt, leave it out
What goes in What goes in
Clear bags only Black bags only
Empty plastic bottlesEmpty cans
and clean tinsOther clean plastic
containers
Paper and magazinesand envelopes
Card and cardboard
Used paper towels Any cups or lids Leftover food or drink
Packaging containing residual food
Crisp packets and sweet wrappers
Keep our recycling clean!
2.0 Managing our environmental impact
In considering our performance in 2018/19 on reducing our waste to landfill we are very much on target to achieve our RIIO-ED1 target by 2022-23.
Waste initiatives
During 2019/20 we must target the tonnage of waste we receive and produce across our business – employing the principles of the waste hierarchy and reducing the actual tonnage of waste in the first instance before focusing on the amount of waste being reused, recycled or recovered. We will specifically:
• Liaise with our manufacturers and suppliers to identify opportunitiesto reduce the amount of packaging and embedded waste enteringour business.
• Work with our Purchasing Team to ensure that waste reductioninitiatives are a key requirement of future contracts where applicable.
• Continue to work with our waste contractors to identify alternativedisposal routes for our waste, increasing the amount of waste we recycleand reduce further our reliance on both landfill and recovery disposal.

312.5.3 WPD Depots
Since 2014 we have applied for and held 30 environmental permits for the storage of used electrical insulating oil with the Environment Agency / Natural Resources Wales.
As part of the permit compliance process, our permitted depot sites must be able to demonstrate to the Environmental Regulator that all pollution prevention measures are robust, fit for purpose and legally compliant.
We have also demonstrated a thorough approach in terms of oil storage, risk minimisation and the management of the environmental permits in line with our company environmental management system.
Throughout 2018/19 we have had a number permit compliance visits by the EnvironmentAgency and Natural Resources Wales. Most of the visits have been unplanned and to date we have had no major non-conformances issued at any of the sites visited and any minor non-conformances identified have been addressed promptly and closed by the Regulator.
During 2018/19 we will continue to manage our permitted sites in line with Environment Agency / Natural Resources Wales guidance and environmental legislation.
WAMITAB Competency Assessment
In order for us to maintain and comply with our depot environmental permits for the storage of used electrical insulating oil, the Environmental Regulator needs assurance that our employees are competent and responsible for the safe and secure management of the site.
One way to demonstrate competency in terms of waste management is to complete the Waste Management Industry Training and Advisory Board (WAMITAB) competency assessment. The process assesses an individual’s competency in terms of environmental compliance, pollution prevention and risk minimisation, as well as health and safety. Staff should also operate in line with all company policy.
To date, 53 selected employees based at our sites have successfully completed the assessment and have been issued with their WAMITAB certification.
2.0 Managing our environmental impact

322.5.4 Environmental Employee Awareness
Ensuring and maintaining that all of our employees are aware of their environmental responsibilities and the impact that their activities and that of WPD could potentially have on the environment is a key requirement of our environmental management system.
In 2018/19 we delivered environmental awareness training to approximately 571 employees across the business.
We have also issued a number of companywide environmental bulletins, posters, awareness leaflets and re-issued an environmental awareness video.
2018 West Midlands Environment ConferenceIn May 2018, WPD West Midlands held its first Environment Conference. Held at our Worcester Depot over fifty management attendees discussed and deliberated with the WPD Environment Team and the regional Network Services Manager whether sustainability and environmental management is now business critical to all electrical distribution network operators.
The presentations considered how critical good environmental performance is to WPD in light of
increased scrutiny and expectations from our parent company, PPL, our industry regulator OFGEM, environmental regulators, our stakeholders and the general public.
Breakout sessions and further presentations were then given by a number of our key environmental contractors who we frequently rely on to ensure that our good performance and excellent compliance record is maintained.
Contractors attending were:• Veolia Waste Management Services
• Green Ecology
• Adler & Allan – Incident Managementand Contaminated land
• Capture Green – Pollution control services
The feedback from the Conference was very positive and future conferences will be undertaken in 2019.
2.0 Managing our environmental impact
571We delivered environmental awareness training to around 571 employees in 2018/19
We have delivered environmental awareness sessions at all of our depots across all four WPD licence areas. While some aspects of the sessions are tailored to meet the specific needs of each depot, the following environmental issues are briefed as standard;
Environmental sustainability
Carbon Awareness
ED1 Commitments and Environmental Outputs
ISO14001
Pollution Prevention
Ecology
Waste Management
WPD Environmental aspects
Employee Responsibility
Employee Awareness Sessions

332.0 Managing our environmental impact
2.5.5 Community Awareness
Ecobot’s Energy Saving Reward Scheme was a new initiative launched in October 2018 with the aim of encouraging primary schools in our region to reduce energy consumption and make positive changes to the way they use energy in their school. Schools could secure up to £750 depending on the amount of energy reduction achieved.
Alongside the initiative, we commissioned lesson plans, developed by a primary school teacher, to support the main curriculum with teacher resources also available to download for all the schools who had registered.
As well as creating their own energy saving ideas, we offered opportunities for additional rewards by setting challenges like ‘Lights, Camera, Action’ where the schools were asked to produce a 90 second video explaining how they were reducing their energy. Another Ecobot Challenge required the schools to design a poster with an energy saving message. The winning entry was then professionally printed and displayed in all 59 WPD depots encouraging energy saving among staff.
More than 9,000 eligible primary schools received a direct email from WPD telling them about the Ecobot Energy Saving Reward Scheme. We also had a social media campaign running alongside press releases in local media outlets and all backed up with interactive tools on our website.
Ecobot was the mascot for this campaign and the short promotional videos had far reaching engagement receiving more than 6,000 hits and Facebook reached almost 35,000 followers.
Those schools who did sign up and engaged in the four month scheme achieved an energy reduction between 9% and 37%.
Feedback has been very positive and schools are keen to be involved if we were to repeat the energy saving challenge. Schools said it was a kick start which they hope to continue.

342.5.6 Ecology/Protected species and areas
Awareness of protected species legislation continues to improve across the organisation with regular calls being received by our external ecologists. They have had over 45 callouts to sites in the last 12 months on projects and many more telephone enquiries asking for advice relating to ecology issues.
As usual a high percentage of calls relate to badgers, either with setts in substations, at the base of overhead line poles or in the route of a new underground cable; the new Badger Class licence (CL35) has come in useful on some of these projects.
Other projects have involved great crested newts, grass snakes, breeding birds, dormice and bats. Walkover surveys have been required prior to new undergrounding and replacement of overhead lines to identify not only protected species issues but also sensitive habitats. Our ecologists have also been asked to prepare Habitats Regulations Assessments where possible impacts may occur on European protected sites: Special Protection Areas (SPAs)
and Special Areas of Conservation (SACs).In 2018 an interesting call-out was received in West Devon where a WPD engineer had found a bat in a crack about a metre from the ground in an old pole due for replacement. When inspected by the ecologist there were two soprano pipistrelles wedged in the crevice, later during an evening survey five bats emerged from a hidden cavity in the pole behind the crevice.
At another site in Cornwall engineers found both greater and lesser horseshoe bats present in a sub-station, some of which had been seen hanging off the switch gear.
Work within SSSI’sFollowing a stakeholder engagement event 2018 WPD were contact by Natural England to consider whether we would like to enter into a ‘generic assent’ agreement with Natural England for works within designated SSSI’s in England.WPD has assets placed in or over SSSI’s throughout our four licence areas, and gaining assent from Natural England to undertake work within them can be a lengthy process and places an administrative burden on both WPD and Natural England. While the proposed generic assent will not cater for any excavation or major works being undertaken (these will still require an individual assent to be granted) the agreement
will cover general low impact maintenance works such as;
• Overhead line tree and vegetation clearancein woodland and hedgerows (outsidenesting season)
• Like for like pole replacements
• Overhead line replacement and maintenance
We are hopeful that the generic assent agreement will be signed and in place by the end of 2019.
2.0 Managing our environmental impact
Lesser horseshoe bat hanging off switch gear in Cornwall.

352.5.7 Adaptation/Flood Preparedness
In May 2015 we produced a second Climate Change Adaptation Plan.
There has been no change to the fundamentals of climate change risk since our first report. The UK Climate Predictions (UKCP09) published under the Climate Impacts Programme remain in place as the base dataset for climate change in the UK. However, third round Climate Change Adaptations Plans based on the newly published UPCP18 dataset are due for submission at the end of 2021, we are planning to complete the work by April 2021 to enable any recommendations to be fed into our RIIO ED2 submissions.
Throughout 2018/19 we have continued to work with the University of Newcastle to complete more research on the effects of climate change. We have provided the University with locational data and other weather related impact data for our network. They have simulated the effects of climate change on the whole range of environmental impacts that may affect our business. The main risks that impact our network remain unchanged; they include extreme weather events, flooding and significant temperature changes.
Understanding UncertaintiesUsing the impact of UKCP09 climate predictions, we have plans in place to mitigate climate changeon our network. New research has highlighted the increased risk of interdependencies, such as the effect of high winds after periods of prolonged rainfall which can increase the chance of trees being uprooted and affecting our overhead lines.
Details of actionsWe continue to work through our programme of substation flood prevention work.
We have further developed our capability to respond to flood events using portable equipment and mobile pumps. We have also altered our specification for pole-mounted transformers to improve their resilience to
lightning. Our amended overhead line design standards which take into account a potential rise in temperature are now in place.
Addressing barriers and interdependenciesWe do not see any barriers to our adaptation to climate change. Instead we remain focused on addressing the interdependencies, including the impact of transportation issues when flood water could hamper our access to our substation sites.
Monitoring and evaluationThe recent report from the Adaptation Sub Committee highlighted the work carried out within the electricity industry. We report on our actions to our regulator, Ofgem, and our response to recent extreme weather events demonstrates that we are well prepared for the impact of any climatic changes.
2.0 Managing our environmental impact

363.0 Smart grids, innovation and our role in the low carbon transition
3.1 Introduction
Innovation is at the core of our business strategy. Improving the services we deliver to customers and driving the network to be more efficient through better ways of working has always been fundamental.
We have facilitated the transition to a de-centralised energy system by re-engineering our networks, which were designed for 14GW of demand, to enable them to accommodate 20GW of generation. Accommodating the increased intermittency, variability and volatility of the energy flowing around our assets has only been achieved through innovation of our design and construction methods. We have adopted new technology to make our networks more sophisticated and responsive, forged new relationships with customers and developed our operational practices.
Making our networks smarter, integrating outputs from innovation projects as they develop and enhancing our existing datasets with information from smart meter datastreams will enable us to increase capacity and security at a lower cost.
By carrying out a wide portfolio of innovative projects which build upon what we have already learnt and incorporating successful developments from other DNOs, we can ensure the network will meet all future needs and we will maintain our position as the leading performer in network availability and customer service.
We look for innovative developments across five broad areas;
• Network performance and efficiency – searching out better processes, equipment and technology that ensure we continue to be efficient
• Low carbon networks – supporting future electricity demand and generation requirements
• Smart grids and meters – developing new techniques and utilising enhanced data to help develop more dynamic network control
• Environment – reducing our business impact on the environment
• Customer service – developing smarter ways of delivering better customer service
Key Challenges
The energy system is changing and distribution network operators will continue to have a greater need to actively manage energy flows on a real time basis in order to develop an efficient, co-ordinated and economic network that accommodates emerging system needs and delivers benefits and savings for customers. The way electricity is generated and the ways in which electricity is consumed are changing at an unprecedented rate and further integration of low carbon technologies and the electrification of transport and heat will continue this trend into the future. Greater flexibility of the networks will be required to manage the impacts of the varying patterns and levels of loads locally and nationally.
Smart energy technology and processes have the potential to deliver lower bills and allow customers to connect low carbon technologies quicker, cheaper and more efficiently. By prioritising these principles for implementation, we aim to deliver benefits for our customers sooner.

37
5Co-ordinate DSO operations with National Grid (SO) and look to provide services
4Undertaking commercial arrangements to contract services eg. DG, active demand, storage
1Understand historic and real time energy flows
3Actively reconfiguring the system dependent on need
2Forecast future energy volumes and flows across the network
Our five key areas for prioritisation are:
3.0 Smart grids, innovation and our role in the low carbon transition
3.2 Progress of the Innovation Strategy
The Innovation Strategy looks at the long term development of our distribution assets, network operations and customer service caused by changing system and customer needs. The Strategy looks through to 2035, yet naturally provides more detail on the shorter term priorities, requirements and proposed initiatives.
We rely on innovation to maintain our position as a frontier performer in network performance and customer service. Innovation is targeted at all of the key outputs; safety, cost efficiency, customer service, reliability and environment. In the past innovation has proved beneficial by allowing us to continually improve in these areas. Future innovation will allow us to continue these improvements and will also help us to address the challenges brought about by the Carbon Plan.
Our innovation project portfolio has enabled us to deliver significant learning to the wider business as well as other network operators. We have delivered over 100 innovation projects over the previous and current price control period, which has enabled significant changes in how we operate our business providing benefits to customers. Key examples of this is the learning as part of our Low Carbon Networks Hub project that has enabled us to roll out Active Network Management (ANM) across each of our four licence areas, as well as flexibility services now delivered through the Flexible Power brand was created as part of the Entire NIA project, which developed technical and commercial requirements to utilise flexibility as a service to avoid asset investment requirements.
We continue to innovate and ensure third party access and collaboration on our projects is achieved, most notably through our established third party call for projects. This Strategy also sets out our key priorities and challenges during the remainder of RIIO-ED1.

38Safety
improvement Cost efficiency improvement
Customer service improvement
Reliability improvement
Environmental improvement
Statistical Ratings of OHLs
Solar Storage
Common Information Model
LV Plus
LCT Detection
FREEDOM
SF6 Alternatives
DEDUCE
Carbon PortalHydrogen Heat and FleetCADET
EDGE FCLi
Electric Nation
ENTIRE
Losses
LV Connect and Manage
LV SEF Protection
MADE
Network Islanding
Next Gen Wireless
OHL Power Pointer
PNPQA
Smart Energy Isles
Visibility Plugs and Sockets
Virtual STATCOM
I&C Storage
Alternative Cut-outs
Engineered Poles
3.2.1 Key Themes of the Trials
As well as the Innovation Strategy, we publish an annual NIA innovation progress report.
3.0 Smart grids, innovation and our role in the low carbon transition

393.0 Smart grids, innovation and our role in the low carbon transition
Major Low Carbon and Smart Grid ProjectsWe have been successful in receiving funding for a significant number of projects through Ofgem’s network innovation competitions, two of our largest, OpenLV and EFFS are currently in delivery and our Network Equilibrium project has concluded this year. We are project partners in two major innovation projects funded through national and EU innovation mechanisms. These projects investigate a range of network issues from 132kV active network management to rewiring of customer homes with DC systems.
Network Equilibrium The focus of Network Equilibrium is to balance voltages and power flows across the distribution system to better configure the network. This project will help to integrate additional distributed generation within electricity networks more efficiently and deliver major benefits to distributioncustomers. It is developing solutions that will be initially demonstrated across Somerset and Devon.
The project uses three methods:
Enhanced Voltage Assessment (EVA) This developed a new network modelling tool for 33kV and 11kV networks. It allowed better visibility of time series power flows and voltage profiles at
33kV and 11kV, not just the extreme scenarios. It looks to improve contingency planning, modelling, and forecasting of both demand / generation profiles.
System Voltage Optimisation (SVO) SVO dynamically adjusted 33kV and 11kV voltage profiles across eight Bulk Supply Points and eightprimary substations within the trial area. It investigated overcoming the issue of fixed voltage points at key substations by using telecommunications and centralised network management software.
Flexible Power Links (FPL) The project trialled the use of novel power electronics to optimise the power flows betweentwo different 33kV networks. Flexible Power Links was used for the first time by a British distribution network operator and transferred both real and reactive power flows, on a dynamic basis, between previously unconnected networks.
The learning from this project is now being taken forwards and applied to changes to our business as usual processes.

40Open LV
OpenLV will create a software platform which enables enhanced real time assessment and visibility of low voltage network capacity. This improved visibility will allow the distribution network companies to more actively manage this level of the network, which is necessary as more generation and demand is connected locally. Such an approach would ensure the available capacity is used more effectively, minimising the costs of reinforcement.
The decarbonisation of heat and transport through the wide scale customer adoption of heat pumps and electric vehicles will increase demand on LV networks. Under current business practice this would result in a large amount of conventional LV reinforcement, at significant cost and disruption to customers, to accommodate this increase in demand. New solutions are becoming available, but each delivered on separate, proprietary platforms.
The functionality delivered by the OpenLV Solution will be proven via three complementary methods:
• Method 1: LV Network Capacity Uplift;
• Method 2: Community Engagement; and
• Method 3: OpenLV Extensibility to 3rd parties.
The OpenLV Solution includes the following key components:
• Intelligent substation devices that can support software applications or ‘Apps’ from multiple vendors on a single device. Providing a low cost hub that, once deployed, can act as a hub for many more functions
• A secure platform that enables the intelligent substation devices to be remotely managed
• A secure platform that provides LV network data to community groups and third party organisations
This will facilitate non-traditional business models by opening up network data to third parties to understand the network and deploy solutions. The roll out of the overall solution proposed across Britain will support the Low Carbon Plan and uptake scenarios presented in the UK Government’s Fifth Carbon Budget by minimising the impacts of low carbon heating and transport on the LV network, therefore removing this as a barrier to customer adoption where it is applied. This has significant potential to deliver environmental benefits and cost savings to future and existing customers by negating and/or deferring the need to reinforce the LV network.
3.0 Smart grids, innovation and our role in the low carbon transition

413.0 Smart grids, innovation and our role in the low carbon transition
This will include:
• Creating weather adjusted forecasts for load andgeneration at different time-frames and adjustingthese for planned flexibility service despatch inorder to determine the nature, duration andfrequency of expected constraints
• Determining the optimum set of actionsto manage potential constraints includingevaluating the suitability of flexibility services
• Communicating flexibility services requirementsto the market and creating commercialagreements for those services
• Executing flexibility services including arming,execution and validation of deliveryand payment
• Sharing information with interested partiesto avoid conflicts in flexibility service use
The project will consider the optimum degree of integration with existing systems and whether simplified alternatives to full optimised power flow analysis can provide sufficiently reliable information.EFFS will work closely with the ENA Open Networks project which is specifying the functional requirements for DSO operation and the likely data
exchanges. EFFS is also working together with Fusion and Transition, NIC projects by Scottish Power and Scottish and Southern Energy Power Distribution respectively that are also supporting DSO transition.

423.0 Smart grids, innovation and our role in the low carbon transition
Local Energy Market
A key conclusion of the Smart Grid Forum Workstream 6 was for market participants and network operators to have visibility of each other’s proposed DSR actions and requirements. Our NIA project, Visibility Plug and Sockets, will support a much larger EU funded initiative led by Centrica in Cornwall to create a local energy market. The project will develop a platform to enable suppliers, aggregators and communities to inform the network operator of planned changes to assumed electricity profiles (either DG or demand). It will allow the network operator to post information about potential congestion, enabling a market solution to them. Any requirements for residual balancing and direct DSO schemes would therefore be minimised.
Smart Energy Isles
We are part of Hitachi led consortium awarded EU funding to build and operate a renewable energy microgrid on the Isles of Scilly. In addition to the integration of renewable generation the project will install energy efficiency measures and control system in homes and businesses.

43
EDGE FCLi Carbon PortalImproved Statistical
Ratings for Distribution Overhead Lines
Entire
Solar Storage
Common Information Model
Next GenerationWireless
Smart Energy Isles
LCT Detection
SF6 Alternatives
OHL Power Pointer
Visibility Plugs and Sockets
FREEDOM
Losses
LV SEF Protection
Engineered Poles
Alternative Cut-outs
DEDUCE
Virtual STATCOM
CADET
Hydrogen Heat & Fleet
Electric Nation
LV Connect& Manage
PNPQA
MADE
I&C Storage
Networking Islanding
LV Plus
3.0 Smart grids, innovation and our role in the low carbon transition
Low carbon and smart grid smaller project portfolio
In addition to the large projects, we are continuing to deliver a portfolio of smaller low carbon projects listed here;
Network improvements
and system operability
Transition to a low carbon
future
New technologies and commercial
evolution
Customer and stakeholder
focus
Safety, health and
environment
443.3 Roll-out of Smart Grids and Innovation into Business as Usual
We deliver innovation through an in-sourced model with a small team of specialists using the resources of our operational teams to deliver tools or products onto the network.
The Innovation Team works alongside the company’s Policy department, interacting with equipment specifiers and technical experts of the wider business. Once trials are successfully completed, the outputs are taken forward and replicated across our network.
As outputs are delivered, they are developed into new learning that can be taken forward and developed as business as usual. Outputs obtained from other DNO projects are fed into this process to ensure that we gain maximum benefit from innovation projects.
All solutions rolled out from innovation follow the same route as our other policies and techniques introduced into the company. Policies are reviewed by the senior network managers before they are introduced. The rollout process includes implementation plans and, where appropriate, training and dissemination sessions. We monitor all the projects as they develop and make use of learning and outcomes as they are reported.
Our Electric Nation project involved nearly 700 EVs smart charging, using price and network
signals to indicate the optimised time to charge, on the network and enabling us to understand the impact on the network and how constraint issues can be mitigated. It has brought forward the knowledge on the impact of EVs on the distribution network and trialed resolutions, such as the impact of significant clustering of charging and charging time deferment. Participants were surveyed throughout the different stages of the trial, during which they were asked to rate their satisfaction with current charging arrangements. During the initial trial we recorded a 75% satisfaction rate, which increased through the trials to just under 80%. It shows that smart charging did not have a negative impact on the participants.
Our LCT Detection project utilised industry data from the Data Transfer Service (DTS) data set to enable the application of leading-edge analytics to provide improved visibility of EVs and PVs connected to the network. This will also support forecasting of the proliferation of these technologies across networks and other LCT connections to enable enhanced network planning including the options of active/flexible network management. The use of IBM data analysis techniques on both structured and unstructured data enabled the identification of 5,863 EV charge points and 8,104 PV installation predictions, indicating a 13% increase on existing known installations.
Building on previous, limited, Demand Side Response (DSR) trials our Entire project aimed to fully develop and test the skills, relationships and systems necessary for a DNO to provide a comprehensive, commercially effective DSR capability. The project focused on areas within the WPD network that may be due a significant capital upgrade but where the certainty of immediate need is absent. The project developed systems, services and methodologies for participant recruitment, which facilitated over 47MWh of contracted flexibility services. This work has enabled WPD to develop the Flexible Power brand, initiated as part of the project, to offer flexibility as part of our DSO business activities.
All projects produce new or revised WPD policies for use during the project lifetime. These policies are always written in such a way that they can be extended to apply beyond the project and, in a larger geographic area if the solutions trialled turn out to be successful.
3.0 Smart grids, innovation and our role in the low carbon transition

453.3.1 Roll-out StrategyStages of InnovationProjects will continue to deliver additional knowledge across all output areas. The project portfolio will remain balanced across multiple areas:
• Working at various stages of development spanning higher Technology Readiness Levels (TRL) 3 to 8
• Exploring both technology and commercial solutions
• Covering the whole range of asset types and network voltages
• Assessing risk, with no projects carrying unnecessary risk
• Utilising a variety of external funding mechanisms to supplement our own R&D budget
Lower TRL projects will generally be carried out by external research partners under the supervision of our engineers. Higher TRL projects which, in the shorter term, are more likely to produce a solution for our network or processes will mostly be delivered in-house using business as usual teams.
3.3.2 Innovation Process
Innovation is core to our business strategy. We have a dedicated innovative team exploring innovative ideas including the delivery of smart grid projects. Our projects are predominantly generated from ideas from staff and stakeholders. When they involve the installation of equipment on our network or require a change to business processes we do this in the same way as our standard engineering activities using the skills and efficiencies of our engineering teams. We also draw on the expertise of our suppliers and help them develop solutions, and we work with a range of research establishments using their specialist skills.
innovative Solutions will be implemented across the network using ‘business as usual’ teams
Approach to innovation The way we approach innovation is fundamental to delivering against our objectives effectively and efficiently. Our approach is to:
• Actively involve staff from across the business in the generation of ideas, development of solutions and implementation of projects
• Work with a wide range of stakeholders to understand their needs
• Make use of a wide range of innovation incentives and funding provided by the government, regulator and other funding mechanisms
• Define clear objectives for each project so that delivery can be focussed and progress can be accurately tracked
• Use a small core delivery team to co-ordinate innovation projects
• Avoid theoretical research or innovation that doesn’t have clear objectives and benefits
• Incorporate innovative solutions into existing equipment and processes
• Share what we’re learning with other organisations and learning from others
3.0 Smart grids, innovation and our role in the low carbon transition
463.3.3 Benefit and Impacts of roll-out
The innovation solutions we have rolled out have provided a series of benefits both to our customers and to our business. The details of those benefits can be found further within this document in section 3.3.10.
3.3.4 Maximising the Benefits of Smart Meter Roll-out
Smart Meters have the potential to provide data to enhance our existing core business activities such as fault management, network planning and asset management. There are also potential benefits which could lead to future applications that would help the deployment of low carbon technologies and the move to actively managed networks. With many of these applications the benefits increase as the density of smart meters on the system increases.
Fault management
Smart metering will provide a number of functions to support fault restoration and reporting activities. For example when there is a power cut, ‘last gasp’ functionality will trigger a message to notify a loss of supply. This will provide a level of visibility down to the individual premises that has not been available before.Additional functionality will allow the ’energisation status’ of meters to be checked remotely, giving us a clearer understanding of which customers are off supply, enabling us to determine what kind of fault has occurred (blown fuse, open circuit fault, single premise). This will help ensure that we respond in the right way first time and improve our restoration times. In the case of a call regarding a ‘single premise’, it will also help to remotely identify if the issue is on the network or on the customer’s own equipment.
On completion of any restoration work, it will be possible to check that all supplies have been restored. This is particularly useful in storm scenarios where faults at High Voltage (HV) can mask additional issues at Low Voltage (LV).
The ability to check will reduce the possibility of teams leaving the area while customers may still be off supply. As smart meters record interruption and restoration times, fault management applications will become more effective over time as the density of installed smart meters increases and more information becomes available to provide comprehensive view of the network.
3.0 Smart grids, innovation and our role in the low carbon transition
Smart meters have the potential to provide valuable data which could enhance our core business

473.0 Smart grids, innovation and our role in the low carbon transition
Connections
As with load-related network investment, increased visibility of voltage levels and power flows can help us reduce the time to connect new loads and generation. It can also provide benefits to new connectees via lower connection charges and the ability to assess options for the use of smart solutions to reduce or avoid upstream reinforcement.
Asset management
A wide range of data will be available from smart meters to support asset management activity. Each meter will be able to act as a voltage monitoring point and be capable of issuing alarms relating to voltage anomalies (under voltage, over voltage).
Network planningExisting network planning assumptions are already being challenged due to the volume and type of distributed generation on the LV network.At present, the majority of load data is derived from measurements at source 11kV circuit breakers at primary substations. At LV, maximum demand indicators provide us with a limited view of load at distribution substations but no load duration is collected. Smart meter data can provide increased visibility on the aspects of network activity that can subsequently inform load-related investment decisions. Data on half-hourly power flows (real, reactive, import, export) and maximum demand (both for individual meters and aggregated for network sections) allow us to determine load profiles, which can be used to:
• Check that loading is within operational andthermal capacities of network components
• Determine thermal capacity headroom togauge the scope for accommodating additional(LCT) loads
• Inform the prioritisation of load-related networkinvestments
• Avoid unnecessary reinforcements or networkissues from demand over or underestimation
• Identify reverse power flows, which mightrequire us to take action
• Identify where power factor correction isnecessary or can act as an alternative tonetwork reinforcement
• Identify areas where network losses are highest
The data collected will provide us with a more comprehensive understanding of where there are issues on the network and where there is adequate capacity to accommodate additional connections or more LCTs without the need for network reinforcement.
Aggregated load data will create a more detailed profile of the loads experienced at points on the network. This can support the identification of overloaded sections of network and aid in the prioritisation of network reinforcement where load issues have been identified.
Aggregated load data can also ensure that network reinforcement is avoided where it is not necessary. For example, maximum demand indicators may suggest that a substation is overloaded based on a momentary high load, whereas aggregated metering data may demonstrate that this was of very short duration and in line with design parameters requiring no intervention.

483.3.5 Smart Meter Penetration
The percentage penetration of Smart Meters in each of the DNO’s Distribution Services Area at the end of 2018/19 period is provided in table 3.3.6
The Smart Meter Rollout is being managed by Electricity Suppliers in the UK and is due to becompleted by 2020.
3.3.6 Status of IT and Communications Investments (DS)
The current status of IT and communications investments which are required to maximise thebenefits of smart metering data – are detailed in Worksheet E5 – Smart Metering (published as anappendix to the Report) and the accompanying commentary report.
We have been connected to the DCC release 1.3 since December 2017 and are planning on moving to release 3.0 later in 2019. In addition to proving system functionality we have successfully passed an independent audit to ensure our security architecture and environment meets the security requirements of the overall national programme.
3.0 Smart grids, innovation and our role in the low carbon transition
Table 3.3.6 Smart Meter Penetration by WPD Licence Area
Licence area East Midlands
West Midlands
South Wales
South West Total
No. MPANs 2,674,036 2,504,088 1,151,680 1,658,109 7,987,913
No. SMETS1 805,696 781,635 443,537 327,637 2,358,505
No. SMETS2 52,888 43,493 23,500 22,152 142,033
Total penetration 32.11% 32.95% 40.55% 21.10% 31.30%
Fig. 3.3.7 Smart Metering – User System Environment
User systems
Load BalancerSpreads
outbound responses to
multiple adaptors
Load BalancerSpreads inbound
responses to multiple adaptors
DCC WAN
DCC router
Core adaptor
Anomaly detection
Security wrap/unwrapparse/correlate
Send and receive PDF emails
Back-end systems
SM business systems
SM messagehandler
Enterprise managementBackups
SchedulingSoftware delivery
Virus check
SM messagebuilder
File preparation MPRS
S. West S. WalesE. Mids W. Mids
SMDBResponses
Service requests
Registration
DBMy SQL
DB support adaptor
ReportsAdaptor reporting server
SSI
SMKI
User System Boundary
HSMServes
public/private keys to adaptor
High volume call taker (alarms and alerts)
Meter reading time series database

493.3.7 Maximising the Value of Smart Meter Data
While suppliers have been installing smart meters in our distribution area these are not compatiblewith the national infrastructure. As such no smart metering data has been received and consequently no benefit has been realised as yet.
This will continue to be the case until largevolumes of SMETS2 smart meters start to be installed. There has seen a steady increase of SMETS2 meters being installed and we now lead the way with in excess of 140,000 units installed within our licence areas. The numbers will increase through the rest of the programme as all suppliers will be installing SMETS2 meters in 2019.
3.8 Smart Meter Data
At present our innovative connections solutions are targeted at large scale customers. Soft Intertrip and Active Network Management (ANM) require real-time links so do not use smart meter data. We can use smart meter data to complete retrospective checks on Timed Connections. As our innovation continues and smaller customers are focused for solutions, smart meter data will become a key dataset for us.
3.0 Smart grids, innovation and our role in the low carbon transition
Existing installed SMETS1 meters are planned to be enrolled in to the DCC through late 2019 in to 2020
A typical visual display unit a customer would have in the home connected to a smart meter.

503.3.9 Estimated Actual Benefits
The estimated actual benefit of using smart metering data during the current price control period was included in our RIIO-ED1 Business Plan and was as follows:
Table 3.3.9a
The level of estimated actual benefit declared in the WPD Business Plan was based on a number of assumptions which may no longer be valid.
• Commencement of mass rollout of smartmeters was not delayed
• Penetration of SMETS1 meters was very low
• Customer numbers with no Smart MeterWAN coverage was very low
• Consumption data was able to be used indisaggregated form
• Power outage/restoration alerts arereceived in a timely manner
• Smart Meter voltage measurement hasa high and known accuracy
Consequently the level of estimated actual benefit will need to be reviewed once the outcome of the aforementioned becomes clearer.
3.0 Smart grids, innovation and our role in the low carbon transition
16/17 17/18 18/19 19/20 20/21 21/22 22/23
Efficiency saving on load-related reinforcement 0.00 0.00 0.00 0.00 0.43 0.70 0.85
Efficiency saving on connections-related reinforcement 0.00 0.00 0.00 0.00 0.50 0.80 0.98
Savings from last gap functionality 0.00 0.08 0.23 0.38 0.60 0.75 0.75
Savings from restoration confirmation 0.00 0.01 0.04 0.06 0.09 0.11 0.11
Total per annum 0.00 0.09 0.26 0.43 1.62 2.36 2.69
Smart metering benefits for demand side response and active network management (£m)
15/16 16/17 17/18 18/19 19/20 20/21 21/22 22/23
Total per annum 0.00 0.00 0.00 0.00 0.00 0.5-1.5 0.5-1.5 0.5-1.5
Table 3.3.9b
513.3.11 Forecast Actions
The start of an increased number of SMETS2 meters since the beginning of 2018, and supplier trials within the licence areas has led to increasing numbers of SMETS2 meters throughout 2018/19.
During the early part of mass roll-out, while penetration levels are low and during the 2018/19 regulatory year, we will be in ‘evaluation mode’ whereby the smart metering data we receive will be assessed, but our existing business processes and systems will largely continue as before.
The actions we intend to take are as follows:
Avoided losses to network operatorsThis benefit depends on:• A high penetration of smart meters
• The availability of Supplier Time of Use (TOU)tariffs
• Significant numbers of customers taking upthese tariffs
• The TOU tariffs incentivising a customerresponse which reduces the maximum demand
• The In Home Display driving changes incustomers’ consumption behaviour
We intend to monitor developments in this area as smart meter roll out continues.
Reduction in Customer Minutes Lost (CML)This benefit depends on sufficient penetration of smart meters to allow for rapid identificationof fault type/position and therefore quicker responses and repairs. These were not realised during the 2018/19 regulatory year. We intend to evaluate the outage and restoration alerts that we receive during this period and collate statistics of the type and accuracy of alerts received.
Reduction in operational costs to fix faultsWhile there is the potential for us to benefit from avoiding unnecessary site visits for single outagecalls as soon as the very first meter is enrolled into the DCC, in practice this depends on:
• SMETS2 meters being installed
• The meter being connected at a premise wherea single outage call occurs
The integrated system is already in place and has correctly identified network faults with thecurrently installed SMETS2 meters. Savings for other faults requires sufficient SMETS2 meters on faulted circuits to allow rapid identification of fault type/position and therefore quicker response and repair. We intend to evaluate the outage and restoration alerts that we receive during this period.
Reduction in calls to faults and emergency lines
This benefit depends on:
• A high penetration of SMETS2 smart meters
• Supply outage and restoration alerts beingreceived in a prompt manner from the CSPsystems
• Customers being familiar with smart metercapabilities and having sufficient trust to relyon the meter to notify us about power loss
3.0 Smart grids, innovation and our role in the low carbon transition
52Better informed investment decisions for electricity network enforcement
This benefit depends on:
• Data privacy plans being approved
• A high penetration of SMETS2 smart meters
• Sufficiently detailed customer connectivitymodels
• Access to sufficiently granular consumptioninformation
This was not realised during the 2018/19 regulatory year. We have an approved Data Privacy Plan and Privacy Impact Assessment but as yet have not integrated systems to enable network teams to utilise the data. This is planned for 2020 at present.
Avoided cost of investigation of customer complaints about voltage quality of supplyAny voltage quality of supply benefit is limited by undefined accuracy of meter voltage measuring elements.
While there is the potential for this benefit to start being realised from the very first meter enrolled into the DCC, in practice it depends on:
• SMETS2 meters being installed
• The meter being connected on sub-optimallyperforming parts of the distribution network
Network capacity investment savings from electricity demand shift depend on the following:
• A high penetration of smart meters
• The availability of Supplier TOU tariffs
• Significant numbers of customers takingup these tariffs
• The TOU tariffs incentivising a customerresponse which reduces the maximum demand
These were not realised during the 2018/19 regulatory year. We intend to monitor developments in this area as smart meter roll out continues.
3.3.12 Innovative Solutions to new connections
The drive to connect DER remains at the forefront of our activity and with it the impact on the distribution system meaning scarcity of readily available capacity. While we are still encountering an appetite to connect traditional forms of generation many developers are turning to energy storage as a means of providing flexible services to the market. With its requirement for an equivalent demand capability, energy storage brings its own challenges to design and operation of the distribution system. To realise the customer’s capacity requirements we often need to undertake conventional reinforcement but that can take time and sometimes can be prohibitively expensive. There is also an increased risk of stranded assets or reinforcement lagging development as the growth rate of DER and LCT demand increases.
To avoid the need for network reinforcement and therefore reduce connection timescales and costs we have developed a suite of Alternative Connections (see 3.3.14) that offer a number of options for those customers who are open to the possibility of being flexible and are prepared to accept a level of curtailment.
3.0 Smart grids, innovation and our role in the low carbon transition
Alternative Connections offer customers quicker connections and reduced costs

53These options are particularly useful where an existing distribution asset is only compromised for a single system condition and curtailment levels mean the scheme is still viable.
We have been implementing these Alternative Connections across our region and they now have a proven track record. They allow us to drive system efficiencies by utilising assets more resourcefully and mitigating the need for reinforcement and its associated environmental impact. We will continue to develop and refine the use of flexibility as part of our innovation strategy and commitment to move from DNO to DSO. As we improve network visibility and monitor real
time energy flows we can deliver a distribution system that makes optimal use of capacity.You can find out more about our use of Innovative Solutions by visiting our ‘Alternative Connections’ page on our website.
3.3.13 Benefits for Using Innovative Solutions for ConnectionsBelow, we have summarised the benefits that innovative solutions have delivered for new connections.This shows that significant capacity has been released across the our service territory. Roll-out of these techniques across the whole network continues and we anticipate gaining further benefits as we adopt additional techniques.
3.3.14 Alternative Connections Descriptions Our innovative solutions allow customers to connect their distributed generation at reduced cost, with quicker timescales but will contain some form of curtailment to avoid expensive reinforcement costs.
Soft IntertripSome networks are constrained due to a single upstream asset requiring reinforcement, or a single limit being infringed under certain conditions. This solution has an on-site soft-intertrip Remote Terminal Unit which provides two normally open contacts for the customer’s
control system to monitor; Stage 1 and Stage 2.When both sets are open, the connection will be free of constraints. The levels of curtailment corresponding to the operation of the Stage 1 and Stage 2 contacts will be defined at the planning stage.
Active Network Management (ANM)This solution is the most complex and used mainly with larger new connections and primarily generation. Customer control equipment is installed into a WPD control solution which allows for full dynamic control of the network, generation and demand.
Timed ConnectionThis solution is a simple timer-based device that monitors the connection agreement with the customer, which will include some form of curtailment based on times of day.The customer’s connection agreement will include an operating schedule which will define the times and levels of capacity available to them. The solution is supplied by the customers equipment and does not require any additional investment from us to implement.
3.0 Smart grids, innovation and our role in the low carbon transition
MVA Released Avoided Costs (£m)
Customers WPD
Active Network Management 94.1 5.66 0.27
Intertrip 53.0 3.06 0.37
Timed 22.7 1.33 0.13
Exp Limiting 8.7 0.20 0.00
Total 178.4 10.26 0.77
Table 3.3.13
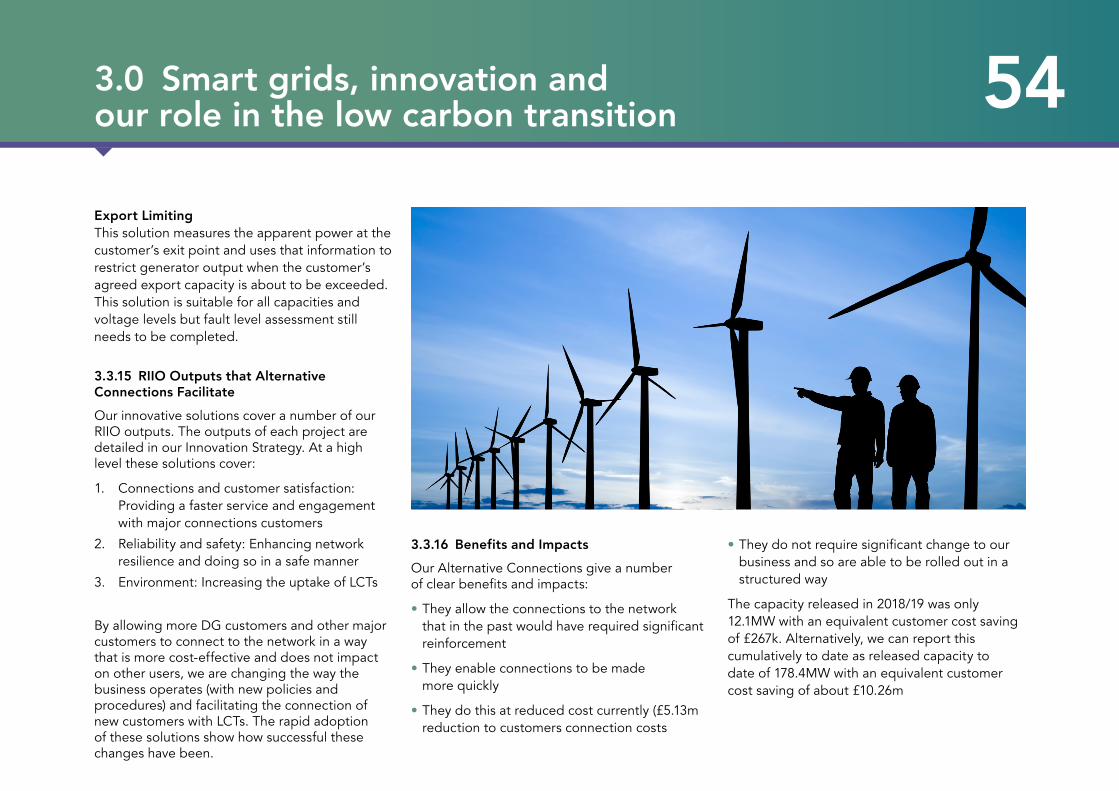
54Export LimitingThis solution measures the apparent power at the customer’s exit point and uses that information to restrict generator output when the customer’s agreed export capacity is about to be exceeded. This solution is suitable for all capacities and voltage levels but fault level assessment still needs to be completed.
3.3.15 RIIO Outputs that Alternative Connections FacilitateOur innovative solutions cover a number of our RIIO outputs. The outputs of each project are detailed in our Innovation Strategy. At a high level these solutions cover:
1. Connections and customer satisfaction:Providing a faster service and engagementwith major connections customers
2. Reliability and safety: Enhancing networkresilience and doing so in a safe manner
3. Environment: Increasing the uptake of LCTs
By allowing more DG customers and other major customers to connect to the network in a way that is more cost-effective and does not impact on other users, we are changing the way the business operates (with new policies and procedures) and facilitating the connection of new customers with LCTs. The rapid adoption of these solutions show how successful these changes have been.
3.3.16 Benefits and ImpactsOur Alternative Connections give a number of clear benefits and impacts:
• They allow the connections to the networkthat in the past would have required significantreinforcement
• They enable connections to be mademore quickly
• They do this at reduced cost currently (£5.13mreduction to customers connection costs
• They do not require significant change to ourbusiness and so are able to be rolled out in astructured way
The capacity released in 2018/19 was only 12.1MW with an equivalent customer cost saving of £267k. Alternatively, we can report this cumulatively to date as released capacity to date of 178.4MW with an equivalent customer cost saving of about £10.26m
3.0 Smart grids, innovation and our role in the low carbon transition

55Timed Connections do not require any actions on our part and are therefore available to customers as needed. Soft Intertrip and Export Limiting is available in a discrete set of circumstances so is available to all relevant customers.
The number of deployments and related capacity released through the roll out of all our innovative solutions will of course be dictated by customer demand. However, we expect to see similar or slightly increased deployments to those in recent years.
3.3.18 Trials Deriving Solutions
The most successful innovative solution to come through specific trials was ANM. We trialled our ANM solution on the Tier 2 Low Carbon Hub project.
The solution was further developed on equipment specification using shared best practice with other DNOs in particular.
We now have ANM contracts to multiple vendors. By using multiple vendors we keep competition active in this particular market, thereby keeping costs to customers and our business at their most competitive.
In addition to other innovation project successes we also derive innovative solutions through business as usual development.
3.0 Smart grids, innovation and our role in the low carbon transition
3.3.17 Forecast for roll-out of Active Network Management (ANM)We are releasing new ANM zones every six months. The full roll-out table is below.
GSP Group Active BSP Group Quoting from Building duringBicker Fen Skegness Active Active
Grendon Corby Northampton Active Active
Bridgwater All Active Active
West Burton Horncastle Active Active
Indian Queens Truro Active Active
Swansea North Swansea Active Active
Pembroke Pembroke Active Active
Cellarhead Meaford Active November 2018
Rassau Abergavenny Active November 2018
South Devon Landulph – Abham – Exeter GSPs Active January 2020
Feckenham Feckenham November 2018 April 2019
Aberthaw All Active April 2019
Staythorpe All November 2018 November 2019
Berkswell Warwick April 2019 April 2020
Axminster All April 2019 April 2020
Shrewsbury All April 2019 April 2020
Bishops Wood Hereford November 2019 November 2020
Rugeley All November 2019 November 2020
East Claydon All November 2019 November 2020
West Burton All November 2019 November 2020
Pyle Pyle April 2020 April 2021
Remaining GSPs requiring ANM.
Actual GSP will be dependent on applications and any resultant constraint.
January 2021 November 2021
Table 3.3.17

56Appendix AEast Midlands RRP Environmental Innovation 2018/19 South Wales RRP Environmental Innovation 2018/19 South West RRP Environmental Innovation 2018/19 West Midlands RRP Environmental Innovation 2018/19
Appendix BRRP Environmental Innovation Commentary 2018/19
Appendix

www.westernpower.co.uk @wpduk
Western Power Distribution (East Midlands) plc, No2366923Western Power Distribution (West Midlands) plc, No3600574
Western Power Distribution (South West) plc, No2366894Western Power Distribution (South Wales) plc No2366985
Registered in England and Wales Registered Office: Avonbank, Feeder Road, Bristol BS2 0TB
July 2018