Embed Size (px)
Citation preview
ARTICLE IN PRESS
Journal of Financial Economics 82 (2006) 591–629
0304-405X/$
doi:10.1016/j
$We than
Claessens, M
Paul Gompe
Kaplan, Nao
Robe, Robe
Woodruff, an
Emerging an
of Maryland
at the Worl
Philadelphia,
valuable com
Dijk for help
Dun & Brads
the Economy
study. We al
title ‘‘Busine
interpretation
World Bank,�CorrespoE-mail ad
www.elsevier.com/locate/jfec
Entry regulation as a barrier to entrepreneurship$
Leora Klappera, Luc Laevena,b, Raghuram Rajanc,d,e,�
aWorld Bank, 1818 H Street, NW, Washington, DC 20433, USAbCentre for Economic Policy Research, 90-98 Goswell Road, London EC1 V 7RR, UKcInternational Monetary Fund, 700 19th Street, NW, Washington, DC 20431, USA
dUniversity of Chicago Graduate School of Business, 5807 South Woodlawn Avenue, Chicago, IL 60637, USAeNational Bureau of Economic Research, 1050 Massachusetts Avenue, Cambridge, MA 02138, USA
Received 22 November 2004; received in revised form 30 August 2005; accepted 9 September 2005
Available online 27 June 2006
Abstract
Using a comprehensive database of European firms, we study the effect of market entry
regulations on the creation of new limited-liability firms, the average size of entrants, and the growth
of incumbent firms. We find that costly regulations hamper the creation of new firms, especially in
industries that should naturally have high entry. These regulations also force new entrants to be
- see front matter r 2006 Elsevier B.V. All rights reserved.
.jfineco.2005.09.006
k William Schwert, an anonymous referee, Allen Berger, Arnoud Boot, Nicola Cetorelli, Stijn
ihir Desai, Simeon Djankov, Alexander Dyck, Saul Estrin, Raymond Fisman, Nicola Gennaioli,
rs, Luigi Guiso, Stephen Haber, Robert Hauswald, Thomas Hellman, Simon Johnson, Steven
mi Lamoreaux, Joshua Lerner, Inessa Love, Vojislav Maksimovic, Atif Mian, Enrico Perotti, Michel
rta Romano, Jean-Laurent Rosenthal, Jan Svejnar, Scott Stern, Gregory Udell, Christopher
d seminar participants at the Fifth International Conference on Financial Market Development in
d Transition Economies in Hyderabad, American University, University of Amsterdam, University
, the NBER Corporate Finance Program Meeting at the University of Chicago, the SME Conference
d Bank, the Entrepreneurship Conference at Harvard Business School, the AEA meetings in
and the World Bank/NYU Workshop on Entry, Entrepreneurship, and Financial Development for
ments; Ying Lin and Victor Sulla for outstanding research assistance; Sebastian Roels at Bureau Van
with the Amadeus data; and Brian Williams and Ryan Paul at Dun & Bradstreet for help with the
treet data. Rajan thanks the National Science Foundation, the Center for the Study of the State and
at the Graduate School of Business, University of Chicago for research support during part of this
so thank the World Bank for financial support. An earlier version of this paper circulated under the
ss Environment and Firm Entry: Evidence from International Data.’’ This paper’s findings,
s, and conclusions are entirely those of the authors and do not necessarily represent the views of the
the IMF, their Executive Directors, or the countries they represent.
nding author. Fax: +1202 623 7271.
dress: [email protected] (R. Rajan).
ARTICLE IN PRESSL. Klapper et al. / Journal of Financial Economics 82 (2006) 591–629592
larger and cause incumbent firms in naturally high-entry industries to grow more slowly. Our results
hold even when we correct for the availability of financing, the degree of protection of intellectual
property, and labor regulations.
r 2006 Elsevier B.V. All rights reserved.
JEL classification: G18; G38; L51; M13
Keywords: Entrepreneurship; Business incorporation; Regulatory barriers; Economic growth
1. Introduction
Entrepreneurship is a critical part of the process of creative destruction that JosephSchumpeter (1911) argued is so important for the continued dynamism of the moderneconomy. That it helps economic growth has been documented in previous work (e.g.,Hause and Du Rietz, 1984; Black and Strahan, 2002). Yet a number of countries put inplace regulations that make it more difficult to start a new firm. Our focus in this paper ison the cost of meeting the regulatory requirements for setting up a limited liabilitycompany (we will use ‘‘entry costs’’ or ‘‘entry regulation’’ interchangeably since ourmeasure proxies for both). We study the effect of such entry regulations on (i) the creationof new firms, (ii) the average size of firms that finally are able to incorporate, and (iii) thedynamism of incumbent firms.We start by investigating the cross-country picture of new firm incorporation. We use a
comprehensive, recently released database of corporations across a number of developedand transition countries in Europe to assess this picture. Some facts are striking. Forinstance, one might believe that Italy, with its myriad small corporations, should havetremendous incorporation of new firms (we use ‘‘incorporation of new firms’’ and ‘‘entry’’interchangeably). Actually, the share of new corporations in Italy (the fraction ofcorporations that are one or two years old) is only 3.8% compared to 13.5% on averagefor France, Germany, and the United Kingdom.What might account for these differences? One potential explanation is the cost of
meeting the regulatory requirements for setting up a limited liability company. Why mightsuch regulations exist? The early debate on incorporation emphasized the risk that crooksmight register new companies with little capital and dupe unsuspecting investors orconsumers. For instance, The Times of London thundered against the principle of freeincorporation through limited liability in 1824:
Nothing can be so unjust as for a few persons abounding in wealth to offer a portionof their excess for the information of a company, to play with that excess for theinformation of a company—to lend the importance of their whole name and credit tothe society, and then should the funds prove insufficient to answer all demands, toretire into the security of their unhazarded fortune, and leave the bait to be devouredby the poor deceived fish (Halpern et al., 1980, p. 117).
Thus one motivation for requiring a firm to go through a detailed (and hence costly)bureaucratic process to register as a limited liability company is to screen out potentialfrauds and cheats. But there could be other motivations. For example, to the extent thatinformation is generated during the process, it could help the tax authorities improve

ARTICLE IN PRESSL. Klapper et al. / Journal of Financial Economics 82 (2006) 591–629 593
collections, or it could help improve the accuracy of various censuses and hence the publicdecision-making process.
More recently, however, there is a growing view that costly regulations impede thesetting up of businesses and stand in the way of economic growth (see De Soto, 1990;Djankov et al., 2002; World Bank, 2004). Do higher regulatory costs really have adverseeffects? While Djankov et al. (2002) find that countries with higher entry costs have morecorruption and larger unofficial economies—suggesting that the motivation for theseregulations is not entirely benign—they do not measure the direct impact or entry costs,which is our focus.
First, we study whether entry costs affect the extent of incorporation, a necessary firststep in determining whether these regulations have any effect. We focus on cross-industry,cross-country interaction effects. That is, we ask whether the fraction of new corporationsis lower in an industry with a higher ‘‘natural’’ propensity for entry when the country hashigher costs of complying with bureaucratic requirements for incorporation. Themethodology, following Rajan and Zingales (1998), enables us to finesse a number ofproblems associated with the more traditional cross-country regressions—such as theproblem that a healthy economy scores well on a number of cross-country variables, whichmakes it hard to estimate the direct effect of each variable in a cross-country regression(and equally hard to correct for all possible country variables that might matter). Byfocusing on interactions, we can absorb country-level variables and instead examine thedifferential effects of country-level variables across industries that might be mostresponsive to them. The downside of this methodology, of course, is that while it cantell us whether entry regulation works in predicted economic ways, it cannot tell us theoverall magnitude of the effect, only the relative magnitude on ‘‘naturally high-entry’’industries. But since our primary interest is in examining whether bureaucratic regulationsaffect entrepreneurship, this is not a major concern.
We find that the rate of new corporation creation in ‘‘naturally high-entry’’ industries isrelatively lower in countries with higher entry costs, suggesting that these costs matter.Interestingly, they matter most in richer countries, or countries that are not corrupt, wherethe regulations on the books are more likely to be enforced. Our findings suggest anexplanation for the low level of incorporation in Italy: the average direct cost associatedwith fulfilling the bureaucratic regulations for registering a new corporation in Italy is 20%of per capita GNP compared to 10% of per capita GNP on average for other G-7European countries.
Second, we study the effect of bureaucratic entry regulations on the average size ofentrant firms. Given that the high entry costs are largely fixed, they should be reflected inan increased average size of entrants into high-entry industries in countries with high costs.We indeed find this to be the case. The average value added of new firms in high-entryindustries is disproportionately higher in countries that have higher entry costs. Thismeans that not only do such regulations discourage small firms from setting up, they alsoforce others to grow without the protection of limited liability until they reach a scale thatmakes the cost of incorporation affordable.
If entry regulations indiscriminately screen out small young firms, which are the sourceof Schumpeterian waves of creative destruction, then constraints on their emergenceshould have a chilling effect on incumbents and mute the disciplinary effects ofcompetition, with older firms more likely to be lazy and less capable of enhancingproductivity. If, by contrast, entry regulations are effective at screening, older firms that

ARTICLE IN PRESSL. Klapper et al. / Journal of Financial Economics 82 (2006) 591–629594
have come through the screening process could be better firms and more able to increaseproductivity. We therefore ask whether entry regulations affect the productivity growth ofolder incumbent firms. We find that the growth in value added per employee for firms olderthan two years is relatively lower in naturally high-entry industries when the industry is ina country with higher bureaucratic barriers to entry, consistent with the hypothesis thatentry regulations indiscriminately screen out small young firms and inhibit the disciplinaryeffects of competition.One might also expect the effects of the absence of competition to become more
pronounced over time, with older incumbents in protected industries becoming far morereliant on the rents from incumbency than on efficiency gains. This is in fact the case.Value added per employee for older incumbents grows relatively more slowly in naturallyhigh-entry industries in countries with costly bureaucratic barriers, although this effect isabsent for young incumbents. Thus, costly entry regulations are a form of protection thathas the most deleterious effect on the performance of seasoned incumbents.In this regard, the comparison between high-entry-regulation Italy and the low-entry-
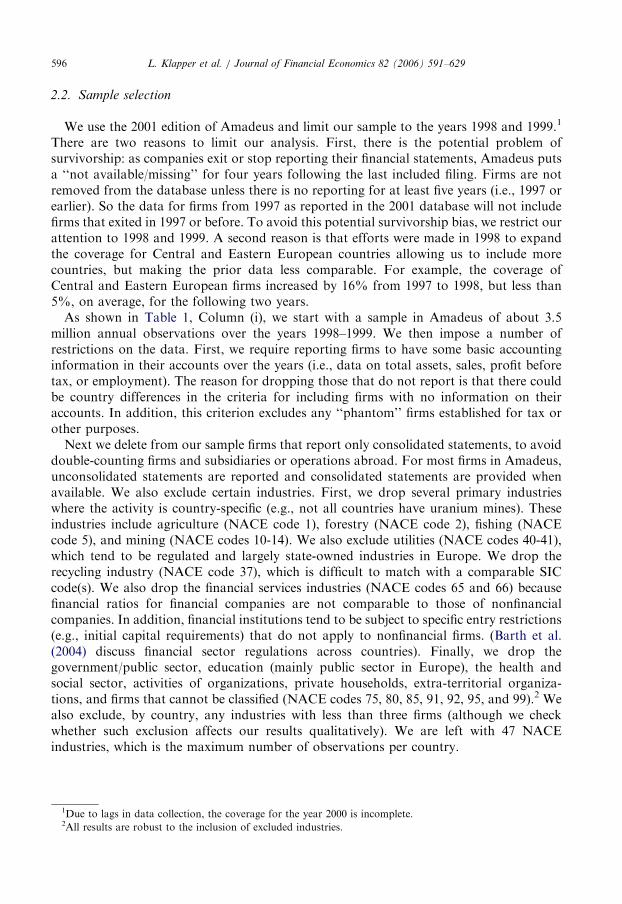
regulation United Kingdom is particularly telling. Across all industries, firms start outlarger when young in Italy, but grow more slowly so that firms in the United Kingdom areabout twice as large by age ten (Fig. 1). This suggests that Italy has small firms not becausethere is too much entry but because there is too little!Finally, to check whether entry regulations proxy for other aspects of the business
environment that are likely to have an impact on entry, such as financial development,labor regulation, and protection of intellectual property, we include these environmentalvariables interacted with the characteristics of the industry they are most likely toinfluence. We find that these aspects of the business environment do matter, but primarilyfor the rate of incorporation, and not for the size of entrants or the productivity growth ofincumbents. It is particularly noteworthy that the effect of entry regulations persistsdespite the inclusion of these other interactions.In a related paper, Desai et al. (2003) use a cross-country approach and also find that
entry regulations have a negative impact on firm entry. The cross-country approach has anumber of limitations. In particular, variations in coverage in the database across
Italy
United Kingdom
-
200,000
400,000
600,000
800,000
1,000,000
1,200,000
1,400,000
1,600,000
1 5 6 7 8 9 10 11 122 133 144 15
Age of the firm (years)
Val
ue a
dded
(U
S$)
Fig. 1. Firm size and age.
ARTICLE IN PRESSL. Klapper et al. / Journal of Financial Economics 82 (2006) 591–629 595
countries could affect findings, a criticism that is less applicable to a within-country, cross-industry approach. Nevertheless, their findings are complementary to ours. Anotherrelated cross-country study is by Scarpetta et al. (2002), who use firm-level survey datafrom OECD countries to analyze firm entry and exit. They find that higher product marketand labor regulations are negatively correlated with the entry of small and medium-sizedfirms SMEs) in OECD countries. Bertrand and Kramarz (2002) examine the expansiondecisions of French retailers following new zoning regulations introduced in France andfind a strong relation between increases in entry deterrence (such as rejection of expansionor entry decisions) and decreases in employment growth.
There is a substantial literature on entry into an industry (possibly by a firm fromanother industry) as distinguished from firm creation or entrepreneurship. It is the lattersense in which we use the term ‘‘entry.’’ It would take us too much out of our way todescribe the literature on industry entry, so we refer the reader to Gilbert (1989) for acomprehensive survey. Note that there are technological determinants of entry into anindustry such as minimum scale, etc., that also affect firm creation. We assume thesedeterminants carry over countries and are absorbed by industry indicators. Our focus is onenvironmental determinants of firm creation.
The paper proceeds as follows. In Section 2 we describe the data and in Section 3 wepresent the empirical methodology. We present the empirical results in Section 4. Section 5concludes.
2. Data
2.1. Amadeus database
Central to our analysis is the firm-level Amadeus database. Amadeus is a commercialdatabase provided by Bureau van Dijk. It contains financial information on over fivemillion private and publicly owned firms across 34 Western and Eastern Europeancountries. The database includes up to ten years of information per company, althoughcoverage varies by country. Amadeus is especially useful because it covers a large fractionof new and SME companies across all industries. The Amadeus database is created bycollecting standardized data received from 50 vendors across Europe. The local source forthese data is generally the office of the Registrar of Companies.
The Amadeus database includes firm-level accounting data in standardized financialformat for 22 balance sheet items, 22 income statement items, and 21 financial ratios. Theaccounts are transformed into a universal format to enhance comparison across countries,though coverage of these items varies across countries. We use period average exchangerates from the International Monetary Fund’s International Financial Statistics to convertall accounting data into U.S. dollars.
In addition to financial information, Amadeus also provides other firm-levelinformation. We use information on the year of incorporation to calculate the age ofthe firm. Amadeus also assigns companies a three-digit NACE code—the Europeanstandard of industry classification—which we use to classify firms and construct industrydummy variables. The NACE codes follow the NACE Revision 1 classification. In ouranalysis, we use NACE codes at a two-digit level so that we have a sufficient number offirms per industry.
ARTICLE IN PRESSL. Klapper et al. / Journal of Financial Economics 82 (2006) 591–629596
2.2. Sample selection
We use the 2001 edition of Amadeus and limit our sample to the years 1998 and 1999.1
There are two reasons to limit our analysis. First, there is the potential problem ofsurvivorship: as companies exit or stop reporting their financial statements, Amadeus putsa ‘‘not available/missing’’ for four years following the last included filing. Firms are notremoved from the database unless there is no reporting for at least five years (i.e., 1997 orearlier). So the data for firms from 1997 as reported in the 2001 database will not includefirms that exited in 1997 or before. To avoid this potential survivorship bias, we restrict ourattention to 1998 and 1999. A second reason is that efforts were made in 1998 to expandthe coverage for Central and Eastern European countries allowing us to include morecountries, but making the prior data less comparable. For example, the coverage ofCentral and Eastern European firms increased by 16% from 1997 to 1998, but less than5%, on average, for the following two years.As shown in Table 1, Column (i), we start with a sample in Amadeus of about 3.5
million annual observations over the years 1998–1999. We then impose a number ofrestrictions on the data. First, we require reporting firms to have some basic accountinginformation in their accounts over the years (i.e., data on total assets, sales, profit beforetax, or employment). The reason for dropping those that do not report is that there couldbe country differences in the criteria for including firms with no information on theiraccounts. In addition, this criterion excludes any ‘‘phantom’’ firms established for tax orother purposes.Next we delete from our sample firms that report only consolidated statements, to avoid
double-counting firms and subsidiaries or operations abroad. For most firms in Amadeus,unconsolidated statements are reported and consolidated statements are provided whenavailable. We also exclude certain industries. First, we drop several primary industrieswhere the activity is country-specific (e.g., not all countries have uranium mines). Theseindustries include agriculture (NACE code 1), forestry (NACE code 2), fishing (NACEcode 5), and mining (NACE codes 10-14). We also exclude utilities (NACE codes 40-41),which tend to be regulated and largely state-owned industries in Europe. We drop therecycling industry (NACE code 37), which is difficult to match with a comparable SICcode(s). We also drop the financial services industries (NACE codes 65 and 66) becausefinancial ratios for financial companies are not comparable to those of nonfinancialcompanies. In addition, financial institutions tend to be subject to specific entry restrictions(e.g., initial capital requirements) that do not apply to nonfinancial firms. (Barth et al.(2004) discuss financial sector regulations across countries). Finally, we drop thegovernment/public sector, education (mainly public sector in Europe), the health andsocial sector, activities of organizations, private households, extra-territorial organiza-tions, and firms that cannot be classified (NACE codes 75, 80, 85, 91, 92, 95, and 99).2 Wealso exclude, by country, any industries with less than three firms (although we checkwhether such exclusion affects our results qualitatively). We are left with 47 NACEindustries, which is the maximum number of observations per country.
1Due to lags in data collection, the coverage for the year 2000 is incomplete.2All results are robust to the inclusion of excluded industries.

ARTICLE IN PRESS
Table 1
Number of firms, corporations and employment, by country and year
(i) (ii) (iii)
Total Firms Total Corporations Total Employment
Country 1998 1999 1998 1999 1998 1999
Austria 25,243 27,170 18,224 19,684 737,114 717,498
Belgium 229,171 244,361 215,709 230,352 1,459,269 1,501,236
Bulgaria 28,272 38,840 17,004 21,167 1,113,907 1,116,755
Czech Republic 7,153 7,613 7,153 7,613 1,424,975 1,472,515
Denmark 72,989 82,639 68,906 77,720 902,078 961,128
Estonia 10,438 27,407 10,243 26,737 269,042 321,308
Finland 47,646 57,781 46,286 55,765 789,208 867,984
France 652,376 676,781 584,274 604,155 7,640,624 7,724,623
Germany 468,865 519,759 334,305 372,167 10,266,932 10,005,253
Greece 17,617 18,604 17,297 18,280 708,412 710,973
Hungary 29,397 17,404 25,731 15,794 854,131 751,858
Ireland 15,184 10,587 13,835 9,759 104,543 78,324
Italy 117,670 126,514 111,736 120,393 4,598,602 4,808,664
Latvia 2,433 2,681 2,244 2,482 226,195 232,865
Lithuania 1,123 1,247 1,113 1,228 180,049 144,779
Netherlands 145,634 153,430 145,454 153,276 587,366 581,869
Norway 104,836 115,804 104,836 115,804 991,191 1,059,226
Poland 10,605 10,309 8,668 8,451 2,667,816 2,423,589
Portugal 21,351 23,798 20,734 23,096 396,088 195,393
Romania 302,705 318,020 287,657 303,374 4,027,310 3,506,044
Spain 166,688 180,621 164,879 178,662 4,849,609 4,894,020
Sweden 193,333 204,936 193,333 204,936 1,931,973 2,022,113
UK 506,610 863,498 491,891 833,033 10,712,104 10,545,236
Total 3,218,450 3,770,760 2,896,065 3,408,713 58,289,265 57,511,010
This table summarizes (i) the total number of firms, (ii) the total number of corporations (plc and ltd, or their
equivalents) and (iii) employment from the Amadeus database. We exclude about 25,000 firms with no financial
data (i.e., inactive firms). The total employment figures exclude firms with missing employment in all years. We
use current employment figures to replace lagged employment figures if previous year(s) employment are missing
and extrapolate forward employment figures if current year(s) employment is missing.
L. Klapper et al. / Journal of Financial Economics 82 (2006) 591–629 597
Finally, we exclude all legal forms other than the equivalent of public and private limitedliability corporations.3 In particular, we exclude proprietorships and partnerships. Twoarguments prompt this. First, a big and common carrot behind registration as acorporation is limited liability, which allows entrepreneurs and investors to take risks. Bycontrast, the benefits of registration as other forms can vary considerably across countries,which will make the analysis harder to interpret. Second, the coverage of proprietorshipsand other unincorporated firms in Amadeus is poor and uneven: in most Europeancountries, only limited liability companies are required to file statements. However, mostEuropean countries require all limited liability corporations to file financial statements,
3We include Plc and Ltd in the UK, AG and GmbH in Germany, and SA and SARL in France and exclude the
GmbH & Co KG, which is a hybrid legal form (a combination of a partnership and a private limited company)
used in Austria and Germany. The results do not alter when we include the latter.

ARTICLE IN PRESSL. Klapper et al. / Journal of Financial Economics 82 (2006) 591–629598
which makes the coverage for corporations extensive and the best available. We use theinformation on legal form in Amadeus—which is country-specific—to identify public andprivate limited companies.In Appendix A, we summarize the cross-country differences in the collection of company
accounts in Amadeus. We exclude from our sample several European countries where thecoverage is incomplete or the data quality is poor. First, we exclude Switzerland, sincesmall firms are not required to file. Second, we exclude the countries of the formerRepublic of Yugoslavia (Bosnia-Herzegovina, Croatia, former Yugoslav Republic ofMacedonia, and Federal Republic of Yugoslavia), which were at war during our sampleperiod and where data coverage is limited. Third, we exclude Slovakia, Slovenia, Russia,and the Ukraine, which have only a very small number of total filings (i.e., less than 1,000firms annually). These restrictions exclude 342,216 firms over the two years (9.8% of totalfirms).As shown in Table 1, Column (ii), after applying these exclusion criteria, we have a
smaller, comprehensive sample of incorporated firms in a large number of Europeancountries, which enhances comparability across countries. These restrictions exclude342,216 firms over two years (9.8% of total firms). Our sample now has over three millionannual firms and 57 million employees.We are not done yet. We have national statistics from Eurostat (European Commission,
2003) on numbers of, and employment in, firms of different sizes. In Table 2, we comparethe ratio of firms and employment in Amadeus and in published national statistics inEurostat (European Commission, 2003). Data, by firm size, are unavailable for non-EUcountries. Columns (i) and (ii) show the coverage in Amadeus of large firms (the ratio offirms and employment at firms with more than 250 employees in Amadeus versus that innational statistics) and Columns (iii) and (iv) show the coverage of small firms (the ratio offirms and employment at firms with 10–50 employees in Amadeus versus that in nationalstatistics). Column (v) shows the absolute value of the difference between the ratio ofemployment in small firms to the ratio of employment in large firms in Amadeus less theratio of employment at small and large firms in national statistics. This ratio is used to testwhether our Amadeus sample is biased towards larger firms. The discrepancy betweenAmadeus and national figures can also be explained by: (1) the lack of employment datafor a significant number of firms in Amadeus, and (2) the fact that for the purpose of cross-country comparisons, our Amadeus dataset excludes proprietorships and partnerships.We exclude a country from our dataset if two conditions are met: (1) the ratio of
employment in firms with more than 250 employees in Amadeus to that in nationalstatistics (Column (ii)) is less than 50%, and (2) the absolute difference between the ratio ofthe number of firms with 10–50 employees in Amadeus versus that in national statisticsand the ratio of total employment at firms with 10–50 employees in Amadeus versus that innational statistics (Column (iv)) is more than 25%. Four countries do not meet the criteria:Iceland, Ireland, Luxembourg, and Portugal. Since these cutoffs could be consideredsomewhat arbitrary, we also test whether the qualitative results hold if we do not applythese criteria.We believe that our inclusion criteria create the most comparable sample of firms across
countries, but we should be cautious about deriving strong conclusions from direct cross-country comparisons. However, even if we have not eliminated all biases betweencountries, our basic test examines within-country differences across countries, and willnot be affected unless there are systematic biases in reporting industries within a country.

ARTICLE IN PRESS
Table 2
Comparison with National Statistics
(i) (ii) (iii) (iv) (v)
Coverage of large firms
by number of
Coverage of small firms
by number of
Relative
coverage of
small firms (%)
Country Firms (%) Employees (%) Firms (%) Employees (%)
Austria 44.4 38.7 54.6 65.2 10.6
Belgium 70.0 57.4 65.9 50.6 15.3
Denmark 100.0 77.2 63.3 73.1 9.8
Finland 125.0 90.2 39.0 42.4 3.4
France 65.2 54.2 66.8 57.8 9.0
Germany 34.3 39.0 47.4 49.5 2.1
Greece 200.0 84.4 58.0 97.7 39.7
Iceland 30.0 39.3 6.2 37.9 31.7
Ireland 33.3 14.8 23.1 67.9 44.8
Italy 57.9 78.5 45.3 100.0 54.7
Luxembourg 40.0 38.3 2.9 82.2 79.3
Netherlands 14.3 11.9 31.5 46.4 14.9
Portugal 33.3 20.5 12.8 117.5 104.7
Spain 83.3 98.6 53.2 99.0 45.8
Sweden 114.3 105.6 43.7 47.8 4.1
UK 85.1 79.4 8.6 31.0 22.4
This table compares the number of corporations in Amadeus in 1999 with the total number of firms according to
1996 data from Enterprises in Europe: 6th report (European Commission, 2003). The Amadeus ratios are
calculated using our extrapolated employment data. The national statistics (Eurostat) refer to all enterprises,
including proprietorships. Enterprises with zero employees are excluded from both samples. Enterprises in Europe
does not cover Eastern European countries, Norway, and Switzerland. In Column (i), we report the ratio of the
number of firms with more than 250 employees in Amadeus to the number of firms with more than 250 employees
in national statistics. In Column (ii), we report the ratio of total employment at firms with more than 250
employees in Amadeus to total employment at firms with more than 250 employees in national statistics. In
Column (iii), we report the ratio of the number of firms with 10–50 employees in Amadeus to the number of firms
with 10–50 employees in national statistics. In Column (iv), we report the ratio of total employment at firms with
10–50 employees in Amadeus to total employment at firms with 10–50 employees in national statistics. Column (v)
indicates whether there is a bias in the relative coverage of large (versus small) firms in Amadeus and is equal to
the absolute value of the difference between the ratio of employment in firms with 10–50 employees to
employment in firms with more than 250 employees in Amadeus and the ratio of employment in firms with 10–50
employees to employment in firms with more than 250 employees in national statistics. All data are shown as
percentages. Due to data unavailability, large firms in Iceland refer to firms with more than 100 (rather than 250)
employees.
L. Klapper et al. / Journal of Financial Economics 82 (2006) 591–629 599
Our final sample includes 3,371,073 firms in 21 countries: Austria, Belgium, Bulgaria, theCzech Republic, Denmark, Estonia, Finland, France, Germany, Greece, Hungary, Italy,Latvia, Lithuania, the Netherlands, Norway, Poland, Romania, Spain, Sweden, and theUnited Kingdom.
2.3. Industry-level entry variables
We measure entry as the fraction of new firms to the total number of firms in anindustry, where a new firm is defined as a firm that is one or two years old. We calculate

ARTICLE IN PRESSL. Klapper et al. / Journal of Financial Economics 82 (2006) 591–629600
entry at the two-digit NACE industry level averaged over the years 1998 and 1999. Werefer to this variable as Entry. For a complete list of variable names and definitions, seeAppendix B. Our empirical results are qualitatively robust to defining new firms as ageequal to one or to using entry rates calculated for one year (1998 or 1999) only.We require firms to survive at least one year and exclude firms in year 0. We exclude
firms less than one year old to avoid frivolous filings and because of the difference in initialfiling requirements across countries. In particular, in some countries firms in their first yeardo not have to file accounting information until after the end of their first year ofoperation, while in others they have up to one year to file. We check that the results are notqualitatively affected by including firms under one year old as new firms. The median shareof firms of age zero over the period 1998–1999 is 2.5%.
Table 3
Entry rates and main explanatory variables by country, average 1998–1999
(i) (ii) (iii)
Country % of new firms (1
and 2 years old)
Number of entry
procedures
Entry cost (% of
per capita GNP)
Austria 13.00 9 27.28
Belgium 11.58 8 9.98
Bulgaria 8.60 10 14.41
Czech Republic 11.55 10 8.22
Denmark 13.66 3 10.00
Estonia 20.41 n.a. n.a.
Finland 11.13 5 1.16
France 14.68 15 14.30
Germany 12.34 10 15.69
Greece 15.44 15 58.60
Hungary 17.38 8 85.87
Italy 3.46 16 20.02
Latvia 18.16 7 42.34
Lithuania 19.23 10 5.46
Netherlands 8.48 8 18.41
Norway 16.87 4 4.72
Poland 12.04 11 25.46
Romania 17.97 16 15.31
Spain 11.41 11 17.30
Sweden 7.90 6 2.56
UK 15.01 5 1.43
Averages
Western Europe 11.92 8.85 15.50
Transition countries 15.67 10.29 28.15
All countries 13.35 9.35 19.93
Column (i) shows entry rates of new firms in Amadeus, averaged by country for the period 1998–1999. We exclude
the agricultural, mining, utility, finance, and public sectors. We exclude country–industry observations based on
fewer than three firm observations. New firms are defined as corporations one and two years old. Columns (ii–iii)
show the number of entry procedures and entry costs as a percentage of per capita GNP, respectively (Djankov
et al., 2002). All data are shown as percentages.

ARTICLE IN PRESSL. Klapper et al. / Journal of Financial Economics 82 (2006) 591–629 601
In Table 3, we describe the country averages of the entry variables that we use in ouranalysis. We calculate entry and new firm employment rates for all firms. As shown inColumn (i), the average entry rate across industries and countries is about 13.3%. Since wedefine new firms as firms that are one or two years old, this is calculated over two years, onaverage, and corresponds to an average annual entry rate of about 6.6% (or 4.6% whenexcluding small firms). The entry rate varies from a high of 19.2% in Lithuania to a low of3.5% in Italy. Overall, we find an average of about 15.7% of new firms in EasternEuropean countries, as compared to 11.9% for Western European countries. Thisdifference reflects the recent emergence of a large number of private firms in the transitioneconomies.
Djankov et al. (2002) have data on the procedures that are officially required for anentrepreneur to obtain all necessary permits, and to notify and file with all requisiteauthorities, in order to legally operate a business. These data refer to 1999 and are shownin Column (ii). These procedures include (i) obtaining all the necessary permits andlicenses, and (ii) completing all the required inscriptions, verifications, and notifications toenable the company to start operation. To make the procedures and companiescomparable across countries, the survey assumes that the intent is to open a limitedliability company and that the founders complete all procedures themselves (withoutintermediaries). This means the entry barriers are likely to be more onerous for small firmswhere this latter assumption is likely to be true. We report in Table 3, Column (iii), thedirect costs of setting up a new business expressed as a percentage of per capita GNP inU.S. dollars. The cost of entry varies from a high of 86% of GNP per capita in Hungary toa low of 1% of GNP per capita in Finland and the U.K.
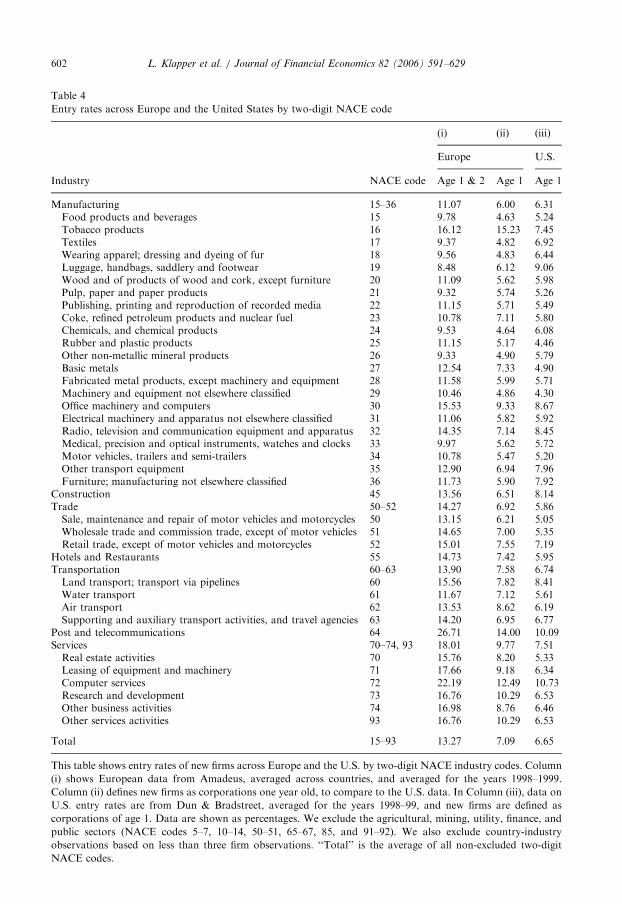
In Table 4, Column (i), we present entry rates for a selection of industries based on(groupings of) two-digit NACE codes. The highest entry rates are in communications(telephone, wireless, etc.), computer services, and services, with the lowest entry intochemical manufacturing, construction, and transportation. The industries with high entryrates are generally those related to the high-tech sector, which experienced global growthover the late 1990s. Industries with lower entry rates are those that similarly faced a globaldecline in the late 1990s (construction) as well as traditionally more concentrated industries(such as chemicals).
As a comparison, we calculate one-year entry rates in the United States from the Dun &Bradstreet (D&B) database of over seven million U.S. corporations over the period1998–1999. We refer to this variable as EntryUS. In Table 4, Column (iii), we present U.S.entry rates (EntryUS) for the same NACE codes. Complete two-digit NACE U.S. entry andexit rates are shown in Appendix C. We use the International Concordance between theU.S. 1987 SIC and the NACE Revision 1 industrial classifications to match the four-digitlevel SIC codes used by D&B with the two-digit level NACE codes used in Amadeus. As inEurope, we find similar high entry rates in the computer and communications industries inthe United States and low entry rates in industries such as manufacturing of basic metalsand machinery, suggesting common investment opportunity shocks in these industries.One way of conceptualizing our methodology (though not the only way) is that itessentially examines how different countries respond to these shocks.
In Table 5, we examine the size (measured by number of employees in Amadeus)distribution of entering firms, averaged over 1998 and 1999. An important caveat is thatthese data are less comprehensive since employment (which we need to classify firms) ismissing for about 38% of observations in our sample. The data confirm that most of the
ARTICLE IN PRESS
Table 4
Entry rates across Europe and the United States by two-digit NACE code
(i) (ii) (iii)
Europe U.S.
Industry NACE code Age 1 & 2 Age 1 Age 1
Manufacturing 15–36 11.07 6.00 6.31Food products and beverages 15 9.78 4.63 5.24Tobacco products 16 16.12 15.23 7.45Textiles 17 9.37 4.82 6.92Wearing apparel; dressing and dyeing of fur 18 9.56 4.83 6.44Luggage, handbags, saddlery and footwear 19 8.48 6.12 9.06Wood and of products of wood and cork, except furniture 20 11.09 5.62 5.98Pulp, paper and paper products 21 9.32 5.74 5.26Publishing, printing and reproduction of recorded media 22 11.15 5.71 5.49Coke, refined petroleum products and nuclear fuel 23 10.78 7.11 5.80Chemicals, and chemical products 24 9.53 4.64 6.08Rubber and plastic products 25 11.15 5.17 4.46Other non-metallic mineral products 26 9.33 4.90 5.79Basic metals 27 12.54 7.33 4.90Fabricated metal products, except machinery and equipment 28 11.58 5.99 5.71Machinery and equipment not elsewhere classified 29 10.46 4.86 4.30Office machinery and computers 30 15.53 9.33 8.67Electrical machinery and apparatus not elsewhere classified 31 11.06 5.82 5.92Radio, television and communication equipment and apparatus 32 14.35 7.14 8.45Medical, precision and optical instruments, watches and clocks 33 9.97 5.62 5.72Motor vehicles, trailers and semi-trailers 34 10.78 5.47 5.20Other transport equipment 35 12.90 6.94 7.96Furniture; manufacturing not elsewhere classified 36 11.73 5.90 7.92
Construction 45 13.56 6.51 8.14Trade 50–52 14.27 6.92 5.86Sale, maintenance and repair of motor vehicles and motorcycles 50 13.15 6.21 5.05Wholesale trade and commission trade, except of motor vehicles 51 14.65 7.00 5.35Retail trade, except of motor vehicles and motorcycles 52 15.01 7.55 7.19
Hotels and Restaurants 55 14.73 7.42 5.95Transportation 60–63 13.90 7.58 6.74Land transport; transport via pipelines 60 15.56 7.82 8.41Water transport 61 11.67 7.12 5.61Air transport 62 13.53 8.62 6.19Supporting and auxiliary transport activities, and travel agencies 63 14.20 6.95 6.77
Post and telecommunications 64 26.71 14.00 10.09Services 70–74, 93 18.01 9.77 7.51Real estate activities 70 15.76 8.20 5.33Leasing of equipment and machinery 71 17.66 9.18 6.34Computer services 72 22.19 12.49 10.73Research and development 73 16.76 10.29 6.53Other business activities 74 16.98 8.76 6.46Other services activities 93 16.76 10.29 6.53
Total 15–93 13.27 7.09 6.65
This table shows entry rates of new firms across Europe and the U.S. by two-digit NACE industry codes. Column
(i) shows European data from Amadeus, averaged across countries, and averaged for the years 1998–1999.
Column (ii) defines new firms as corporations one year old, to compare to the U.S. data. In Column (iii), data on
U.S. entry rates are from Dun & Bradstreet, averaged for the years 1998–99, and new firms are defined as
corporations of age 1. Data are shown as percentages. We exclude the agricultural, mining, utility, finance, and
public sectors (NACE codes 5–7, 10–14, 50–51, 65–67, 85, and 91–92). We also exclude country-industry
observations based on less than three firm observations. ‘‘Total’’ is the average of all non-excluded two-digit
NACE codes.
L. Klapper et al. / Journal of Financial Economics 82 (2006) 591–629602

ARTICLE IN PRESS
Table 5
Size distribution of new firms in Europe, by country and firm size, average of 1998 and 1999
(i) (ii) (iii) (iv)
Percentage of new corporations with employment:
Country o10 10–50 50–250 4 250
Austria 61.32 29.89 7.04 1.76
Belgium 91.18 7.44 1.17 0.20
Bulgaria 54.51 24.10 16.64 4.75
Czech Republic 28.18 34.83 29.39 7.60
Denmark 82.57 15.42 1.74 0.27
Estonia 77.39 19.36 2.72 0.53
Finland 87.37 9.70 2.30 0.63
France 90.91 8.00 0.93 0.16
Germany 80.50 16.05 2.71 0.74
Greece 54.54 40.42 4.49 0.54
Hungary 43.03 38.90 14.83 3.24
Ireland 7.89 34.54 52.30 0.00
Italy 66.18 23.21 8.35 2.25
Latvia 50.02 31.37 14.80 3.81
Lithuania 36.38 47.04 12.79 3.78
Netherlands 57.67 23.15 16.33 2.85
Norway 86.42 11.68 1.55 0.36
Poland 19.50 28.42 41.87 10.20
Portugal 50.87 28.35 16.50 4.28
Romania 92.07 6.02 1.44 0.46
Spain 68.06 27.54 3.82 0.58
Sweden 91.32 7.54 0.98 0.17
United Kingdom 70.14 17.18 9.83 2.85
Averages
Western Europe 69.80 20.01 8.67 1.18
Transition countries 50.14 28.76 16.81 4.30
All countries 62.96 23.05 11.50 2.26
This table shows the size distribution of new firms in Amadeus by country, averaged over the period 1998–99.
New firms are defined as corporations that are one or two years old. Columns indicate percentages of total new
corporations in a particular size category.
L. Klapper et al. / Journal of Financial Economics 82 (2006) 591–629 603
entry occurs in small firms. Interestingly, we find a greater fraction of new, larger firms inthe Eastern European transition countries. This might suggest that new, private firms areemerging across all size groups, rather than only among small firms. It could also reflect anumber of larger, state-owned firms that continue to be privatized and reincorporatedfollowing the transition. An exception to the transition countries is Romania, whichincludes over 200,000 firms with less than 10 employees. On average, about 63% of newfirms have fewer than ten employees, 23% have 10–50 employees, 12% have 50–250employees, and 2% have more than 250 employees. Since new firms in this largest categoryare likely to be existing firms that reincorporate following a merger or acquisition, wecheck that our qualitative results hold when we exclude new firms with more than 250employees.
ARTICLE IN PRESSL. Klapper et al. / Journal of Financial Economics 82 (2006) 591–629604
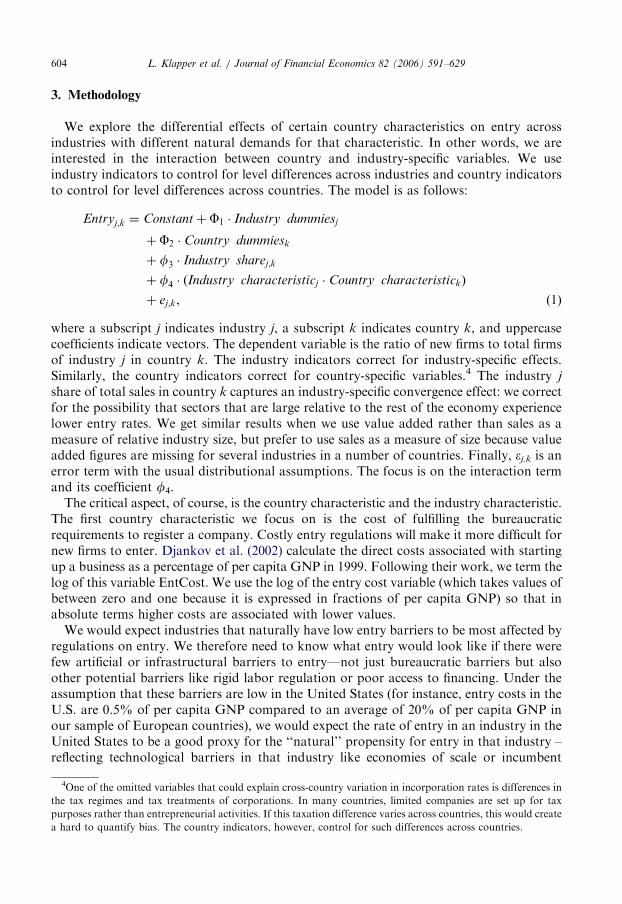
3. Methodology
We explore the differential effects of certain country characteristics on entry acrossindustries with different natural demands for that characteristic. In other words, we areinterested in the interaction between country and industry-specific variables. We useindustry indicators to control for level differences across industries and country indicatorsto control for level differences across countries. The model is as follows:
Entryj;k ¼ Constantþ F1 � Industry dummiesj
þ F2 � Country dummiesk
þ f3 � Industry sharej;k
þ f4 � ðIndustry characteristicj � Country characteristickÞ
þ ej;k, ð1Þ
where a subscript j indicates industry j, a subscript k indicates country k, and uppercasecoefficients indicate vectors. The dependent variable is the ratio of new firms to total firmsof industry j in country k. The industry indicators correct for industry-specific effects.Similarly, the country indicators correct for country-specific variables.4 The industry j
share of total sales in country k captures an industry-specific convergence effect: we correctfor the possibility that sectors that are large relative to the rest of the economy experiencelower entry rates. We get similar results when we use value added rather than sales as ameasure of relative industry size, but prefer to use sales as a measure of size because valueadded figures are missing for several industries in a number of countries. Finally, ej,k is anerror term with the usual distributional assumptions. The focus is on the interaction termand its coefficient f4.The critical aspect, of course, is the country characteristic and the industry characteristic.
The first country characteristic we focus on is the cost of fulfilling the bureaucraticrequirements to register a company. Costly entry regulations will make it more difficult fornew firms to enter. Djankov et al. (2002) calculate the direct costs associated with startingup a business as a percentage of per capita GNP in 1999. Following their work, we term thelog of this variable EntCost. We use the log of the entry cost variable (which takes values ofbetween zero and one because it is expressed in fractions of per capita GNP) so that inabsolute terms higher costs are associated with lower values.We would expect industries that naturally have low entry barriers to be most affected by
regulations on entry. We therefore need to know what entry would look like if there werefew artificial or infrastructural barriers to entry—not just bureaucratic barriers but alsoother potential barriers like rigid labor regulation or poor access to financing. Under theassumption that these barriers are low in the United States (for instance, entry costs in theU.S. are 0.5% of per capita GNP compared to an average of 20% of per capita GNP inour sample of European countries), we would expect the rate of entry in an industry in theUnited States to be a good proxy for the ‘‘natural’’ propensity for entry in that industry –reflecting technological barriers in that industry like economies of scale or incumbent
4One of the omitted variables that could explain cross-country variation in incorporation rates is differences in
the tax regimes and tax treatments of corporations. In many countries, limited companies are set up for tax
purposes rather than entrepreneurial activities. If this taxation difference varies across countries, this would create
a hard to quantify bias. The country indicators, however, control for such differences across countries.

ARTICLE IN PRESSL. Klapper et al. / Journal of Financial Economics 82 (2006) 591–629 605
organizational efficiencies obtained from experience. Of course, there is a degree ofheroism in assuming that entry in the United States does not suffer from artificial barriers(or even in assuming that there is a clear distinction between natural and artificial barriers).Nevertheless, all that is important for us is that the rank ordering of entry in the UnitedStates correspond to the rank ordering of natural barriers across industries, and that thisrank ordering carry over to other countries. We do, however, check the robustness of theresults to measures based on entry in other regions.
As a measure of industry share, we use the Amadeus database to construct the ratio ofthe industry’s sales to total sales of firms in the country. We refer to this variable asIndustry Share. We use the average of this variable for the years 1998–1999. We calculatethis country-industry level variable for two-digit NACE industries using data in Amadeus.These industry shares of total sales are expected to capture a potential convergence effect.
In the basic regression then, EntCost is our country characteristic and EntryUS is theindustry characteristic indicating whether the industry has ‘‘naturally high entry.’’ If, ashypothesized, bureaucratic entry requirements do have an effect, they should particularlyimpede entry in industries that are naturally prone to entry (or seen another way, entryinto an industry that is a natural monopoly should be little affected by the existence ofbureaucratic entry barriers). We thus expect coefficient f4 to be negative.
4. Results
4.1. Entry barriers and permutations
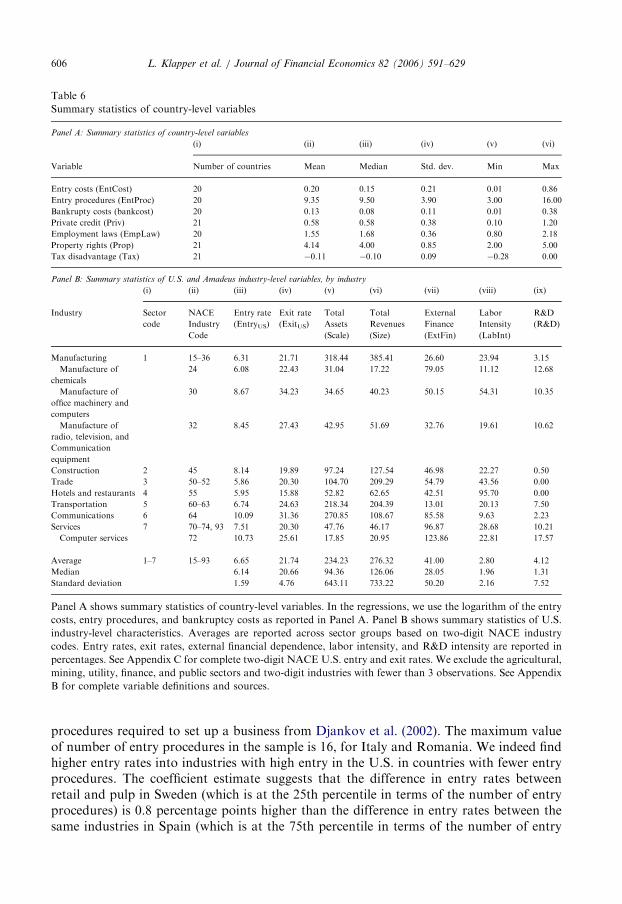
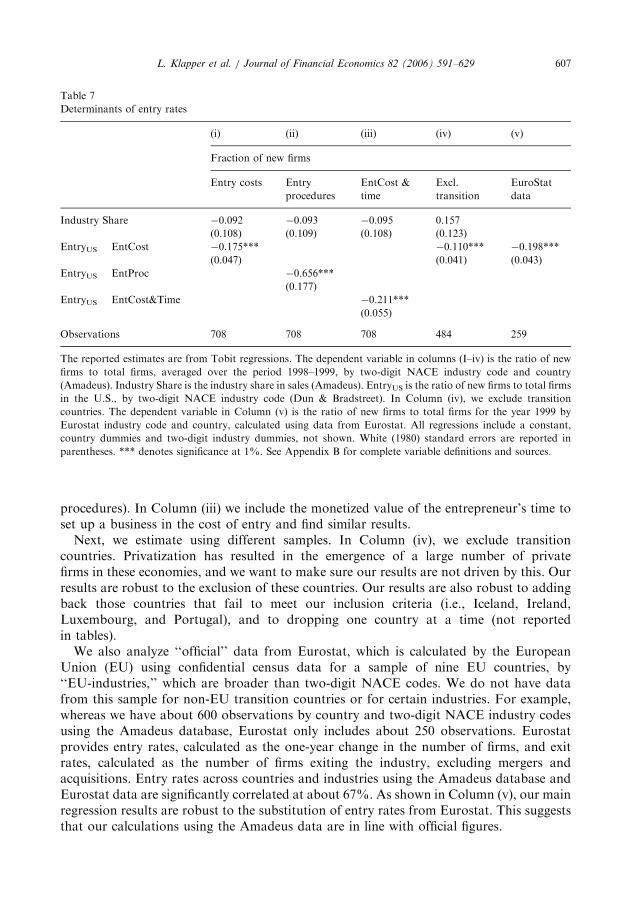
We report summary statistics for the country and industry level variables in Table 6. InTable 7, Column (i), we present the basic regression, estimated using a Tobit regressionwith censoring at zero and one. The coefficient of the interaction term is negative andsignificant at the 1% level. Since we use the log of entry cost, which takes values betweenzero and one, lower entry costs result in a more negative value for our entry cost variable.Together with the negative coefficient on the interaction term, this means that relativeentry into industries with naturally high entry is disproportionately higher in countrieswith low regulatory barriers to entry.
Since this is a difference-in-difference estimate, it is worth pointing out what thecoefficient means. Take an industry like retail trade (NACE code 52) that is at the 75thpercentile of EntryUS and an industry like manufacturing of pulp, paper, and paperproducts (NACE code 21) that is at the 25th percentile of EntryUS. The coefficient estimatesuggests that the difference in entry rates between retail and pulp in the Czech Republic(which is at the 25th percentile in terms of EntCost with entry costs equal to 8% of percapita GNP) is 0.5 percentage points higher than the difference in entry rates between thesame industries in Italy (which is at the 75th percentile in terms of EntCost with entry costsequal to 20% of per capita GNP). In other words, moving from Italy to the CzechRepublic benefits the high entry retail sector relatively more. As a comparison, the meandifference in entry rates between the retail and pulp industries across countries is 5%. Thissuggests that the effect of regulatory entry barriers accounts for about 10% of the meandifference.
Since this basic result is critical to any further analysis, we attempt to rule out otherexplanations of this result by conducting a variety of robustness checks. In Column (ii) weuse as an alternative measure of entry regulation the logarithm of the number of
ARTICLE IN PRESS
Table 6
Summary statistics of country-level variables
Panel A: Summary statistics of country-level variables
(i) (ii) (iii) (iv) (v) (vi)
Variable Number of countries Mean Median Std. dev. Min Max
Entry costs (EntCost) 20 0.20 0.15 0.21 0.01 0.86
Entry procedures (EntProc) 20 9.35 9.50 3.90 3.00 16.00
Bankrupty costs (bankcost) 20 0.13 0.08 0.11 0.01 0.38
Private credit (Priv) 21 0.58 0.58 0.38 0.10 1.20
Employment laws (EmpLaw) 20 1.55 1.68 0.36 0.80 2.18
Property rights (Prop) 21 4.14 4.00 0.85 2.00 5.00
Tax disadvantage (Tax) 21 �0.11 �0.10 0.09 �0.28 0.00
Panel B: Summary statistics of U.S. and Amadeus industry-level variables, by industry
(i) (ii) (iii) (iv) (v) (vi) (vii) (viii) (ix)
Industry Sector
code
NACE
Industry
Code
Entry rate
(EntryUS)
Exit rate
(ExitUS)
Total
Assets
(Scale)
Total
Revenues
(Size)
External
Finance
(ExtFin)
Labor
Intensity
(LabInt)
R&D
(R&D)
Manufacturing 1 15–36 6.31 21.71 318.44 385.41 26.60 23.94 3.15
Manufacture of
chemicals
24 6.08 22.43 31.04 17.22 79.05 11.12 12.68
Manufacture of
office machinery and
computers
30 8.67 34.23 34.65 40.23 50.15 54.31 10.35
Manufacture of
radio, television, and
Communication
equipment
32 8.45 27.43 42.95 51.69 32.76 19.61 10.62
Construction 2 45 8.14 19.89 97.24 127.54 46.98 22.27 0.50
Trade 3 50–52 5.86 20.30 104.70 209.29 54.79 43.56 0.00
Hotels and restaurants 4 55 5.95 15.88 52.82 62.65 42.51 95.70 0.00
Transportation 5 60–63 6.74 24.63 218.34 204.39 13.01 20.13 7.50
Communications 6 64 10.09 31.36 270.85 108.67 85.58 9.63 2.23
Services 7 70–74, 93 7.51 20.30 47.76 46.17 96.87 28.68 10.21
Computer services 72 10.73 25.61 17.85 20.95 123.86 22.81 17.57
Average 1–7 15–93 6.65 21.74 234.23 276.32 41.00 2.80 4.12
Median 6.14 20.66 94.36 126.06 28.05 1.96 1.31
Standard deviation 1.59 4.76 643.11 733.22 50.20 2.16 7.52
Panel A shows summary statistics of country-level variables. In the regressions, we use the logarithm of the entry
costs, entry procedures, and bankruptcy costs as reported in Panel A. Panel B shows summary statistics of U.S.
industry-level characteristics. Averages are reported across sector groups based on two-digit NACE industry
codes. Entry rates, exit rates, external financial dependence, labor intensity, and R&D intensity are reported in
percentages. See Appendix C for complete two-digit NACE U.S. entry and exit rates. We exclude the agricultural,
mining, utility, finance, and public sectors and two-digit industries with fewer than 3 observations. See Appendix
B for complete variable definitions and sources.
L. Klapper et al. / Journal of Financial Economics 82 (2006) 591–629606
procedures required to set up a business from Djankov et al. (2002). The maximum valueof number of entry procedures in the sample is 16, for Italy and Romania. We indeed findhigher entry rates into industries with high entry in the U.S. in countries with fewer entryprocedures. The coefficient estimate suggests that the difference in entry rates betweenretail and pulp in Sweden (which is at the 25th percentile in terms of the number of entryprocedures) is 0.8 percentage points higher than the difference in entry rates between thesame industries in Spain (which is at the 75th percentile in terms of the number of entry
ARTICLE IN PRESS
Table 7
Determinants of entry rates
(i) (ii) (iii) (iv) (v)
Fraction of new firms
Entry costs Entry
procedures
EntCost &
time
Excl.
transition
EuroStat
data
Industry Share �0.092 �0.093 �0.095 0.157
(0.108) (0.109) (0.108) (0.123)
EntryUS � EntCost �0.175*** �0.110*** �0.198***
(0.047) (0.041) (0.043)
EntryUS � EntProc �0.656***
(0.177)
EntryUS � EntCost&Time �0.211***
(0.055)
Observations 708 708 708 484 259
The reported estimates are from Tobit regressions. The dependent variable in columns (I–iv) is the ratio of new
firms to total firms, averaged over the period 1998–1999, by two-digit NACE industry code and country
(Amadeus). Industry Share is the industry share in sales (Amadeus). EntryUS is the ratio of new firms to total firms
in the U.S., by two-digit NACE industry code (Dun & Bradstreet). In Column (iv), we exclude transition
countries. The dependent variable in Column (v) is the ratio of new firms to total firms for the year 1999 by
Eurostat industry code and country, calculated using data from Eurostat. All regressions include a constant,
country dummies and two-digit industry dummies, not shown. White (1980) standard errors are reported in
parentheses. *** denotes significance at 1%. See Appendix B for complete variable definitions and sources.
L. Klapper et al. / Journal of Financial Economics 82 (2006) 591–629 607
procedures). In Column (iii) we include the monetized value of the entrepreneur’s time toset up a business in the cost of entry and find similar results.
Next, we estimate using different samples. In Column (iv), we exclude transitioncountries. Privatization has resulted in the emergence of a large number of privatefirms in these economies, and we want to make sure our results are not driven by this. Ourresults are robust to the exclusion of these countries. Our results are also robust to addingback those countries that fail to meet our inclusion criteria (i.e., Iceland, Ireland,Luxembourg, and Portugal), and to dropping one country at a time (not reportedin tables).
We also analyze ‘‘official’’ data from Eurostat, which is calculated by the EuropeanUnion (EU) using confidential census data for a sample of nine EU countries, by‘‘EU-industries,’’ which are broader than two-digit NACE codes. We do not have datafrom this sample for non-EU transition countries or for certain industries. For example,whereas we have about 600 observations by country and two-digit NACE industry codesusing the Amadeus database, Eurostat only includes about 250 observations. Eurostatprovides entry rates, calculated as the one-year change in the number of firms, and exitrates, calculated as the number of firms exiting the industry, excluding mergers andacquisitions. Entry rates across countries and industries using the Amadeus database andEurostat data are significantly correlated at about 67%. As shown in Column (v), our mainregression results are robust to the substitution of entry rates from Eurostat. This suggeststhat our calculations using the Amadeus data are in line with official figures.

ARTICLE IN PRESSL. Klapper et al. / Journal of Financial Economics 82 (2006) 591–629608
4.2. Robustness to outliers
Our estimation strategy can be thought of as a difference-in-difference estimation, wherewe divide the countries into two groups: high entry regulation (HR) and low entryregulation (LR) groups, and the industries into high entry (HE) and low entry (LE) groups.If we abstract away from any control variables, our estimate is: [HE(HR) – LE(HR)] –[HE(LR) – LE(LR)]. This estimate captures the average effect only. For robustness, weemploy a similar non-parametric difference-in-difference estimation strategy to investigatewhether the effect is generally present in all countries and industries.5 We report the resultsof this procedure but do not include a separate table.We first divide the countries into HR and LR, and then rank the industries from the
lowest natural entry to the highest. Next, we pick the lowest natural entry industry (LWE)as our reference industry, and repeat the difference-in-difference estimation above for eachremaining industry J, i.e., we compute: [J(HR) – LWE(HR)] – [(J(LR) – LWE(LR)], foreach industry J. The effect is strongest for the computer and related activities (NACE 72)and post and telecommunications (NACE 64) industries. We also find that the effect tendsto be larger for industries with higher natural entry.Next, we repeat the exercise for countries, i.e., we divide industries into low entry (LE)
and high entry (HE), and order countries from lowest to highest entry regulation.Again, we find that the average effect is consistent with our main results. The effect isstrongest for Norway and the United Kingdom. What is reassuring is that no singleindustry or country appears to be driving the results. In particular, the results in Table 7are also robust to (i) the exclusion of Italy, a developed country with relatively high entrybarriers, and (ii) the exclusion of the following information technology-intensiveindustries: manufacture of communication equipment (NACE 32) and computer andrelated activities (NACE 72).
4.3. Alternative measures
In Table 8 we examine alternatives to U.S. entry rates as measures of the naturalpropensity to enter. Prior literature (Dunne et al., 1988) finds that exit rates and entry ratesare strongly correlated—the more there is creation through young firms, the moredestruction there also is. In Column (i) we calculate ExitUS, which is the share of firms thatexit in the U.S. D&B data measured by the number of firms that exit in year t (because ofclosure or acquisition) as a percentage of all firms in year t-1. This measure is averaged forthe industry over the period 1998–1999. ExitUS should serve as a proxy for ‘‘natural entry’’and when we replace EntryUS with it in the regression, the interaction has the expectednegative sign and is significant (this also suggests that our industry characteristics are notjust picking up growth opportunities in the industry but some measure of the industry’snatural dynamism).One might think it obvious that bureaucratic costs would deter entry. What about other
costs that weigh on entrants? For example, we expect that firms are more likely to enterand receive start-up financing if bankruptcy proceedings are less costly in the case ofdefault. As a measure of bankruptcy costs, we use the actual cost of bankruptcyproceedings as the percentage of the estate that is consumed in bankruptcy proceedings
5We thank Atif Mian for this suggestion.

ARTICLE IN PRESS
Table 8
Alternative proxies for natural propensity to enter
(i) (ii) (iii) (iv) (v) (vi) (vii) (viii) (ix)
Exit Bankruptcy Taxes SME Scale Size UK Europe
Industry Share �0.081 �0.083 �0.108 �0.083 �0.087 �0.088 �0.074 �0.143 �0.105
(0.109) (0.108) (0.109) (0.109) (0.109) (0.109) (0.109) (0.111) (0.107)
Exit � EntCost �0.032**
(0.015)
EntryUS � BankCost �3.491***
(0.863)
EntryUS � EntCost �0.207***
(0.050)
EntryUS � Tax �2.429**
(1.228)
SME � EntCost �0.007*
(0.004)
Scale � EntCost 0.002***
(0.001)
Size � EntCost 0.002***
(0.001)
EntryUS, 1990�2000 � EntCost �0.142**
(0.064)
EntryUK � EntCost �0.095***
(0.022)
EntryEurope � EntCost �0.094***
(0.015)
Observations 708 708 708 708 708 708 708 670 708
The reported estimates are from Tobit regressions. The dependent variable is the ratio of new firms to total firms,
averaged over the period 1998–1999, by two-digit NACE industry and country (Amadeus). Industry Share is the
industry share in sales (Amadeus). Exit is exit rates of U.S. firms, averaged over the period 1998–1999, by NACE
industry (Dun & Bradstreet). EntCost is country-level entry cost (Djankov et al., 2002). EntryUS is the ratio of
new firms to total firms in the U.S., by NACE industry (Dun & Bradstreet) BankCost is the country-level
bankruptcy cost (Djankov et al., 2003). Tax is the difference between the top corporate income and personal
income tax rates in the country (PricewaterhouseCoopers). SME is the percentage of U.S. firms with fewer than
250 employees, averaged over the period 1998–1999, by NACE industry (D & B). Scale is the median assets of
U.S. firms, averaged over the period 1998–1999, by NACE industry (Compustat). Size is the median sales of U.S.
firms, averaged over the period 1998–1999, by NACE industry (Compustat). EntryUS, 1990–2000 is the entry rate of
U.S. firms, averaged over the period 1990–2000, by NACE industry (D & B). EntryUK is the entry rate of U.K.
firms, averaged over the period 1998–1999, by NACE industry (Amadeus). EntryEurope is the entry rate of firms in
Europe, averaged over the period 1998–1999, by NACE industry (Amadeus). All regressions include a constant,
and country and industry dummies, not shown. See Appendix B for complete variable definitions and sources.
White (1980) standard errors are reported in parentheses. *, **, and *** denote significant at 10%, 5%, and 1%,
respectively.
L. Klapper et al. / Journal of Financial Economics 82 (2006) 591–629 609
(Djankov et al., 2003). We find that entry is higher in high-entry industries in countrieswith lower cost of bankruptcy (Column (ii) in Table 8).
Another form of entry barrier is the differential income taxes for corporations comparedto individuals, which can cause a tax penalty and make incorporation unattractive.In Column (iii) we include the interaction between EntryUS and Tax Disadvantage,which is defined as the difference between the top corporate income tax and the toppersonal income tax rates in the country (obtained from PricewaterhouseCoopers
ARTICLE IN PRESSL. Klapper et al. / Journal of Financial Economics 82 (2006) 591–629610
Worldwide Taxes 1999–2000).6 We find that entry is significantly higher in high-entryindustries in countries where tax rates on corporate income are much lower than those onpersonal income.In Column (iv) we use the D& B data to calculate SME, which is the ratio of the number
of Small and Medium Enterprises (SMEs), defined as businesses with less than 250employees, to the total number of firms. Since new firms are generally also small, we expectgreater entry into industries with larger shares of smaller firms. Indeed, we find asignificantly negative coefficient, suggesting that higher entry costs discourage entry intoindustries with larger shares of SMEs. In Columns (v–vi), we use firm size as the industrycharacteristic. We use Compustat data of U.S. listed firms to calculate SCALE as the log ofmedian assets of firms in an industry and SIZE as the log of median total sales. Assets andsales take values less than one (they are divided by 10 billion US dollars) so that the log is anegative number, and more negative values denote industries with firms of smaller size. Sinceentry costs are more negative when low, the positive coefficient estimate indicates thatsmaller scale/average size industries have relatively more entry in low entry cost countries.Next, we examine the persistence of U.S. entry rates. Dunne and Roberts (1991) and
Cable and Schwalbach (1991) study U.S. and international data, respectively, and find thatthe relation between industry characteristics and industry turnover patterns is stable overtime. These results suggest stability of industry structures over time and countries.However, for robustness we compute the average of annual D & B entry rates of U.S.corporations from 1990–2000 (EntryUS, 1990–2000). The raw correlation between U.S. entryrates in 1998–1999 – the variable in the baseline regression—and U.S. entry rates over the1990s is 0.32 and significant at the 5% level. When we replace the EntryUS variables withEntryUS, 1990�2000, we find that the coefficient on the interaction term remains highlysignificant and of similar magnitude (Column (vii) in Table 8).Finally, it could be that our results are driven by the peculiarities of industry structure in
the U.S. Our method should work so long as we measure entry rates in a country wherebarriers to entry are thought to be small. In Column (viii), we use entry rates calculated forfirms in the United Kingdom (EntryUK). There are important differences between the UnitedKingdom and the U.S. For instance, the United Kingdom’s bankruptcy system is morecreditor-friendly and the composition of its industries is different. Nevertheless, thecorrelation between entry rates in the U.S. and in the United Kingdom is 0.60 andsignificant at the 1% level. The regression results (excluding industries of the UnitedKingdom) show that the coefficient on the interaction term remains highly significant.Column (ix) shows that our results are also robust to using entry rates calculated using firmsacross all European countries in our sample (EntryEurope). The correlation between entry ratesin the U.S. and the average entry rate across Europe is 0.60 and significant at the 1% level.
4.4. Causality
We have not fully addressed the issue of causality. We know the findings do not arisebecause there are fewer high natural entry industries in countries with high bureaucraticentry barriers—this is the virtue of correcting for industry effects. But there could beomitted variables that jointly drive the propensity to enter and the degree of bureaucratic
6Our measure of tax disadvantage differs from the measure used in Gordon and MacKie-Mason (1997) which
takes taxation of corporate dividends into account.
ARTICLE IN PRESSL. Klapper et al. / Journal of Financial Economics 82 (2006) 591–629 611
entry barriers. One way to test the direction of causality is to use instruments. It has beengenerally found that the origin of a country’s legal system seems to be strongly associatedwith the regulatory system in place today (see, for example, La Porta et al., 1999). Whilethere has been some debate about the precise mechanism by which this association exists, acountry’s legal origin offers a proxy for predetermined components of regulation. Whenwe instrument entry regulation with legal origin, we find that the coefficient estimate forthe interaction term is highly significant, the same sign and approximately the samemagnitude as shown earlier in Table 7 (Column (i) in Table 9). The legal origin variablesexplain 59% of the variation in the entry cost variable. Entry costs tend to be lowest incountries with Anglo-Saxon and Scandinavian legal origin and highest in countries withFrench legal origin.
The instrumental variable approach might still not fully address the causality problem: itcould be that countries with large ‘‘high natural entry’’ industries have a strongentrepreneurial culture and select low entry regulation. (If legal origin also drivesentrepreneurial culture, the instrument could be pre-determined, but might not satisfy theexclusion restriction—it might be correlated with other omitted variables that determineentry.) A crude way to correct for this is to include the interaction between EntryUS andthe aggregate rate of entry in the country (the fraction of new firms to total firms). If theaggregate rate of entry proxies for entrepreneurial culture, and so do entry costs, theinclusion of this new interaction variable should reduce the magnitude of the estimatedcoefficient on the basic interaction significantly. It does not (see Table 9, Column (ii)).
Another approach is to check whether the result holds when we restrict the sample toindustries that are relatively small. These industries are unlikely to be responsible for theentry barriers since they have limited political clout. For each country, industries aredefined to be small if their Industry Share is in the country’s bottom textile in IndustryShare. When we restrict our sample to small industries, we still find a strongly significantinteraction coefficient of approximately the same magnitude as shown earlier in Table 7(Column (iii) in Table 9). This suggests that industries that are unlikely to be responsiblefor the entry regulations are equally affected by it.
While entry regulation is not strongly correlated with economic development (asmeasured by per capita GDP) in our sample, we also confirm that our results are robust tothe inclusion of the interaction of EntryUS and the logarithm of per capita GDP (Column(iv) in Table 9). We have also checked whether the results are robust to controlling forgrowth opportunities. Following Fisman and Love (2003b), we use industry-level U.S.sales growth over the period 1990–2000 as proxy for industry growth opportunities. Ourentry interaction variable still enters significantly at the 1% level when we add theinteraction between U.S. sales growth and entry costs (not shown). We get similar resultswhen we calculate average U.S. sales growth for the period 1980–1990.
Another concern is that countries with more untrustworthy populations erect higherbureaucratic barriers so as to screen would-be entrepreneurs more carefully. If this weretrue, bureaucratic barriers might affect entry, and might cause incumbents to become fatand lazy, but this is necessary because the alternative of unrestricted entry by charlatanswould be much worse. One way to address this concern is to check whether the underlyingpopulation results in differential selection. More developed countries have better-developed information systems, better product inspections and quality control, bettercontract and law enforcement, and consequently, an entrepreneurial population lessinclined to misbehavior. (The underlying population in wealthier countries might also be

ARTICLE IN PRESSTable
9
Causality
andselectionissues
(i)
(ii)
(iii)
(iv)
(v)
(vi)
(vii)
IV:Legalorigin
Country-average
entry
Smallindustries
Development
GDP
Corruption
Inform
al
sector
Industry
Share
�0.092
�0.089
�3.704*
�0.128
�0.110
�0.117
�0.143
(0.090)
(0.108)
(2.085)
(0.107)
(0.108)
(0.108)
(0.108)
EntryUS�
EntC
ost
�0.175***
�0.164***
�0.191**
�0.186***
�0.173***
(0.055)
(0.048)
(0.093)
(0.046)
(0.046)
EntryUS�
Country-averageEntry
2.730
(2.672)
EntryUS�
GDPper
capita
0.419***
(0.092)
Low
GDPper
capita�
EntryUS�
EntC
ost
0.087
(0.127)
HighGDPper
capita�
EntryUS�
EntC
ost
�0.170***
(0.047)
HighCorruption�
EntryUS�
EntC
ost
0.186
(0.128)
Low
Corruption�
EntryUS�
EntC
ost
�0.168***
(0.047)
EntryUS�
Inform
al
�0.057***
(0.013)
Observations
708
708
214
708
708
708
708
This
table
showsaninstrumentalvariable
regressionwithrobust
errors
(Column(i))
andTobit
regressionswithcensoringat0and1(C
olumns(ii–viii)).
The
dependentvariableistheratioofnew
firm
sto
totalfirm
s,averaged
over
theperiod1998–1999,bytw
o-digitNACEindustry
codeandcountry.In
column(i),weuse
thelegalorigin
variablein
LaPortaet
al.(1998)asinstrumentforentryregulations.Thestandard
errors
are
correctedforclusteringatthecountrylevel.Column(ii)
includes
aninteractionofindustry-level
U.S.entryandtheaverageentryrate
forthecountryasawhole.Column(iii)showsTobitregressionswiththesample
restricted
toindustries
thatare
inthecountry’sbottom
tertilein
industry
share.Column(iv)includes
aninteractionofindustry-levelentryandthelogarithm
ofper
capitaGDPin
thecountry.Columns(v-vi)showTobitresultswhen
weestimate
differentslopes
fortheinteractionvariablesforwhether
theindustry
isin
acountry
beloworabovethesamplemedianper
capitaincome(lowGDPper
capitaandhighGDPper
capita),oraboveorbelowthesamplemedianlevelofcorruption(high
corruptionandlow
corruption).Column(vii)includes
aninteractionofindustry-level
entryandtheshare
oftheinform
aleconomyin
thecountry(Inform
al)from
Schneider
(2002).Allregressionsincludeaconstantandcountryandindustry
dummies,notshown.See
Appendix
Bforcomplete
variable
definitionsandsources.
White(1980)standard
errors
are
reported
inparentheses.*,**,and***denote
significantat10%
,5%
,and1%
,respectively.
L. Klapper et al. / Journal of Financial Economics 82 (2006) 591–629612

ARTICLE IN PRESSL. Klapper et al. / Journal of Financial Economics 82 (2006) 591–629 613
socialized to be more honest (less adverse selection) but for our purposes it is onlynecessary that the richer infrastructure gives them more incentive to behave, so there is lessneed for screening.) If bureaucratic rules are meant to screen entry efficiently, we shouldexpect them to be particularly effective in low-income countries relative to high-incomecountries. In Column (v) of Table 9 we estimate different slopes for the interaction variablefor whether the industry is in a country that is above or below the sample median percapita income. If, in fact, entry regulations screen more effectively in low-income countrieswhere there is less alternative infrastructure to assure compliance, we should find thecoefficient estimate for the interaction in below-sample-median income countries to besignificantly more negative. It is not.7 Similarly, we find that entry barriers work mosteffectively in preventing entry in low-corruption countries rather than in high-corruptioncountries (Column (vi) in Table 9), suggesting that they do not help select more carefullyamongst an untrustworthy population.
Taken together, these results suggest that the regulation of entry seems to have causaleffects, more so in wealthy countries or countries that are not corrupt than in poor orcorrupt countries. Thus, it is unlikely that these regulations are particularly effective inscreening populations in countries where other formal screening mechanisms do not existor where the population is more likely to be untrustworthy.
Finally, we are concerned that there could be a high degree of underreportingof new firms, since we measure entry only into the formal sector. In countries wherefor tax avoidance and other reasons it is attractive to remain informal, we expectto see less entry into the formal sector and fewer firms choosing the legal form ofa limited liability company. The correlation between our measure of the informal sector(Informal) calculated as the size of the informal economy as a percentage of officialGNI averaged over the period 1999–2000 and the cost of entry regulations (EntCost)is 0.37 although not statistically significant at the 10 percent level. In column (vii), weinclude an interaction of EntryUS and a measure of the share of the informal economy(Informal).
The coefficient estimate for the interaction between EntryUS and Informal is negativeand statistically significant, suggesting that underreporting of new firms is more likely inhigh-entry industries in countries with an inhospitable business environment. However,our main interaction variable between EntryUS and EntCost remains highly significant andvirtually unchanged in magnitude, suggesting that bureaucratic regulations have anindependent effect over and above the effects of the inhospitable environment. This is notparticularly surprising in light of our finding that bureaucratic regulations have the mostimpact in developed and less corrupt countries, which are unlikely to have an inhospitablebusiness environment.
4.5. The consequences of preventing free entry
Entry regulations, at least in the way we measure them, could be thought of as a fixedcost. They should be reflected in an increased average size of entrants into high-entryindustries in countries with high entry costs. In Table 10, Panel A, Column (i), thedependent variable is the average size of entrants (measured as the logarithm of average
7When allowing for different slopes for transition versus non-transition countries, we find a stronger effect for
non-transition countries, i.e., for countries where we expect a stronger legal system etc. (not shown).
ARTICLE IN PRESSL. Klapper et al. / Journal of Financial Economics 82 (2006) 591–629614
value added in millions of Euros in industry i in country j over the period 1998–1999,where value added is computed as earnings before interest, taxes, depreciation, andamortization, plus labor costs). The explanatory variables are the standard ones. We findthat the average size of entering firms is indeed significantly higher in high-entry industriesin countries with high entry costs. A one standard deviation increase in entry costs raisesthe average size of entrants by 0.78 million euros in an industry that is one standarddeviation higher in natural entry rate, a substantial magnitude when compared to themedian size of entrants across industries of 0.87 million euros.While some of the lower entry we have found earlier could simply be because a number
of small firms will be discouraged from setting up, others might have to grow without theprotection of limited liability until they reach the scale to afford the cost of incorporation.In either case, entry costs could have a dampening effect on innovation and risk-taking.An immediate question is whether entry regulation affects the ability or incentive of
incumbents to enhance productivity. If entry regulations only serve to protect incumbentsand prevent the disciplinary effects of competition, incumbent firms are less likely to beable, or forced, to enhance productivity. If, by contrast, regulations are effective atscreening, incumbent firms that have come through the screening process could be betterfirms, more able to enhance productivity.In Table 10, Panel A, Columns (ii-viii), we examine the effect of entry regulation on the
relative performance of incumbent or established firms, defined as all firms more than twoyears old. We use the growth in value added per employee as a measure of firmperformance. To reduce the influence of outliers, the dependent variable in the regressionsin this table is censored.In Panel A, Columns (ii–v), we present Tobit estimations where the dependent variable
is the real growth in value added per employee over the period 1998–1999 averaged over allincumbent firms in the industry in a country. In Column (ii), the negative significantcoefficient on the interaction variable indicates that incumbent firms in naturally high-entry industries have relatively less growth in value added when they are in a countrywith high entry regulations. We verify that this result is not simply because incumbentsin countries with high entry costs are larger—the result survives when we include theaverage value added for incumbents in the industry in that country (not reported inthe table).Again, it is worth pointing out what the coefficient means by comparing the retail trade
industry, which is at the 75th percentile of EntryUS, and the pulp and paper manufacturingindustry, which is at the 25th percentile of EntryUS. The coefficient estimate suggests thatthe difference in real growth rates of value added per worker between retail and pulp in theCzech Republic (which is at the 25th percentile in terms of EntCost) is 0.7 percentagepoints higher than the difference in real growth rates between the same industries in Italy(which is at the 75th percentile in terms of EntCost). In other words, moving from Italy tothe Czech Republic benefits the growth rate of the high-entry retail sector relatively more.Since the average real growth rate in value added per worker is 1%, this is a sizeablemagnitude.We also include other measures of firm entry. Column (iii) shows that our results are
robust to the substitution of entry rates with the percentage of SMEs, defined as firms withless than 250 employees. The estimates in Columns (iv–v) indicate that incumbent firms inindustries with smaller scale tend to increase productivity more slowly in countries withhigh regulatory entry barriers. Next, we test the direction of causality using legal origin as

ARTICLE IN PRESS
Table
10
Theconsequencesofpreventingfree
entry
Pa
nel
A:
Siz
eo
fen
tran
tsa
nd
per
form
an
ceo
fin
cum
ben
tfi
rms
(i)
(ii)
(iii)
(iv)
(v)
(vi)
(vii)
(viii)
Sizeofentrants
Growth
SME
Scale
Size
Legalorigin
GDP
Corruption
Industry
Share
2.334
�0.050
�0.030
�0.048
�0.040
�0.178
�0.038
0.012
(3.890)
(0.530)
(0.529)
(0.530)
(0.530)
(0.378)
(0.531)
(0.530)
EntryUS�
EntC
ost
9.936***
�0.426**
�0.211*
(1.861)
(0.202)
(0.113)
SME�
EntC
ost
�0.039**
(0.015)
Scale�
EntC
ost
0.006**
(0.003)
Size�
EntC
ost
0.007**
(0.003)
Low
GDPper
capita�
EntryUS�
EntC
ost
�0.607
(0.607)
HighGDPper
capita�
EntryUS�
EntC
ost
�0.431**
(0.203)
HighCorruption�
EntryUS�
EntC
ost
�0.456**
(0.202)
Low
Corruption�
EntryUS�
EntC
ost
�1.394**
(0.614)
Observations
484
572
572
572
572
572
572
572
L. Klapper et al. / Journal of Financial Economics 82 (2006) 591–629 615

ARTICLE IN PRESS
Pan
elB
:P
erfo
rman
ceo
fY
ou
ng
an
dO
ldIn
cum
ben
tF
irm
s
(i)
(ii)
Age3–5
Age4
5
EntryUS�
EntC
ost
�0.038(0.281)
�0.396**(0.199)
Wald
test
ofequality
ofslopecoefficients
(p-value)
0.300
Likelihoodratiotest
ofequality
ofallregressioncoefficients
(p-value)
0.001***
Observations
472
615
Column(i)ofPanelA
reportsOLSestimates.Thedependentvariableisthelogarithm
oftheaveragevalueadded
(inmillionsofEuros)ofentrantsforeach
industry
andcountry,averaged
over
theyears
1998�1999.Entrants
are
defined
asfirm
sthatare
oneortw
oyears
old.Columns(ii)to
(v)ofPanelA
show
Tobitregressions
withalternativeproxiesforthepropensity
toenter.Column(vi)showsaninstrumentalvariableregression.Weuse
legalorigin
ofthecountryasinstrumentforentry
cost.Columns(vii–viii)showTobitresultswhen
weestimate
differentslopes
fortheinteractionvariablesforwhether
theindustry
isin
acountrybeloworabovethe
samplemedianofper
capitaincome,oraboveorbelowthesamplemedianofcorruption.Thedependentvariablein
Columns(ii–viii)istheindustry-levelrealgrowth
invalueadded
per
employee
ofincumbentfirm
s,defined
asfirm
swithage42.PanelBreportsresultsfrom
Tobitestimations.Thedependentvariableistheindustry-
level
realgrowth
invalueadded
per
employee
ofincumbentfirm
scalculatedfortw
oagegroups:
age3–5andage4
5.Growth
ratesare
averages
fortheperiod
1998–1999,bytw
o-digitNACEindustry
andcountry,andexcludingobservationsbasedonfewer
thanthreefirm
s.Growth
observationsare
censoredat�50%
and
+100%
.Industry
Share
istheindustry
share
insales.EntryUSistheratioofnew
firm
sto
totalfirm
sin
theUnited
States.EntC
ostiscountry-levelentrycosts.SMEis
thepercentageofU.S.firm
swithfewer
than250em
ployees.ScaleisthemedianassetsofU.S.firm
sin
anindustry.SizeisthemediansalesofU.S.firm
sin
anindustry.
EntryUS,SME,Scale,andSizeare
averages
fortheperiod1998–1999andcalculatedatthetw
o-digitNACEindustry
level.See
Appendix
Bforcomplete
variable
definitionsandsources.Allregressionsincludeaconstant,countrydummies,andtw
o-digitindustry
dummies,notshown.White(1980)standard
errors
are
reported
inparentheses.In
PanelBwereportthe
p-valueofaWald
testforwhether
thecoefficientsoftheinteractionterm
are
equalacross
thetw
oregressionsandthe
p-value
ofalikelihoodratiotest
ofequality
ofallregressioncoefficients
across
thetw
oregressions.*,**,and***denote
significantat10%,5%,and1%,respectively.
Table
10(c
onti
nu
ed)
L. Klapper et al. / Journal of Financial Economics 82 (2006) 591–629616

ARTICLE IN PRESSL. Klapper et al. / Journal of Financial Economics 82 (2006) 591–629 617
an instrument for entry regulation. Column (vi) shows that the results are robust to usinginstrumental variables, although the magnitude of the coefficient estimate for theinteraction term is somewhat reduced. Finally, in Columns (vii) and (viii), we verify thatthe adverse effect on productivity growth is more pronounced in high GDP and lowcorruption countries, consistent with our earlier finding that these are the countries whereentry barriers have an impact.
If the lower regulatory barriers indeed allow for more disciplining of entry, olderincumbents should be particularly affected since they have survived much harshercompetition. The effects should be far less pronounced for young incumbent firms becausecompetition has not had time to work its selection effects. Put another way, olderincumbents in protected industries should have become far more reliant on the rents fromincumbency than on efficiency gains.
We split each industry in each country into incumbent young firms (firms between threeand five years of age) and incumbent old firms (firms over five years of age) and computevalue-added growth rates for each age segment. We then estimate the regression inTable 10, Panel A, Column (ii) for each segment. The regression estimates are in Table 10,Panel B. They suggest that the adverse interaction effects on growth are present primarilyfor the older firms, and a likelihood ratio test confirms the difference in coefficients acrossthe two samples.
In sum, value added per worker grows relatively more slowly for older incumbents innaturally high-entry industries in countries with high bureaucratic barriers but not foryoung incumbents. This is consistent with older firms, who have had to survive greatercompetition in countries with low entry barriers, becoming relatively more efficient.
This has effects on overall growth rates. As a suggestive comparison, Fig. 1 plots averagevalue added for firms in different age groups for two countries, high-barrier Italy and thelow-barrier United Kingdom. Across all industries, firms start out larger when young inItaly, but grow more slowly so that firms in the United Kingdom are about twice as largeby age ten.
Taken together, these results suggest that entry regulations adversely affect the growthof those industries that might be presumed to benefit most by the added selectivity thatsuch regulation might bring. This strongly suggests that there are costs to such regulationsthat should be taken into account in evaluating any potential benefits.
4.6. Other regulations and the business environment
Thus far, the focus has been on entry regulations and their effect on firm entry, size, andgrowth. But there are other regulations and aspects of the business environment that mightaffect entry and firm growth, such as financial development, labor regulation, andprotection of intellectual property. We want to make sure that the effect we have focusedon thus far is not driven by these other aspects of the business environment. To the extentthat onerous entry regulations go together with lower financial development, morestringent employee protection, and lower property rights protection, they could all capturesimilar aspects of an unfavorable business environment. We therefore consider the effectsof the availability of financing, labor regulations, and the protection of intellectualproperty on firm entry and growth.
We focus on these three dimensions of the business environment because they have beenfound to explain variation in firm entry, size, and growth in previous literature. Black and

ARTICLE IN PRESSL. Klapper et al. / Journal of Financial Economics 82 (2006) 591–629618
Strahan (2002) find that financial development following bank deregulation fostered firmentry in the United States. Di Patti and Dell’Ariccia (2004) find that entry is higher ininformationally opaque industries in Italian regions that have a more concentratedbanking sector. Fisman and Love (2003a) focus on access to trade credit rather than bankcredit and find that industries with higher dependence on trade credit financing exhibithigher growth rates in countries with relatively weak financial institutions.Stricter labor regulations, such as the ability to hire and fire workers, have also been
found to correlate with firm entry. Scarpetta et al. (2002) use firm-level survey data fromOECD countries and find that firm entry is lower in countries with stricter laborregulations.There is also work related to the importance of property rights for firm size and firm
growth. Kumar et al. (2002) find that the average size of firms in human capital and inR&D intensive industries is larger in countries that protect property rights and patents.Using survey data from five transition countries on the reinvestment of profits byentrepreneurs, Johnson et al. (2002) find lower investment by entrepreneurs in countrieswith weak property rights. Claessens and Laeven (2003) find that growth of industries thatrely on intangible assets is disproportionately lower in countries with weak intellectualproperty rights. Except for the work by Scarpetta et al. (2002), none of these other papersalso examine entry regulations.We find that these aspects of the business environment have a significant impact, but
primarily on the rate of incorporation and not on the productivity growth of incumbents.Importantly, when we control for these other aspects of the business environment, entryregulations remain an important determinant of new firm entry and the growth ofincumbent firms.
4.6.1. Access to finance
First, we consider access to finance as an alternative determinant of firm entry andgrowth. Liquidity constraints can hinder people from starting businesses (see, e.g.,Evans and Jovanovic, 1989). This suggests that entry rates should be lower in countrieswith less developed financial systems.8 In fact, Rajan and Zingales (2003) suggest thatthe absence of regulations protecting investors could be a very effective barrier to new firmcreation.We use ExtFin, a measure of dependence on external finance (the industry-level median
of the ratio of capital expenditures minus cash flow over capital expenditures – see Rajanand Zingales (1998) for details) as the industry characteristic. We also calculate anindustry-level measure of reliance on supplier trade financing as the average ratio ofaccounts payable to total assets across all firms in the industry. Both measures arecalculated for the period 1990–1999 for all U.S. listed firms in Compustat.We also use alternative measures of access to financing. As a measure of banking
development, we include the ratio of domestic credit to the private sector to GDP from theInternational Monetary Fund’s International Financial Statistics. As a proxy for capitalmarket development, we use the ratio of stock market capitalization to GDP from theWorld Bank Development Indicators. To measure country-level provisioning of supplier
8Rajan and Zingales (1998) find that there are more new establishments in industrial sectors with greater
external financing needs in more developed financial systems. This is not exactly the same as our findings, since
new establishments need not be new entry but could simply be new plants set up by existing firms.
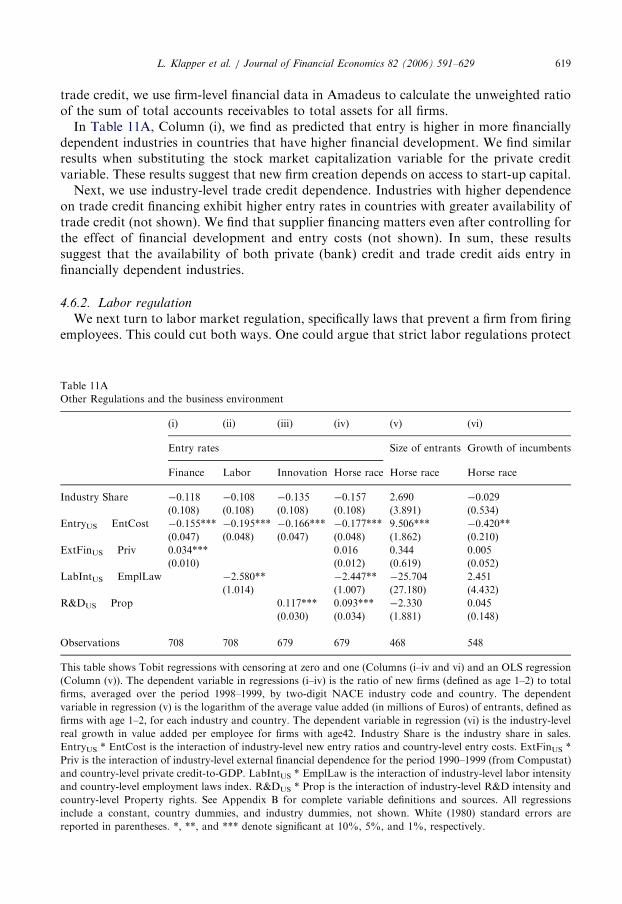
ARTICLE IN PRESSL. Klapper et al. / Journal of Financial Economics 82 (2006) 591–629 619
trade credit, we use firm-level financial data in Amadeus to calculate the unweighted ratioof the sum of total accounts receivables to total assets for all firms.
In Table 11A, Column (i), we find as predicted that entry is higher in more financiallydependent industries in countries that have higher financial development. We find similarresults when substituting the stock market capitalization variable for the private creditvariable. These results suggest that new firm creation depends on access to start-up capital.
Next, we use industry-level trade credit dependence. Industries with higher dependenceon trade credit financing exhibit higher entry rates in countries with greater availability oftrade credit (not shown). We find that supplier financing matters even after controlling forthe effect of financial development and entry costs (not shown). In sum, these resultssuggest that the availability of both private (bank) credit and trade credit aids entry infinancially dependent industries.
4.6.2. Labor regulation
We next turn to labor market regulation, specifically laws that prevent a firm from firingemployees. This could cut both ways. One could argue that strict labor regulations protect
Table 11A
Other Regulations and the business environment
(i) (ii) (iii) (iv) (v) (vi)
Entry rates Size of entrants Growth of incumbents
Finance Labor Innovation Horse race Horse race Horse race
Industry Share �0.118 �0.108 �0.135 �0.157 2.690 �0.029
(0.108) (0.108) (0.108) (0.108) (3.891) (0.534)
EntryUS � EntCost �0.155*** �0.195*** �0.166*** �0.177*** 9.506*** �0.420**
(0.047) (0.048) (0.047) (0.048) (1.862) (0.210)
ExtFinUS � Priv 0.034*** 0.016 0.344 0.005
(0.010) (0.012) (0.619) (0.052)
LabIntUS � EmplLaw �2.580** �2.447** �25.704 2.451
(1.014) (1.007) (27.180) (4.432)
R&DUS � Prop 0.117*** 0.093*** �2.330 0.045
(0.030) (0.034) (1.881) (0.148)
Observations 708 708 679 679 468 548
This table shows Tobit regressions with censoring at zero and one (Columns (i–iv and vi) and an OLS regression
(Column (v)). The dependent variable in regressions (i–iv) is the ratio of new firms (defined as age 1–2) to total
firms, averaged over the period 1998–1999, by two-digit NACE industry code and country. The dependent
variable in regression (v) is the logarithm of the average value added (in millions of Euros) of entrants, defined as
firms with age 1–2, for each industry and country. The dependent variable in regression (vi) is the industry-level
real growth in value added per employee for firms with age42. Industry Share is the industry share in sales.
EntryUS * EntCost is the interaction of industry-level new entry ratios and country-level entry costs. ExtFinUS *
Priv is the interaction of industry-level external financial dependence for the period 1990–1999 (from Compustat)
and country-level private credit-to-GDP. LabIntUS * EmplLaw is the interaction of industry-level labor intensity
and country-level employment laws index. R&DUS * Prop is the interaction of industry-level R&D intensity and
country-level Property rights. See Appendix B for complete variable definitions and sources. All regressions
include a constant, country dummies, and industry dummies, not shown. White (1980) standard errors are
reported in parentheses. *, **, and *** denote significant at 10%, 5%, and 1%, respectively.

ARTICLE IN PRESSL. Klapper et al. / Journal of Financial Economics 82 (2006) 591–629620
employees and give them the confidence to join small, untested firms (much the way thatgood corporate governance offers investors confidence), thus reducing start up-costs.Regulations could also hamper the growth of large incumbent firms, whose adherence toregulations is more easily monitored, thus creating the space for new firms to enter.However, one could argue for the opposite effect of labor regulations on entry: the cost ofcompliance with regulations has fixed components that make them particularly costly forsmall businesses to meet, and could inhibit entry. Small firms might not be able to afford tokeep their employees through downturns, and thus might underhire in the face of strictlabor regulations.We use the employment laws index of worker protection developed by Botero et al.
(2004), which indicates the strictness of labor regulations in the country in 1997. This indexwas constructed by examining detailed provisions in the labor laws regarding alternativeemployment contracts, conditions of employment, and job security. The index takes valuesbetween zero and three, with higher values implying that regulation is more protective of aworker. We refer to this index as EmpLaw.Following our methodology, we need to find an industry characteristic that would make
an industry most susceptible to labor regulation. We would expect labor regulations toimpinge the most on industries that are the most labor intensive. We calculate laborintensity, LabInt, from U.S. data as the industry median over all Compustat firms in thatindustry of the number of employees divided by the amount of fixed assets (in millions ofdollars), and is calculated over all firm-years over the period 1998–1999. A higher scoreindicates higher labor intensity. We have explored the use of other measures of laborintensity such as employees over total assets and get similar results. In Table 11A, Column(ii), we find that labor regulations have a dampening effect on entry in labor-intensiveindustries.
4.6.3. Regulations protecting property
Now consider regulations protecting intellectual property. Strong patent protectioncould dissuade entry because it protects incumbents and forces new entrants to carve awide path around existing intellectual property. On the other hand, new entrants do nothave the organizational structure, finance, or intellectual capital to create a significant first-mover advantage and thus dissuade potential imitators. As a result, they might have agreater incentive to do research if they know their research will be protected legally.Following the now familiar method, our country-level variable is Property Rights, which
is an index of the protection of property in a country from the Economic Freedom Indexconstructed by the Heritage Foundation. This variable is estimated for the year 1997 andhas been used previously by Claessens and Laeven (2003).The industry variable measured from U.S. data, R&D, is a measure of dependence on
research and development and equals the industry-level median of the ratio of research anddevelopment expenses to sales for Compustat firms in the same industry over the period1990–1999. The numerator and denominator are summed over all years for each firmbefore dividing.In Table 11A, Column (iii), the interaction variable is positive and significant, suggesting
that there is more entry in R&D intensive industries in countries that protect propertybetter. This echoes the findings of Claessens and Laeven (2003). We find similar resultswhen using a more specific index of intellectual property rights from the World EconomicForum (2002) (not shown).
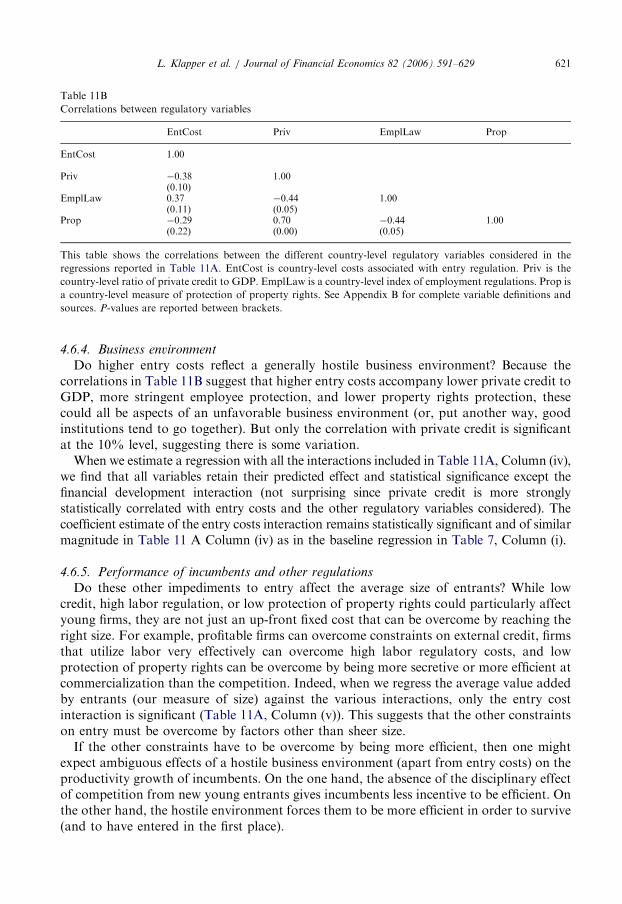
ARTICLE IN PRESS
Table 11B
Correlations between regulatory variables
EntCost Priv EmplLaw Prop
EntCost 1.00
Priv �0.38 1.00(0.10)
EmplLaw 0.37 �0.44 1.00(0.11) (0.05)
Prop �0.29 0.70 �0.44 1.00(0.22) (0.00) (0.05)
This table shows the correlations between the different country-level regulatory variables considered in the
regressions reported in Table 11A. EntCost is country-level costs associated with entry regulation. Priv is the
country-level ratio of private credit to GDP. EmplLaw is a country-level index of employment regulations. Prop is
a country-level measure of protection of property rights. See Appendix B for complete variable definitions and
sources. P-values are reported between brackets.
L. Klapper et al. / Journal of Financial Economics 82 (2006) 591–629 621
4.6.4. Business environment
Do higher entry costs reflect a generally hostile business environment? Because thecorrelations in Table 11B suggest that higher entry costs accompany lower private credit toGDP, more stringent employee protection, and lower property rights protection, thesecould all be aspects of an unfavorable business environment (or, put another way, goodinstitutions tend to go together). But only the correlation with private credit is significantat the 10% level, suggesting there is some variation.
When we estimate a regression with all the interactions included in Table 11A, Column (iv),we find that all variables retain their predicted effect and statistical significance except thefinancial development interaction (not surprising since private credit is more stronglystatistically correlated with entry costs and the other regulatory variables considered). Thecoefficient estimate of the entry costs interaction remains statistically significant and of similarmagnitude in Table 11 A Column (iv) as in the baseline regression in Table 7, Column (i).
4.6.5. Performance of incumbents and other regulations
Do these other impediments to entry affect the average size of entrants? While lowcredit, high labor regulation, or low protection of property rights could particularly affectyoung firms, they are not just an up-front fixed cost that can be overcome by reaching theright size. For example, profitable firms can overcome constraints on external credit, firmsthat utilize labor very effectively can overcome high labor regulatory costs, and lowprotection of property rights can be overcome by being more secretive or more efficient atcommercialization than the competition. Indeed, when we regress the average value addedby entrants (our measure of size) against the various interactions, only the entry costinteraction is significant (Table 11A, Column (v)). This suggests that the other constraintson entry must be overcome by factors other than sheer size.
If the other constraints have to be overcome by being more efficient, then one mightexpect ambiguous effects of a hostile business environment (apart from entry costs) on theproductivity growth of incumbents. On the one hand, the absence of the disciplinary effectof competition from new young entrants gives incumbents less incentive to be efficient. Onthe other hand, the hostile environment forces them to be more efficient in order to survive(and to have entered in the first place).

ARTICLE IN PRESSL. Klapper et al. / Journal of Financial Economics 82 (2006) 591–629622
If we estimate the regression with the real growth in value added per employee ofincumbent firms as a dependent variable, and include all the interactions in Table 11A,Column (vi), we find that none of the interaction terms with the other regulatory variablesenters significantly. Importantly, the entry regulation interaction continues to enter negativelyand is statistically significant and with a similar order of magnitude as the regressions reportedin Table 10. In sum, there could well be offsetting effects of other constraints to entry ashypothesized above; or, put another way, firms need not be particularly clever or efficient topay high bureaucratic costs of entry, they only need to be large enough to afford it.
5. Conclusion
This paper uses cross-country data to identify the impact of the business environment onentrepreneurship. We use the Amadeus database, which includes financial data on overthree million firms in Western and Eastern Europe. These data improve upon previouslyused datasets in that they include (1) a large number of private, unlisted, and publiclytraded corporations and (2) all sectors (i.e., not limited to manufacturing). This databaseoffers a unique opportunity for us to construct entry rates across sectors and test the effectof diverse industry- and country-level characteristics on new firm creation.To summarize our results, we find that entry regulations hamper entry, especially in
industries that naturally should have high entry. Entrants are larger—suggesting that smallfirms are dissuaded from entering or have to grow without the protection of limited liabilityuntil they can afford the costs of incorporation. Also, the value added per employee innaturally ‘‘high-entry’’ industries grows more slowly in countries with high entry barriers. Theeffect is primarily seen in older firms, suggesting that entry barriers mute the disciplining effectof competition. Taken together, our findings suggest that entry regulations have significantadverse effects. Since we have not measured the value of all potential benefits, we cannotmake a categorical statement about the net welfare effects of these regulations.However, the effect of these entry regulations is seen primarily in developed countries or
countries where there is little corruption. To the extent that the benefits of screening aresmall, and other benefits—such as the provision of greater information to the authorities—can be captured even with reduced costs (for example, by automating the process), areduction in the cost of complying with regulations governing incorporation will have themost pronounced effect in developed countries such as those in Continental Europe, whereexisting entry regulations are most effectively enforced.In developing countries or countries where corruption is a serious problem, entry
regulations are unlikely to help screen out cheats. To the extent that such regulationsincrease the cost of entry (if nothing else, through the additional bribes that have to bepaid), without any benefits in screening or information gathering, there could be merit toreducing the regulatory requirements substantially.The broader point made is that entry regulation has costs over and above the direct costs
of compliance and enforcement. While there could indeed be deeper politico-economicinterests underpinning such regulation that negate any attempt at deregulation, authoritiesshould weigh these ‘‘excess costs’’ of entry regulation carefully in deciding policy.
Appendix A
Details about collection of company accounts in Amadeus are given in Table 12.

ARTICLE IN PRESSTable
12
Country
Whichcompanieshaveto
file
accounts?
Are
allpublicand
private
limited
companiesrequired
to
file
accounts?
Maxim
um
perioda
companycantaketo
file
accounts
after
its
yearend
Maxim
um
period
betweenfilingof
accounts
andrecords
appearingin
database
Austria
Publiclimited
companies(A
G)andprivate
limited
companies
(GmbH).
Yes
12months
3months
Belgium
Allpubliclimited
companies(SA/N
V)companies,private
limited
companies(SPRL/BV/BVBA),partnerships,cooperatives,and
EuropeanEconomic
Interest
Groupings.
Yes
7months
3months
Bulgaria
JointStock
companies(EAD).
No,only
public
limited
companies.
n.a.
n.a.
Czech
Republic
Jointstock
companies,limited
liabilitycompaniesand
cooperatives.Lim
ited
liabilitycompaniesandcooperatives
only
if
they
meetatleast
oneofthefollowingtw
oconditionsin
the
previousyear:equity4CZK
20millionandturnover4CZK
40
million.
No,only
ifthey
meet
certain
size
criteria.
6months
4–5weeks
Denmark
Publiclimited
companies(A
/S),private
limited
companies(A
pS),
limited
partnershipsbyshares(P/S),andsomelimited
andgeneral
partnerships.
Yes
5–6months
Lessthan20days
Estonia
Publiclimited
companies,private
limited
companies,and
cooperatives.
Yes
6months
12months
Finland
Alljoint-stock
companiesandallcooperatives
thatmeettw
oofthe
followingthreeconditions:turnover4FIM
20million,total
assets4
FIM
10million,number
ofem
ployees4
50.
No,only
ifthey
meet
certain
size
criteria.
8months
n.a.
France
Publiclimited
companies(SA),private
limited
companies(SARL),
limited
partnerships(SCS),generalpartnerships(SNC),andsole
proprietorshipswithlimited
liability(EURL).
Yes
4–6months
4months
Germany
Publiclimited
companies(A
G),private
limited
companies
(GmbH),andcooperatives
(eG).
Yes
12months
4–6weeks
Greece
Publicandprivate
limited
companies(SA).
Yes
6months
20–40days
Hungary
Allcompanies,exceptproprietorships.
Yes
5months
n.a.
Iceland
Allpubliclimited
companies(H
F),private
limited
companies
(EHF),generalcooperatives
(SVF),andsomepartnershipsand
agriculturalcooperatives.
Yes
8months
6weeks
Ireland
Publiclimited
companies(plc)andprivate
limited
companies(ltd).
Yes
46days
n.a.
L. Klapper et al. / Journal of Financial Economics 82 (2006) 591–629 623
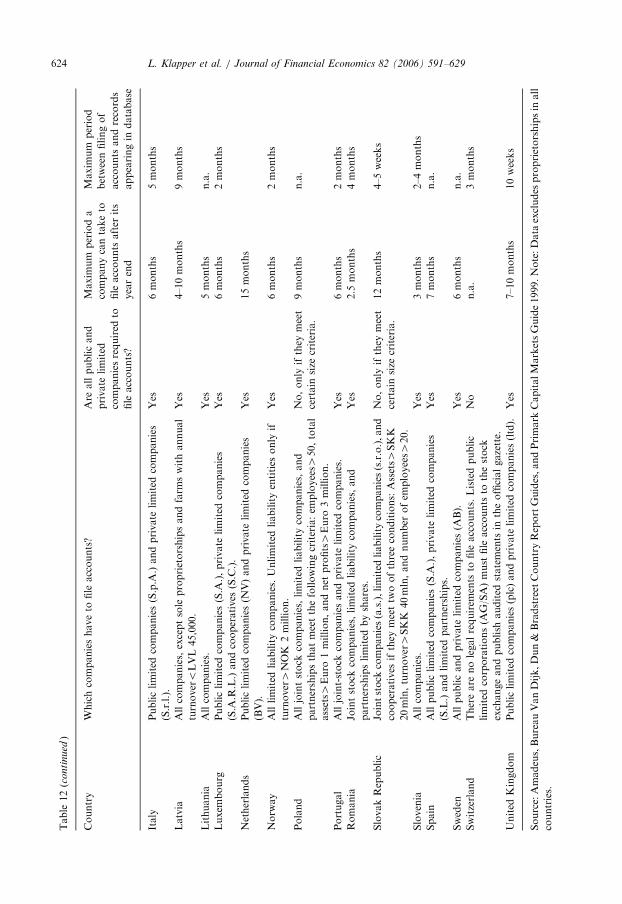
ARTICLE IN PRESSTable
12(c
onti
nu
ed)
Country
Whichcompanieshaveto
file
accounts?
Are
allpublicand
private
limited
companiesrequired
to
file
accounts?
Maxim
um
perioda
companycantaketo
file
accounts
after
its
yearend
Maxim
um
period
betweenfilingof
accounts
andrecords
appearingin
database
Italy
Publiclimited
companies(S.p.A
.)andprivate
limited
companies
(S.r.l.).
Yes
6months
5months
Latvia
Allcompanies,exceptsole
proprietorshipsandfarm
swithannual
turnoveroLVL45,000.
Yes
4–10months
9months
Lithuania
Allcompanies.
Yes
5months
n.a.
Luxem
bourg
Publiclimited
companies(S.A
.),private
limited
companies
(S.A
.R.L.)andcooperatives
(S.C.).
Yes
6months
2months
Netherlands
Publiclimited
companies(N
V)andprivate
limited
companies
(BV).
Yes
15months
Norw
ay
Alllimited
liabilitycompanies.Unlimited
liabilityentities
only
if
turnover4NOK
2million.
Yes
6months
2months
Poland
Alljointstock
companies,limited
liabilitycompanies,and
partnershipsthatmeetthefollowingcriteria:em
ployees4
50,total
assets4
Euro
1million,andnet
profits4Euro
3million.
No,only
ifthey
meet
certain
size
criteria.
9months
n.a.
Portugal
Alljoint-stock
companiesandprivate
limited
companies.
Yes
6months
2months
Romania
Jointstock
companies,limited
liabilitycompanies,and
partnershipslimited
byshares.
Yes
2.5
months
4months
SlovakRepublic
Jointstock
companies(a.s.),limited
liabilitycompanies(s.r.o.),and
cooperatives
ifthey
meettw
oofthreeconditions:Assets4
SKK
20mln,turnover4SKK
40mln,andnumber
ofem
ployees4
20.
No,only
ifthey
meet
certain
size
criteria.
12months
4–5weeks
Slovenia
Allcompanies.
Yes
3months
2–4months
Spain
Allpubliclimited
companies(S.A
.),private
limited
companies
(S.L.)andlimited
partnerships.
Yes
7months
n.a.
Sweden
Allpublicandprivate
limited
companies(A
B).
Yes
6months
n.a.
Switzerland
Thereare
nolegalrequirem
ents
tofile
accounts.Listedpublic
limited
corporations(A
G/SA)must
file
accounts
tothestock
exchangeandpublish
audited
statements
intheofficialgazette.
No
n.a.
3months
United
Kingdom
Publiclimited
companies(plc)andprivate
limited
companies(ltd).
Yes
7–10months
10weeks
Source:Amadeus,BureauVanDijk,Dun&
Bradstreet
CountryReportGuides,andPrimark
CapitalMarketsGuide1999.Note:Data
excludes
proprietorshipsin
all
countries.
L. Klapper et al. / Journal of Financial Economics 82 (2006) 591–629624
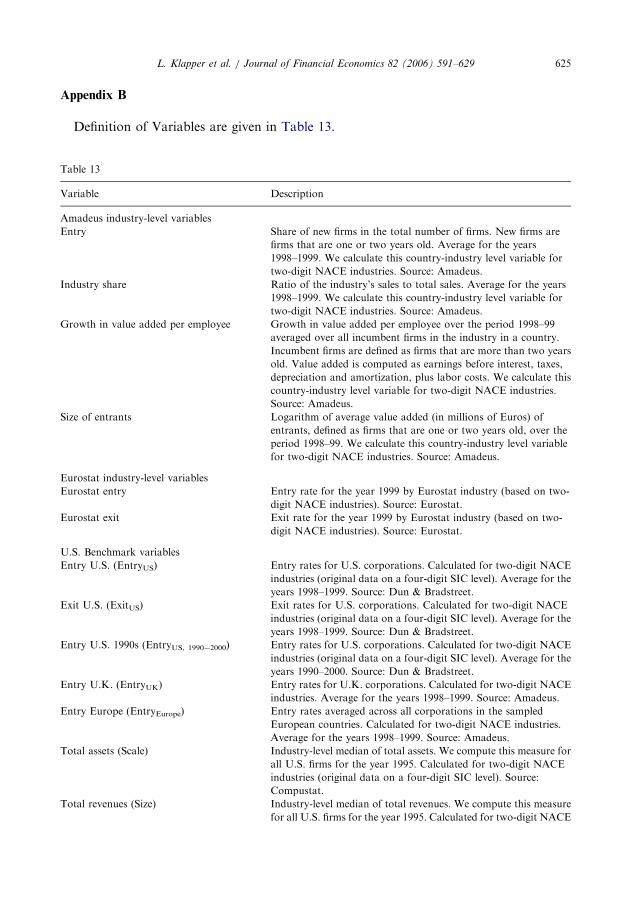
ARTICLE IN PRESSL. Klapper et al. / Journal of Financial Economics 82 (2006) 591–629 625
Appendix B
Definition of Variables are given in Table 13.
Table 13
Variable Description
Amadeus industry-level variables
Entry Share of new firms in the total number of firms. New firms are
firms that are one or two years old. Average for the years
1998–1999. We calculate this country-industry level variable for
two-digit NACE industries. Source: Amadeus.
Industry share Ratio of the industry’s sales to total sales. Average for the years
1998–1999. We calculate this country-industry level variable for
two-digit NACE industries. Source: Amadeus.
Growth in value added per employee Growth in value added per employee over the period 1998–99
averaged over all incumbent firms in the industry in a country.
Incumbent firms are defined as firms that are more than two years
old. Value added is computed as earnings before interest, taxes,
depreciation and amortization, plus labor costs. We calculate this
country-industry level variable for two-digit NACE industries.
Source: Amadeus.
Size of entrants Logarithm of average value added (in millions of Euros) of
entrants, defined as firms that are one or two years old, over the
period 1998–99. We calculate this country-industry level variable
for two-digit NACE industries. Source: Amadeus.
Eurostat industry-level variables
Eurostat entry Entry rate for the year 1999 by Eurostat industry (based on two-
digit NACE industries). Source: Eurostat.
Eurostat exit Exit rate for the year 1999 by Eurostat industry (based on two-
digit NACE industries). Source: Eurostat.
U.S. Benchmark variables
Entry U.S. (EntryUS) Entry rates for U.S. corporations. Calculated for two-digit NACE
industries (original data on a four-digit SIC level). Average for the
years 1998–1999. Source: Dun & Bradstreet.
Exit U.S. (ExitUS) Exit rates for U.S. corporations. Calculated for two-digit NACE
industries (original data on a four-digit SIC level). Average for the
years 1998–1999. Source: Dun & Bradstreet.
Entry U.S. 1990s (EntryUS, 1990�2000) Entry rates for U.S. corporations. Calculated for two-digit NACE
industries (original data on a four-digit SIC level). Average for the
years 1990–2000. Source: Dun & Bradstreet.
Entry U.K. (EntryUK) Entry rates for U.K. corporations. Calculated for two-digit NACE
industries. Average for the years 1998–1999. Source: Amadeus.
Entry Europe (EntryEurope) Entry rates averaged across all corporations in the sampled
European countries. Calculated for two-digit NACE industries.
Average for the years 1998–1999. Source: Amadeus.
Total assets (Scale) Industry-level median of total assets. We compute this measure for
all U.S. firms for the year 1995. Calculated for two-digit NACE
industries (original data on a four-digit SIC level). Source:
Compustat.
Total revenues (Size) Industry-level median of total revenues. We compute this measure
for all U.S. firms for the year 1995. Calculated for two-digit NACE
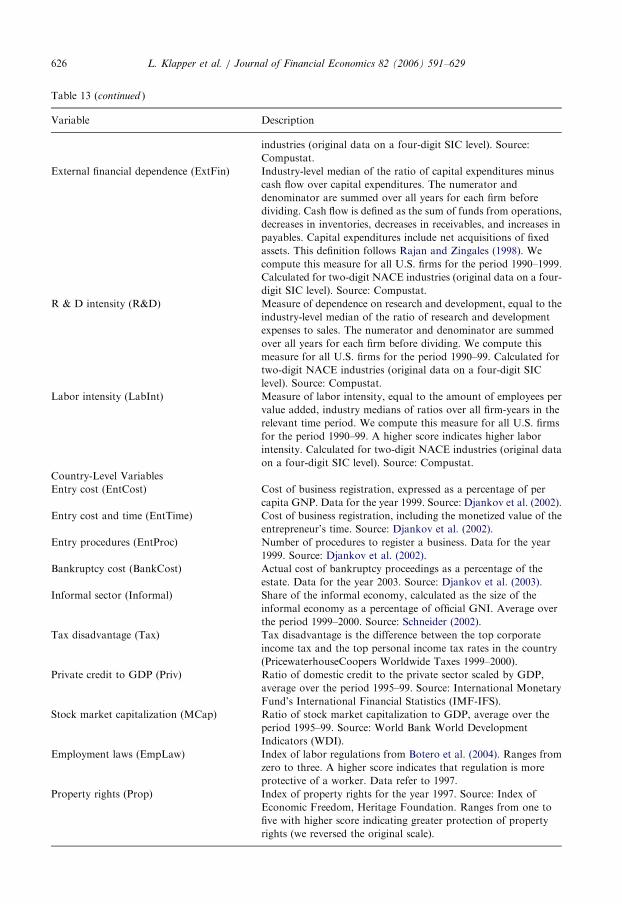
ARTICLE IN PRESS
Table 13 (continued )
Variable Description
industries (original data on a four-digit SIC level). Source:
Compustat.
External financial dependence (ExtFin) Industry-level median of the ratio of capital expenditures minus
cash flow over capital expenditures. The numerator and
denominator are summed over all years for each firm before
dividing. Cash flow is defined as the sum of funds from operations,
decreases in inventories, decreases in receivables, and increases in
payables. Capital expenditures include net acquisitions of fixed
assets. This definition follows Rajan and Zingales (1998). We
compute this measure for all U.S. firms for the period 1990–1999.
Calculated for two-digit NACE industries (original data on a four-
digit SIC level). Source: Compustat.
R & D intensity (R&D) Measure of dependence on research and development, equal to the
industry-level median of the ratio of research and development
expenses to sales. The numerator and denominator are summed
over all years for each firm before dividing. We compute this
measure for all U.S. firms for the period 1990–99. Calculated for
two-digit NACE industries (original data on a four-digit SIC
level). Source: Compustat.
Labor intensity (LabInt) Measure of labor intensity, equal to the amount of employees per
value added, industry medians of ratios over all firm-years in the
relevant time period. We compute this measure for all U.S. firms
for the period 1990–99. A higher score indicates higher labor
intensity. Calculated for two-digit NACE industries (original data
on a four-digit SIC level). Source: Compustat.
Country-Level Variables
Entry cost (EntCost) Cost of business registration, expressed as a percentage of per
capita GNP. Data for the year 1999. Source: Djankov et al. (2002).
Entry cost and time (EntTime) Cost of business registration, including the monetized value of the
entrepreneur’s time. Source: Djankov et al. (2002).
Entry procedures (EntProc) Number of procedures to register a business. Data for the year
1999. Source: Djankov et al. (2002).
Bankruptcy cost (BankCost) Actual cost of bankruptcy proceedings as a percentage of the
estate. Data for the year 2003. Source: Djankov et al. (2003).
Informal sector (Informal) Share of the informal economy, calculated as the size of the
informal economy as a percentage of official GNI. Average over
the period 1999–2000. Source: Schneider (2002).
Tax disadvantage (Tax) Tax disadvantage is the difference between the top corporate
income tax and the top personal income tax rates in the country
(PricewaterhouseCoopers Worldwide Taxes 1999–2000).
Private credit to GDP (Priv) Ratio of domestic credit to the private sector scaled by GDP,
average over the period 1995–99. Source: International Monetary
Fund’s International Financial Statistics (IMF-IFS).
Stock market capitalization (MCap) Ratio of stock market capitalization to GDP, average over the
period 1995–99. Source: World Bank World Development
Indicators (WDI).
Employment laws (EmpLaw) Index of labor regulations from Botero et al. (2004). Ranges from
zero to three. A higher score indicates that regulation is more
protective of a worker. Data refer to 1997.
Property rights (Prop) Index of property rights for the year 1997. Source: Index of
Economic Freedom, Heritage Foundation. Ranges from one to
five with higher score indicating greater protection of property
rights (we reversed the original scale).
L. Klapper et al. / Journal of Financial Economics 82 (2006) 591–629626

ARTICLE IN PRESSL. Klapper et al. / Journal of Financial Economics 82 (2006) 591–629 627
Appendix C
U.S. entry and exit rates, by two-digit NACE Revision 1 or two-digit 1987 U.S. SICcode are given in Table 14.
Table 14
NACE Industry Entry Exit SIC Industry Entry Exit
10 Coal mining 3.05 4.08 10 Metal mining 3.42 2.72
11 Oil and gas extraction 4.45 1.35 12 Coal mining 3.05 4.08
13 Mining of metal ores 3.41 2.86 13 Oil and gas extraction 4.32 1.33
14 Other mining and quarrying 3.73 1.39 14 Nonmetallic minerals, except fuels 3.73 1.39
15 Food products and beverages 5.24 1.91 15 General building contractors 9.27 4.58
16 Tobacco products 7.45 1.40 16 Heavy construction contractors 4.98 2.00
17 Textiles 6.92 2.46 17 Special trade contractors 7.81 4.10
18 Wearing apparel; fur 6.44 3.03 20 Food and kindred products 5.24 1.91
19 Luggage, handbags, footwear 9.06 2.51 21 Tobacco manufactures 7.45 1.40
20 Wood, except furniture 5.98 3.29 22 Textile mill products 6.14 2.65
21 Pulp and paper 5.26 1.87 23 Apparel and other textile products 7.02 2.68
22 Publishing; printing 5.49 2.14 24 Lumber and wood products 6.39 3.17
23 Coke and petroleum products 5.80 0.81 25 Furniture and fixtures 5.03 2.59
24 Chemicals 6.08 1.45 26 Paper and allied products 5.26 1.87
25 Rubber and plastic products 4.46 1.79 27 Printing and publishing 5.49 2.14
26 Non-metallic mineral products 5.79 1.74 28 Chemicals and allied products 6.02 1.44
27 Basic metals 4.90 2.13 29 Petroleum and coal products 4.89 0.95
28 Fabricated metal products 5.71 1.98 30 Rubber and plastics 4.29 1.52
29 Machinery and equipment n.e.c. 4.30 1.74 31 Leather and leather products 9.00 2.37
30 Office machinery and computers 8.67 2.20 32 Stone, clay, and glass products 5.93 1.79
31 Electrical machinery 5.92 1.52 33 Primary metal industries 4.90 2.13
32 Communication equipment 8.45 2.27 34 Fabricated metal products 4.31 1.83
33 Instruments, watches and clocks 5.72 1.45 35 Machinery and equipment 4.52 1.75
34 Motor vehicles and trailers 5.20 2.42 36 Electrical and electronic equipment 7.07 1.89
35 Other transport equipment 7.96 2.18 37 Transportation equipment 6.77 2.27
36 Furniture; manufacturing n.e.c. 7.92 2.33 38 Instruments and related products 6.02 1.05
40 Electricity, gas, hot water 5.56 0.88 39 Miscellaneous manufacturing 8.62 2.25
41 Distribution of water 1.74 0.28 40 Railroads and rail transportation 4.87 2.48
45 Construction 8.14 4.14 41 Local passenger transit 5.90 3.98
50 Sale and repair of motor vehicles 5.05 2.74 42 Motor freight transportation 8.45 7.33
51 Wholesale trade 5.35 1.54 44 Water transportation 4.22 1.56
52 Retail trade 7.19 2.81 45 Transportation by air 4.65 1.55
55 Hotels and restaurants 5.95 2.54 46 Pipelines, except natural gas 2.22 0.44
60 Land transport 8.41 7.68 47 Transportation services 8.24 2.14
61 Water transport 5.61 1.95 48 Communications 8.80 1.77
62 Air transport 6.19 1.75 49 Electric, gas, and sanitary services 4.68 1.51
63 Supporting transport activities 6.77 1.67 50 Wholesale trade–durable goods 4.94 1.50
64 Post and telecommunications 10.09 2.14 51 Wholesale trade–nondurable goods 5.68 1.68
70 Real estate activities 5.33 1.56 52 Building materials 4.93 1.81
71 Renting of machinery,
equipment
6.34 1.93 53 General merchandise stores 6.44 2.21
72 Computer and related activities 10.73 1.91 54 Food stores 5.72 2.28
73 Research and development 6.53 0.93 55 Automotive dealers; gas stations 4.68 2.02
74 Other business activities 9.65 4.60 56 Apparel and accessory stores 8.61 2.42
85 Health and social work 2.83 1.51 57 Furniture stores 7.56 2.61
90 Sewage; disposal; sanitation 5.43 2.22 58 Eating and drinking places 6.29 2.77
92 Recreation, culture and sports 6.46 2.35 59 Miscellaneous retail 7.55 2.97
93 Other services activities 6.46 3.67 65 Real estate 5.22 1.52

ARTICLE IN PRESS
Table 14 (continued )
NACE Industry Entry Exit SIC Industry Entry Exit
70 Hotels and other lodging places 3.83 1.13
72 Personal services 6.56 3.73
73 Business services 11.49 5.68
75 Automotive repair and services 5.47 3.31
76 Miscellaneous repair services 8.09 4.14
78 Motion pictures 9.58 3.47
79 Amusement and recreation 6.20 2.43
80 Health services 2.19 1.04
83 Social services 4.52 2.70
L. Klapper et al. / Journal of Financial Economics 82 (2006) 591–629628
Sample of all U.S. corporations from Dun & Bradstreet. Averages for the years1998–1999. Entry is the percentage of new corporations (firms that are one year old). Exit
is the percentage of firms that exited following formal bankruptcy proceedings.
References
Barth, J.R., Caprio Jr., G., Levine, R., 2004. Bank supervision and regulation: what works best? Journal of
Financial Intermediation 13, 205–248.
Bertrand, M., Kramarz, F., 2002. Does entry regulation hinder job creation? Evidence from the French retail
industry. Quarterly Journal of Economics 117, 1369–1413.
Black, S.E., Strahan, P.E., 2002. Entrepreneurship and bank credit availability. Journal of Finance 57, 2807–2833.
Botero, J., Djankov, S., La Porta, R., Lopez-de-Silanes, F., Shleifer, A., 2004. The regulation of labor. Quarterly
Journal of Economics 119, 1339–1382.
Cable, J., Schwalbach, J., 1991. International comparisons of entry and exit: entry and market contestability. In:
Geroski, P.A., Schwalbach, J. (Eds.), Entry and Market Contestability: An International Comparison.
Blackwell Publishers, London, pp. 257–281.
Claessens, S., Laeven, L., 2003. Financial development, property rights, and growth. Journal of Finance 58,
2401–2436.
Desai, M., Gompers, P., Lerner, J., 2003. Institutions, capital constraints and entrepreneurial firm dynamics:
evidence from Europe. Unpublished working paper. National Bureau of Economic Research.
De Soto, H., 1990. The Other Path. Harper and Row, New York.
Di Patti, E.B., Dell’Ariccia, G., 2004. Bank competition and firm creation. Journal of Money, Credit, and
Banking 36, 225–252.
Djankov, S., La Porta, R., Lopez-de-Silanes, F., Shleifer, A., 2002. The regulation of entry. Quarterly Journal of
Economics 117, 1–35.
Djankov, S., Hart, O., Nenova, T., Shleifer, A., 2003.Efficiency in bankruptcy. Unpublished working paper.
Harvard University, Department of Economics.
Dunne, T., Roberts, M.J., 1991. Variation in producer turnover across US manufacturing industries. In: Geroski,
P.A., Schwalbach, J. (Eds.), Entry and Market Contestability: An International Comparison. Blackwell
Publishers, London, pp. 187–203.
Dunne, T., Roberts, M.J., Samuelson, L., 1988. Patterns of firm entry and exit in U. S. manufacturing industries.
RAND Journal of Economics 19, 495–515.
European Commission, 2003. Enterprises in Europe, Sixth Report. Eurostat, Office for Official Publications of the
European Communities, Luxembourg.
Evans, D.S., Jovanovic, B., 1989. An estimated model of entrepreneurial choice under liquidity constraints.
Journal of Political Economy 97, 808–827.
Fisman, R., Love, I., 2003a. Trade credit, financial intermediary development and industry growth. Journal of
Finance 58, 353–374.
Fisman, R., Love, I., 2003b. Financial dependence and growth revisited. Unpublished Working Paper, National
Bureau of Economic Research.

ARTICLE IN PRESSL. Klapper et al. / Journal of Financial Economics 82 (2006) 591–629 629
Gilbert, R.J., 1989. Mobility barriers and the value of incumbency. In: Schmalensee, R.L., Willig, R.D. (Eds.),
Handbook of Industrial Organization, vol. 1. Elsevier, Amsterdam, pp. 720–781.
Halpern, P., Trebilcock, M., Turnbull, S., 1980. An economic analysis of limited liability in corporate law.
University of Toronto Law Review 30, 117–150.
Hause, J.C., du Rietz, G., 1984. Entry, industry growth, and the microdynamics of industry supply. Journal of
Political Economy 92, 733–757.
Johnson, S., McMillan, J., Woodruff, C., 2002. Property rights and finance. American Economic Review 92,
1335–1356.
Kumar, K., Rajan, R., Zingales, L., 2002. What determines firm size? Unpublished working paper, University of
Chicago.
La Porta, R., Lopez-de-Silanes, F., Shleifer, A., Vishny, R.W., 1999. The quality of government. Journal of Law,
Economics, and Organization 15, 222–279.
Rajan, R., Zingales, L., 1998. Financial dependence and growth. American Economic Review 88, 559–586.
Rajan, R., Zingales, L., 2003. The great reversal: the politics of financial development in the 20th century. Journal
of Financial Economics 69, 5–50.
Scarpetta, S., Hemmings, P., Tressel, T., Woo, J., 2002. The role of policy and institutions for productivity and
firm dynamics: evidence from micro and industry data. Unpublished Working Paper, OECD.
Schneider, F., 2002. Size and measurement of the informal economy in 110 countries around the world.
Unpublished Working Paper, World Bank.
Schumpeter, J.A., 1911. Theorie Der Wirtschaftlichen Entwicklung. Duncker & Humblot, Leipzig.
World Bank, 2004. Doing Business 2004: Understanding Regulation. World Bank and Oxford University Press,
Washington DC.
Further reading
Gordon, R., MacKie-Mason, J.K., 1997. How much do taxes discourage incorporation? Journal of Finance 52,
477–505.