Embed Size (px)
Citation preview

Preliminary Investigation Caltrans Division of Research, Innovation and System Information
Ensuring Accuracy of Roadway Surface
Condition Sensors
Requested by Ian Turnbull, Caltrans Office of ITS Engineering and Support
June 1, 2016
The Caltrans Division of Research, Innovation and System Information (DRISI) receives and evaluates numerous research problem statements for funding every year. DRISI conducts Preliminary Investigations on these problem statements to better scope and prioritize the proposed research in light of existing credible work on the topics nationally and internationally. Online and print sources for Preliminary Investigations include the National Cooperative Highway Research Program (NCHRP) and other Transportation Research Board (TRB) programs, the American Association of State Highway and Transportation Officials (AASHTO), the research and practices of other transportation agencies, and related academic and industry research. The views and conclusions in cited works, while generally peer reviewed or published by authoritative sources, may not be accepted without qualification by all experts in the field. The contents of this document reflect the views of the authors, who are responsible for the facts and accuracy of the data presented herein. The contents do not necessarily reflect the official views or policies of the California Department of Transportation, the State of California, or the Federal Highway Administration. This document does not constitute a standard, specification, or regulation. No part of this publication should be construed as an endorsement for a commercial product, manufacturer, contractor, or consultant. Any trade names or photos of commercial products appearing in this publication are for clarity only.
Table of Contents
Executive Summary ................................................................................................................... 2 Background ............................................................................................................................... 2
Summary of Findings ................................................................................................................ 2
Gaps in Findings ....................................................................................................................... 3
Next Steps ................................................................................................................................. 3
Detailed Findings ........................................................................................................................ 4
Consultation with Practitioners and Experts .............................................................................. 4
Related Resources .................................................................................................................. 14
Contacts .................................................................................................................................... 19
Appendices ............................................................................................................................... 20

Produced by CTC & Associates LLC 2
Executive Summary
Background Road Weather Information Systems (RWIS) utilize a variety of sensors to measure environmental conditions (such as wind speed and direction, air temperature, and precipitation) and roadway conditions (such as pavement surface temperature and moisture state). The information gathered using these sensors is critical for planning winter maintenance activities and for alerting the public to hazardous road conditions. Methods of verifying the performance of environmental sensors are well known and utilized. However, verifying the accuracy of the roadway sensors in the field is much more difficult and, therefore, not commonly done. Caltrans needs a practical, effective method for ground-truthing existing roadway sensors to ensure they remain operational and accurate. The focus is on in-pavement sensors, embedded either at the surface of the roadway (flush with the pavement) or buried below the surface within the pavement. To gather information for this report, we reviewed recent research and literature on verifying the accuracy of in-pavement sensors and conducted interviews with experts and practitioners involved in the use and testing of embedded sensors.
Summary of Findings There is little available research related to ground-truthing embedded pavement sensors. The research that has been completed, while appearing to yield effective results for determining sensor accuracy, recommends methods that are impractical (involving road closures, equipment and staff working on the roadway, etc.). Refer to the section of this report on Related Resources (page 14) for details. To identify potential alternatives, we interviewed representatives from state DOTs, FWHA, and academia. Three key observations, described below, emerged from these interviews. Refer to the resources under Consultation with Practitioners and Experts (page 4) for details.
Trend away from in-pavement sensors Both Laura Fay, a researcher at Western Transportation Institute, and Jakin Koll, the Minnesota DOT MDSS/AVL/RWIS Implementation Coordinator, said that they saw a potential trend away from the use of in-pavement sensors for gathering pavement condition data. With the emergence of effective mobile or remote sensor technologies and the expansion of data sharing efforts to provide a multi-dimensional view of road conditions, there will likely be even less research focus in the future on monitoring and maintaining embedded sensors.
Expanded use of mobile or remote sensors All of our interviewees talked about the use of mobile (attached to a vehicle) or remote (off roadway) sensors as an alternative or complement to in-pavement sensors. New remote sensors have been developed in recent years to provide pavement condition readings, and some states like Minnesota are actively testing them for accuracy and reliable use in the field. Several of our interviewees commented that handheld, vehicle-mounted or other non-roadway

Produced by CTC & Associates LLC 3
sensors could potentially be used to successfully ground-truth embedded pavement sensors once more research and development has been completed.
Reliance on multiple data sources for confirming accuracy Our interviewees talked about using multiple sources of data as a way to confirm the accuracy of pavement sensors and to support overall decision making in maintenance operations. There have been multiple national data sharing efforts over the last decade (Clarus, MADIS, the Weather Data Environment) aimed at helping agencies access and review data compiled from multiple sources (in-pavement sensors/RWIS stations, mobile sensors, weather forecasts, etc.), both in their own states and around the country. These initiatives include data quality checks, flagging data outliers among the sources that are reporting from a single location. DOTs can use this information to get a full view of road conditions and to identify sensors that don’t appear to be working properly. In addition, several interviewees said that they see the future of sensor research and technology in connected vehicle initiatives. Beyond gathering data from RWIS stations or sensors mounted on maintenance trucks, the U.S. Department of Transportation is spearheading research efforts involving road condition data gathered from any vehicle on the roadway. The methods and technologies for gathering, integrating and using data related to road conditions are only expected to expand in the future. The interview results with Paul Pisano, FHWA, on page 10 include an overview of the national data sharing initiatives. In addition, refer to the resources under Connected Vehicle and Road Weather Conditions (page 16).
Gaps in Findings This research uncovered limited guidance for accurately ground-truthing pavement sensors in a way that would limit disruption to traffic while keeping maintenance workers safe on or near the roadway. The potential alternatives suggested by our interviewees (using mobile sensor data and other sources of comparison data) do not provide immediate, practical alternatives for Caltrans to implement and need to be further tested and developed before they could replace traditional ground-truthing approaches. This appears to be an emerging field, with state and national research efforts in this area focused primarily on the significant expansion of road weather condition data gathering, integration and quality checking as a way to inform actions in maintenance operations.
Next Steps Minnesota DOT appears to be a leader in using the latest technologies and practices for gathering pavement condition data, employing the range of available sensors (in-pavement stationary out-of-pavement, and mobile) and participating in a range of national data sharing efforts. It may be useful to Caltrans to contact Jakin Koll at MnDOT for more information. Paul Pisano provided a number of contacts if Caltrans would like to learn more about the MADIS and Weather Data Environment data sharing initiatives. Caltrans may wish to explore the possibility of participating in these efforts as a way to access the data quality checks provided. In addition, there are several sensor-related research projects in progress (see page 15), which Caltrans may want to review when they are complete.

Produced by CTC & Associates LLC 4
Detailed Findings
Consultation with Practitioners and Experts
We contacted individuals experienced with the use and challenges of embedded pavement sensors to gather information successful practices and trends in confirming their accuracy in the field.
University Contact: Laura Fay, Research Scientist II, Winter Maintenance & Effects Program Manager Western Transportation Institute – Montana State University, 406-600-5777, [email protected] Laura Fay is a researcher who specializes in environmental sciences and has conducted a number of research projects for the national Clear Roads winter maintenance consortium. We asked Fay if she was aware of any research on verifying the accuracy of embedded roadway sensors without disrupting traffic or placing maintenance workers near moving traffic. She said that she couldn’t recall any documents that addressed this issue specifically. Fay said that she expected within 10 years all pavement condition sensors would be remote (stationary remote or mounted on vehicles) as opposed to placed in pavements. She indicated that in-pavement technology is becoming outdated and agencies are moving to non-contact sensors. Fay noted that there are accurate, handheld pavement temperature sensors available. To double check the data being reported by an embedded sensor, one could bring up real-time data from the sensor and then point a handheld temperature gun at the pavement from the side of the road (inside a car) for comparison. She said that the newer versions of pavement condition sensors are mounted a good distance away from the pavement while still being accurate. Fay said that Lufft USA, Inc. makes a new mobile product called MARWIS for monitoring a wide range of pavement and environmental conditions. The device attaches magnetically to any vehicle, providing data real time to an iPad. The data then gets uploaded to a central system and saved. Fay pointed out that the product recently won an award and recommended we talk to Lufft or others involved in mobile sensor technology. Fay also suggested that the future of pavement sensing is with connected vehicle initiatives. There will be networked, wireless communications and data exchange between vehicles, road weather information systems (RWIS), and the National Weather Service. Fay speculated that in the future ground-truthing may not be necessary because one could program a trigger into data management systems for checking on the accuracy of a sensor if there is a deviation among the various data sources.

Produced by CTC & Associates LLC 5
State DOTs
Iowa Department of Transportation Contact: Tina Greenfield-Huitt, RWIS Coordinator, Iowa Department of Transportation, 515-233-7746, [email protected] We talked to Tina Greenfield-Huitt, the RWIS Coordinator for Iowa DOT and the agency’s representative for the national Aurora pooled fund research program, which focuses on RWIS. She said that Iowa DOT doesn’t have a formal approach for ground-truthing in-pavement sensors. Instead, the agency compares temperature data coming from several sources to help them recognize when there is a problem with a particular sensor. Below are examples that Greenfield-Huitt provided of getting these “second opinions”:
• Most supervisor and plow trucks are outfitted with non-contact infrared sensors that capture pavement temperature. Staff can compare the temperature recorded when driving over an in-pavement sensor with the temperature reported by the pavement sensor. According to Greenfield-Huitt, the in-pavement sensors are usually within two degrees of the truck sensors, so it’s cause for concern when they’re four or five degrees off.
• Iowa DOT typically does not install only a single pavement sensor on a roadway or bridge deck. There are usually multiple sensors installed, which can be compared to one another. In addition, both bridge and road sensors are attached to an RWIS station. Slight differences between sensors that are close to one another are expected due to location variation and road direction. However, if there is a more pronounced variation in temperatures, then staff can go out and take a reading with a handheld infrared monitor to see if it matches what the pavement sensor is reporting. A lot of Iowa roads are rural enough that they don’t need to close roads to use a handheld unit on location.
• For overall sensor system monitoring, Greenfield-Huitt says it’s helpful to look across the sites to see how the data compare. She said that RWIS sites placed 20 or 30 miles away from one another are expected to show some variation, but a sensor registering at 36 degrees surrounded by a bunch of sensors reporting at 30 degrees is suspicious. Greenfield-Huitt said that Iowa DOT has taken advantage of the Clarus research initiative, which was established in 2004 by FHWA. The initiative developed an online portal for real-time information about surface transportation environmental conditions. Sensor data from multiple agencies was integrated and then quality checked to help improve condition reporting to the traveling public. Pavement sensor readings that were suspect based on reported weather conditions and the readings from nearby sensors were flagged. The Clarus research project ended, but the activities have continued through the Meteorological Assimilation Data Ingest System (MADIS) through the National Weather Service. Any state that participates can take advantage of the data quality checks performed on the sensors, which helps to point out sensors that need a second look. Refer to the interview below with Paul Pisano at FHWA for more information about Clarus and MADIS.
Greenfield-Huitt was not aware of any research that provided simple methods for ground truthing in-pavement sensors. She referenced the 2005 NCHRP report on “Testing and Calibration Methods for RWIS Sensors” (see Related Resources on page 14), but noted that the methods suggested in the report are very involved. As detailed in the report, checking sensor
Produced by CTC & Associates LLC 6
accuracy requires lane closures, shielding sensors from the sun, etc. Greenfield-Huitt said that the approaches presented are good if exceptional accuracy is needed for research purposes, but she wasn’t aware of any agencies that had implemented them in practice. Finally, Greenfield-Huitt said that Iowa DOT’s in-pavement sensors are not calibrateable, so once they stop performing they get replaced.
Minnesota Department of Transportation Contact: Jakin Koll, MDSS and Road/Weather Forecasting Coordinator, Minnesota DOT, 320-223-6604, [email protected] We spoke with Jakin Koll about MnDOT’s experience using the mobile road weather information sensors and some thoughts on calibrating or ground-truthing in-pavement sensors. As a backdrop to our discussion, he provided the summary below to introduce MnDOT’s use of RWIS sensors:
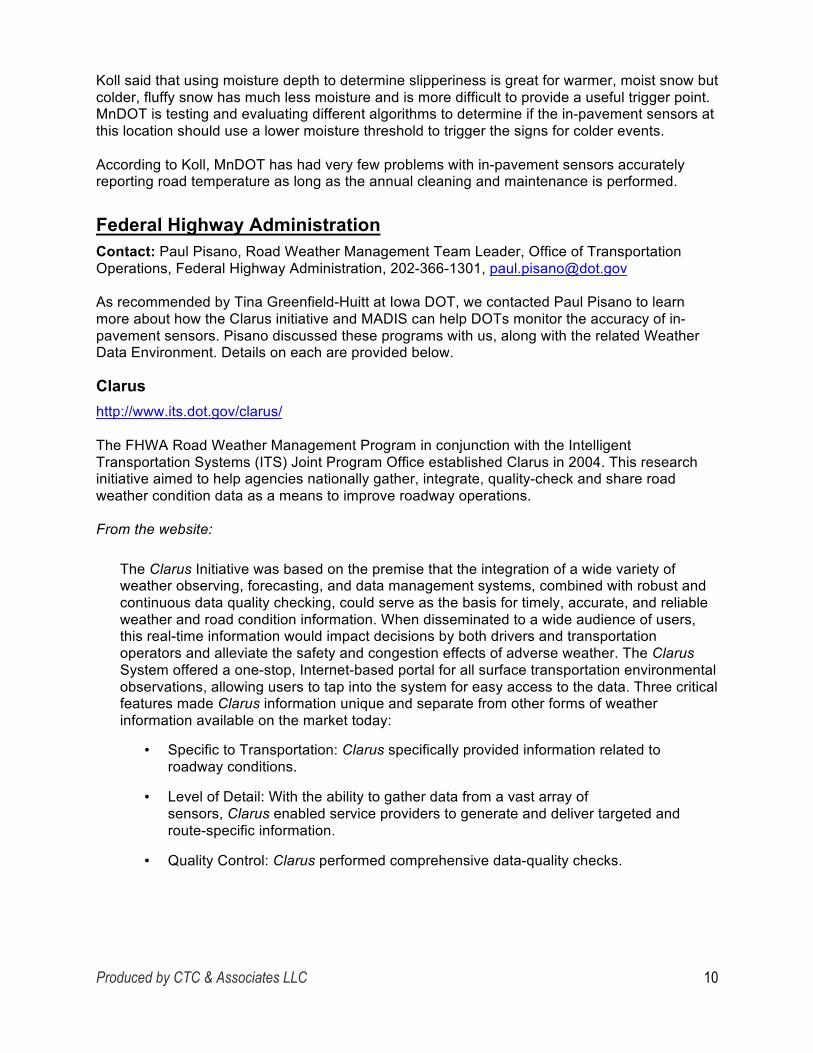
Typically, RWIS sensors are embedded flush in the roadway surface (pictures below). Their installation and maintenance requires a lane of traffic be temporarily closed while work is performed. These sensors must be moved if a road is resurfaced or reconstructed. Scheduling work to be done during non-peak traffic hours can be difficult for roadway managers, especially when work is often performed by sensor vendors or specially trained personnel. Currently, many of the sensors in use in the field do not require recalibration;; however, they do need occasional cleaning to prevent misrepresentation of field data readings.
Embedded RWIS In-Pavement (Puck) Sensor

Produced by CTC & Associates LLC 7
Some areas get creative (see the photo below) to help locate the position of in-pavement sensors. This helps protect the sensors as crews notice the puck during construction or
maintenance (patching, re-paving, etc.).
Calibration of pavement sensors is required to achieve accurate sensor operation. Sensor calibration falls into three categories: initial calibration, onsite calibration and periodic re-calibration. The initial calibration occurs in a laboratory setting and is commonly performed by the pavement sensor manufacturers. Onsite calibration, if performed, occurs at the field installation site. Periodic recalibration is conducted when sensor readings are inadequate or as determined or needed by an agency.
Because of the disadvantages associated with in-pavement puck sensors, another detection technology has been considered because it is non-intrusive: infrared (IR) cameras. IR cameras have the advantage of being installed above the roadway surface (pictures below).
Both installation and maintenance can be performed with minimal disruption of traffic. In addition, the sensor can be easily moved or replaced. The IR camera can measure the same road weather parameters measured by in-pavement (puck) RWIS sensors. Internet connections also allow roadway managers to receive real-time information on roadway conditions.
Pole Mounted Tower Mounted Structure Mounted

Produced by CTC & Associates LLC 8
For detailed information on calibration of pavement temperature sensors refer to the following reports from the Aurora Pooled Fund Study:
The Aurora Consortium: Laboratory and Field Studies of Pavement Temperature Sensors (2005) http://www.lrrb.org/media/reports/200544.pdf
Aurora Standardized Testing Methodologies for Pavement Sensors (1999) http://www.aurora-program.org/pdf/stmph1_final.pdf
According to Koll, MnDOT has installed 98 RWIS stations since 2000, with most installed between 2000 and 2001. Koll said that MnDOT plans to expand its RWIS network over the next several years, and some may not be embedded in the pavement. He said that over the past several years there has been more interest in using non-invasive pavement sensors in the RWIS world because the typical in-pavement sensors sometimes get damaged or completely destroyed during construction projects. In addition, the maintenance community has a great interest in mobile pavement sensors. These sensors use the same IR technology as the non-invasive sensors described in Koll’s summary above. MnDOT has been testing several mobile pavement sensors over the past couple of years:
• Lufft MARWIS (http://www.lufft-marwis.de/en_US/features)
• High Sierra Ice Sight (http://www.highsierraelectronics.com/download/5433.pdf)
• Teconer Road Condition Monitor RCM411 (http://www.teconer.fi/en/winter.html)
• Vaisala Condition Patrol DPS310 (http://www.vaisala.com/en/roads/products/mobileweathersystems/Pages/DSP310.aspx)
Koll also hopes to test the MetSense MetRoadMobile (http://www.metsense.com/MetRoadMobile) during the 2016-2017 winter.
Mobile sensor technology shows promise for accurately reporting road temperatures, road conditions and friction (how slippery the road is). In the future, with additional testing, development and evaluation, Koll says they may provide the capability of verifying the readings from in-pavement sensors without having to close a lane of traffic. Koll emphasized the importance of comparing data on a cloudy day because sunshine can adversely affect the readings. See Appendices A and B for written evaluation provided by Koll on his experience testing MARWIS sensors in 2015 and 2016. However, Koll says more research, testing, development and evaluation of the mobile sensors is needed. He hopes to conduct detailed evaluations on sensors from the five companies listed above this fall/winter. Based on those evaluations, MnDOT may select the most accurate sensor(s) for a larger deployment (20-30 sensors) for testing in the field. He is in the early stages of developing a proposal to conduct real-word experiments with live traffic and snow and ice events, possibly using the MnROAD pavement testing facility in central Minnesota (http://www.dot.state.mn.us/mnroad/).

Produced by CTC & Associates LLC 9
MnDOT has been using mobile road temperature sensors on plow trucks and supervisors’ vehicles to supplement its extensive RWIS network for many years. These sensors assist in the decisionmaking process and help MnDOT accomplish their goal of the 4 R’s (The Right Material, the Right Amount, the Right Place at the Right Time). Koll hopes that after further testing and evaluation MnDOT can add mobile road condition and friction sensors to their snow and ice control toolbox. Beyond using mobile sensors as a complement to in-pavement sensors, MnDOT is involved in several national initiatives aimed at helping states share road and weather condition data to support maintenance decision making:
• Maintenance Decision Support System (http://www.rap.ucar.edu/projects/rdwx_mdss/) (http://www.pooledfund.org/details/study/240) (http://mdss.iteris.com/mdss/pfs/)
o MnDOT is involved in the pooled fund MDSS Project.
• Meteorological Assimilation Data Ingest System (MADIS) (https://madis.noaa.gov/)
o MADIS is a meteorological observational database and data delivery system that provides observations that cover the globe.
• Clarus initiative (http://www.its.dot.gov/clarus/)
o Clarus integrates road weather observations and forecasts to establish a Nationwide Surface Transportation Weather Observing and Forecasting System.
• Integrated Mobile Observations (IMO) (http://www.its.dot.gov/press/mobile_weather_station.htm)
The IMO project is a research effort through the U.S. Department of Transportation that “aims to demonstrate how mobile vehicle data can be collected, transmitted, processed, and used for decision making.” MnDOT, Michigan DOT, Nevada DOT and the National Center of Atmospheric Research (NCAR) are involved in the project. See the resources under Connected Vehicle and Road Weather Conditions on page 16 for more information.
Koll gave an example of how MnDOT has used data from multiple sources to make adjustments to traffic alerts triggered by embedded sensors. The agency installed three in-pavement sensors near a rural high school where there was a known problem with blown ice (ice formed when snow blows across road and sticks). When these sensors detected ice, a flashing light on two signs (east/west bound traffic) reading “Ice Present When Flashing” activated to alert drivers. However, the sensors were way too sensitive at first, activating the driver alerts unnecessarily. The signs were activating when any ice was detected on the sensor, even if the ice was not nearly enough to be above the normal roughness of the road and therefore not affecting traffic. MnDOT used MDSS data, pavement sensor data (both in-pavement at the site as well as mobile sensor data), cameras, and operator observations to confirm and help tweak the system for activating the signs. Based on this analysis it was recommended that the in-pavement sensors should use a moisture depth algorithm as an indication of slipperiness to reduce or eliminate the false alarms. By adjusting this threshold for the sensors, which could be done remotely by computer, and then confirming the accuracy on site using observations by maintenance personnel and a video feed, they were able to ensure that the sensor was triggering the sign appropriately.
Produced by CTC & Associates LLC 10
Koll said that using moisture depth to determine slipperiness is great for warmer, moist snow but colder, fluffy snow has much less moisture and is more difficult to provide a useful trigger point. MnDOT is testing and evaluating different algorithms to determine if the in-pavement sensors at this location should use a lower moisture threshold to trigger the signs for colder events. According to Koll, MnDOT has had very few problems with in-pavement sensors accurately reporting road temperature as long as the annual cleaning and maintenance is performed.
Federal Highway Administration Contact: Paul Pisano, Road Weather Management Team Leader, Office of Transportation Operations, Federal Highway Administration, 202-366-1301, [email protected] As recommended by Tina Greenfield-Huitt at Iowa DOT, we contacted Paul Pisano to learn more about how the Clarus initiative and MADIS can help DOTs monitor the accuracy of in-pavement sensors. Pisano discussed these programs with us, along with the related Weather Data Environment. Details on each are provided below.
Clarus http://www.its.dot.gov/clarus/ The FHWA Road Weather Management Program in conjunction with the Intelligent Transportation Systems (ITS) Joint Program Office established Clarus in 2004. This research initiative aimed to help agencies nationally gather, integrate, quality-check and share road weather condition data as a means to improve roadway operations. From the website:
The Clarus Initiative was based on the premise that the integration of a wide variety of weather observing, forecasting, and data management systems, combined with robust and continuous data quality checking, could serve as the basis for timely, accurate, and reliable weather and road condition information. When disseminated to a wide audience of users, this real-time information would impact decisions by both drivers and transportation operators and alleviate the safety and congestion effects of adverse weather. The Clarus System offered a one-stop, Internet-based portal for all surface transportation environmental observations, allowing users to tap into the system for easy access to the data. Three critical features made Clarus information unique and separate from other forms of weather information available on the market today:
• Specific to Transportation: Clarus specifically provided information related to roadway conditions.
• Level of Detail: With the ability to gather data from a vast array of sensors, Clarus enabled service providers to generate and deliver targeted and route-specific information.
• Quality Control: Clarus performed comprehensive data-quality checks.

Produced by CTC & Associates LLC 11
According to Pisano, Clarus ended in 2013. However, several other data gathering efforts are supporting research and helping DOTs operationally. See the MADIS and Weather Data Environment (WxDE) descriptions below and an overview of the Clarus-MADIS transition here: http://esrl.noaa.gov/gsd/isb/dads/developmentefforts/clarus.html
MADIS https://madis.noaa.gov/ Operated by the National Weather Service and the National Oceanic Administration, MADIS (Meteorological Assimilation Data Ingest System) gathers and integrates data from RWIS sensors and many other sources internationally and then conducts quality checks to flag suspect data sources. From the MADIS website (https://madis.noaa.gov/madis_rwis.shtml):
MADIS has been collecting data from state Department of Transportation (DOT) providers since MADIS went live on July 1, 2001. The first DOT provider was the Kansas DOT in 2001, followed by the Iowa and Minnesota DOTs later that year. Because DOT providers have continued to participate, MADIS is now collecting data from 33 state DOTs… In FY2013 the Federal Highway Administration's (FHWA) Road Weather Management Program (RWPM) contracted MADIS to port it's Clarus system into MADIS. In order for MADIS to fully support all the Environmental Sensor Stations (ESS) atmospheric, pavement and water level data, MADIS will expand its data categories to include a Road Weather Information System (RWIS) database type.
According to Pisano, MADIS is in the process of incorporating quality algorithms for roadway/RWIS data. Previously, there hadn’t been the same level of data checking on RWIS sources. Per the MADIS website in November 2015, the following additions were expected to be complete by April 2016:
• Clarus quality control to MADIS. • All Clarus observations. • All Clarus metadata. • Enhancements to MADIS subscription and distribution services for handling all
Clarus data and metadata. • All Clarus RWIS providers and RWIS providers that aren't in Clarus.
See the latest development initiatives on the MADIS website: https://madis.noaa.gov/madis_comingsoon.shtml
Produced by CTC & Associates LLC 12
Weather Data Environment (WxDE) http://74.254.188.153 The Weather Data Environment is a product of the Turner Fairbank Highway Research Center through FHWA. From the website:
The Weather Data Environment (WxDE) is a research project that collects and shares transportation-related weather data with a particular focus on weather data related to connected vehicle applications. The WxDE collects data in real time from both fixed environmental sensor stations and mobile sources. The WxDE computes value-added enhancements to this data, such as by computing quality-check values for observed data and computing inferred weather parameters from vehicle data (e.g., inferring precipitation based on windshield wiper activation). The WxDE archives both collected and computed data. The WxDE supports subscriptions for access to real-time data in near real time generated by individual weather-related connected vehicle projects.
The website includes an interactive map for viewing sensor data from around the country: http://74.254.188.153/wdeMap.jsp?lat=37.7&lon=-119.4&zoom=6 The link on the WxDE website above shows grayed out potential sensor data sources in California (both mobile and fixed). Because Caltrans does not participate in the WxDE, there is no data available from these sensors when clicking on the map. Clicking on the dark pink sensor sources in the states that do participate in WxDE shows data that are available for review and quality control.
Data Sharing Agreements – MADIS and WxDE Pisano noted that Caltrans does not currently share data with through MADIS or WxDE, although the agency had previously contributed data to Clarus. There is no cost to states to participate, and the data is quality checked for free. In addition, agencies can subscribe to updates from the sensor analyses completed on the data, with flags for data that failed the quality checks. Participating in WxDE require completion of a one-page data sharing agreement (see Appendix C), and participation in MADIS requires completion of a two-page agreement (see Appendix D). Pisano, with the assistance of Ray Murphy at FHWA, reached out to Steven Hancock at Caltrans in April 2014 to encourage participation in MADIS and WxDE. Pisano provided the following additional contacts for more information about MADIS and WxDE:
Steve Pritchett, National Oceanic and Atmospheric Administration As the MADIS manager, Pritchett can provide details about the system. [email protected] 301-427-9121

Produced by CTC & Associates LLC 13
James O’Sullivan, National Weather Service O’Sullivan can answer questions about data sharing and access agreements. [email protected] 301-713-1858, ext. 126 Ray Murphy, FHWA, Office of Technical Services Murphy is a resource for DOTs about the highway side of the agreements. [email protected] 708-283-3517 Brenda Boyce, Booz Allen Boyce provides technical support for FHWA’s Road Weather Management Program, which is responsible for WxDE. [email protected] 913-522-0068
Related Resource:
WRTM Stakeholder Meeting: Weather Data Environment and MADIS, Presentation by Brenda Boyce, October 20-21, 2015 http://www.its.dot.gov/road_weather/pdf/wrtm2015/4.2%20Boyce%20-%20Weather%20Data%20Environment%20and%20MADIS%20v3.pdf

Produced by CTC & Associates LLC 14
Related Resources
Completed Research Study on Standardized Testing Methodologies for Embedded Pavement Status Sensors, Service Operations and Logistics, and Informatics, 2014 IEEE International Conference http://ieeexplore.ieee.org/xpl/login.jsp?tp=&arnumber=6960753&url=http%3A%2F%2Fieeexplore.ieee.org%2Fiel7%2F6948741%2F6960682%2F06960753.pdf%3Farnumber%3D6960753 From the abstract:
This paper proposes the standardized testing methodologies for embedded pavement status sensors based on the road weather meteorological environment monitoring and service requirements. A large number of possible testing procedures were developed for measuring pavement surface temperature, sensor moisture state and the water film thickness. In a year and a half of the time, three factory embedded pavement status Sensors are tested, the outdoor data in different environment including rainy, snowy, sunny and freeze days is analyzed. The test results verify the accuracy, maneuverability and repeatability of the testing technology, and the standardized testing methodologies will fill the blank of domestic pavement status sensors testing methodologies, improve the efficiency of the highway maintenance and highway management, avoid highway traffic delay, reduce the traffic accident due to bad weather.
Testing the Accuracy of Infrared Temperature Sensors, TRB 2013 Annual Meeting Paper http://assets.conferencespot.org/fileserver/file/46034/filename/2vcf95.pdf From the abstract:
Boise State University (BSU) designed and conducted an experiment to test the accuracy of pavement temperature sensors installed at four Road Weather Information System (RWIS) sites in Idaho. A thermistor and four thermocouples were used as the reference instruments. Data was collected around 10 AM during weekdays. At least 30 measurements were made at 3 to 5 minute intervals. The measurement area was shaded in Phase I and unshaded in Phase II of the project. Analysis of the data indicated that the temperatures collected by the RWIS temperature sensors do not statistically match the data collected by the reference instruments in five out of seven cases. Deviations between the RWIS sensors and contact thermometers were found to be larger on days with clear skies. Data was collected during May and June of 2010 in Phase I, and during May 2011 in Phase II. The RWIS sensor data are posted to the vendor’s website throughout the year. Based on the results from this project, temperature data collected during May and June are unreliable and should not be publicized. Since the prediction of road surface conditions is not a trivial task, more research is urgently needed to establish testing procedures for existing sensors, develop acceptable error ranges, and identify the use of other sensors to complement the information obtained from the RWIS sensors.
Models for Predicting RWIS Sensor Misalignments and Their Causes, Intelligent Transportation Systems Institute, 2010 http://www.cts.umn.edu/Publications/ResearchReports/reportdetail.html?id=1856 From the abstract:
The Minnesota Department of Transportation uses the Road Weather Information System (RWIS) for monitoring the current weather and surface conditions of its highways. The real-

Produced by CTC & Associates LLC 15
time data received from these sensors reduce the need for road patrolling in specific locations by providing information to those responsible for directing winter maintenance operations. Since most road maintenance decisions and weather forecasts are explicitly dependent on the reliability and accuracy of the RWIS sensor data, it is important for one to be able to determine the reliability of the sensor data, that is, to determine whether a sensor is malfunctioning. In a previous project the authors investigated the use of machine learning techniques to predict sensor malfunctions and thereby improve accuracy in forecasting weather-related conditions. In this project, the authors used their findings to automate the process of identifying malfunctioning weather sensors in real time. The authors analyze the weather data reported by various sensors to detect possible anomalies. Their interface system allows users to define decision-making rules based on their real-world experience in identifying malfunctions. Since decision rule parameters set by the user may result in a false indication of a sensor malfunction, the system analyzes all proposed rules based on historical data and recommends optimal rule parameters. If the user follows these automated suggestions, the accuracy of the software to detect a malfunctioning sensor increases significantly. This report provides an overview of the software tool developed to support detection of sensor malfunctions.
Test Methods for Evaluating Field Performance of RWIS Sensors, NCHRP Web-Only Document 87 (Project 6-15), 2006 http://onlinepubs.trb.org/onlinepubs/nchrp/nchrp_webdoc_87part2.pdf From the abstract:
Transportation agencies are increasingly dependent on data from Road Weather Information Systems (RWIS) for their snow and ice control operations. However, uncertainty in data accuracy of RWIS Environmental Sensor Station (ESS) sensors can make users question the value of the information. While testing and calibration methods for ESS atmospheric sensors are available in existing literature, no such effort has been undertaken for pavement sensors. This research project fills the need by developing testing methods for pavement sensors and it seeks to establish guidelines for practical testing methods that will evaluate whether the pavement sensor is providing an accurate representation of actual conditions at the installed site.
Research in Progress
Validate the Accuracy of Pavement Condition Predictions, Phase I http://www.aurora-program.org/projectdetail.cfm?projectID=201201 From the Aurora website:
The goal of this project is to validate the accuracy of the pavement condition predictions and provide confidence in the MDSS recommendations.
Summary and Comparison of Agency Experience with Sensors http://www.aurora-program.org/projectdetail.cfm?projectID=200901 From the Aurora website:
The objective of this project is to develop a working matrix of different agencies’ experiences with sensors used in road weather information data collection. This project is currently 95% complete. A draft matrix/spreadsheet has been circulated to the member agencies for ongoing input.

Produced by CTC & Associates LLC 16
Evaluation of Sensor Technologies for Winter Road Condition Monitoring and Performance Measurement, Aurora 2010-03 Ph 2 http://trid.trb.org/view/2015/P/1340334 From the abstract:
The proposed project concerns with the potential and performance of a smartphone based mobile condition monitoring technology with the following specific objectives: (1) Conduct a thorough review on literature related to the monitoring, estimation and forecasting of winter road weather and road surface conditions (RSC);; (2) Demonstrate and evaluate AVL-Genius in three Aurora partner agencies, focusing on system functionality as real time RSC monitoring and reporting tool, reliability, timeliness and granularity of the system in comparison with existing road condition monitoring methods;; (3) Compare and Inter-calibrate three mobile road monitoring models, including smartphone-based (AVL-Genius)l spectroscope sensor-based (such as Teconer's RSM411 and Vaisala's DSC111 ), and CFME-based (Haliday's RT3);; (4) Compare two image based solutions: mobile camera (AVL-Genius) versus traffic camera or webcam installed at the road weather information system (RWIS) stations. The latter two objectives are under the assumption that data from the alternatives systems are available for this project.
Connected Vehicle and Road Weather Conditions The Connected Vehicle: A Mobile Weather Station, U.S. Department of Transportation Intelligent Transportation Systems Joint Program Office http://www.its.dot.gov/press/mobile_weather_station.htm From the website:
Many cars on our roads today already have onboard computers that track information such as road temperature, windshield wiper use, anti-lock brake use, steering patterns, and speed. Connected vehicles will provide new sources of road weather information that offer opportunities to dramatically enhance our existing systems and create transformative applications. The USDOT’s Road Weather Management Program (RWMP) is exploring ways to collect and assess this data and provide it to drivers and transportation managers to improve the safety and mobility of our roads. In partnership with automakers, the National Center for Atmospheric Research (NCAR), and state departments of transportation (DOTs), the RWMP is expanding on existing technologies to test the concept of the vehicle as a mobile weather station.
From the website (under Road Weather Vehicle Data):
To handle the increased volume of data from mobile sensors and connected vehicles, NCAR developed a Vehicle Data Translator (VDT), which incorporates vehicle-based measurements of the road and surrounding atmosphere with other, more traditional weather data sources, and creates road and atmospheric hazard products for a variety of users.
The VDT performs several vital functions to best utilize connected vehicle data:
• Extract the necessary data to derive weather and road condition information (e.g., time, location, ambient temperature, windshield wiper status, traction control)
• Filter the data to remove unnecessary or unwanted information

Produced by CTC & Associates LLC 17
• Quality-check the information using other local surface observations and ancillary data from satellites, radar, and the road weather information system (RWIS) to compute road segment statistics such as the mean air temperature over an individual road segment for a given time step
• Organize and process the data for user-defined road segments.
Through the VDT, the RWMP has made progress in capturing and translating vehicle data into weather and pavement observations. The program is now focusing on using that data to create more sophisticated applications and integrated decision support systems that will benefit state and local agencies, private weather providers, and the traveling public.
From the website (under Connected Vehicle Road Weather Applications):
The USDOT is developing, testing, and evaluating these high-priority applications through partnerships with state DOTs. The effort, called the Integrated Mobile Observations (IMO) project, aims to improve the capabilities of the NCAR VDT and aggregate the data for use in specific applications that can improve states’ use of resources and maintenance, among other benefits. Specifically, the USDOT is partnering with NCAR and the Minnesota, Michigan, and Nevada DOTs to obtain vehicle data from heavy vehicles, such as snowplows, and light vehicles as they carry on routine maintenance functions across their states.
By developing, testing and evaluating these road weather applications and enhancing the VDT, the IMO project will:
• Provide specific requirements for the type, quantity, and quality of data that partner states must provide to support the VDT and road weather applications
• Support broader connected vehicle program goals, including providing materials to support the National Highway Traffic Safety Administration rulemaking decision regarding the future of connected vehicle technology
• Develop controlled experiments that test the validity and accuracy of the VDT algorithms and of the road weather applications to improve transportation safety and mobility.
Through the IMO project, the USDOT aims to demonstrate how mobile vehicle data can be collected, transmitted, processed, and used for decision making.
Results from the Integrated Mobile Observations Study, U.S. Department of Transportation ITS Joint Program Office, May 2013 http://ntl.bts.gov/lib/48000/48300/48314/Final_Report_Task_5b_5-31-131.pdf From the abstract:
With funding and support from the USDOT RITA and direction from the FHWA Road Weather Management Program, NCAR is developing a Vehicle Data Translator (VDT) software system that incorporates vehicle-based measurements of the road and surrounding atmosphere with other weather data sources. The purpose of this document is to provide a short overview of the VDT software, a description of several possible applications for key potential end-users of the VDT, and a description of the data standards that are required in order for the mobile weather data to be useful for various road weather impact applications.
Produced by CTC & Associates LLC 18
From the introduction:
During 2011 and 2012, the Intelligent Transportation Systems (ITS) Mobile Observations (IMO) study was conducted in collaboration with the Nevada and Minnesota State Departments of Transportation (NDOT and MNDOT, respectively) as well as the National Center for Atmospheric Research (NCAR). The purpose of the study was to partner with the states in order to demonstrate how weather, road condition, and other related vehicle data might be collected, transmitted, processed, and used for decision support applications and activities. Another goal of the study was to provide data to NCAR that will enable the enhancement of the capabilities of the Vehicle Data Translator (VDT), which meshes native (and non-native) weather related vehicle observations with traditional weather data (e.g., radar, satellite, fixed weather stations) in order to quality check the observations and generate road and/or atmospheric hazard products for a variety of end users. The purpose of this report is to provide a summary of the data collection efforts by the states and from a field study with one vehicle, which was conducted by NCAR, provide results and analysis of the quality of the observations from the data collection efforts, and provide results and discussion of the utilization of the vehicle observations into road weather or maintenance-related applications.
Concept of Operations for Road Weather Connected Vehicle Applications, FHWA Office of Operations, May 2013 http://ntl.bts.gov/lib/47000/47300/47330/74CD2020.pdf From the abstract:
Weather has a significant impact on the operations of the nation’s roadway system year round. These weather events translate into changes in traffic conditions, roadway safety, travel reliability, operational effectiveness, and productivity. It is, therefore, an important responsibility of traffic managers and maintenance personnel to implement operational strategies that optimize system performance by mitigating the effects of weather on the roadways. Accurate, timely, route-specific weather information allows traffic and maintenance managers to better operate and maintain roads under adverse conditions. Connected vehicle technologies hold the promise to transform road weather management. Road weather connected vehicle applications will dramatically expand the amount of data that can be used to assess, forecast, and address the impacts that weather has on roads, vehicles, and travelers;; fundamentally changing the manner in which weather-sensitive transportation system management and operations are conducted. The US Department of Transportation’s Road Weather Management Program has developed this Concept of Operations (ConOps) to define the priorities for connected vehicle-enabled road-weather applications.

Produced by CTC & Associates LLC 19
Contacts
CTC contacted the individuals below to gather information for this investigation:
University Laura Fay Research Scientist II Winter Maintenance & Effects Program Manager Western Transportation Institute – Montana State University 406-600-5777 [email protected]
State Departments of Transportation Tina Greenfield-Huitt RWIS Coordinator Iowa Department of Transportation 515-233-7746 [email protected] Jakin Koll MDSS/AVL/RWIS Implementation Coordinator Minnesota Department of Transportation 320-223-6604 [email protected]
Federal Highway Administration Paul Pisano Road Weather Management Team Leader Office of Transportation Operations Federal Highway Administration 202-366-1301 [email protected]

I have been testing two MARWIS sensors for the past two months around Minnesota. I would
like to share some of the observations I have made about the sensors so far.
First, I have to say that the sensors were as easy to assemble and install as advertised. I had no
issues putting the MARWIS sensors together and installing them on my Chevy Malibu. It was
about one hour by the time I got everything out of the box, assembled, installed on my Chevy
Malibu and receiving data which is very impressive as I have done a lot of research and
development with other products and sensors over the past 10 years and I haven’t come across
one before that has been this straight forward and easy to install.
The MARWIS is extremely easy to calibrate. I found out that the sensor has to be warm enough
before it will let you preform the calibration. I left the sensor out in my car overnight and
brought it in the shop to find a warm dry spot to do the calibration. I went to the calibration
screen in the mini iPad and it wouldn’t let me calibrate as it said the LED and sensor body were
too cold. It took a little while to warm the sensor up enough to calibrate as I was coming inside
from -20 degrees F temperatures into a nice warm shop of 60 degrees F. I like that the
Calibration screen shows the temperature of the LED and sensor body so you can see they are
warming up and get an idea of when you will be able to calibrate. It took several minutes for the
parts to get warm enough, but once they did it calibrated in just a few seconds and I was good to
go!
I was a little worried that all I had to calibrate on was a concrete surface as most of the pavement
in my area is bituminous, but it didn’t seem to make a difference and the sensor seemed to do a
pretty accurate job on concrete and bituminous. I noticed at first that the MARWIS would take
about 10 minutes or so before it gave you an accurate road condition reading after you calibrate
in the warm shop and head outside into the cold winter weather. However, once I notified Lufft
of this they worked on a fix and now that it has been deployed the road condition only takes
several seconds to catch on once you go from a warm garage to cold winter conditions.
I installed one of the sensors on the back of my car aimed at the right rear wheel track. I
installed the other sensor on the back of my car in-between the wheel tracks. I choose to test two
MARWIS sensors side by side to see if I could replicate conditions as the sensors would not do
us any good if the sensors would give different readings under the same conditions. My main
concern was that the road condition, road temperature and friction readings would not be the
same. We need to have the confidence that if we bought several of the MARWIS sensors and
deployed them across the State we could know that a low friction reading of 0.2 would mean the
same on all of the sensors. This is crucial for us as one of our main goals is to make operational
decisions on when to apply chemicals to the road and when not to based off the MARWIS
readings.
I understood and expected that the two MARWIS sensors would not always show the same
conditions during my tests as I have one installed in the wheel path and one between the wheel
path. However, I did this so I could also monitor how well the MARWIS sensors would pick up
on wheel track ice in situations like black ice, refreeze, snow compaction, blow ice, etc. We call
it blow ice when blowing snow sticks to the road and creates icy wheel tracks as it blows across

the road. This typically happens if the road is wet or when the road temp is around 25 degrees F
and above and the wind is strong enough to move snow across the road.
On multi-lane roads I am able catch the wheel tracks or between the wheel tracks with each
sensor as I change lanes. I have been very impressed with the MARWIS sensors ability to pick
up on the correct road condition. The only time it seems to have a little trouble is that it tends to
call a road dry when I would consider the road damp. However, this is quite subjective and I
haven’t had a time where it would have had enough moisture on the road to cause loss of traction
if that moisture froze. I have contacted Lufft about this and we are going to experiment with
some of the sensitivity between dry and damp to see if it makes a difference.
I have logged about 3,000 miles with these two sensors and have tested them in almost all types
of weather events; rain, freezing rain, snow (light/moderate/heavy), blowing snow, and
sleet. Pretty much the only type of event I have missed so far is frost, but with the spring coming
I will have many opportunities to catch frost events soon.
The higher friction readings (~0.6-0.82) typically seen for dry, damp, wet, and chemical wet
would register quite well, however the sensors had a difficult time with the low end friction
readings (~0.1-0.6) at first. It was easy to see right away that the sensors were just way too
sensitive as every-time the sensors would see any type of ice crystal, whether it was from ice
crystals, snow crystals, slush, etc. it would show a friction reading of 0.1 which is really the
lowest friction reading you can get in the real world outside of a lab environment.
I wasn’t too concerned with this as I knew this could be fixed by just adjusting the sensitivity of
the MARWIS sensor and the computer algorithm the MARWIS uses to calculate friction. I
contacted Lufft right away when I noticed this and they were extremely open to feedback and
addressed the issue within about two weeks which was extremely fast as we tested a couple of
tweaks/adjustments to the sensor algorithms and sensitivity in that time frame.
The display of the data on the mini-iPad is very easy to use and read and I really find it useful to
see the live trace route of the color coded road conditions on the map on the iPad display as
well. It is great to have the option to use your own iPhone or iPad as there is a mobile
application available free for download. I downloaded it on my iPhone and it worked right
away. I just find that the display is way too small on an iPhone and I much prefer the mini-iPad.
I have found that one of the MARWIS sensors reads about 3 degrees F. colder than the
other. The warmer sensor is more accurate as it verifies with the numerous in-pavement RWIS
sensors we have across the state as I drive by them. Once notified Lufft started working on a
way to adjust the road temperature or to provide a self-calibrate of the road temperature
offset. This hasn’t been deployed yet, but with all the other changes they have been willing and
open to make I am sure it will be available soon and I will begin testing that as well.
Lufft is also working on the ability to change what is displayed on the mini-iPad. There are times
I would like to monitor dew point along with road temperature to see when/where there is a risk
of frost. Also, it would be nice to be able to choose to show the black ice risk at times as well.

I have enough confidence in the MARWIS sensors at this point that earlier this week I installed
one of the two I have been testing on one of our Maintenance Supervisors pick-up trucks. The
supervisor was very surprised and impressed that I was able to take the MARWIS sensor off of
my car and install it on his pick-up, mount the mini-iPad, calibrate the sensor and send him out
the door to start testing in less than 15 minutes.
Well, I had all the above done in 15 minutes, but as anyone who knows me will understand, it
took a little longer than 15 minutes to get him out the door as I was explaining some of the things
I have learned with the sensor and what he should be monitoring in order to get the most benefit
out of the sensor as well to remind him to make sure to provide feedback on how he perceives
the sensor is performing.
We plan to test one of the two sensors we have on a plow truck in the next few weeks, however
we are thinking that it makes the most sense for our operations to install the MARWIS sensors
on supervisors vehicles. This is because the supervisors are on most if not all of their roads
before, during and many times after the storm. This will allow us to get the best representation
of our road network.
We can monitor the MARWIS data on the Applied Information Glance webpage which has been
extremely useful when I am doing comparisons of data after the storm. I can get trace routes of
the data as well as dig into the raw sensor data for more in depth comparisons and analysis.
We are also sending the MARWIS data to our MnDOT servers as well as to the National Center
of Atmospheric Research (NCAR) in Boulder Colorado as they are helping us develop some
applications for the Connected Vehicle Initiative project we are working on for the Federal
Highway Administration (FHWA) called the Integrating Mobile Observations (IMO) project.
In conclusion, I have been very impressed with the MARWIS sensors to date as well as Lufft and
Applied Information’s willingness to make changes and enhancements based off of our
observations.
Feel free to contact me for more information as this is a very exciting product. I truly believe
that this kind of technology is going to become an invaluable tool in the Road Weather Managers
tool box as we continue to strive for innovative ways to become more efficient with maintaining
our roadways in order to provide the best level of service in the most efficient way to freight,
transit and the traveling public. Jakin Koll MnDOT MDSS/AVL/RWIS Implementation Coordinator Road Weather Technology 3725 12th Street North St. Cloud, MN 56303 MS 031 Office: 320-223-6604 Cell: 320-241-3631 Email: [email protected]

Cokato Ice Warning Active: 6:51am Tue. Mar. 3rd, 2015 Inactive: 4:51pm Tue. Mar. 3rd , 2015
MDSS picked up on 0.02 in (0.508 mm) of snow on route around 6:00 am.
MDSS shows about 1.9 inches of snow fell along route and the route became snow covered
around 7am. MDSS shows a decrease in mobility and friction between 6am-3pm with the
lowest values between ~7am-2pm where traffic was likely affected.
MDSS shows some very small amounts of ice until about 5pm.
Graph of sensor data following MDSS graph below. I drove by the sensors around 1:30 pm on
the 3rd during this event and included screen shots of the data from the Lufft MARWIS mobile
road condition and friction sensor I have mounted on the back of my car between the wheel
tracks as well as some pictures I took.

Below shows sensors picked up on ice around 6am with ice being reported pretty consistently
until about 6pm Tue. Mar. 3rd, 2015. This is pretty consistent with MDSS as it picked up on ice
from about 6am till a about 5pm which is the time period of the Cokato Ice Warning.
Also of note is that both MDSS and sensors picked up on some ice around 12am-3am on the 3rd
before the main snow event started around day break. They both agreed that there wasn’t
enough ice to affect traffic as no alert went off and MDSS shows no drop in mobility or friction.

Below is the big picture of road conditions in the Cokato Ice Warning area from
the Lufft MARWIS road condition sensor I am testing and have installed on the
back of my car between the wheel tracks.
You can see that most of the area is showing as snow and snow/ice covered.

The MARWIS road condition sensor also reports friction readings. The red
corresponds to low or critical friction areas (~0.1-0.4), yellow corresponds to
medium or caution friction areas (~0.4-0.65) and green corresponds to good
friction areas (~0.65-0.82).
You can see that most of the Cokato Ice Warning area is showing as having
reduced friction with many yellow caution and red critical areas.

Taking a closer look shows that the road conditions west bound lane was pretty
consistently snow or snow/ice covered and the east bound lane had several areas
of snow or snow/ice covered as well, however some areas, mainly in the western
portion of the warning area near the High School showed up as dry.
Pictures following to show this.

Taking a closer look shows that the friction readings west bound lane was pretty
consistently showing reduced friction readings of caution or critical and the east
bound lane had several areas of reduced friction as well, however some areas,
mainly in the western portion of the warning area near the High School showed
up as good friction.
Pictures following to help illustrate this.

I entered the Cokato Ice Warning area from the east heading west out of Cokato.
This is a shot of the warning sign on the east side of the warning area. You can
see that it is flashing and you can also see that the road is covered in snow and
some compacted snow as well as plenty of reduced visibility so it is a good thing
the sign is flashing. This also agrees well with the MARWIS data we just looked at.

I traveled through the warning area and turned around just after I passed the
warning sign on the west end of the Cokato Ice Warning area. This is a shot of the
warning sign on the west side of the warning area. You can see that it is flashing
and you can also see that the road looks pretty dry. There is some snow and
compacted snow just after the sign in the west bound lane. This also agrees well
with the MARWIS data we just looked at.
We will follow this truck and see how things change.

As I just get past the Flashing Warning sign I meet up with the plow maintaining
this route and as you can see the operator is plowing off the snow in the west
bound lane. The east bound lane still looks good, but I am only a couple hundred
feet beyond the warning sign and where I took the last picture.
Lets take a look at how the conditions change for the east bound lane after we get
a little closer to the High School.

You can see that the conditions change and the east bound lane becomes snow
and snow/ice covered as we approach the High School.
This agrees very well with the MARWIS sensor data we looked at above.
In summary it appears that the three sensors, the warning signs, MDSS, MARWIS
mobile road condition sensor as well as the plow truck and pictures all agree that
the Ice Warning System did a great job in this case.

VOLUNTARY DATA CONTRIBUTION LICENSE
BETWEEN THE U.S. DOT DATA CAPTURE & MANAGEMENT PROGRAM
AND
1. I, , am authorized to execute this license for and on behalf
of the identified State / Agency / Organization (hereinafter called the Data Contributor).
2. The Data Contributor desires to voluntarily contribute _______________________(describe
data in this space)(here after called “the data”) to the U.S. DOT Data Capture & Management
Program.
3. The Data Contributor does not seek any compensation in exchange for providing the Federal
Government with a copy and license of the data.
4. The Data Contributor agrees and grants the U.S. DOT the right to use, disclose, reproduce,
prepare derivative works, distribute copies to the public, and perform publicly and display
publicly, in any manner and for any purpose, and to have or permit others to do so, all data
provided under this agreement.
The undersigned approve the terms and conditions of this Data license and represent that they have the requisite authority to enter into it.
_________________________________________ ______________ (State, Agency, or Organization Representative, and Title) Date

Agreement for the National Weather Service to Obtain Unrestricted Data from [DATA PROVIDER]
I. CONTACTS The official contacts or their successors of each party to this Agreement are the following
For the National Weather Service (NWS):
Include Name, Title, NWS Office, Address, Phone, Fax, and Email
For the [DATA PROVIDER]:
Include Name, Title, Office (if applicable), Address, Phone, Fax, and Email:
II. Data/Metadata Provision, Information, and Maintenance
a. Method(s) by which NWS will acquire data and metadata:
b. Online (URL) location of metadata:
c. Details on type (e.g., latitude, longitude, elevation, name, etc.) of metadata available (list any information available; an attachment listing metadata details may be included):
d. Maintenance done on data collection platform(s) by provider (list any information available; an
attachment listing metadata details may be included):
e. Quality control done on observations by provider (list any information available; an attachment listing metadata details may be included):
III. General Terms and Conditions
a. Duration of Agreement, Amendments, and Modifications This Agreement is subject to the availability of funds. This Agreement shall become effective on the date of the last signature, and shall be valid for a period not to exceed five (5) years. The Agreement may be terminated, revised, amended, renewed, or extended for another five (5) year period at any time by mutual consent of the parties in writing. Either party may terminate this Agreement by providing thirty (30) days written notice to the other party. The Government reserves the right to terminate this Agreement immediately at the convenience of the Government.
b. Resolution of Disagreements
Should disagreement(s) arise on the interpretation of provision(s) of this Agreement, or amendments and/or revisions thereto, that cannot be resolved at the operating level/points of contact listed above, the area(s) of disagreement shall be stated in writing by each party and presented to the other party for consideration. If agreement on interpretation is not reached within thirty (30) days, then the parties shall

forward the written presentation of the disagreement(s) to this Agreement’s signing officials for resolution.
c. Authorities
The authorities for the NWS, as a Line Office of the National Oceanic and Atmospheric Administration (NOAA) to enter into this Agreement include 15 U.S.C. 313.
(If applicable to Data Provider, otherwise delete) The authorities for [DATA PROVIDE] to enter into this Agreement include…
d. Other Rights or Benefits
No third party beneficiaries are intended to be created by this Agreement, nor do the parties herein authorize anyone not a party to this Agreement to maintain a suit for damages pursuant to the terms or provisions of this Agreement.
Nothing in this Agreement is intended to diminish or otherwise affect the authority of each party to carry out its statutory, regulatory, or other official functions, nor is it intended to create any right or benefit, substantive or procedural, enforceable at law by any party against the United States, its agencies or officers, or any other person.
e. Indemnification
NWS hereby expressly agrees and covenants that it will defend, indemnify, hold harmless, and save [DATA PROVIDER] and its authorized representatives from any and all maintenance, costs, liabilities, expenses, suits, judgments, damages to persons or property, or claims of any nature whatsoever arising out of or in connection with the provisions or performance of this Agreement by NWS, its employees, or its subcontractors.
f. Disclaimer
NWS hereby acknowledges that [DATA PROVIDER] makes no warranties, guarantees, or representation as to the accuracy of any data provided pursuant to this Agreement and assumes no liability or responsibility for any errors or omissions in the data. Under no circumstances will [DATA PROVIDER] be held liable to any party who may choose to rely on information provided pursuant to this Agreement.
Further, NWS agrees to include a statement that no warranties on accuracy of the data are intended or provided any time it displays or shares data provided pursuant to this Agreement.
For the National Weather Service: For [DATA PROVIDER]
Signature ______________________________ Signature ____________________________
Name: _________________________________ Name: ______________________________
Title: Title:
Date: Date: