Embed Size (px)
Citation preview

Christine M. Goodwin Acting Director
Piyaporn Nawarat, Ed.D. Associate Director
Amy Filadelfo Research Analyst Mary Siconolfi Senior Secretary
Graduate Students:
Rufina Eframi
Justine Koo
Undergraduates:
Fabian Givens
Xiu Qing Lin
Alison Schwartz
Jim Tsui
FFaacctt BBooookk
FFaallll 22001155
EEnnrroollllmmeenntt TTrreennddss
RReeppoorrtt bbyy MMaajjoorr 22000055--22001155
OOffffiiccee ooff IInnssttiittuuttiioonnaall RReesseeaarrcchh NNeewwmmaann HHaallll BB2222
PPhhoonnee:: ((771188)) 999900--11886699 FFaaxx:: ((771188)) 999900--22331144 iirr@@ssttjjoohhnnss..eedduu
ssttjjoohhnnss..eedduu//aabboouutt//iirr

St. John's College of Liberal Arts and SciencesStudent Enrollment Fall 2005 - Fall 2015
Prepared by: Office of Institutional Research (cmg/mh/aj/rd/as/re) Based on data as of 10/20/2015
0
1,000
2,000
3,000
4,000
5,000
6,000
2005 2006 2007 2008 2009 2010 2011 2012 2013 2014 2015
Enro
llmen
t
Year
Staten Island - Undergraduate
Queens and Rome - Graduate
Queens - Undergraduate
Total - St. John's College of Liberal Arts and Sciences
Enrollment Trends 1

St. John's College of Liberal Arts and Sciences (01)Student Enrollment - Undergraduate Division
Queens Campus Fall 2005 - Fall 2015
MAJOR 2005 2006 2007 2008 2009 2010 2011 2012 2013 2014 2015
ANT Anthropology 6 16 22 20 30 34 43 33 32 25 23
14 17 14 10 23 23 28 23 22 15 15
ASC Asian Studies 14 17 14 10 23 23 28 23 22 15 13
ASCZ Asian Studies/Business Administration - - - - - - - - - - 2
544 573 550 571 632 668 674 712 744 757 840BIO Biology 526 569 547 568 631 667 673 708 741 754 837
BIO1 Biology 7-12 2 2 - - - - - - - - - -
BIO2 Biology/Dentistry 4 3 1 1 - - - - - - -
BIO3 Biology/Optometry - - 1 1 1 1 1 3 3 2 2
BIO5 Biology/Podiatric Medicine - - - 1 - - - 1 - 1 1
BIOS Biology - Self Pace 3 12 1 1 - - - - - - - -
CHEMISTRY COMBINED 80 85 86 84 113 112 112 101 112 98 115
CHE Chemistry 79 85 86 84 113 112 112 101 112 98 115
CHE1 Chemistry 7-12 2 1 - - - - - - - - - -
ECO Economics 37 52 57 57 50 47 62 50 48 58 55
ENGLISH COMBINED 179 192 187 228 228 229 207 167 153 150 165
ENG English 177 192 187 228 228 229 207 167 153 150 163
ENG1 English 7-122 2 - - - - - - - - - -ENGZ English/Business Administration - - - - - - - - - - 2
ENVIRONMENTAL STUDIES COMBINED 24 18 25 29 48 54 61 59 55 54 49
ESP Environmental Studies (Ecology) 14 9 18 22 27 32 36 37 34 27 28
ESP5 Environmental Studies (Social Sci) 10 9 7 7 21 22 25 22 21 27 21
FINE ARTS COMBINED 87 88 92 93 98 98 103 97 98 90 90
FNA Art 13 22 23 21 20 11 22 19 16 13 15
FNA1 Graphic Design 44 38 38 43 49 48 44 43 45 43 43
FNA2/PHO Creative Photography/Photography 18 14 15 18 19 28 26 23 21 19 16
FNA4 Illustration 12 14 16 11 10 11 11 12 16 15 16
FRENCH COMBINED 17 10 16 21 20 18 20 20 15 14 8FRE French 17 10 16 21 20 18 20 20 14 13 8
GOVERNMENT COMBINED 250 235 239 237 252 251 225 223 222 173 180GOV Government & Politics 246 229 235 229 246 243 220 212 214 163 172
GOV2 Public Admin & Public Service 4 6 4 8 6 8 5 11 8 10 8
HISTORY COMBINED 104 102 104 133 125 121 115 95 92 91 81HIS History 102 102 104 133 125 121 115 95 92 91 80
HIS1 History Social Studies 7-12 2 2 - - - - - - - - - -
HISZ History/Business Administration - - - - - - - - - - 1
ITALIAN COMBINED 22 24 29 25 23 15 12 13 11 10 7
ITA Italian 17 24 29 25 23 15 12 13 11 9 7
ITA1 Italian 7-122 5 - - - - - - - - - -
ITAZ Italian/Business Admin - - - - - - - - - 1 -
MATHEMATICS COMBINED 39 44 45 36 37 43 49 45 41 52 44
MTH Mathematics 37 44 45 36 37 43 49 45 41 52 44
MTH1 Mathematics 7-122 2 - - - - - - - - - -
PHILOSOPHY COMBINED 74 69 68 74 81 92 109 88 92 71 71
PHI Philosophy 64 61 59 59 73 74 85 76 78 63 56
PHI1 Philosophy - Theology - 1 6 2 2 9 - - - - -
PHI2 Philosophical - Theological Studies-Cert Program 10 7 3 13 6 9 24 12 14 8 15
ASIAN STUDIES COMBINED
BIOLOGY COMBINED
2 No longer offered3 Not a programPrepared by: Office of Institutional Research (cmg,re) Based on data as of 10/20/2015Enrollment Trends 2

St. John's College of Liberal Arts and Sciences (01)Student Enrollment - Undergraduate Division
Queens Campus Fall 2005 - Fall 2015
MAJOR 2005 2006 2007 2008 2009 2010 2011 2012 2013 2014 2015
PHYSICAL SCIENCE COMBINED 15 22 30 44 38 43 43 49 30 24 28
PHY1 Physical Science 15 21 13 16 15 17 10 16 11 11 16PHY3 Physical Science (Bio Med Engineering) - 1 8 17 15 17 27 18 7 3 -PHY4 Physical Science (Pre Engineering) - - 9 11 8 9 6 15 12 10 12
PHYSICS COMBINED 22 29 27 27 33 31 35 37 38 46 37
PHY Physics 17 24 23 25 31 28 33 36 38 45 34
PHY2 Physics 7-122 1 - - - - - - - - - -
PHYM Mathematical Physics 4 5 4 2 2 3 2 1 - 1 1
MTHZ Math Physics/Business Administration - - - - - - - - - - 2
PSYCHOLOGY COMBINED 503 541 513 519 577 603 610 573 560 523 552PSY Psychology 503 541 513 519 577 603 610 573 552 515 535
PSY7 Psychology / Criminology & Justice - - - - - - - - 8 5 12
PSYZ Psychology/Business Admin - - - - - - - - - 3 5
SOCIOLOGY COMBINED 57 62 74 79 85 74 74 93 81 65 56SOC Sociology 57 62 74 77 80 69 72 89 79 64 53
SOC3 BA Sociology/MA Criminology & Justice - - - 2 5 5 2 4 2 1 2SOCZ Sociology/Business Administration - - - - - - - - - - 1
SPA Spanish 17 24 20 21 25 24 25 24 13 16 11
SPE Speech Pathology & Audiology 137 147 113 115 112 109 115 141 147 146 154
SPEECH COMBINED 5 6 5 7 9 12 12 9 6 4 2
SPE1 Speech (Public Add.,Gen.Speech) 5 6 5 6 9 12 12 9 6 4 2
SPE2 Speech - - - 1 - - - - - - -
THE Theology 22 23 16 18 18 18 11 11 10 12 14
0000 Undecided 674 602 626 670 668 609 560 464 431 399 537
NM Non-Matriculated 70 43 46 68 70 108 35 70 73 80 39
TOTAL: 2,999 3,024 3,004 3,186 3,395 3,436 3,340 3,197 3,126 2,973 3,173 PERCENT CHANGE: 0.8% -0.7% 6.1% 6.6% 1.2% -2.8% -4.3% -2.2% -4.9% 6.7%Notes:As of Fall 2011, students solely enrolled in The Language Connection are no longer included in SJC enrollment.As of Fall 2012, Undeclared students are now coded as Undecided students.Dual Degree Students are counted within their major code.
2 No longer offered3 Not a programPrepared by: Office of Institutional Research (cmg,re) Based on data as of 10/20/2015
Enrollment Trends 3

St. John's College of Liberal Arts and Sciences (51) Staten Island Campus - Undergraduate
Fall 2005 - Fall 2015
Prepared by: Office of Institutional Research (cmg,re) Based on data as of 10/20/2015
MAJOR 2005 2006 2007 2008 2009 2010 2011 2012 2013 2014 2015
CUS Computer Science 14 22 16 17 18 19 14 15 8 12 13
ECO Economics - - 3 2 - 1 - 1 1 2 3
ENG English 43 49 41 32 30 28 19 23 22 20 15
GOV Government & Politics 25 25 21 24 23 20 16 19 20 22 17
HIS History 14 19 23 21 15 16 13 11 7 7 5
LAS Liberal Arts 97 44 17 8 6 6 1 1 - 1 1
MTH Mathematics 6 4 5 4 3 4 2 6 11 7 4
PHI Philosophy 2 2 - 1 1 1 1 3 2 1 2
PSYCHOLOGY COMBINED 85 75 79 97 100 86 70 56 57 55 50
PSY Psychology 85 75 79 97 100 86 70 56 56 54 50PSY7 Psychology/Criminology & Justice - - - - - - - - 1 1 -
SOCIOLOGY/SOCIAL STUDIES COMBINED 19 22 16 23 15 11 6 7 4 9 10
SOC Sociology 9 10 11 10 6 6 3 3 3 7 7
SST Social Studies 9 12 5 13 9 5 3 4 1 2 3
SST1 Social Studies 7-12 2 1 - - - - - - - - - -
SPE Speech Pathology & Audiology 30 44 53 55 64 63 58 51 53 48 52
THE Theology 3 3 3 4 4 2 1 4 3 3 1
0000 Undecided 91 78 81 91 76 47 51 36 40 40 31
NM Non-Matric 1 15 2 - 1 1 - - 1 - 1
TOTAL 430 402 360 379 356 305 252 233 229 227 205PERCENTAGE CHANGE -6.5% -10.4% 5.3% -6.1% -14.3% -17.4% -7.5% -1.7% -0.9% -9.7%
2 No longer offered.
As of Fall 2012, Undeclared students are now coded as Undecided.
Dual degree students are coded within major codes.
Enrollment Trends 4
St. John's College of Liberal Arts and Sciences (21)Student Enrollment - Graduate Division
Queens CampusFall 2005 - Fall 2015
Prepared by: Office of Institutional Research (cmg,re) Based on data as of 10/20/2015
MAJOR 2005 2006 2007 2008 2009 2010 2011 2012 2013 2014 2015
ASIAN STUDIES COMBINED 13 13 11 11 14 14 12 17 20 17 10
ASC Asian Studies - - - - - - - - - - -
CHS Chinese Studies 4 2 1 2 3 2 1 2 2 2 -
AAS Asian & African Cultural Studies - - - - 1 1 - - - - -
EAS East Asian Studies 9 11 10 9 10 11 11 15 18 15 10
AUDIOLOGY & SPEECH COMBINED 153 136 158 158 153 152 156 150 142 145 159
AUD Audiology 4 7 12 36 34 33 54 52 42 44 58
SPE Speech Pathology & Audiology 149 129 146 122 119 16 - - - - -
SPE5 Speech Language Pathology - - - - - 103 102 98 100 101 101
BIOLOGY 46 46 44 40 34 38 36 39 38 39 37
BIO Biology MS 15 17 14 11 12 14 12 15 14 15 16
Ph.D. 31 29 30 29 22 24 24 24 24 24 21
CHE Chemistry 33 35 27 21 24 28 21 27 23 20 37
CRIM Criminology and Justice 37 38 39 30 29 39 54 34 23 27 35
ENGLISH COMBINED 51 60 73 73 80 81 92 92 96 99 91
ENG English MA 24 26 35 23 27 27 26 21 24 23 18
DA 27 34 38 50 53 54 66 71 72 76 72
PHD - - - - - - - - - - 1
GDSJ Global Dev & Social Justice - - - - 32 36 38 37 49 43 32
GOVERNMENT COMBINED 69 66 55 53 65 61 53 59 53 40 35
GOV Government & Politics 69 65 55 53 64 60 51 57 51 40 35
GOV3 Govt & Politics/Library Sci - 1 - - 1 1 2 2 - - -
GOV9 Government & Politics/Library Info Sci - - - - - - - - 2 - -
HISTORY COMBINED 49 52 49 51 47 52 52 67 76 72 61
HIS History MA 18 25 23 17 15 17 22 24 21 17 15
HIS2 Modern World History DA 31 27 26 34 32 35 30 37 44 43 36
HIS3 Public History MA - - - - - - - 6 11 12 10
Latin American and
Caribbean Studies
LST Liberal Studies 12 31 60 55 24 14 12 14 17 13 15
LIBRARY SCIENCE COMBINED 90 92 105 143 187 136 79 69 64 65 66
LIS1/LIS2 Library Science MLS 90 90 104 143 184 134 75 54 22 - -
LIS1 Library & Information Science* ADVCRT - 2 1 - 3 2 4 2 - 1 1LIS2 Library & Information Science MS - - - - - - - 13 42 64 65
MTH Mathematics 10 15 12 8 5 7 8 9 5 - -
MIN Ministerial Studies 4 5 4 4 2 2 2 1 - - -
MUSA Museum Administration - - - - - - - - - - 7
Note: Queens figures include Online Learning and Oakdale Students. Please refer to the Online Learning and Oakdale Enrollment Reports.* Previously Library & Information Studies.
--1- 13 2LAC 3 1- -
Enrollment Trends 5

St. John's College of Liberal Arts and Sciences (21)Student Enrollment - Graduate Division
Queens CampusFall 2005 - Fall 2015
Prepared by: Office of Institutional Research (cmg,re) Based on data as of 10/20/2015
MAJOR 2005 2006 2007 2008 2009 2010 2011 2012 2013 2014 2015
PSYCHOLOGY COMBINED 291 263 254 260 269 252 229 243 236 222 202
PSY1 Gen-Exper Psychology 26 21 17 15 19 23 17 24 27 30 18
PSY2 Clinical Psy-General Track 37 34 35 35 35 38 36 34 30 28 27
PSY3 Clinical Psy-Clin Child Track 39 35 29 32 32 28 30 30 30 25 27
PSY5 School Psychology MS 54 44 51 52 64 60 47 39 34 36 34
PSY5 School Psychology Psy.D 101 99 94 90 86 60 54 59 65 65 64
PSY6 School Psychology/Bilingual Ext MS 9 8 9 11 9 5 6 14 12 10 8
PSY6 School Psychology/Bilingual Ext Psy.D 25 22 19 25 24 38 39 43 38 28 24
SOC Sociology 21 33 38 29 35 31 31 36 37 24 19
SPA Spanish 21 19 16 9 9 15 19 16 14 14 15
THEOLOGY COMBINED 64 55 51 40 38 37 45 40 42 37 25
THE Theology 62 50 49 39 38 37 44 37 39 34 25
THE2 Theo Catechetic Ministry 2 5 2 1 - - 1 3 3 3 -
NM Non-Matric 6 34 20 67 71 84 50 52 59 34 37
TOTAL QUEENS: 973 995 1,016 1,055 1,118 1,079 990 1,003 995 911 883 PERCENT CHANGE: 2.3% 2.1% 3.8% 6.0% -3.5% -8.2% 1.3% -0.8% -8.4% -3.1%
MAJOR 2005 2006 2007 2008 2009 2010 2011 2012 2013 2014 2015
GOV Government & Politics 66 64 43 46 45 47 37 32 36 27 14
NM Non-Matric 1 1 - 1 - - - - - - -
TOTAL ROME: 67 65 43 47 45 47 37 32 36 27 14PERCENT CHANGE: -3.0% -33.8% 9.3% -4.3% 4.4% -21.3% -13.5% 12.5% -25.0% -48.1%
QUEENS & ROME TOTAL: 1,040 1,060 1,059 1,102 1,163 1,126 1,027 1,035 1,031 938 897 PERCENT CHANGE: 1.9% -0.1% 4.1% 5.5% -3.2% -8.8% 0.8% -0.4% -9.0% -4.4%
Notes: Queens figures include Online Learning and Oakdale Students. Please refer to the Online Learning and Oakdale Enrollment Reports.Some students are coded within their major code with a degree code of Non-Matric.
Rome Campus
Enrollment Trends 6

The School of EducationStudent EnrollmentFall 2005 - Fall 2015
Prepared by: Office of Institutional Research (cmg/mh/aj/rd/as/re) Based on data as of 10/20/2015
0
250
500
750
1,000
1,250
1,500
1,750
2,000
2,250
2,500
2,750
2005 2006 2007 2008 2009 2010 2011 2012 2013 2014 2015
Enro
llmen
t
Year
Total - The School of Education
Queens - Graduate
Queens - Undergraduate
Staten Island - Undergraduate Staten Island - Graduate
Enrollment Trends 7

The School of Education (12)
Student Enrollment - Undergraduate Division
Queens Campus
Fall 2005 - Fall 2015
MAJOR 2005 2006 2007 2008 2009 2010 2011 2012 2013 2014 2015
EDUCATION PRE K-6/CHILDHOOD COMBINED 346 318 278 272 289 289 235 215 185 190 182
CED Childhood Education 1-6 309 283 234 198 208 206 161 153 150 170 167
CEDS Childhood Edu & Special Edu 1-6 35 35 44 74 81 83 74 62 35 20 15
CHD Childhood Edu - Non Cert 2 - - - - - - - - - -
EDU PRE K-6 & 7-9/ ADOLESCENCE COMBINED 155 157 168 179 196 200 167 131 114 93 93
ADE Adolescence Edu - Non-Cert. - - - 1 - - - - - - -
AEB Adolescence Edu/Biology - 4 10 14 21 18 15 8 9 8 9
AEE Adolescence Edu/English 46 45 44 42 47 57 44 36 33 33 32
AEM Adolescence Edu/Mathematics 48 44 39 41 45 42 39 35 33 20 24
AEP Adolescence Edu/Physics 7 8 5 8 4 8 6 - - 2 2
AESP Adolescence Edu/Spanish 9 8 12 17 14 13 8 4 4 3 4
AESS Adolescence Edu/Social Studies 45 48 58 56 65 62 55 48 35 27 22
NM Non-Matric - - - - - - 1 1 - 1 -
TOTAL: 501 475 446 451 485 489 403 347 299 284 275
PERCENT CHANGE: -5.2% -6.1% 1.1% 7.5% 0.8% -17.6% -13.9% -13.8% -5.0% -3.2%
Dual degree students are coded within their major codes.
Prepared by: Office of Institutional Research (cmg/mh/aj/rd/as/re) Based on data as of 10/20/2015Enrollment Trends 8

The School of Education (62)Student Enrollment - Undergraduate Division
Staten Island CampusFall 2005 - Fall 2015
Prepared by: Office of Institutional Research (cmg/mh/aj/rd/as/re)Based on data as of 10/20/2015
MAJOR 2005 2006 2007 2008 2009 2010 2011 2012 2013 2014 2015
ADOLESCENCE COMBINED 31 34 31 33 35 26 21 19 16 10 12AEE Adolescence Edu/English 6 11 10 16 16 11 8 9 6 6 5AEM Adolescence Edu/Mathematics 9 11 9 8 9 10 9 5 6 2 5AESS Adolescence Edu/Social Studies 16 11 12 9 10 5 4 5 4 2 2ADE Adolescence Ed - Non Cert. - 1 - - - - - - - - -EDUCATION PRE K-6/CHILDHOOD COMBINED 118 111 104 116 103 93 70 48 43 40 37
CED Childhood Education 1-6 96 95 89 102 91 79 60 43 41 40 37
CEDS Childhood Edu & Spec Edu 1-6 20 16 13 14 12 14 10 5 2 - -
CHD Childhood Edu - Non Cert 2 - 2 - - - - - - - -
TOTAL 149 145 135 149 138 119 91 67 59 50 49PERCENTAGE CHANGE -2.7% -6.9% 10.4% -7.4% -13.8% -23.5% -26.4% -11.9% -15.3% -2.0%
Dual degree students are coded within their major codes.
Enrollment Trends 9
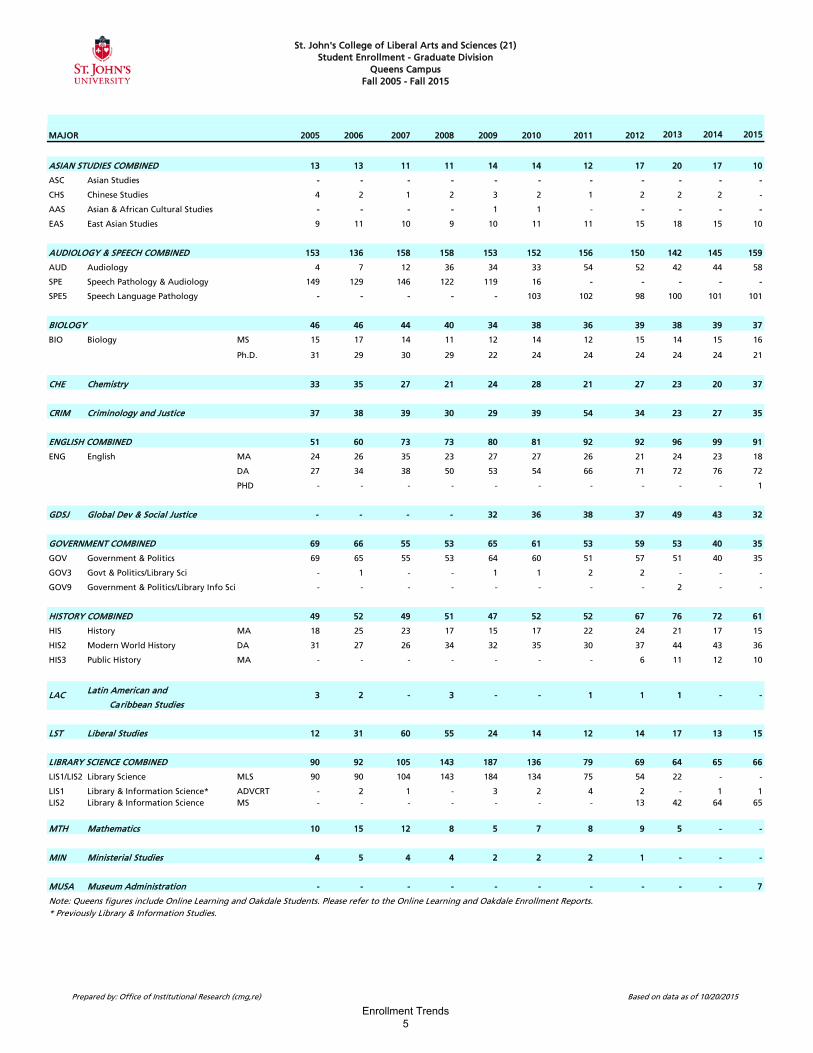
The School of Education (32)
Student Enrollment - Graduate Division
Queens Campus
Fall 2005 - Fall 2015
MAJOR 2005 2006 2007 2008 2009 2010 2011 2012 2013 2014 2015
CHILDHOOD/ELEM. EDUCATION COMBINED 219 184 132 153 178 117 70 64 33 29 29
EDU Elementary Education Pre K-62
94 65 16 35 1 1 - - - - -
CEC Childhood Education: Career 115 112 109 110 119 108 56 45 30 25 23
CED Childhood Education 1-6 - - 1 4 56 8 9 17 3 4 6
CEF Childhood Education: Field 10 7 6 4 2 - 3 2 - - -
CHD Childhood Edu - Non Cert - - - - - - 2 - - - -
EARLY CHILDHOOD ED. COMBINED 68 62 49 40 41 26 17 14 10 14 44
ECC Early Childhood Edu: Career 55 48 39 32 29 18 15 13 9 13 14
ECF Early Childhood Edu: Field 13 14 10 8 12 8 2 1 1 1 3
ECTD Early Child B-2 & Teac Dis B-2 - - - - - 18 35 32 30 25 24
ECDF Early Child/Dis B-2: Field Chg - - - - - - 3 3 3 5 3
ED ADMIN COMBINED 529 509 399 369 351 386 387 357 379 385 361
EDAS Edu Admin & Supervsn (EDD,PD,ADVCRT) 181 152 129 95 95 91 86 88 95 120 121
EDAS Ed Admin & Supervision (MSED, NM) 47 2 1 - - - - - - - -
SBL School Building Leadership 206 258 185 147 112 108 112 120 129 116 100
SBDL School Building/School District Leadership - - - 40 38 44 44 30 36 31 22
SDL School District Leadership 1 2 1 5 4 9 8 3 3 3 2
ADS Administrative Studies - - - - - 1 - - - -
INL Instructional Leadership (EDD,ADVCRT) 94 95 83 82 94 125 127 113 115 113 115
EDGT/GTED Gifted Education: 2011-Cert & 2012-ADVCRT - - - - 8 8 10 3 1 2 1
READING/LITERACY COMBINED 88 74 54 68 75 106 109 116 109 106 90
RDS Reading Specialist2
2 - - - - - - - - - -
LTC Teaching Literacy B-12 - - 4 3 3 3 4 4 3 4 3
LTC1 Literacy (Ph.D.) - - - 14 10 22 19 31 25 28 21
LTC2 Teaching Literacy Grades 5-12 - - - - - 2 1 - 4 2 3
LTC3 Teaching Literacy Birth-6 - - - - 5 4 9 5 4 3 2
LTC4 Teach Lit B-6 & Tch Child w/Dis - - - - 5 17 23 21 20 20 18
LTC5 Literacy 5-12 11 11 6 8 7 11 10 11 9 5 5
LTC6 Teach Lit 5-12 & TESOL K-12 - - - - - - 1 1 6 5
LTC7 Teach Lit B-6 & TESOL K-12 - - - - - 6 6 14 19 20 3
LTC8 Literacy Leadership Coach - - - - - - - 6 3 1 4
LTC9 Teach Lit B-6 & TESOL PK-12 - - - - - - - - - - 13
LTCB Literacy Birth-6 75 63 44 43 45 41 36 23 16 16 14
LTCD LIT 5-12 & TSD 7-12 Gen - - - - - - - - - 2 1
LTCT Teach Lit 5-12 & TESOL PK-12 - - - - - - - - - - 3
COUNSELOR COMBINED 127 91 95 105 137 151 148 122 96 108 127
EDU8 School Counselor with Bili Ext 22 15 19 14 17 19 19 20 4 7 11
SHC School Counselor 68 60 70 76 86 83 70 43 37 35 45
EDU6 Student Dev Prac Higher ED2
18 6 1 - - - - - - -
CMHC Clinical Mental Health Counseling11
19 10 5 15 34 49 59 59 55 66 71
Prepared by: Office of Institutional Research (cmg/mh/aj/rd/as/re) Based on data as of 10/20/2015Enrollment Trends 10

The School of Education (32)
Student Enrollment - Graduate Division
Queens Campus
Fall 2005 - Fall 2015
Major 2005 2006 2007 2008 2009 2010 2011 2012 2013 2014 2015
SECONDARY/ADOLESCENCE EDUCATION COMB. 309 309 312 290 275 255 263 331 242 205 268
AEB Adolescence Edu/Biology 1 1 - - 1 2 1 1 3 2 1
AEE Adolescence Edu/English 7 6 8 5 9 6 5 5 5 6 6
MTH1 Mathematics 7-12 2
1 - - - - - - - - - -
AEM Adolescence Edu/Mathematics 6 3 1 1 3 5 3 7 6 10 42
AESP Adolescence Edu/Spanish 2 1 1 1 2 2 - 1 - 1 -
SST1 Social Studies 7-12 2
1 - - - - - - - - - -
AESS Adolescence Edu/Social Studies 7 5 7 3 4 4 4 5 6 5 1
ADE Adolescence Edu - Non Cert. - - - - - - 1 - - - -
AEC Adolescence Education: Career 146 135 132 132 165 162 158 105 83 44 54
AEET Adolescence Edu: Eng 7-12 (TF) - 20 48 38 14 - - 21 20 44 58
AEF Adolescence Education: Field 17 10 9 5 2 2 - - - - 1
AERP Adolescence Education: Residency Prog - - - - - - - 62 33 25 28
ARP2 Adolescence Education: Gen. w/SWD Extension - - - - - - - - - - 8
AMC Alt. Cert.-Adol Math 7-12 (TF) 44 128 51 105 75 28 - 63 82 68 69
AMSP Adolescent Math Special Edu - - - - - 37 88 56 1 -
MDM Alter Cert. Child Ed MID Math 77 - 55 - - - - 1 - - -
MCE5 Middle Childhood 5-6 Extension - - - - - 4 - 3 - - -
MCE7 Middle Childhood 7-9 Extension - - - - - 3 3 1 3 - -
SPECIAL EDUCATION COMBINED 87 70 95 119 152 174 182 198 283 266 202
EDU7 Special Ed With Bilingual Ext2
- - 3 - - - - - - - -
TCD Teach Child with DIS Childhood 45 41 28 33 29 27 35 25 33 24 28
TCD1 Teach Stu with DIS 7-12 Gener - - - - - - - 4 15 21 9
TCD2 Alt Cert Stu with Dis 7-12 Gen - - - - - - - 51 139 140 116
TCD3 ADE & Teach SWD 7-12 Gen Ext - - - - - - - - - 5 10
TFD Teach Fellow: Child Disabilities 28 1 1 - - - - 2 - - -
CSPE Childhood & Childhood Spec Edu 14 28 63 86 123 129 108 81 63 46 39
CHDS Child Edu/ Spec Edu-Non Cert - - - - - - 1 - - - -
ECTD Early Child B-2 & Teac Dis B-2 - - - - - 18 35 32 30 25 -
ECDF Early Child/Dis B-2: Field Chg - - - - - - 3 3 3 5 -
BILINGUAL EDUCATION COMBINED 13 19 22 4 47 61 57 47 17 14 13
BIL Bilingual Extension - - - 1 3 7 11 11 8 8 11
BIL1 Bilingual Ed: ITI - - - - 34 47 32 20 2 1 1
BIL2 Bilingual Special Ed: ITI - - - - 6 7 14 15 5 3 1
BIL3 Bilingual Pupil Person Ser: ITI - - - - 1 - - 1 2 2 -
EDU9 Bilingual/Multicultural Edu 13 19 22 3 3 - - - - - -
TESOL COMBINED 142 108 111 111 158 176 199 252 194 161 198
TES TESOL 133 93 82 75 100 103 101 121 96 76 3
TES1 TESOL: ITI - - - - 12 22 30 32 6 1 1
TES2 TESOL Special Ed: ITI - - - - - 4 19 18 12 9 -
TES3 TESOL K-12 - - - - - - 8 25 31 30 1
TES4 TESOL PK-12 - - - - - - - - - - 150
TES5 TESOL PK-12 ITI - - - - - - - - - - 5
TES6 TESOL PK-12 Special Ed- ITI - - - - - - - - - - 6
TES7 Child Edu & TESOL PK-12- Career - - - - - - - - - - 30
CTES Childhood Education & TESOL 9 15 29 36 46 47 41 56 49 45 2
NM Non-Matric 4 10 225 166 92 80 53 45 42 45 48
TOTAL: 1,586 1,436 1,494 1,425 1,506 1,532 1,485 1,546 1,405 1,333 1,380
PERCENT CHANGE: -9.5% 4.0% -4.6% 5.7% 1.7% -3.1% 4.1% -9.1% -5.1% 3.5%
2 No longer offered.11 Previously known as Mental Health Counseling & Rehabilitation Counseling.
Note: Figures include Online Learning and Oakdale Students. Please refer to the Online Learning and Oakdale Enrollment Reports.
Prepared by: Office of Institutional Research (cmg/mh/aj/rd/as/re) Based on data as of 10/20/2015
Enrollment Trends 11

The School of Education (82)
Student Enrollment - Graduate Division
Staten Island Campus
Fall 2005 - Fall 2015
MAJOR 2005 2006 2007 2008 2009 2010 2011 2012 2013 2014 2015
AEC Adolescence Edu: Career Change - - - - - - - - - 3 6
CHILDHOOD/ELEMENTARY EDUCATION COMBINED 59 49 41 43 43 41 24 11 8 7 5
EDU Elementary Education Pre K-62
6 5 6 - - - - - - - -
CEC Childhood Education: Career 51 44 35 38 36 33 18 8 7 5 4
CED Childhood Education 1-6 2 - - 4 5 6 4 2 - - -
CEF Childhood Education: Field - - - 1 1 2 2 1 1 1 1
CHD Childhood Edu - Non Cert - - - - 1 - - - - 1 -
ED ADMIN & SUPERVISION COMBINED 57 93 74 45 24 24 16 10 7 4 4
EDAS Educational Admin & Supervsn (PD/ADVCRT)2
10 5 1 - - - - - - - -
EDAS Educational Admin & Supervsn (MSED,NM)2
13 1 - - - - - - - - -
SBDL Sch Building/Sch Distr Leaders - - - - - 2 2 1 2 1 1
SBL School Building Leadership 34 87 73 45 24 21 14 9 5 3 3
SDL School District Leadership - - - - - 1 - - - - -
READING LITERACY COMBINED 33 28 29 26 12 13 9 12 12 6 4
LTC Teaching Literacy B-12 - - - - 3 4 2 - - - -
LTCB Literacy Birth-6 30 27 28 25 9 8 3 3 1 1 -
LTC3 Teaching Literacy Birth-6 (ADVCRT) - - - - - - - - 1 1 2
LTC4 Teach Lit B-6 & Tch Child w/ Dis - - - - - - 2 5 5 2 -
LTC5 Literacy 5-12 3 1 1 1 - 1 - 1 2 1 1
LTC6 Teach Lit 5-12 & TESOL K-12 - - - - - - 2 1 1 - -
LTC7 Teach Lit b-6 & TESOL K-12 - - - - - - - 2 2 1 -
LTC9 Teach Lit b-6 & TESOL PK-12 - - - - - - - - - - 1
MIDDLE CHILDHOOD ED. COMBINED - - - - - 1 1 1 - - -
MCE5 Middle Childhood 5-6 Extension - - - - - 1 - - - - -
MCE7 Middle Childhood 7-9 Extension - - - - - - 1 1 - - -
SPECIAL EDUCATION COMBINED 4 4 6 6 21 16 30 19 8 11 4
CHDS Child Edu/Spec Edu - Non Cert - - - - - 1 1 2 - - -
CSPE Childhood & Childhood Spec Edu 4 4 6 6 17 14 20 13 7 2 1
TCD Teach Child with DIS Childhood - - - - 4 1 9 3 - 5 1
TCD1 Teach Stud with Dis 7-12 General - - - - - - - 1 1 2 1
TCD3 ADE & Teach SWD 7-12 Gen Ext - - - - - - - - - 2 1
COUNSELOR COMBINED 35 32 28 33 43 35 32 20 20 14 18
CMHC Clinical Mental Health Counseling Education11
5 4 1 1 9 10 16 13 12 9 8
SHC School Counselor 30 28 27 32 34 25 16 7 8 5 10
0000 Undecided 2 8 - 2 - - - - - - -
NM Non-Matric - - 16 6 3 4 3 3 2 1 4
TOTAL: 190 214 194 161 146 134 115 76 57 46 45
PERCENT CHANGE: 12.6% -9.3% -17.0% -9.3% -8.2% -14.2% -33.9% -25.0% -19.3% -2.2%
2 No longer offered.11 Previously known as Mental Health Counseling & Rehabilitation Counseling.
Note: Figures may include Online Learning Students. Please refer to the Online Learning Enrollment Reports.
Prepared by: Office of Institutional Research (cmg/mh/aj/rd/as/re) Based on data as of 10/20/2015
Enrollment Trends 12
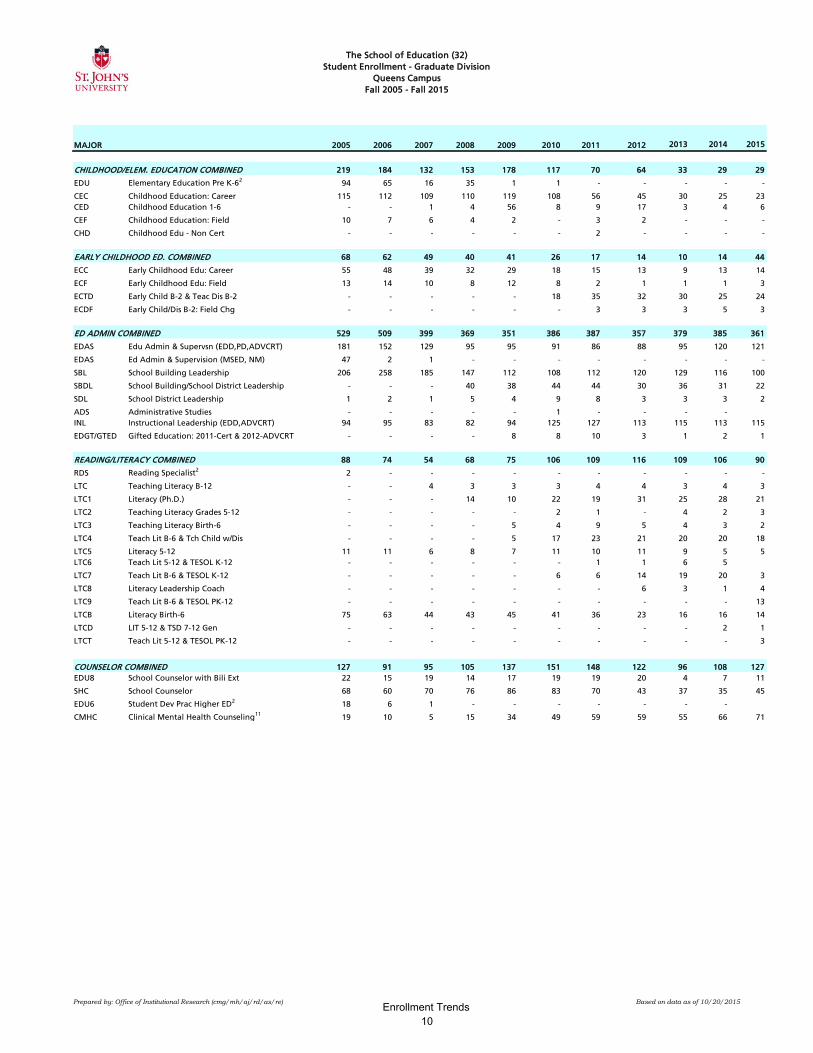
The Peter J. Tobin College of BusinessStudent EnrollmentFall 2005 - Fall 2015
Prepared by: Office of Institutional Research (cmg/mh/aj/rd/as/re) Based on data as of 10/20/2015
0
500
1,000
1,500
2,000
2,500
3,000
3,500
2005 2006 2007 2008 2009 2010 2011 2012 2013 2014 2015
Enro
llmen
t
Year
Total - The Peter J. Tobin College of Business
Queens and Manhattan - Undergraduate
Queens, Rome and Manhattan - Graduate
Staten Island - Undergraduate
Staten Island - Graduate
Enrollment Trends 13

The Peter J. Tobin College of Business (14)Student Enrollment - Undergraduate Division
Fall 2005 -Fall 2015
4 Students cross-enrolled at other institutionsPrepared by: Office of Institutional Research (cmg/mh/aj/rd/as) Based on data as of 10/20/2015
MAJOR 2005 2006 2007 2008 2009 2010 2011 2012 2013 2014 2015
ACCOUNTING COMBINED 435 488 474 487 499 467 455 406 396 407 404
ACC Accounting (BS) 404 406 421 396 370 368 390 341 334 323 313
ACC2 Accounting (BS/MS) 19 39 39 43 45 53 27 42 28 54 57
ACC3 BS Accounting/MS Tax 12 43 14 41 65 32 22 8 13 13 21
ACCF Accounting/Finance - - - 5 16 14 16 15 17 8 4
ACCM Accounting/Management Info System - - - 2 3 - - - - - -
ACCZ Accounting (BS)/Business Adm (MBA) - - - - - - - - 4 9 9
BUSN Business - - - - - - - - - - 8
ECONOMICS COMBINED 38 39 48 63 74 80 86 104 104 117 128
ECO Economics 38 39 48 63 74 80 86 101 97 112 123
ECOY Economic (BS)/Accounting (MS) - - - - - - - - 1 1 2
ECOZ Economics/Business Admin (MBA) - - - - - - - 3 6 4 3
FINANCE COMBINED 400 443 515 560 436 322 296 300 324 352 375
FIN Finance 400 443 515 560 436 322 296 298 321 347 370
FINY BS Finance/MS Accounting - - - - - - - 2 3 5 5
MANAGEMENT COMBINED 383 410 390 324 307 294 307 315 320 329 363
MGT Management 383 410 390 324 307 294 307 313 317 328 363
MGTY BS Management/MS Accounting - - - - - - - 2 3 1 -
10 15 17 16 16 14 11 18 9 1 0
MIS Management Information Systems 10 15 17 16 16 14 11 17 3 1 -
MISZ Mgt Info Systems/Business Admin - - - - - - - 1 6 - -
280 269 265 266 252 215 208 235 252 278 283
MKT Marketing 280 269 265 266 252 215 208 235 251 277 280
MKTY BS Marketing / MS Accounting - - - - - - - - 1 1 3
MSC Military Science - Cross Enroll 4 23 28 28 16 26 20 28 12 12 3 2
RMIZ Risk Management & Ins (BS)/ Bus Adm - - - - - - - - 1 2 2
0000 Undecided 141 197 179 178 133 144 85 68 79 79 111
NM Non-Matric 1 1 - 1 - 2 2 14 9 5 4
TOTAL: 1,711 1,890 1,916 1,911 1,743 1,558 1,478 1,472 1,506 1,573 1,680
PERCENT CHANGE: 10.5% 1.4% -0.3% -8.8% -10.6% -5.1% -0.4% 2.3% 4.4% 6.8%
MAJOR 2005 2006 2007 2008 2009 2010 2011 2012 2013 2014 2015
ACT Actuarial Science 79 101 101 109 110 87 78 89 110 144 165
RMI Risk Management and Insurance 58 55 71 78 86 103 97 92 107 123 129
RMIZ Risk Management & Ins (BS)/ Bus Adm - - - - - - - - 1 1 1
NM Non-Matric - - - - - - - 1 - - -
TOTAL: 137 156 172 187 196 190 175 182 218 268 295 PERCENT CHANGE: 13.9% 10.3% 8.7% 4.8% -3.1% -7.9% 4.0% 19.8% 22.9% 10.1%
QUEENS & MANHATTAN TOTAL: 1,848 2,046 2,088 2,098 1,939 1,748 1,653 1,654 1,724 1,841 1,975 PERCENT CHANGE: 10.7% 2.1% 0.5% -7.6% -9.9% -5.4% 0.1% 4.2% 6.8% 7.3%
As of Fall 2012, Undeclared students are now coded as Undecided students.
Dual degree students are coded within their major codes.
Queens Campus
MGT INFO SYSTEMS COMBINED
MARKETING COMBINED
Manhattan Campus
Enrollment Trends 14

The Peter J. Tobin College of Business (64)Student Enrollment - Undergraduate Division
Staten Island CampusFall 2005- Fall 2015
4 Students cross-enrolled at other institutionsPrepared by: Office of Institutional Research (cmg/mh/aj/rd/as/re) Based on data as of 10/20/2015
MAJOR 2005 2006 2007 2008 2009 2010 2011 2012 2013 2014 2015
ACCOUNTING COMBINED 106 125 123 130 131 104 87 73 65 86 85
ACC Accounting 104 117 112 119 117 88 78 65 62 83 60
ACC2 Accounting (BS/MS) 2 8 11 11 14 16 9 8 2 1 24
ACCF Accounting/Finance - - - - - - - - 1 1 -
ACCZ Accounting (BS)/Bus Adm (MBA) - - - - - - - - - 1 1
FINANCE COMBINED 72 81 99 124 83 57 31 29 29 29 42
FIN Finance 72 81 99 124 83 57 31 29 29 28 40
FINY Finance(BS)/Accounting(MBA) - - - - - - - - - 1 2
MANAGEMENT COMBINED 94 87 71 48 43 42 30 24 18 21 20
MGT Management 94 87 71 48 43 42 30 24 17 21 20
MGTY BS Management/MS Accounting - - - - - - - - 1 - -
MKT Marketing 50 59 40 37 31 28 22 18 17 22 28
MSC Military Science 4 - - - - - - 1 - 2 - -
0000 Undecided 81 78 54 39 26 27 25 8 8 7 11
TOTAL: 404 430 387 378 314 258 196 152 139 165 188
PERCENT CHANGE: 6.4% -10.0% -2.3% -16.9% -17.8% -24.0% -22.4% -8.6% 18.7% 13.9%
2 No longer offered.
Dual degree students are coded within their major codes.
Enrollment Trends 15

The Peter J. Tobin College of Business (34)Student Enrollment- Graduate Division
Queens, Rome, and ManhattanFall 2005- Fall 2015
5 Formerly Quantitative Analysis6 Formerly Risk Management and InsurancePrepared by: Office of Institutional Research (cmg/mh/aj/rd/as) Based on data as of 10/20/2015
Queens Campus
MAJOR 2005 2006 2007 2008 2009 2010 2011 2012 2013 2014 2015
Master in Business Administration (MBA) 411 352 311 312 335 322 278 227 234 212 164
BUS Business Administration - 80 192 243 268 274 239 197 207 188 151CIS Computer Info Systems / Decision Scie - 3 6 8 8 10 12 12 12 11 4
CON Controllership - - 2 1 1 3 4 2 2 1CIS Decision Sciences - - 5 3 3 3 2 - - - -FIN Finance - 29 76 106 100 89 88 84 82 67 44
GLD Global Leadership - - - - - - - - - - 1IDB Interdisciplinary Business - - - - - - - - - - 3
INTB International Business - 13 23 27 37 57 33 14 29 30 23INVA Investment Analysis - - - - - - - - - - 4
MGT1 Executive Management - 11 24 39 43 32 34 33 38 33 31MKTM Marketing Management - 24 55 57 74 79 64 48 39 40 34
TAX Taxation - - 1 2 2 1 2 2 1 3 2
ACC1 Public Accounting 74 59 36 43 54 45 39 30 27 24 13
CIS Computer Info Sys/Decision Sci 5 25 13 4 - - - - - - - -
CON Controllership 1 1 - - - - - - - - -
FIN Finance 137 78 36 10 7 2 - - - - -
INTB International Business 23 18 5 1 - - - - - - -
MGT1 Executive Management 53 34 20 8 3 - - - - - -
MKT Marketing 93 67 16 7 3 1 - - - - -
TAX Taxation 5 2 2 - - - - - - - -
Master in Science (MS) 86 83 137 154 207 261 219 224 233 199 199
ACC Accounting 33 38 52 75 123 169 145 130 146 129 117
ACC2 Accounting BS/MS 7 12 26 25 32 25 32 37 38 28 44
TAX Taxation 46 33 59 54 52 67 42 57 49 42 38
Advanced Certificate (APCRT/ADVCRT) 4 4 1 2 3 2 3 3 3 2 0
ACC1 Public Accounting2 2 2 1 1 1 - 1 - - - -
CON Controllership2 - 1 - - - - - - 1 1 -
FIN Finance2 1 - - - 1 2 2 2 1 - -
INTB International Business2 - - - 1 - - - - - - -
TAX Taxation2 1 1 - - 1 - - 1 1 1 -
NM Non-Matric 1 1 1 - - - - - - 1 -
TOTAL QUEENS: 502 440 450 468 545 585 500 454 470 414 363PERCENT CHANGE: -12.4% 2.3% 4.0% 16.5% 7.3% -14.5% -9.2% 3.5% -11.9% -12.3%
Note: Beginning in fall 2006, New MBA graduate students are coded as Business Administration (BUS) with a specific concentration. 2 No longer offered.
Enrollment Trends 16

The Peter J. Tobin College of Business (34)Student Enrollment- Graduate Division
Queens, Rome, and ManhattanFall 2005- Fall 2015
5 Formerly Quantitative Analysis6 Formerly Risk Management and InsurancePrepared by: Office of Institutional Research (cmg/mh/aj/rd/as) Based on data as of 10/20/2015
Rome Campus
MAJOR 2005 2006 2007 2008 2009 2010 2011 2012 2013 2014 2015
Master in Business Administration (MBA) 42 41 38 37 33 38 30 23 28 28 27
BUS Business Administration - 13 27 32 32 37 29 23 28 28 27FIN Finance - 1 9 6 10 14 9 3 6 8 5IDB Interdisciplinary Business - - - - - - - - - - 1INTB International Business - 7 12 18 17 17 11 13 9 13 10MKTM Marketing Management - 5 6 8 5 6 9 7 13 7 8RMI Risk Management & Insurance - - - - - - - - - - 3
FIN Finance 15 13 7 3 1 1 1 - - - -
INTB International Business 13 8 1 - - - - - - - -
MKT Marketing 14 7 3 2 - - - - - - -
NM Non-Matric - - 2 - - - - - - - -
TOTAL ROME: 42 41 40 37 33 38 30 23 28 28 27PERCENT CHANGE: -2.4% -2.4% -7.5% -10.8% 15.2% -21.1% -23.3% 21.7% 0.0% -3.6%
MAJOR 2005 2006 2007 2008 2009 2010 2011 2012 2013 2014 2015
Master in Business Administration (MBA) 63 70 87 106 119 105 80 76 69 65 69
BUS Business Administration 31 40 64 89 102 85 71 68 61 56 61ACC1 Public Accounting - 2 4 1 - - - - - - -ERM Enterprise Risk Management - - - - - - - - - 5 10FIN Finance - 5 34 56 66 48 43 45 46 37 35FINR Financial Management of Risk - - 3 4 3 2 1 1 - - -RMI Risk Management & Insurance 31 33 23 27 32 34 27 22 15 14 15TAX Taxation - - - 1 1 1 - - - - 1
ACC1 Public Accounting 3 2 2 8 15 19 9 8 8 9 8
FIN Finance 29 28 21 9 2 1 - - - - -
Master in Science (MS) 45 72 98 95 90 131 134 149 140 102 105
ACC1 Public Accounting 5 12 22 25 30 43 40 40 34 27 34
ERM Enterprise Risk Management - - - - - 12 4 5 2 6 17
INVM Investment Management - - - - - 13 16 29 39 29 30
MGTR Management of Risk (MS) 6 35 49 64 58 48 50 52 57 45 24 16
TAX Taxation 5 11 12 12 12 13 22 18 20 16 8
Advanced Certificate (APCRT/ADVCRT) - 1 1 - - - 1 1 - - -
ACC1 Public Accounting 2 - 1 1 - - - - - - - -
CON Controllership 2 - - - - - - - 1 - - -
FIN Finance 2 - - - - - - 1 - - - -
NM Non-Matric - - - - 1 - - - - - -
TOTAL MANHATTAN: 108 143 186 201 210 236 215 226 209 167 174PERCENT CHANGE: 32.4% 30.1% 8.1% 4.5% 12.4% -8.9% 5.1% -7.5% -20.1% 4.2%
QUEENS, ROME & MANHATTAN TOTAL: 652 624 676 706 788 859 745 703 707 609 564PERCENT CHANGE: -4.3% 8.3% 4.4% 11.6% 9.0% -13.3% -5.6% 0.6% -13.9% -7.4%
Notes: Beginning in Fall 2006, New MBA graduate students are coded as Business Administration (BUS) with a specific concentration.Queens figures include Online Learning Students. Please refer to the Online Learning Enrollment Reports.2No longer offered.
Manhattan Campus
Enrollment Trends 17
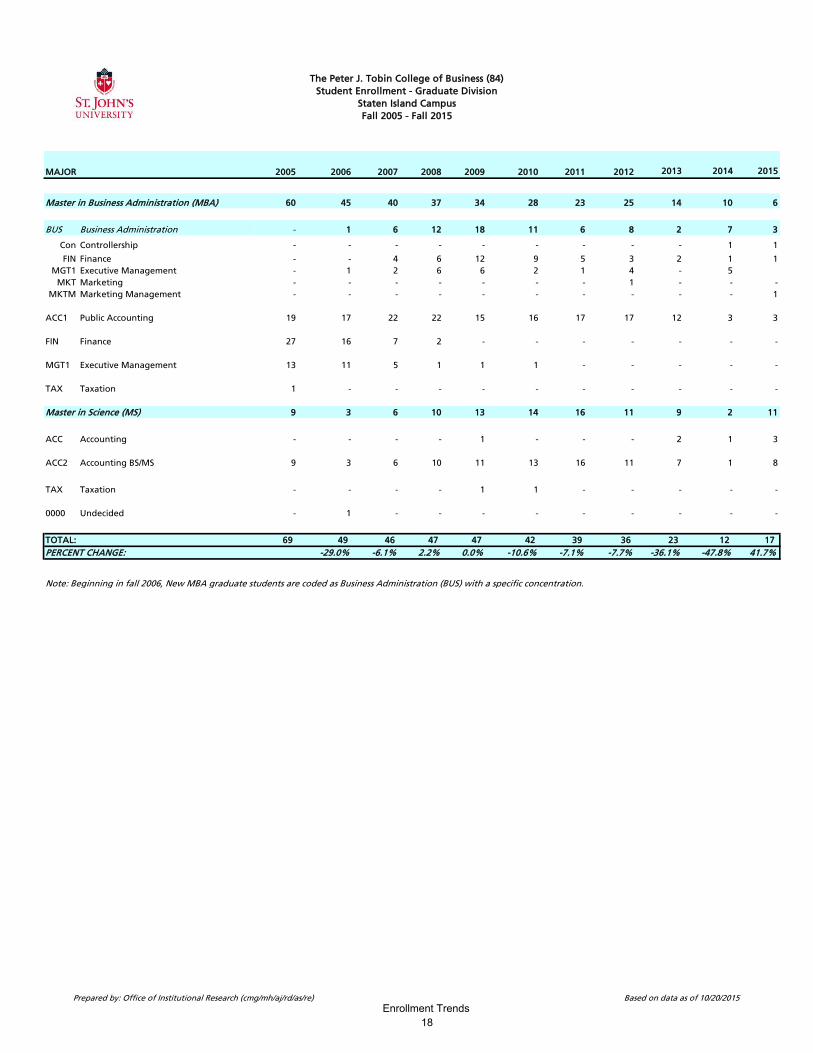
The Peter J. Tobin College of Business (84)
Student Enrollment - Graduate Division
Staten Island Campus
Fall 2005 - Fall 2015
MAJOR 2005 2006 2007 2008 2009 2010 2011 2012 2013 2014 2015
Master in Business Administration (MBA) 60 45 40 37 34 28 23 25 14 10 6
BUS Business Administration - 1 6 12 18 11 6 8 2 7 3
Con Controllership - - - - - - - - - 1 1
FIN Finance - - 4 6 12 9 5 3 2 1 1
MGT1 Executive Management - 1 2 6 6 2 1 4 - 5
MKT Marketing - - - - - - - 1 - - -
MKTM Marketing Management - - - - - - - - - - 1
ACC1 Public Accounting 19 17 22 22 15 16 17 17 12 3 3
FIN Finance 27 16 7 2 - - - - - - -
MGT1 Executive Management 13 11 5 1 1 1 - - - - -
TAX Taxation 1 - - - - - - - - - -
Master in Science (MS) 9 3 6 10 13 14 16 11 9 2 11
ACC Accounting - - - - 1 - - - 2 1 3
ACC2 Accounting BS/MS 9 3 6 10 11 13 16 11 7 1 8
TAX Taxation - - - - 1 1 - - - - -
0000 Undecided - 1 - - - - - - - - -
TOTAL: 69 49 46 47 47 42 39 36 23 12 17
PERCENT CHANGE: -29.0% -6.1% 2.2% 0.0% -10.6% -7.1% -7.7% -36.1% -47.8% 41.7%
Note: Beginning in fall 2006, New MBA graduate students are coded as Business Administration (BUS) with a specific concentration.
Prepared by: Office of Institutional Research (cmg/mh/aj/rd/as/re) Based on data as of 10/20/2015
Enrollment Trends 18

College of Pharmacy and Health SciencesStudent EnrollmentFall 2005 - Fall 2015
Prepared by: Office of Institutional Research (cmg/mh/aj/rd/as/re) Based on data as of 10/20/2015
0
500
1,000
1,500
2,000
2,500
3,000
2005 2006 2007 2008 2009 2010 2011 2012 2013 2014 2015
Enro
llmen
t
Year
Total - College of Pharmacy and Health Sciences
Undergraduate
Graduate
Enrollment Trends 19

College of Pharmacy and Health Sciences (05)Student Enrollment - Undergraduate Division
Queens CampusFall 2005 -Fall 2015
2 No longer offered 3 Not a program13 Formerly Medical TechnologyPrepared by: Office of Institutional Research (cmg/mh/aj/rd/as) Based on data as of 10/20/2015
MAJOR 2005 2006 2007 2008 2009 2010 2011 2012 2013 2014 2015
CLINICAL LAB SCIENCE/MED TECH 52 53 54 80 63 51 38 24 31 37 45
CLSC Clinical Laboratory Sciences13 - - - - - - 36 24 31 37 45
MED Medical Technology 52 53 54 80 63 51 2 - - - -
PHARMACY COMBINED 1,158 1,114 1,114 1,103 1,073 1,199 1,197 1,176 1,230 1,152 1,108
PHA6 Pharmacy - 6 Yr PharmD 1157 1114 1114 1103 1073 1199 1197 1176 1230 1152 1108
PHAS Pharmacy - Self Pace 2, 3 1 - - - - - - - - - -
PAT Pathologist's Assistant 2 14 14 5 - - - - - - - -
PHYSICIAN ASSISTANT COMBINED 336 330 379 421 381 373 383 409 420 376 379
PNT Physician Assistant 334 329 379 421 381 373 383 409 420 376 379
PNTS Physician Assist - Self Pace 2, 3 2 1 - - - - - - - - -
RAD Radiologic Sciences - - - 55 57 108 127 132 113 113 116
TOX Toxicology 101 82 77 65 56 78 65 52 56 48 71
NM Non-Matric - - - - - - - 1 15 91 19
TOTAL: 1,661 1,593 1,629 1,724 1,630 1,809 1,810 1,794 1,865 1,817 1,738PERCENT CHANGE: -4.1% 2.3% 5.8% -5.5% 11.0% 0.1% -0.9% 4.0% -2.6% -4.3%
Enrollment Trends 20

College of Pharmacy and Health Sciences (25)Student Enrollment - Graduate Division
Queens Campus Fall 2005 - Fall 2015
Prepared by: Office of Institutional Research (cmg/mh/aj/rd/as/re) Based on data as of 10/20/2015
MAJOR 2005 2006 2007 2008 2009 2010 2011 2012 2013 2014 2015
PHA1 Pharmaceutical Sciences (MS and PhD) 130 151 185 203 176 184 174 172 144 117 117
PHARMACY COMBINED 457 518 566 570 567 544 520 489 456 558 611
PHA2 Pharmacy Administration 22 22 33 60 65 46 31 25 26 27 19
PHA6 Pharmacy - 6Yr PharmD 389 460 513 489 489 494 489 464 430 531 592
PHA9 Pharmacy, Practitioner Option 46 36 20 21 13 4 - - - - -
PUBH Public Health - - - - - - - - 6 14 20
TOX Toxicology 20 23 22 31 32 28 23 20 20 17 13
NM Non-Matric 5 3 4 4 1 3 4 2 3 2 -
TOTAL: 612 695 777 808 776 759 721 683 629 708 761 PERCENT CHANGE: 13.6% 11.8% 4.0% -4.0% -2.2% -5.0% -5.3% -7.9% 12.6% 7.5%
Enrollment Trends 21

College of Professional StudiesStudent Enrollment Fall 2005 - Fall 2015
Prepared by: Office of Institutional Research (cmg/mh/aj/rd/as/re) Based on data as of 10/20/2015
0
500
1,000
1,500
2,000
2,500
3,000
3,500
4,000
4,500
5,000
5,500
2005 2006 2007 2008 2009 2010 2011 2012 2013 2014 2015
Enro
llmen
t
Year
Queens and Staten Island - Graduate
Staten Island - Undergraduate
Total - College of Professional Studies
Queens - Undergraduate
Enrollment Trends 22

College of Professional Studies (03)
Student Enrollment - Undergraduate Division
Queens Campus
Fall 2005 -Fall 2015
MAJOR 2005 2006 2007 2008 2009 2010 2011 2012 2013 2014 2015
ADS Administrative Studies 38 46 55 64 44 30 45 46 50 56 59
ADVERTISING COMMUNICATION COMBINED 47 96 119 129 125 124 113 116 116 107 118
ADV Advertising Communication 28 - - - - - - - - - -
ADVC Advertising Communication (Creative Trk) 6 80 97 99 106 79 60 58 60 58 64
ADVM Advertising Communication (Acc. Mgt) 10 11 11 17 11 32 33 29 24 20 25
ADVP Advertising Communication (Media Planning) 3 5 11 13 8 13 20 29 32 29 29
BUSINESS COMBINED 65 66 42 44 65 89 58 41 41 34 16
BUS Business Administration (AS) 57 61 39 43 65 89 58 41 41 34 16
BUS1 Business - Accounting Option (AS) 8 5 3 1 - - - - - - -
COMMUNICATION ARTS COMBINED 433 424 390 336 330 342 349 351 331 354 406
CAS Communication Arts 430 420 389 334 329 341 349 345 328 350 398
CAS1 Communication Arts/Sociology 2 4 1 2 1 1 - 4 2 3 4
CAS2 Communication Arts/Gov&Politic 1 - - - - - - 2 1 1 4
COMPUTER SCIENCE & IT COMBINED 243 193 177 194 235 243 256 230 249 318 381
CUS Computer Science 125 121 101 111 126 122 110 94 103 153 167
CUS2/CUSB Computer Science (Business Administration) 61 33 33 27 20 18 24 22 30 38 51
CUS3/CUST Computer Science (Networking & Telecom.) 37 13 8 6 6 5 10 6 7 9 7
CUSC Computer Science (Corporate Security) - - 1 - 1 1 - - - - -
CUSF Computer Science (Cyber Forensics) - - 1 4 3 2 2 1 - - -
CUSG Computer Science (Media Graphics) 1 4 5 - 2 2 2 2 - - -
CUSH Computer Science (Healthcare Informatics) - - - - - - - 1 - 2 7
CUSM Computer Science (Mathematics) - - 1 - 1 3 1 - - - -
CUSS Computer Science (Security Systems) - 2 4 8 7 7 8 14 12 10 22
CUSW Computer Science (Web Services) - - - - - 2 3 1 2 3 4
CUSY Computer Science(BS)/Accounting(MS) - - - - - - - - - - 1
CUSZ Computer Science (Business Administration) - - - - - - - 4 7 7 10
CUS1 Microcomputer Systems 2
- - - - - - - - - - -
CSS/CYB Cyber Security Systems - - 1 17 33 54 69 63 66 63 79
CYBY Cyber Security Systems/Accounting (MS) - - - - - - - - - 2 2
CSSZ/CYBZ Cyber Security Systems/Business Admin - - - - - - - 2 3 3 5
IT Information Technology 1 2 2 1 16 6 2 1 1 - -
ITB Information Technology (Business) 14 12 15 14 14 18 23 15 16 26 26
ITC Information Technology (Corporate Security) - - - - 1 - - - - - -
ITF Information Technology (Cyber Forensics) - - - 1 1 2 - 1 - - -
ITG Information Technology (Graphic Design) 1 2 2 3 2 1 2 2 1 - -
ITS Information Technology (Security Systems) - - - 1 2 - - - - - -
ITT Information Technology (Telecomm.) 3 4 3 1 - - - - - - -
ITZ Information Technology/Business Admin - - - - - - - 1 1 2 -
CRIMINAL JUSTICE COMBINED 509 498 441 409 364 395 425 443 442 394 389
CRJ Criminal Justice (BS) 456 448 389 371 303 310 339 341 341 285 299
CRJ1 Criminal Justice (AS) 23 18 21 9 7 12 8 1 2 1 3
CRJ2 Criminal Justice/Sociology 6 6 2 - 2 2 0 8 6 10 7
CRJ3 Criminal Justice/Gov't & Polit 1 - - - - 1 0 2 2 2 2
CRJ6 Criminal Justice - Legal Studies Spec. - - - - - - 0 - - - -
CRJF Criminal Justice (Forensic Psychology) 23 26 29 29 52 70 78 91 81 86 70
CRJL Criminal Justice/Criminal Justice Leader - - - - - - - - 10 10 8
DAFT Dramatic Arts, Film & Television - - - - - 2 10 30 39 35 12
ENTR Enterprise Reg: Profit & Non-Profit - - - - - 2 21 19 15 19 18
FSA Funeral Service Administration 8 6 6 5 5 7 8 8 10 3 2
HCI Healthcare Informatics - - - - - 6 11 14 20 18 16
HLS Homeland Security 12- - - 5 17 43 79 96 111 147 157
Prepared by: Office of Institutional Research (cmg/mh/aj/rd/as/re) Based on data as of 10/20/2015Enrollment Trends 23

College of Professional Studies (03)
Student Enrollment - Undergraduate Division
Queens Campus
Fall 2005 -Fall 2015
MAJOR 2005 2006 2007 2008 2009 2010 2011 2012 2013 2014 2015
HEALTH SERVICES & HUMAN SERVICES COMBINED 156 135 151 143 143 135 126 145 166 168 162
HSA Health Services Administration 104 95 105 102 105 87 59 23 6 2 -
HSA2 Health Services Admin/Sociology 1 - - 1 - - - - - - -
HHS Health and Human Services - - - - - 15 57 119 160 166 162
HSC Human Services 51 40 46 40 38 33 10 3 - - -
HMT Hospitality Management 80 102 123 112 116 111 94 97 89 91 102
JOURNALISM COMBINED 162 172 199 188 179 185 183 161 166 134 142
JOU Journalism 160 171 199 188 179 184 182 158 165 133 138
JOU1 Journalism/Sociology 1 - - - - 1 - 1 - - 2
JOU2 Journalism - Government & Politics 1 1 - - - - 1 2 1 1 2
LAS Liberal Arts (AA) 142 95 62 50 38 34 25 16 11 9 10
LEGAL STUDIES COMBINED 349 375 364 405 380 390 399 366 360 351 335
LES Legal Studies (BS) 329 363 358 401 371 384 392 360 351 337 316
LES1 Legal Studies (AS) 16 11 5 4 6 5 6 4 1 1 3
LES2 Legal Studies/Sociology - - - - 1 1 - 1 4 7 6
LES3 Legal Studies/Gov & Politics - - - - 1 - - 1 4 6 10
LES9 Legal Studies (Certificate) 4 1 1 - 1 - 1 - - - -
LST Liberal Studies 22 31 500 630 585 604 603 477 410 311 188
NETWORKING/TELECOMMUNICATION COMBINED 48 28 29 25 12 12 15 15 11 8 9
NET Networking & Telecommunication - - - - 9 12 15 15 11 8 9
TEL Telecommunications (BS) 20 11 11 13 2 - - - - - -
TEL1 Telecommunications (AS) 2 - - - - - - - - - -
TEL2/TELB Telecommunications (Business Option) 19 13 14 9 - - - - - - -
TEL3/TELU Telecommunications (Multi Media) 7 2 1 - - - - - - - -
TELC Telecommunications (Corporate Security) - 2 - - - - - - - - -
TELG Telecommunications (Media Graphics) - - 3 3 1 - - - - - -
PHOJ Photojournalism - - - - - 1 12 18 22 19 17
PUBR Public Relations - - 29 87 140 162 204 184 181 183 184
SPM Sport Management 320 355 338 346 383 413 428 425 430 414 420
SSC Social Science 3 2 2 1 - 1 - - - - -
TELEVISION COMBINED 119 143 137 157 196 190 157 146 139 145 156
TVF Television and Film Prod (BS) 75 136 137 156 194 190 157 146 138 144 156
TVF1 Television And Film (AS) 8 7 - 1 2 - - - 1 1 -
TVF2 Television And Film Prod/Video 10 - - - - - - - - - -
TVF3 Tele And Film Prod/Film Studies 26 - - - - - - - - - -
0000 Undecided 986 875 433 166 84 46 47 44 97 110 134
NM Non-Matric 3 2 1 1 1 - - 27 7 16 7
TOTAL: 3,733 3,644 3,598 3,497 3,442 3,567 3,668 3,515 3,513 3,444 3,440
PERCENT CHANGE: -2.4% -1.3% -2.8% -1.6% 3.6% 2.8% -4.2% -0.1% -2.0% -0.1%
12 Prior to 2008, was known as Security Administration; Prior to Fall 2014, was known as Homeland and Corporate Security.
As of Fall 2007, "referred/offered" incoming freshmen have been coded as LST. Previously, they were coded as Undeclared/Undecided.
As of Fall 2009, Telecommunications is now Networking and Telecommunications.
As of Fall 2011, Health Services Administration and Human Services are no longer accepting new students. Students are now enrolled in Health and Human Services.
As of Fall 2012, Undeclared students are now coded as Undecided students.
Figures include Online Learning Students. Please refer to the Online Learning Enrollment Report.
Dual Degree Students are coded within their major codes.
Prepared by: Office of Institutional Research (cmg/mh/aj/rd/as/re) Based on data as of 10/20/2015Enrollment Trends 24

College of Professional Studies (53)
Student Enrollment - Undergraduate Division
Staten Island Campus
Fall 2005-Fall 2015
MAJOR 2005 2006 2007 2008 2009 2010 2011 2012 2013 2014 2015
ADS Administrative Studies - 2 2 3 5 3 2 2 2 2 3
ADVERTISING COMMUNICATION - - - 1 4 4 6 7 6 1 3
ADVC Advertising Communication (Creative Trk) - - - 1 2 3 4 6 4 1 1
ADVM Advertising Communication (Acc. Mgt) - - - - 1 1 2 1 2 - -
ADVP Advertising Communication (Media Planning) - - - - 1 - - - - - 2
BUS Business Administration (AS) 64 42 20 9 8 3 1 7 1 4 3
COMMUNICATION ARTS COMBINED 144 105 110 118 96 76 68 69 47 41 56
CAS Communication Arts 144 105 110 118 96 76 68 68 45 39 55
CAS1 Communication Arts/Sociology - - - - - - - 1 1 1 -
CAS2 Communication Arts/Government and Politics - - - - - - - - 1 1 1
CRIMINAL JUSTICE COMBINED 121 105 92 97 87 92 95 77 70 68 71
CRJ Criminal Justice 100 86 80 84 76 83 87 70 61 50 51
CRJ1 Criminal Justice (AS) 21 19 5 5 3 1 1 2 1 2 3
CRJ2 Criminal Justice/Sociology - - - - - - - - - 1 -
CRJ3 Criminal Justice/Gov't & polit - - - - - - - - - 1 1
CRJF Criminal Justice (Forensic Psychology) - - 7 8 8 8 7 5 8 9 6
CRJL Criminal Justice/Criminal Jus Leader - - - - - - - - - 5 10
FSA Funeral Service Admin 5 6 6 8 7 4 5 6 5 3 1
HLS Homeland Security 121 1 1 1 1 4 5 7 9 12 11
HMT Hospitality Management 22 20 26 24 27 20 19 10 7 8 8
JOU Journalism - - - 1 5 11 9 5 7 8 4
LEGAL STUDIES COMBINED 125 106 95 90 88 58 48 50 38 26 21
LES Legal Studies (BS) 110 96 90 87 86 57 46 47 36 26 21
LES1 Legal Studies (AS) 14 9 5 3 2 - 2 2 1 - -
LES3 Legal Studies/Gov & Politics - - - - - - - 1 1 - -
LES9 Legal Studies (CERT) 1 1 - - - 1 - - - - -
LST Liberal Studies - - 84 128 116 123 95 65 73 53 52
PUBR Public Relations - - - 1 3 4 10 6 7 8 4
SPM Sport Management 61 62 71 59 40 42 32 34 22 22 21
TELECOMMUNICATIONS COMBINED 15 6 3 3 1 1 1 - - - -
TEL Telecommunications (BS) 14 6 3 3 1 1 1 - - - -
TEL1 Telecommunications (AS) 1 - - - - - - - - - -
TELEVISION COMBINED 16 14 12 17 17 19 21 22 15 16 15
TVF Television and Film Prod (BS) 14 14 12 17 17 19 21 22 14 15 14
TVF1 Television and Film Prod (AS) - - - - - - - - 1 1 1
TVF2 Television & Film Prod: Video 2 - - - - - - - - - -
0000 Undecided 141 191 97 46 27 16 10 5 7 9 10
NM Non-Matric - - - - - - - 3 - - 1
TOTAL: 715 660 619 606 532 480 427 375 316 281 284
PERCENT CHANGE: -7.7% -6.2% -2.1% -12.2% -9.8% -11.0% -12.2% -15.7% -11.1% 1.1%
Notes:12 Prior to 2008, was known as Security Administration; Prior to Fall 2014, was known as Homeland and Corporate Security.
As of Fall 2007, "referred/offered" incoming freshmen have been coded as LST. Previously, they were coded as Undeclared/Undecided.
As of Fall 2012, Undeclared students are now coded as Undecided students.
Figures include Online Distance Learning Students. Please refer to the Online Learning Enrollment Report.
Dual Degree Students are coded within their major codes.
Prepared by: Office of Institutional Research (cmg/mh/aj/rd/as/re) Based on data as of 10/20/2015Enrollment Trends
25

College of Professional StudiesStudent Enrollment - Graduate Division
Fall 2005 - Fall 2015
Prepared by: Office of Institutional Research (cmg/mh/aj/rd/as/re) Based on data as of 10/20/2015
MAJOR 2005 2006 2007 2008 2009 2010 2011 2012 2013 2014 2015
CRL Criminal Justice Leadership 82 46 49 42 52 57 46 61 64 65 62DMPA Data Mining & Predictive Analy - - - - - - - - - 14 33
ICM International Communications - - - - 26 35 39 45 43 44 39
SPM Sport Management - - 23 34 45 58 66 71 81 74 75
NM Non-Matric 2 1 1 2 - - 7 3 2 3 -
TOTAL: 84 47 73 78 123 150 158 180 190 200 209PERCENT CHANGE: -44.0% 55.3% 6.8% 57.7% 22.0% 5.3% 13.9% 5.6% 5.3% 4.5%
MAJOR 2005 2006 2007 2008 2009 2010 2011 2012 2013 2014 2014
CRL Criminal Justice Leadership 32 22 24 19 12 14 10 7 3 2 8
0000 Undecided 3 5 - 1 1 - - - - - -
NM Non-Matric 1 - 3 - 3 2 1 - 1 - -
TOTAL: 36 27 27 20 16 16 11 7 4 2 8PERCENT CHANGE: -25.0% 0.0% -25.9% -20.0% 0.0% -31.3% -36.4% -42.9% -50.0% 300.0%
Queens and Staten Island Total: 120 74 100 98 139 166 169 187 194 202 217PERCENT CHANGE: -38.3% 35.1% -2.0% 41.8% 19.4% 1.8% 10.7% 3.7% 4.1% 7.4%
Note: Queens figures may include Online Learning or Oakdale Students. Please refer to the Online Learning and Oakdale Enrollment Reports.
Queens Campus (23)
Staten Island Campus (83)
Enrollment Trends 26

School of LawStudent Enrollment Fall 2005- Fall 2015
Prepared by: Office of Institutional Research (cmg/mh/aj/rd/as/re) Based on data as of 10/20/2015
0
200
400
600
800
1,000
1,200
2005 2006 2007 2008 2009 2010 2011 2012 2013 2014 2015
Enro
llmen
t
Year
Total - School of Law
Enrollment Trends 27

School of Law (28)
Student Enrollment - Graduate Division
Queens Campus
Fall 2005 - Fall 2015
MAJOR 2005 2006 2007 2008 2009 2010 2011 2012 2013 2014 2015
LAW Law 964 922 915 894 922 949 936 890 803 745 718
LLMB Bankruptcy (LLM) 16 11 16 19 28 29 29 28 20 12 8
LLMP International Sports Law (LLM) - - - - - - - 13 18 9 6
LLMT Transnational Legal Practice (LLM) - - - - - - - 9 18 26 23
LLMU US Legal Studies Foreign Law Grd (LLM) - - - 17 7 18 15 20 24 19 16
NM Non-Matric 5 1 2 1 1 - - - 5 3 5
TOTAL: 985 934 933 931 958 996 980 960 888 814 776
PERCENT CHANGE: -5.2% -0.1% -0.2% 2.9% 4.0% -1.6% -2.0% -7.5% -8.3% -4.7%
Prepared by: Office of Institutional Research (cmg/mh/aj/rd/as/re) Based on data as of 10/20/2015
Enrollment Trends 28

Institute for Biotechnology (39)Student Enrollment - Graduate Division
Queens CampusFall 2005 - Fall 2015
Prepared by: Office of Institutional Research (cmg/mh/aj/rd/as/re) Based on data as of 10/20/2015
MAJOR 2005 2006 2007 2008 2009 2010 2011 2012 2013 2014 2015
BIOT Biological/ Pharmaceutical Biot - - 9 15 14 20 20 21 22 21 14
TOTAL: 9 15 14 20 20 21 22 21 14PERCENT CHANGE: 66.7% -6.7% 42.9% 0.0% 5.0% 4.8% -4.5% -33.3%Note: This Institute began in Spring 2007.
Enrollment Trends 29
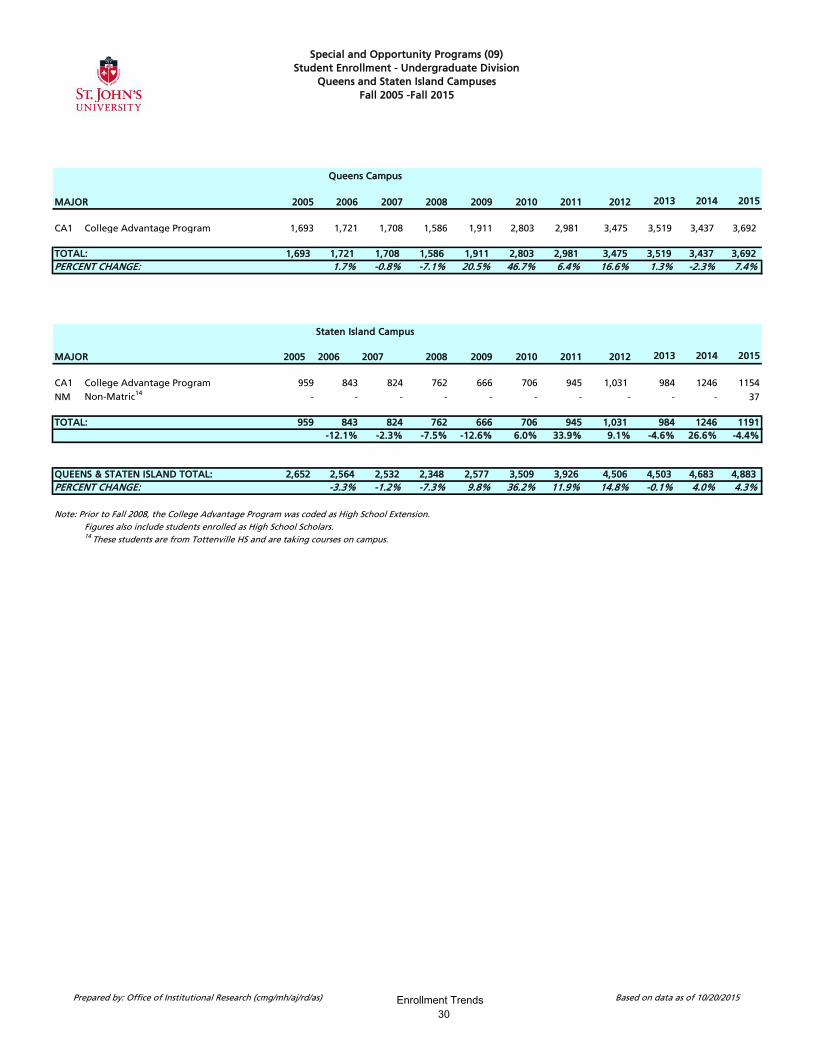
Special and Opportunity Programs (09)
Student Enrollment - Undergraduate Division
Queens and Staten Island Campuses
Fall 2005 -Fall 2015
MAJOR 2005 2006 2007 2008 2009 2010 2011 2012 2013 2014 2015
CA1 College Advantage Program 1,693 1,721 1,708 1,586 1,911 2,803 2,981 3,475 3,519 3,437 3,692
TOTAL: 1,693 1,721 1,708 1,586 1,911 2,803 2,981 3,475 3,519 3,437 3,692
PERCENT CHANGE: 1.7% -0.8% -7.1% 20.5% 46.7% 6.4% 16.6% 1.3% -2.3% 7.4%
MAJOR 2005 2006 2007 2008 2009 2010 2011 2012 2013 2014 2015
CA1 College Advantage Program 959 843 824 762 666 706 945 1,031 984 1246 1154
NM Non-Matric14
- - - - - - - - - - 37
TOTAL: 959 843 824 762 666 706 945 1,031 984 1246 1191
-12.1% -2.3% -7.5% -12.6% 6.0% 33.9% 9.1% -4.6% 26.6% -4.4%
QUEENS & STATEN ISLAND TOTAL: 2,652 2,564 2,532 2,348 2,577 3,509 3,926 4,506 4,503 4,683 4,883
PERCENT CHANGE: -3.3% -1.2% -7.3% 9.8% 36.2% 11.9% 14.8% -0.1% 4.0% 4.3%
Note: In Fall 1996, all high school students were reported as undergraduates on the Queens campus.
Note: Prior to Fall 2008, the College Advantage Program was coded as High School Extension.
Figures also include students enrolled as High School Scholars.14 These students are from Tottenville HS and are taking courses on campus.
Staten Island Campus
Queens Campus
Prepared by: Office of Institutional Research (cmg/mh/aj/rd/as) Based on data as of 10/20/2015Enrollment Trends 30