Embed Size (px)
Citation preview

0
No. 80
September 2014
Yoko Kijima
Enhancing Rice Production in Uganda: Impact Evaluation of a Training Program and Guidebook Distribution in Uganda
An Empirical Analysis of Expanding Rice Production in Sub-Sahara Africa

Use and dissemination of this working paper is encouraged; however, the JICA
Research Institute requests due acknowledgement and a copy of any publication for
which this working paper has provided input. The views expressed in this paper are
those of the author(s) and do not necessarily represent the official positions of either the
JICA Research Institute or JICA.
JICA Research Institute
10-5 Ichigaya Honmura-cho
Shinjuku-ku
Tokyo 162-8433 JAPAN
TEL: +81-3-3269-3374
FAX: +81-3-3269-2054
Copyright ©2014 Japan International Cooperation Agency Research Institute
All rights reserved.

1
Enhancing Rice Production in Uganda: Impact Evaluation of a Training Program
and Guidebook Distribution in Uganda
Yoko Kijima* Abstract This paper provides an overview of rice sector development in Uganda and examines the effects of two technology dissemination programs on the enhancement of rice production in Eastern and Northern Uganda. One program was a JICA training program that provided on-the-job training at demonstration plots 3–4 times a year, while the other was to distribute a rice cultivation guidebook to households that were randomly selected. The training program was shown to have improved rice productivity. In contrast, there were no significant effects resulting from the distribution of the guidebook on technology adoption or rice production. Although the distribution of the guidebook was less costly and easier to implement than the training program, distribution of the guidebook alone cannot be a substitute for conventional training programs Keywords: rice production, Uganda, program evaluation, cultivation practices, technology adoption
*Graduate School of Systems & Information Engineering, University of Tsukuba, 1-1-1 Tennodai, Tsukuba, Ibaraki, 305-8577, Japan; Phone (+81) 29-853-5092, Fax (+81) 29-853-5070; [email protected]

2
1. Introduction
In Uganda, rice has long been a staple food, even though it is a relatively minor source of calorie
intake (Benson et al. 2008). Rapid population growth and urbanization, however, has brought
about increases in rice consumption, resulting in the importation of 60,000 tons of rice annually
(Kikuchi et al. 2013b). Since an increase in domestic rice production might provide a way to
save foreign currency reserves by decreasing dependence on imported rice and may help to
improve food security and decrease rural poverty, the Government of Uganda (GoU) released
the National Rice Development Policy (NRDP) in 2009. The policy made a commitment to
doubling rice production in 10 years by joining the Coalition for African Rice Development
(CARD) (MAAIF 2009).
According to the FAO Statistics, in the first 3 years since the target was set (2009–2012),
rice production in Uganda has increased only by 3% from 206,000 tons to 212,000 tons, while
the area under rice cultivation increased by 7%. Given that the areas suitable for rice cultivation
will remain limited unless the greater investment in irrigation facilities is made, improving
productivity is necessary to boost rice production in Uganda.
Based on the experience from the Asian Green Revolution, there is no doubt that the
promotion of modern inputs such as high-yielding seeds and chemical fertilizer contributes to
yield enhancement (Barrett et al. 2010). Without irrigation facilities, however, the use of
expensive modern inputs may be too risky or may not be profitable, thereby resulting in the
non-adoption of modern inputs (Kajisa and Payongayong 2011, Otsuka and Larson 2013,
Nakano and Kajisa 2013). In the case of rice cultivation in Sub-Sahara Africa (SSA),
agronomists and development practitioners have found that there is room to increase agricultural
productivity by improving cultivation practices (deGraft-Honson et al. 2014). Since this type of
technology does not require additional expenses, it may be easily accepted by small farmers. The
question is how such information should be conveyed to a large population. The standard

3
method of agricultural technology transfer is through agricultural extension workers (Feder et al.
1985). In many SSA countries, however, the extension system does not function effectively
(Anderson and Feder 2007). While international development agencies may also play an
important role in transferring agricultural technologies, providing training directly to rural
farmers in large areas of the country tends to be too costly. It is, therefore, necessary to examine
cheaper and more effective alternatives to disseminate relevant information to rural households.
Given the high penetration of mobile phones, sending the information to farmers via short text
messages has become a viable option (Aker 2011). It is not clear, however, whether farmers can
sufficiently understand and utilize such information on agricultural cultivation practices as
effectively as they do when they have attended training programs and received advice from
agricultural extension workers.
In 2010 and 2012, a household survey covering major rice growing areas in the rainfed
lowlands of Eastern and Northern Uganda was conducted. This panel dataset makes it possible
to gain an overview of the current status and the short-term variations in rice production in
Uganda. In addition, in the study areas, two programs were implemented to disseminate
improved rice cultivation practices: one was on-the-job training in the demonstration plots
provided by the experts of the Japan International Cooperation Agency (JICA) and government
extension officers in Uganda while the other was the distribution of a “rice cultivation
guidebook,” which was prepared by JICA experts and distributed by the survey team led by the
author. By estimating the impact of these programs, this paper attempts to derive policy
implications to accelerate rice production in Uganda.
2. Rice in Uganda
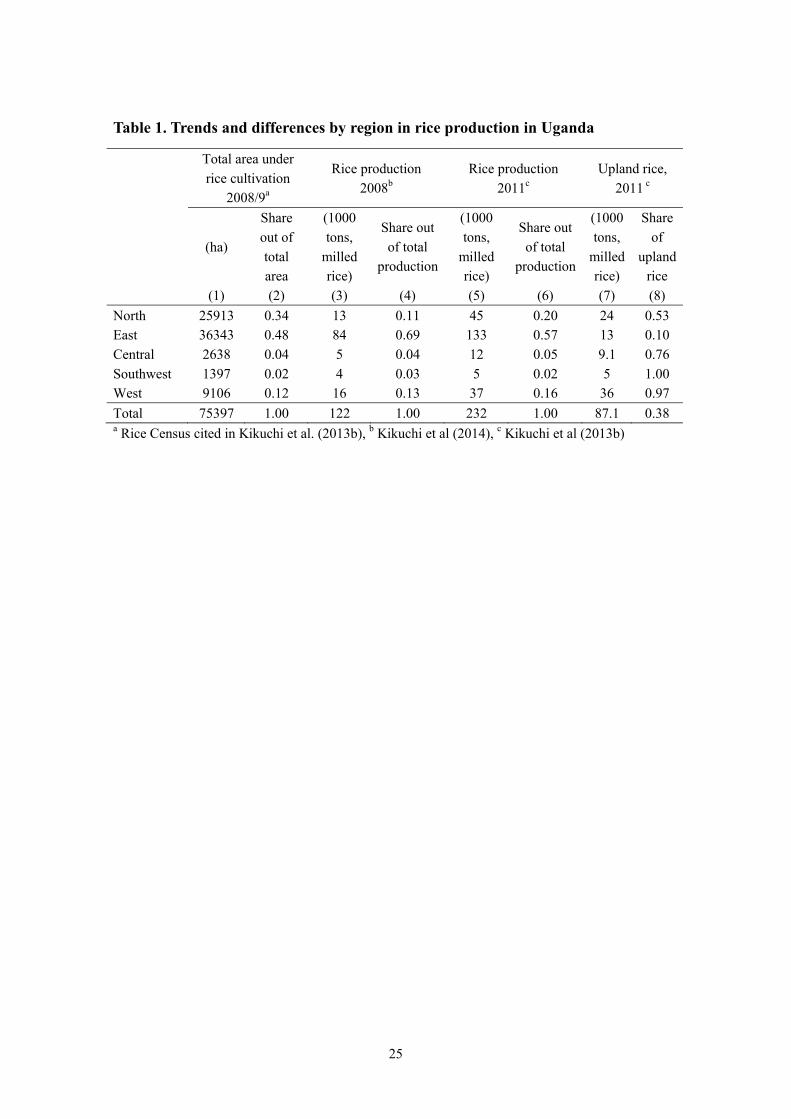
Table 1 shows the over-time trend of rice production in Uganda from 2008 to 2010 as well as
differences by region. According to the Rice Census in 2008 (column 2),**3** about half of the

4
area under rice cultivation was located in the Eastern region (48%), followed by the Northern
region (34%). The estimated total quantity of milled rice produced domestically (columns 3 and
5) increased from 122 thousand tons in 2008 to 232 thousand tons in 2011 and total rice
production almost doubled2. In the Eastern region, the largest amount of rice was produced (57%
in 2011). In the Northern and Western regions, rice production has increased more rapidly than
in the Eastern region. This is probably because upland rice cultivation has been expanding in the
Northern and Western regions after the introduction of NERICA3. In 2011, the production in
upland rice cultivating areas over the total rice cultivating areas accounted for 53% and 97% in
the Northern and Western regions, respectively.
This impressive progress in the rice production, however, does not guarantee that this
trend will continue in Uganda. In 2011, 70% of the demand for rice was met domestically
(Kikuchi et al 2013b). According to the domestic resource cost ratio, domestic rice produced in
the rainfed lowland and upland ecosystems is slightly less competitive than imported rice
(Pakistan and Tanzania) mainly due to the low yields and the high labor costs, while the rice
cultivation in the irrigated ecosystem is competitive (Kikuchi et al. 2013b). Unless productivity
is improved, domestic production is unlikely to replace rice imports .
In terms of consumption, rice has been a minor staple crop in Uganda. In 2005, the
consumption of rice accounted for only 2.6% of the total calorie intake in Uganda (Benson et al.
2008). In urban areas, more rice was consumed (6.2%). Nationally, the main staple foods are
tubers (22.6%), matoke (18.9%), maize (16.1%) and pulses (13.1%). In the rice producing areas,
rice is often consumed at home, while rice is still considered a luxury item in non-rice growing
2 While this massive increase (2008-2011) seemeingly contradicts the FAO statistics cited above in the Introduction (2009-2011)., there was a sharp increase in rice production between 2008 and 2009. 3 NERICA is the abbreviation of New Rice for Africa, an upland rice variety suitable for African
environments. See Kijima et al. (2008) for the potential of NERICA in Uganda and Kijima et al. (2011) for studies indicating NERICA’s positive effect on household income.

5
areas, mainly because the relative price of rice is substantially higher than that of maize in
Uganda (RATIN 2014).
As stated in Kikuchi (2013a), about 40 different rice varieties were planted by farmers in
Uganda. Among the domestic rice varieties, Supa is the most popular variety since it has some
aroma and provides a stable yield. The price of Supa is usually higher than the other varieties
(e.g., Kaiso and “Upland”), which are not differentiated in the markets. About half of the rice
produced domestically is consumed in the capital city and the remainder is consumed in the
regions where rice is produced (Kikuchi et al. 2013b).**7**
3. Data and descriptive statistics
3.1. Sampling and survey
Two types of household surveys were conducted: An extensive survey (ES) in 2010 and
2012 and a case study (CS) in 2010. The objective of ES was to monitor the progress of
rice production in Uganda under the rainfed lowland ecosystems, while CS was
conducted in areas where the JICA training project was implemented. The household
questionnaire contained a wide range of questions so as to capture farm and non-farm
activities undertaken in the last 12 months as well as household demography,
consumption expenditure, and assets (land, livestock, farm equipment, and other
household items). Since the data collected in 2010 (2012) captured the information in
2009 (2011), , the years of the data sets will henceforth be referred to as 2009 and 2011.
3.1.1. Extensive survey
The sample districts were purposively selected based on the availability of the wetlands
usable for rice production in Eastern and Northern Uganda. The other criteria used in

6
selecting the sample districts were average rice cultivation experience as well as
agro-ecological conditions so as to capture a wide variety of the rainfed lowlands and
different levels of the rice cultivation skills. Five districts out of 28 Eastern and Northern
districts4 were chosen (Figure 1, Panel A). Butaleja and Lira districts have large
irrigation schemes and farmers in these districts have longer experience of rice
production than the other districts. Households in Lira and Dokolo districts have larger
landholdings on average than the other districts.
Two sub-counties that are locally well known as rice producing areas5 were
selected from each district. In these 10 sub-counties, the names of all local council 1s
(LC1s, the lowest administrative unit in Uganda) in each sub-county were listed up.
From the list, 60 LC1s were randomly selected. In each LC1, 10 households were
randomly selected by using the lists of the households obtained from the LC1 chiefs.
Thus, in total, 600 households were interviewed in 2010. For the second round, 30
sampled households were not available for interview (5% attrition) and the number of
the sampled households in the panel data declined to 570.
In each LC1, a community-level survey was also conducted. The respondents
consist of the LC1 chairman, key informants, rice farmers, female farmers, youth, and
elders. The questionnaire included general information such as the population,
infrastructure, land ownership, land rental transactions, price information on agricultural
inputs and outputs, ownership of cattle, access to credit organizations, local associations,
and agricultural programs.
4 For the Northern districts, only those that are around Lake Kyoga are considered as population.
5 The information was obtained from the district agricultural officer in each district.

7
3.1.2. Case study
As sample areas for the case study, four rice production areas were selected from (1) the
project sites that JICA designated as demonstration plots and had provided training
(namely, Bugiri and Mayuge) and (2) the sites that the JICA experts considered as
candidates for future training projects (namely, Bukedea and Pallisa). All the sampled
areas were located in wetlands that can be used for lowland rice cultivation (Figure 1,
Panel B). At each site, the demonstration plot (or plot where the training was planned to
be offered) was identified by the JICA experts. Based on the distance from the
demonstration plot, 75 households (rice plots) were randomly selected. In other words,
sample households were chosen based on the location of their rice plots. Thus, all the
sampled households were rice growers.
3.2. Projects on improving rice cultivation practices
3.2.1. Randomized distribution of the lowland rice cultivation guidebook
In each district covered by ES, a half of the sampled LC1s were randomly selected as
treatment LC1s, and the lowland rice cultivation guidebook was given to all sampled
households within these selected LC1s when the 1st round of household surveys was
conducted in 2010. Since weather patterns might play a critical role in deciding who
farms rice and who does not, randomization of the beneficiaries (based on the location
of the program) is an ideal method to solve any potential selection bias. As shown in
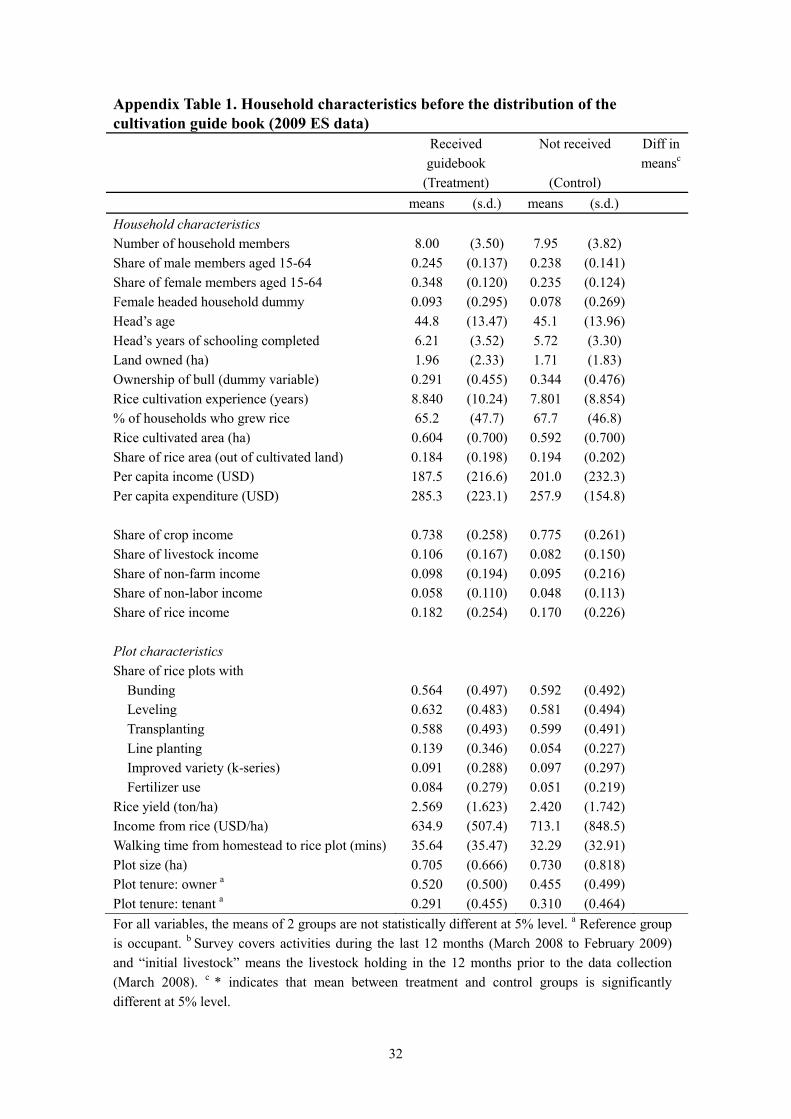
Appendix Table 1, the observed characteristics of the sampled households and rice plots
of treatment and control LC1s are not statistically different, suggesting that the
randomization was successful.
The lowland rice cultivation guidebook was prepared by the JICA experts for the
project conducted in Uganda. It is 15-pages long with photos and written in English. The

8
issues covered are carefully selected to be of critical importance for lowland rice
cultivation and applicable to the Ugandan small farmers. The guidebook is practical,
explaining the advantages of the transplanting method, including how to conduct the
germination tests and carry out transplanting (spacing and depth of seedlings), and ways
to prepare the land, seeds, and the seedbed for the transplantation. It also explains the
appropriate type of fertilizer and the timing of and amount chemical fertilizer to apply, as
well as the methods of weed management. There are photos of the insect pests and the
diseases of the lowland rice as well as a graph indicating the effect of the seedling age in
transplanting on the rice yield, which is meant to emphasize the importance of using the
young seedlings for transplanting.
By the time of our survey, certified lowland rice seed had not been released in
Uganda – the improved variety for lowland ecosystems was not yet being produced by
seed companies and was therefore not sold in local shops. When households start
growing rice in the lowland ecosystem for the first time, rice seeds have to be obtained
from relatives and neighboring households who also acquired the seeds from their
neighbors when they started growing rice. Most of the farmers do not know whether
their rice seeds are the improved varieties or not. In the guidebook, therefore, the
information on the improved variety was not provided explicitly, but the name “K-85” is
mentioned in the guidebook. K-85 is planted in large commercial farms in Uganda
(Tilda Uganda Limited, Kibimba Rice Scheme) and is known as a high-yielding variety
for lowland ecosystems.
3.2.2. Lowland rice training project by JICA6
The JICA project was designed to build the capacity of the district agricultural officers
(extension workers) who are supposed to train farmers after the training. The field
6 See Kijima et al. (2012) for the further information on the JICA training project.
9
training was provided by the JICA experts and the extension workers to farmers at the
demonstration plots. The field trainings are offered four times at each site per
agricultural season: (1) the establishment of a demonstration plot including the
construction of water channels in the surrounding area, and leveling the main field (1-3
days); (2) the preparation of nursery beds and seedlings at the nursery beds (0.5 day); (3)
the methods of transplanting and weeding (0.5 day); and (4) the methods of harvesting
and threshing (0.5 day). The contents taught in each session were summarized so that the
trainees were able to remember the key points. In the training, the project did not involve
the construction of the modern irrigation facilities. Chemical fertilizers and other kinds
of chemicals were neither given to the training participants nor applied in the
demonstration plots. Rice seeds used in the demonstration plots were selected by the
JICA experts.
4. Descriptive statistics
4.1. Community information and prices in 2009 and 2011 (ES data)
Table 2 shows the input and output prices calculated from the community survey (ES
data). All figures are the nominal prices. As shown in columns (2) and (4), in half of the
sampled communities, rice was mainly sold as paddy rice (before milling) while in the
other LC1s, rice was sold after milling it. The milled rice price was 350 shillings higher
than the paddy rice price in 2009, while the difference increased by up to about 525
shillings in 2011. The rice price obtained by farmers during the harvesting season was
lower than that sold during the off-harvest season by 400 - 550 shillings. Thus, the
producer price of rice differs a lot by the form of rice sold and the timing of sales.

10
Compared with maize, the other storable staple food, output price of rice per kilogram is
two to four times higher.
The next sets of variables are the input prices. As shown in column 2, the
number of observations is small (especially for chemical fertilizer) since the farmers
rarely apply the agro-chemicals and they do not know the price. The relative prices of
urea and diammonium phosphate (DAP)to the rice do not seem so expensive when
compared with that of other SSA countries, because these prices are those charged by the
agro-dealers in Kampala (RATIN 2014). Therefore, the actual costs of using the
chemical fertilizer should be much higher.
Since agro-chemicals are rarely applied to rice production in Uganda, the labor
and the land are the most important inputs. Table 2 indicates the piece rate wage per acre
of rice plot, which is the cost of hiring labor to finish each task per acre of rice plot. This
measure is used because in most labor activities, the labor cost is paid per land size, not
per hour, and because the information on hours worked by hired labor tends to be
inaccurate since those who hire labor do not care how long it takes for the hired labor to
complete the assigned tasks. The labor cost per acre did not change much over time,
except for harvesting. This was applicable to the land rent as well. Thus, the output-input
price ratio for rice production did not change from 2009 to 2011.
4.2. Rice cultivation practices in 2009 and 2011 (ES data)
Table 3 indicates the changes in the rice cultivation practices in 2009 and 2011 (ES data).
The percentage of the households growing rice decreased from 67% to 54%. This is
likely to be due to the fact that some of the lowlands in the sample area suffered from the
drought or the floods in 2011. However, among those who grew rice, the area under rice
11
cultivation and the share of the rice area out of the total cultivated area did not change
over time. The average size of rice plots per household is 0.6 hectare, which accounts for
28% of the total cultivated land (including both upland and lowland plots). The total rice
production at household level slightly increased from 2009 to 2011 to just above 1 ton
per year
The sample households tend to have about nine years experience of rice
cultivation. The annual per capita income is about USD 250. The share of income earned
from crop production reached 75% and did not change over time, which means that
economically, the sample households depend heavily on crop production. The income
from rice production accounted for 17% of the total household income in 2009.
The bottom half of Table 3 shows the management characteristics of the sample
rice plots. The number of observations (rice plot level data) was quite different between
2009 and 2011 (573 and 394, respectively), even though the percentage of sampled plots
where rice was grown more than once within a year did not change much over time
(approximately 20%). This change is greater than that of the number of households
growing rice (from 368 to 302). This suggests that drought and floods in 2011 made
some plots too dry or too flooded to cultivate rice. Even those who grew rice in 2011
cultivated rice in fewer plots than in 2009.
Regarding the rice cultivation practices, the proportion of rice plots in which
bunding and leveling were being conducted increased over time. In contrast, the
adoption of the other cultivation practices (transplanting and transplanting in rows) and
the use of chemical fertilizer did not change over time. In terms of the productivity
measured by the quantity harvested per hectare, there was no significant change over
time (2.5 tons in 2009 and 2.3 tons in 2011). This seems puzzling since the improved

12
cultivation practices (i.e., constructing bunds and leveling) were more frequently
applied in 2011 without enhancing productivity.
4.3. Cultivation practice and rice yield in 2009 (CS data)
Table 4 shows the adoption rate of improved cultivation practices separately for each
sample village in the CS data. In Bugiri, an area that was covered by the JICA project, all
the recommended cultivation practices were adopted by most of the sample households.
In Mayuge, which is another JICA project village as well as Pallisa, the proper timing of
transplanting and transplanting in rows were not implemented on a large scale. In
Bukedea, the non-project village, the adoption rate of all the practices was as low as 10%
to 28%. The table also shows the rice yield separately according to the number of
improved cultivation practices adopted. It is clear that the average yield rises as more of
the improved practices were adopted by the farmers. In Bugiri, the average yield was 4.5
tons per hectare when four of the practices were adopted, while the yield was 2.3 tons
per hectare when only one practice was adopted. This significant difference in the rice
yield suggests that there is some complementarity between the improved cultivation
practices. In Mayuge, another JICA project village, a similar but less clear-cut
relationship can be observed. In contrast, there was no clear relationship between the
number of practices applied and the yield in the other two non-project villages.
Therefore, further detailed examination is needed in order to understand the relationship
between cultivation practices and the rice yield.
13
5. Methodology
5.1. Average treatment effect on the treated (ATT)
Can the cultivation guidebook provide a substitute for the field training to increase rice
production in Uganda? To investigate this question, the average treatment effect on the
treated (ATT) is estimated for 2 projects: the JICA training project and the distribution of
the guidebook. Propensity score matching method was applied to construct a
comparable control group. It is likely that the training participants were inherently
different from the non-participants (Winters et al. 2011). Since CS data is
non-experimental and cross-sectional data, the training participants and non-participants
may not be directly comparable7. Thus, it is necessary to construct an appropriate
counterfactual that has similar observable characteristics to those of the treated
households (i.e., the JICA training participants). The propensity score is the predicted
probability that a household has access to the treatment. The propensity scores are
estimated by a Probit model of training participation, where the household-level control
variables are the years of experience of rice cultivation, number of household members,
age and years of education of household heads, value of household assets, membership
in a local organizations; the plot-level variables are the size of the rice plot, the water
source, and the ownership of the rice plot; and the village level variables are the annual
rainfall amount and the traveling time to the nearest district town (Kijima et al. 2013).
Kernel matching is applied.
The effect of the distribution of the rice cultivation guidebook on the rice
production was analyzed by using the ES data in 2011 (after the distribution). Unlike the
7 As shown in Appendix Table 2, characteristics of the training participants and non-participants are
significantly different in CS sample.

14
JICA training, the beneficiaries of the guidebook distribution were randomly assigned,
which means that treatment and control groups are comparable. Actually, in Appendix
Table 1, where the household characteristics in 2009 are shown by the recipient status of
the cultivation guidebook, the characteristics of households and rice plots before the
distribution (2009) are not statistically different between the treatment and control
households. In order to make the results comparable with those for the JICA training, the
same methodology (ATT by using propensity score matching with the data collected
after the treatment) was applied to the impact evaluation of the guidebook distribution.
The descriptive statistics of the data after the treatment (2011) are provided separately
for the treatment and control groups in Appendix Table 3.8
These programs (the JICA training and the guidebook distribution) may have a
variety of effects on the rural households in Uganda. First, households who had not
previously grown rice may commence growing rice following the program.9 Second,
households who grew rice before the program might learn more about the proper
cultivation practices and apply them, resulting in higher productivity. While applying
better cultivation practices and commencing rice cultivation are likely to increase the
income from rice production, it is not clear whether the total household income and
expenditure also increase significantly as more resources may be allocated to rice
farming at the expense of other activities. Therefore, the effect of the program on
household welfare measured by per capita expenditure and income was also examined.
8 Given that the randomization is preferred to the matching method, the results of ATT without
matching are estimated and compared with the results with matching. 9 Regarding the decision to grow rice, the effect of JICA training cannot be estimated since all the
households selected grew rice at the time of the sampling.

15
5.2. Adoption of cultivation practices (CS)
The determinants of adopting designated cultivation practices are analyzed by IV Probit
model. The main question concerned whether the JICA training had increased the
probability of adoption of the cultivation practices or not. Participation in the JICA
training was expected to enhance the knowledge that was gained regarding improved
production practices and to increase adoption rates. Even without the training, some
farmers may have learned effective ways of growing rice based on their own experience,
which may lead to an increased adoption rate among more experienced farmers. Since
these practices require greater labor inputs, households may need to hire additional labor.
Thus, asset holdings may affect their adoption. These practices also can have
particularly significant impacts on rice production when water is available, and thus
their adoption is also likely to be affected by the availability of water. If the plot is rented,
the farmers may attempt to increase the net returns so as to at least recover the land rental
fee, which requires intensification such as the adoption of better cultivation practices.
In the regression analyses, a dependent variable takes unity if a new cultivation
practice (bunding, leveling, transplanting, or transplanting in rows) was adopted.
Explanatory variables at the household and plot level take the values before the
households made decisions on cultivation practices at each respective cropping season.
As explained before, the training variable is considered to be an endogenous variable.
Thus, the IV Probit model is applied. The instrumental variable for the JICA training
participation (precisely, the training participation is measured by the number of training
days participated) is the membership of farmers organizations unrelated with rice
farming.

16
5.3. Yield function (CS)
The yield is assumed to be determined by the household characteristics such as
participation in the JICA training, application of the recommended practices, rice
cultivation experience, asset holdings, and household composition as well as the plot
characteristics such as water availability and the security of tenure of the plot in the
respective cropping seasons. Given that training participation and application of the
improved cultivation practices are highly correlated, these variables are used in different
estimation models separately. As explained in the previous sub-section, the cultivation
practices are endogenous. The predicted adoption status of the cultivation practice,
instead of the actual adoption status, is used as the explanatory variable.
6. Results
6.1. Adoption of cultivation practices
The estimation results indicating the adoption of improved cultivation practices are
provided in Table 5, which shows the results for the adoption function of constructing
bunds, leveling, transplanting, and planting in rows in columns 2 to 5, respectively.
Since training participation is an endogenous variable, the instrumental variable
estimation model is applied where an instrumental variable for training participation is a
dummy variable of being a member of a local organization (other than the rice
association). The estimation result for the first stage analysis is in column 1. The
coefficient of the farmer group membership dummy is positive and significant.
The training participation (the number of JICA training days participated in) had
a significant and positive effect on the adoption of the improved cultivation practices

17
except the leveling (column 3). The more experienced farmers with rice cultivation
tended to adopt transplanting in rows more frequently. The younger household heads
tended to adopt leveling. Poor access to water10 had a negative effect on the adoption of
constructing bunds and leveling. A shorter distance to the demonstration plot increased
the probability of constructing bunds and transplanting in rows.
6.2. Effects of training and cultivation practices on rice yield
Table 6 shows the estimation results of the rice yield function. As shown in columns 1 to
4, all cultivation practices had positive impacts on rice yields. The marginal effect of
applying the cultivation practice on rice yield was approximately 0.26 tons per hectare.
Since the average rice yield was 2.5 tons per hectare, the marginal effect means that
applying the cultivation practice can increase the yield by 10% on average. However
the direct effect of the training participation on the rice yield is not significant (column
5). This seems to indicate that the JICA training participation has only indirect effects by
increasing the application rate of the cultivation practices, which turns out to be the
factor significantly enhancing rice yield.
Unexpectedly, previous rice cultivation experience did not increase the yield.
Recent migrant households tend to have a higher yield. The other household
characteristics also did not have a significant impact on rice yields. Among the plot
characteristics, the size of the plot is the only variable that is significant: Smaller plots
are associated with higher yields, probably due to better field leveling, water control and
good crop management.
10
Access to water is measured by a dummy indicating that the rice plot depends only on rainfall (compared with the plots with additional water sources such as canals or wells).

18
6.3. ATT
Table 7 shows the means of outcome variables separately for the treatment and control
groups as well as ATT.11 Columns 1 to 4 present the results of the JICA training, while
columns 5 to 8 are for the distribution of the rice cultivation guidebooks. Regarding the
effects on the decision to grow rice, neither the training nor the guidebook distribution
increased the area size under rice cultivation or the share of the area under rice over the
total cultivated land. Distribution of the guidebook was not sufficient to enhance the
probability of growing rice. This is likely because those who have never grown rice need
to obtain rice seeds as well as rice plots located in the lowlands suitable for rice
cultivation. Unlike upland rice cultivation, there appears to be entry barriers for lowland
rice cultivation. Unutilized wetlands tend to be customary land or communally owned.
When wetlands are used as communal grazing lands, permission from the local chief as
well as the community members is needed for converting the wetlands into rice fields,
which are managed individually. Therefore, it is plausible that both receiving the
guidebook and participating in the JICA training will not result in significant effects on
the area expansion of rice. This is also consistent with the fact that the training program
and the guidebook focus on the intensification rather than on the expansion of rice
cultivation areas.
The next set of outcome variables are related to the adoption of the improved
cultivation practices. The distribution of the guidebook increased the probability of
applying the transplanting in rows by 6 percentage points, while there was no effect on
the adoption of the other cultivation practices. The JICA training also increased the
probability of applying the transplanting in rows but the effect was much greater than
11
The results without matching for ES are provided in Appendix Table 4.

19
that of the distribution of the guidebook (22 percentage points vs. 6 percentage points).
Participation in the training had a positive and significant impact on the probability of
applying the chemical fertilizer (4 percentage points). A question therefore is why the
guidebook distribution program had a significant effect only on the adoption of the
transplanting in rows.. This may be because the transplanting in rows can be easily
observed and, hence, imitated and because in the guidebook, more than half of the pages
are used for explaining the methods and benefits of transplanting in rows.
Looking at the productivity and the income of rice production, this study found
that the JICA training increased the yield, while the distribution of the guidebook did not
have any effect on rice productivity. The impact of the training on the rice yield was not
negligible (0.45 ton per hectare). In contrast, participation in the training did not have
significant impacts on rice income. A possible explanation for the contrasting results of
the training participation is that transplanting in rows takes more time than direct
seeding and random transplanting, resulting in higher costs of hiring labor.
Even though the distribution of the guidebook increased the probability of
transplanting in rows, the program did not have a significant impact on the rice yield or
income. The question here is then why the JICA trainings had significant effects on the
yield, while the distribution of the guidebook did not. One possibility was the difference
in transplanting experience among the CS and ES sample households. Most of the
sample households in the CS applied transplanting, while transplanting was conducted
in only in about half of the rice plots of the ES, the. In order for the transplanting method
to enhance the rice yield, the timing (the age of seedlings) is critical. As pointed out in
the guidebook, however, farmers tend to transplant when the seedlings have already
grown too much, which affects the yield negatively. It is likely that those who received
guidebook might be less able to comprehend the essence of the transplanting method.
20
Similar arguments may be applied with regard to the adoption of other cultivation
practices.
The bottom part of Table 7 shows the results in terms of household welfare.
Neither the JICA training program nor the distribution of the guidebook increased per
capita household income or consumption expenditure significantly12. This is consistent
with the results that they did not increase the rice income or the area under rice
cultivation.
7. Conclusion
This paper provided an overview of rice sector development in Uganda and examined
the extent to which the JICA training and the distribution of the cultivation guidebook
had any impacts on the enhancement of rice production in this country. Unlike the
estimates from the other sources, rice production did not increase from 2009 to 2011
among the sample households in Eastern and Northern Uganda. This is likely because
there were wetlands that were severely affected by drought and floods in 2011. The
rainfed lowlands in the sample areas are vulnerable to floods and drought since it is
difficult for farmers to control the amount of water. It is important to note, however, that
72% of the sample households in the ES grew rice in 2010, which is 5 percentage points
higher than in 2009. Without the unfavorable weather shocks in 2011, the proportion of
households who grew rice would likely have been increased. Therefore, it may not be
necessary to draw adverse conclusions about the negative trend in rice production
witnessed from 2009 to 2011. Having noted this, the goal of doubling rice production in
10 years may prove difficult.
12 Income and expenditure are in natural logarithm form.
21
In Uganda, the area under rice cultivation rapidly increased prior to 2009, a fact
that was mainly explained by push factors such as the shortage of agricultural land for
upland crops (Kijima 2012). According to the ES in 2011, the main reasons why rice was
not grown in 2011 were the labor shortage (reported by 48% of households who did not
grow rice in 2011), the drought (13%), floods (14%), and the shortage of land suitable
for rice cultivation (6%). Thus, it may not be realistic to expect that rice production in
Uganda will continue to grow as rapidly as in the period prior to 2009.
As examined in Kikuchi et al. (2014), unless productivity is improved, rainfed
lowland rice production in Uganda cannot compete with imported rice. To enhance
productivity through improved cultivation practices, two programs (the JICA training
and the distribution of the rice cultivation guidebook) were implemented in the Eastern
and Northern Uganda. A comparable control group was constructed by the propensity
score matching method so as to overcome endogenous program placement and the
selection bias of program participation. The training program provided by the JICA
showed promising results, since it had a positive impact on the rice yield by 0.45 tons per
hectare. Even though the distribution of the guidebook enhanced the probability of
applying the transplanting in rows, there was no appreciable impact on the rice yield.
These results, therefore, suggest that distributing the guidebook alone cannot be a
substitute for conventional training programs. The guidebook distribution project should
be either abandoned or improved, e.g., by supplementing it by the use of mobile phones
to facilitate discussions between farmers and extension workers.
22
References
Aker, Jenny. 2011. Dial “A” for Agriculture: A Review of Information and Communication
Technologies for Agricultural Extension in Developing Countries. Agricultural Economics 42 (6): 631-47.
Anderson, Jock and Gershon Feder. 2007. Agricultural Extension. In Handbook of Agricultural Economics, ed. R.E. Evenson and P. Pingali, Vol. 3, 2343-78. Amsterdam: Elsevier.
Barrett, Christopher, Michael Carter, and Peter Timmer. 2010. A Century-Long Perspective on Agricultural Development. American Journal of Agricultural Economics 92 (2): 447-68.
Benson, Todd, Samuel Mugarura, and Kelly Wanda. 2008. Impacts in Uganda of Rising Global Food Prices: The Role of Diversified Staples and Limited Price Transmission. Agricultural Economics 39 (supplement): 513-24.
deGraft-Johnson, Millicent, Aya Suzuki, Takeshi Sakurai, and Keijiro Otsuka. 2014. On the Transferability of the Asian Rice Green Revolution to Rainfed Areas in Sub-Saharan Africa: An Assessment of Technology Intervention in Northern Ghana. Agricultural Economics 45 (1): 1-16.
Feder, Garshon, Richard Just, David Zilberman. 1985. Adoption of Agricultural Innovations in Developing Countries: A Survey. Economic Development and Cultural Change 33 (2): 255-98.
Kajisa, Kei, and Ellen Payongayong. 2011. Potential of and Constraints to the Rice Green Revolution in Mozambique: A Case Study of the Chokwe Irrigation Scheme. Food Policy 36 (5): 615-26.
Kijima, Yoko. 2012. Expansion of Lowland Rice Production and Constraints on a Rice Green Revolution: Evidence from Uganda. JICA-RI Working Paper 49. Tokyo, Japan: JICA Research Institute.
Kijima, Yoko, Yukinori Ito, and Keijiro Otsuka. 2012. Assessing the Impact of Training on Lowland Rice Productivity in an African Setting: Evidence from Uganda. World Development 40 (8): 1610-18.
Kijima, Yoko, Keijiro Otsuka, and Dick Sserunkuuma. 2008. Assessing the Impact of NERICA on Income and Poverty in Central and Western Uganda. Agricultural Economics 38 (3): 327-37.
———. 2011. An Inquiry into Constraints on a Green Revolution in Sub-Sahara Africa: The Case of NERICA Rice in Uganda. World Development 39 (1): 77-86.
Kikuchi, Masao, Godfrey Asea, Yusuke Haneishi, and Tatsushi Tsuboi. 2013a. Seven Questions on the History of Rice Cultivation in Uganda. Mimeo. An internal draft note of NaCRRI-JICA PRiDe Project. Tokyo: JICA.
Kikuchi, Masao, Kunihiro Tokida, Yusuke Haneishi, Natsuko Miyamoto, Tatsushi Tsuboi, and Godfrey Asea. 2013b. Rice in Uganda: Viewed from Various Market Channels. NaCRRI-JICA PRiDe Project. Tokyo: JICA. http://www.riceforafrica.org/new/images/stories/PDF/rice%20in%20uganda.pdf.
Kikuchi, Masao, Yoko Kijima, Yusuke Haneishi, and Tatsushi Tsuboi. 2014. A Brief Appraisal of Rice Production Statistics in Uganda. Tropical Agricultural Development 58 (2): 78-84.
MAAIF. 2009. Uganda National Rice Development Strategy (2nd draft). Entebbe, Uganda: Ministry of Agriculture, Animal Industry and Fisheries. http://www.jica.go.jp/english/our_work/thematic_issues/agricultural/pdf/uganda_en.pdf.
Nakano, Yuko, and Kei Kajisa. 2013. The Determinants of Technology Adoption: The Case of the Rice Sector in Tanzania. JICA-RI Working Paper 58. Tokyo, Japan: JICA Research Institute.
Otsuka, Keijiro and Donald Larson. 2013. An African Green Revolution: Finding Ways to Boost Productivity on Small Farms. Springer.

23
RATIN (Regional Agricultural Trade Intelligence Network). 2014. http://www.ratin.net/index.php/uganda.
UBOS. 2010. Uganda Census of Agriculture 2008/2009. Vol. I, Summary Report. Kampala, Uganda: Bureau of Statistics.
Winters, Paul, Alessandro Maffioli, and Lina Salazar. 2011. Introduction to the Special Feature: Evaluating the Impact of Agricultural Projects in Developing Countries. Journal of Agricultural Economics 62 (2): 393–402.

24
Figure 1. Location of sampled households
Panel A: Extensive Study
Panel B: Case Study
Note: Plots were measured from GPS coordinates of the location of sampled households.
Bugiri
Mayuge
Bukedea
Pallisa
B t l j
Lira
Dokolo
K li
K i
25
Table 1. Trends and differences by region in rice production in Uganda
Total area under
rice cultivation 2008/9a
Rice production
2008b
Rice production
2011c
Upland rice,
2011 c
(ha)
Share
out of
total area
(1000
tons,
milled rice)
Share out
of total production
(1000
tons,
milled rice)
Share out
of total production
(1000
tons,
milled rice)
Share
of
upland rice
(1) (2) (3) (4) (5) (6) (7) (8)
North 25913 0.34 13 0.11 45 0.20 24 0.53 East 36343 0.48 84 0.69 133 0.57 13 0.10
Central 2638 0.04 5 0.04 12 0.05 9.1 0.76
Southwest 1397 0.02 4 0.03 5 0.02 5 1.00 West 9106 0.12 16 0.13 37 0.16 36 0.97
Total 75397 1.00 122 1.00 232 1.00 87.1 0.38 a Rice Census cited in Kikuchi et al. (2013b), b Kikuchi et al (2014), c Kikuchi et al (2013b)

26
Table 2. Median prices of paddy and purchased inputs, wage rates, and land rents (LC1 Survey, ES)
2009 2011
Median # obs Median #obs (1) (2) (3) (4)
Producer price
Paddy rice (harvesting season) (USh/kg) 750 29 1100 29 Paddy rice (off-harvesting season) (USh/kg) 1150 29 1650 29
Milled rice (harvesting season) (USh/kg) 1100 29 1625 30
Milled rice (off-harvesting season) (USh/kg) 1500 29 2600 30 Maize (harvesting season) (USh/kg) 300 57 300 55
Maize (off-harvesting season) (USh/kg) 500 57 900 55
Input price UREA (USh/kg) 2000 4 4000 9
DAP (USh/kg) 3000 3 3000 7
Pesticide (1,000 Ush/liter) 16.0 27 24.0 31 Fungicide (1,000 Ush/liter) 20.0 12 20.0 14
Herbicide (1,000 Ush/liter) 21.0 5 25.0 12
Wage rate Wage for rice production (1,000 Ush/acre) - all 55.5 56 60.0 45
Wage for rice production (1,000Ush/acre) - harvesting 35.0 28 60.0 21
Wage for rice production (1,000 Ush/acre) – weeding 60.0 44 60.0 40 Wage for rice production (1,000 Ush/acre) - ploughing 50.0 45 60.0 40
Land
% of HHs rented in land via fixed rent in upland areas 27.3 57 37.7 60 % of HHs rented in land via fixed rent in lowland areas 30.8 58 31.6 59
Land rent (1,000 USh, 1 season, 1 acre) – upland areas 50.0 50 55.0 51
Land rent (1,000 USh, 1 season, 1 acre) – lowland areas 100.0 43 100.0 41

27
Table 3. Rice cultivation and income at household and plot levels in 2009 and 2011 (ES)
2009 2011
Household level Number of households 564 564
% of households who grew rice 66.5 54.1
Rice cultivated area (ha) (among growers) 0.598 0.581 Share of rice area over cultivated land 0.283 0.275
Total rice production (household level) (tons) 0.82 1.19
Share of rice income over total household income 0.176 0.135 * Share of crop income over total household income 0.750 0.751
Rice cultivation experience (years) 8.32 9.83 *
Per capita income (USD) 255 251
Rice plot level
Number of observations (lowland rice plots x cultivation times in a year) 573 394 Number of rice plots 454 332
Number of plots where rice was grown more than once within a year 113 57
(% of plots under double cropping) (20.8) (18.3) Number of households growing rice in 1 plot and once a year 227 232
Number of households with rice plot sample 368 302
% of plots with: Bunding 57.8 70.6 *
Leveling 60.7 75.4 *
Transplanting 59.3 56.3 Transplanting in rows 9.8 5.6
Improved seeds 9.4 9.1
% of plots where chemical fertilizer was applied 6.8 4.3 Yield (tons/ha) 2.53 2.28
% of rice plots with hired labor 73.4 72.5 On land preparation 49.5 49.6
On sowing 36.0 37.8
On weeding 35.5 37.0 On bird scaring 22.6 21.4
On harvesting 47.2 39.5
On post-harvest 34.3 38.3
*indicates that means over time (2009 and 2011) are statistically different at 5% level.

28
Table 4. Adoption of cultivation practices and rice yield by sample villages (CS)
All Bugiri Mayuge Bukedea Pallisa Cultivation practice Adoption % Bunding 83.8 100.0 95.2 24.1 81.5 Leveling 69.7 83.3 84.1 27.6 48.1 Transplanting 75.1 100.0 71.4 10.3 92.6 Proper timing of transplanting 43.8 69.7 39.7 10.3 25.9 Transplanting in rows 33.0 81.8 4.8 10.3 3.7
Number of cultivation practices applied c Yield (ton/ha) 4 practices 4.13 4.47 2.89 1.22 0.37 (3.14) (3.20) (1.83) (0.74) ---- a 3 practices 3.20 4.15 1.89 --- 1.54 (2.78) (3.17) (1.31) --- (1.14) 2 practices 2.25 3.07 2.00 3.95 2.26 (1.75) (3.44) (1.44) (1.40) (1.09) 1 practice 1.81 2.30 1.91 1.89 1.38 (1.43) (0.80) (1.13) (1.87) (1.23) 0 practice 1.33 --- 0.79 1.42 0.66 (1.99) --- ---a (2.10) (0.56) b a Only 1 observation. b Only 3 observations. c4 practices = bunding, leveling, proper timing of transplanting, transplanting in rows. 3 practices = among the 4 practices, 3 of the practices were implemented.

29
Table 5. Estimation results on adoption function of improved cultivation practices (CS)
Num. of
days of
training
Bunds Leveling Trans
planting
Trans
planting
in rows
OLS IV Probit IV
Probit
IV Probit IV Probit
(1) (2) (3) (4) (5) Number of days of JICA training $ 0.691 -0.014 0.287 0.257 (2.53)* (0.17) (1.80)+ (2.37)* Household head’s age -0.035 -0.028 -0.023 -0.016 0.013 (2.02)* (1.03) (2.26)* (1.24) (0.80)
Household head’s years of schooling 0.060 0.076 -0.011 0.026 0.024 (1.10) (1.17) (0.37) (0.50) (0.47) Female-headed household 0.536 0.139 0.000 -0.410 0.000 (0.48) (0.10) (0.00) (0.63) (0.000) Rice cultivation experience (years) -0.237 0.552 0.148 0.476 0.997 (0.61) (1.05) (0.72) (1.40) (2.28)* Moved to this area after 2000 dummy 0.013 0.060 0.013 0.026 0.009 (0.46) (1.44) (0.84) (0.93) (0.36) Land owned (ha)/number of adult family -0.817 -1.291 0.024 0.368 -0.558 members (aged 15-64) (1.65) (1.90) (0.09) (0.88) (1.25) Initial assets (household, agricultural, livestock) 0.218 0.409 0.140 0.178 -0.585 (thousand USD) (0.80) (1.10) (1.00) (0.73) (1.49) Water source: depending solely on rainfall -0.149 -1.710 -0.582 -0.635 -0.594 (0.28) (2.50)* (2.10)* (1.58) (1.11) Plot is rented 0.510 1.549 0.286 -0.233 0.098 (1.25) (2.27)* (1.23) (0.64) (0.26) Size of the plot (ha) -0.043 1.252 0.023 0.368 -1.676 (0.04) (0.84) (0.04) (0.45) (1.62) Plot is under a customary tenure system -0.089 0.410 0.735 -0.420 1.060
(0.09) (0.60) (1.33) (0.62) (0.83)
Distance to demonstlation plot (km) -0.407 -1.919 -0.159 0.429 -1.873
(1.15) (3.02)** (0.75) (1.52) (3.69)**
Farmers association member (non-rice) 3.415
(7.01)**
District dummies Yes Yes Yes Yes Yes
Planting month dummies Yes Yes Yes Yes Yes
Observations 252 252 252 252 252
R-squared 0.51
Log likelihood -632.4 -711.6 -291.9 -629.2
Prob > Chi-squared 0.044 0.001 0.001 0.001
**, *, and + indicate significance at 1%, 5%, and 10%, respectively.
Column (2) to (5) show the marginal effects (dF/dX) $ Endogenous variable whose IV is a dummy variable of being a member of a local organization
(other than rice association).

30
Table 6. Yield function (ton/ha) (CS) (2SLS)
(1) (2) (3) (4) (5) Bunds =1a 0.265
(4.04)** Leveling =1 a 0.261
(2.69)**
Transplanting =1 a 0.700 (4.32)**
Transplanting in rows =1 a 0.261 (2.69)** Number of days of JICA training $ -0.097 (0.95) Household head’s age -0.012 -0.014 0.006 -0.014 -0.014 (0.93) (1.06) (0.45) (1.06) (0.97) Household head’s years of schooling -0.004 -0.030 -0.045 -0.030 -0.007 (0.09) (0.70) (1.06) (0.70) (0.17) Female-headed household -0.609 -0.403 -0.305 -0.403 -0.645 (0.71) (0.46) (0.36) (0.46) (0.74) Rice cultivation experience (years) 0.361 0.040 -0.099 0.040 0.177 (1.21) (0.13) (0.32) (0.13) (0.59) Moved to this area after 2000 dummy 0.054 0.031 0.017 0.031 0.047 (2.47)* (1.42) (0.76) (1.42) (2.07)*Land owned (ha)/number of adult 0.105 0.437 0.170 0.437 0.375 family members (aged 15-64) (0.27) (1.12) (0.45) (1.12) (0.96) Initial assets (household, agricultural, 0.185 0.367 -0.008 0.367 0.190 livestock) (thousand USD) (0.88) (1.62) (0.04) (1.62) (0.91) Water source: dependent solely on rainfall
-0.455 0.043 0.441 0.043 0.070
(1.10) (0.10) (1.04) (0.10) (0.17) Plot is rented -0.117 -0.487 -0.380 -0.487 -0.326 (0.36) (1.51) (1.21) (1.51) (0.98) Size of the plot (ha) -3.788 -3.766 -4.365 -3.766 -4.309 (4.52)** (4.35)** (5.28)** (4.35)** (5.08)**Plot is under a customary tenure -0.534 -0.551 -0.266 -0.551 -0.210 System (0.69) (0.70) (0.34) (0.70) (0.30) District dummies Yes Yes Yes Yes Yes Planting month dummies Yes Yes Yes Yes Yes Observations 268 268 268 268 268 R-squared 0.38 0.36 0.39 0.36 0.28 The numbers shown are estimated coefficients and the t-statistics are in parentheses.
+ significant at 10%; * significant at 5%; ** significant at 1%,
a Predicted value of adoption of each cultivation practice by IV probit model shown in Table 5. $ Endogenous variable whose IV is a dummy variable of being a member of a local organization
(other than rice association).

31
Table 7. Average treatment effects of the distribution of rice cultivation guidebook and the JICA training participation(Kernel matching method, ES 2011)
ES 2011 CS 2009
Treatment (Recipient)
Control (Non-recipient)
ATT s.e. a Treatment (Participants)
Control (Non-participant)
ATT s.e.a
Plot level (1) (2) (3) (4) (5) (6) (7) (8)
Adoption of cultivation practice
Bunding 0.741 0.674 0.067 0.058 0.974 0.992 -0.018 0.016
Leveling 0.793 0.725 0.068 0.054 0.838 0.778 0.059 0.088
Transplanting 0.565 0.542 0.023 0.050 0.923 0.971 -0.048 0.055 Transplanting in rows 0.088 0.021 0.067 0.023** 0.718 0.496 0.222 0.119+
Improved variety (k-series) 0.104 0.064 0.040 0.036 0.829 0.907 -0.078 0.083
Chemical fertilizer use 0.052 0.052 -0.000 0.029 0.043 0.000 0.043 0.024+ Yield (ton/ha) 2.23 2.30 -0.067 0.187 3.673 3.221 0.452 0.221+
Rice income (USD/ha) 6.306 6.348 -0.042 0.135 6.865 6.641 0.224 0.581
Household level
Growing rice (dummy) 0.548 0.541 0.007 0.036 --- --- --- ---
Area under rice (ha) 0.512 0.295 0.217 0.177 0.385 0.446 -0.060 0.096 Share of area under rice over cultivated land 0.153 0.147 0.006 0.014 0.272 0.282 -0.009 0.060
ln (per capita income) 4.730 4.846 -0.115 0.102 4.804 4.596 0.207 0.310
ln (per capita expenditure) 5.366 5.390 -0.024 0.043 5.476 5.433 0.043 0.137 a Bootstrapped standard errors. **, *, and + indicate significance at 1%, 5%, and 10%, respectively.
32
Appendix Table 1. Household characteristics before the distribution of the cultivation guide book (2009 ES data) Received
guidebook
Not received Diff in
meansc
(Treatment) (Control)
means (s.d.) means (s.d.)
Household characteristics Number of household members 8.00 (3.50) 7.95 (3.82)
Share of male members aged 15-64 0.245 (0.137) 0.238 (0.141)
Share of female members aged 15-64 0.348 (0.120) 0.235 (0.124) Female headed household dummy 0.093 (0.295) 0.078 (0.269)
Head’s age 44.8 (13.47) 45.1 (13.96)
Head’s years of schooling completed 6.21 (3.52) 5.72 (3.30) Land owned (ha) 1.96 (2.33) 1.71 (1.83)
Ownership of bull (dummy variable) 0.291 (0.455) 0.344 (0.476)
Rice cultivation experience (years) 8.840 (10.24) 7.801 (8.854) % of households who grew rice 65.2 (47.7) 67.7 (46.8)
Rice cultivated area (ha) 0.604 (0.700) 0.592 (0.700)
Share of rice area (out of cultivated land) 0.184 (0.198) 0.194 (0.202) Per capita income (USD) 187.5 (216.6) 201.0 (232.3)
Per capita expenditure (USD) 285.3 (223.1) 257.9 (154.8)
Share of crop income 0.738 (0.258) 0.775 (0.261)
Share of livestock income 0.106 (0.167) 0.082 (0.150)
Share of non-farm income 0.098 (0.194) 0.095 (0.216) Share of non-labor income 0.058 (0.110) 0.048 (0.113)
Share of rice income 0.182 (0.254) 0.170 (0.226)
Plot characteristics
Share of rice plots with
Bunding 0.564 (0.497) 0.592 (0.492) Leveling 0.632 (0.483) 0.581 (0.494)
Transplanting 0.588 (0.493) 0.599 (0.491)
Line planting 0.139 (0.346) 0.054 (0.227) Improved variety (k-series) 0.091 (0.288) 0.097 (0.297)
Fertilizer use 0.084 (0.279) 0.051 (0.219)
Rice yield (ton/ha) 2.569 (1.623) 2.420 (1.742) Income from rice (USD/ha) 634.9 (507.4) 713.1 (848.5)
Walking time from homestead to rice plot (mins) 35.64 (35.47) 32.29 (32.91)
Plot size (ha) 0.705 (0.666) 0.730 (0.818) Plot tenure: owner a 0.520 (0.500) 0.455 (0.499)
Plot tenure: tenant a 0.291 (0.455) 0.310 (0.464)
For all variables, the means of 2 groups are not statistically different at 5% level. a Reference group
is occupant. b Survey covers activities during the last 12 months (March 2008 to February 2009) and “initial livestock” means the livestock holding in the 12 months prior to the data collection
(March 2008). c * indicates that mean between treatment and control groups is significantly
different at 5% level.

33
Appendix Table 2. Household characteristics by training participation (2009 CS data, before matching) Training
participants
Non-
participant
Diff in
meansc (Treatment) (Control)
means (s.d.) means (s.d.)
Number of observations 82 218
Household characteristics
Number of household members 6.743 (2.956) 7.830 (3.735) * Share of male members aged 15-64 0.283 (0.231) 0.242 (0.149) *
Share of female members aged 15-64 0.264 (0.151) 0.246 (0.135)
Female headed household dummy 0.024 (0.155) 0.064 (0.246) Head’s age 39.90 (11.54) 40.77 (13.33)
Head’s years of schooling completed 5.829 (3.150) 5.791 (3.927)
Land owned (ha) 0.836 (1.501) 1.670 (1.615) * Ownership of bull (dummy variable) 0.073 (0.262) 0.358 (0.480) *
Rice cultivation experience (years) 8.122 (6.743) 9.151 (8.795)
Rice cultivated area (ha) 0.385 (0.413) 0.395 (0.304)
Share of rice area (out of cultivated land) 0.272 (0.219) 0.201 (0.184) *
Per capita income (USD) 169.4 (150.2) 137.4 (137.6) Per capita expenditure (USD) 264.7 (127.5) 280.2 (155.8)
Share of agricultural income 0.689 (0.322) 0.549 (0.296) *
Share of livestock income 0.061 (0.131) 0.176 (0.223) * Share of non-farm income 0.209 (0.314) 0.242 (0.283)
Share of non-labor income 0.049 (0.129) 0.052 (0.111)
Plot characteristics
Share of rice plots with
Bunding 0.974 (0.159) 0.719 (0.451) * Leveling 0.838 (0.370) 0.595 (0.493) *
Transplanting 0.923 (0.268) 0.634 (0.483) *
Line planting 0.718 (0.452) 0.124 (0.331) * Improved variety (k-series) 0.829 (0.378) 0.490 (0.502) *
Fertilizer use 0.043 (0.203) 0.007 (0.081) *
Rice yield (ton/ha) 3.05 (2.03) 2.11 (1.89) * Income from rice (USD/ha) 1327.3 (1327.5) 905.09 (1496.6) *
Distance from homestead to rice plot (km) 0.718 (0.452) 0.124 (0.331) * Plot size (ha) 0.215 (0.168) 0.297 (0.206) *
Plot tenure: owner a 0.308 (0.464) 0.556 (0.499) *
Plot tenure: tenant a 0.641 (0.482) 0.386 (0.488) *
* indicates the means of 2 groups are statistically different at 5% level. a Reference group is occupant. b Survey covers activities during the last 12 months (September 2008-August 2009) and
“initial livestock” means the livestock holding in the 12 months prior to the data collection
(September 2008). cMean between treatment and control groups is significantly different at 5% level.

34
Appendix Table 3. Rice cultivation by recipient status of guide book (2011)
Received guidebook
(treatment)
Not received
(control)
Diff in
meansa
Mean s.d. Mean s.d.
Household level Number of households 288 282
% of households who grew rice 0.550 0.498 0.532 0.500
Rice cultivated area (ha) 0.332 0.601 0.295 0.477 Rice cultivated area (ha) (among growers) 0.607 0.702 0.554 0.533
Share of rice area (out of cultivated land) 0.154 0.196 0.146 0.187 Share of rice area (among rice growers) 0.280 0.185 0.275 0.173 Income from rice (USD/ha)# 731.8 (825.0) 713.1 (872.8)
Per capita income (USD) # 209.7 (234.9) 201.0 (180.5)
Per capita expenditure (USD) # 263.8 (206.2) 257.9 (259.4)
Share of crop income 0.760 (0.242) 0.775 (0.267)
Share of livestock income 0.133 (0.184) 0.082 (0.216) Share of non-farm income 0.059 (0.153) 0.095 (0.141)
Share of non-labor income 0.048 (0.109) 0.048 (0.107)
Share of rice income 0.135 (0.214) 0.136 (0.208)
Number of lowland rice plots 206 188
% of plots with: Bunding 73.8 (44.1) 67.0 (47.1)
Leveling 76.7 (42.4) 74.6 (43.7)
Transplanting 57.8 (49.5) 54.6 (49.9) Transplanting in rows 9.22 (29.0) 1.62 (12.7) *
Improved seeds 12.1 (32.7) 5.41 (22.7) *
Fertilizer use 6.80 (25.2) 1.62 (12.7) * Yield (ton/ha) 2.23 (1.57) 2.35 (1.75)
ln(Rice income USD/ha) # 6.26 (1.26) 6.36 (1.14) a * indicates that mean between treatment and control groups is significantly different at 5% level. # Deflated into 2009 price level.

35
Appendix Table 4. ATT without matching (ES 2011)
Treatment
(Recipient)
Control
(Non-recipient)
ATT s.e. a
Plot level (1) (2) (3) (4) Adoption of cultivation practice
Bunding 0.738 0.670 0.068 0.046
Leveling 0.767 0.746 0.021 0.044 Transplanting 0.578 0.546 0.032 0.050
Transplanting in rows 0.092 0.016 0.076 0.023**
Improved variety (k-series) 0.121 0.054 0.067 0.029* Chemical fertilizer use 0.068 0.016 0.052 0.021*
Yield (ton/ha) 2.23 2.35 0.12 0.17
Ln(Rice income (USD/ha)) 6.256 6.357 0.101 0.130
Household level
Growing rice (dummy) 0.512 0.295 0.217 0.185 Area under rice (ha) 0.550 0.532 0.018 0.042
Share of area under rice over
cultivated land
0.154 0.146 0.008 0.016
ln(per capita income) 4.728 4.857 0.129 0.092
ln(per capita expenditure) 5.365 5.370 0.004 0.049
**, *, and + indicate significance at 1%, 5%, and 10%, respectively.

36
Abstract (in Japanese)
要約
本稿の目的はコメの増産を目的にウガンダ東部と北部で実施された2つの技術普及プロ
グラムの評価を行うことである。第 1のプログラムはJICAが実施した従来型のトレ
ーニングプログラム、第 2のプログラムは稲作栽培に関するガイドブックを配布するも
のである。プログラム評価のために Propensity score matching によりプログラムの恩
恵を受けた家計と比較可能な家計をコントロールグループとして選別し、両グループの
コメの生産性や栽培技術の普及率の平均値が有意に異なるかを検定する。推定結果によ
ると、トレーニングに参加した家計はコメの生産性が改善したが、ガイドブックを受け
とった家計については、生産性の上昇も栽培方法の改善もみられなかった。ガイドブッ
クの配布は従来型のトレーニングプログラムよりも安価でかつ実施が容易であるが、従
来型のトレーニングプログラムを代替することはできないことを示唆している。

37
Working Papers from the same research project
“An Empirical Analysis of Expanding Rice Production in Sub-Sahara Africa”
JICA-RI Working Paper No. 25
On the Possibility of a Lowland Rice Green Revolution in Sub-Saharan Africa:
Evidence from the Sustainable Irrigated Agricultural Development (SIAD) Project in
Eastern Uganda
Yoko Kijima, Yukinori Ito, and Keijiro Otsuka
JICA-RI Working Paper No. 49
Expansion of Lowland Rice Production and Constraints on a Rice Green Revolution:
Evidence from Uganda
Yoko Kijima
JICA-RI Working Paper No. 58
The Determinants of Technology Adoption: A Case of the Rice Sector in Tanzania
Yuko Nakano and Kei Kajisa
JICA-RI Working Paper No. 61
Extensification and Intensification Process of Rainfed Lowland Rice Farming in
Mozambique
Kei Kajisa and Ellen Payongayong
JICA-RI Working Paper No. 71
To What Extent Does the Adoption of Modern Variety Increase Productivity and Income?
A Case Study of the Rice Sector in Tanzania
Yuko Nakano and Kei Kajisa


![Role of Mobile Money services - Bank of Uganda - bou.or.ug · 1 THE ROLE OF MOBILE MONEY SERVICES IN ENHANCING FINANCIAL INCLUSION IN UGANDA [1] George Wilson SSONKO [2] ABSTRACT](https://img.dokumen.tips/doc/110x75/5ac15ae77f8b9a1c768cb63a/role-of-mobile-money-services-bank-of-uganda-bouorug-the-role-of-mobile-money.jpg)