Embed Size (px)
Citation preview

Enhancing China’s RegulatoryFramework for Eco-Industrial Parks
Comparative Analysis of Chineseand International Green Standards
Pub
lic D
iscl
osur
e A
utho
rized
Pub
lic D
iscl
osur
e A
utho
rized
Pub
lic D
iscl
osur
e A
utho
rized
Pub
lic D
iscl
osur
e A
utho
rized

Enhancing China’s RegulatoryFramework for Eco-Industrial Parks
Comparative Analysis of Chineseand International Green Standards
April 2019
The World Bank

Table of Contents
Acknowledgments...............................................................................................................................Acronyms.............................................................................................................................................Executive Summary............................................................................................................................1. Introduction..................................................................................................................................... 1.1 Project background and context................................................................................................ 1.2 Scope of the report.....................................................................................................................2. Green Industrial Parks in China: History, Development, and Regulatory Framework.......... 2.1 From industrial parks to eco-industrial parks........................................................................... 2.2 Regulatory framework of IP management and EIP promotion in China.................................. 2.3 The “Green Triangle” of Chinese EIP standards....................................................................... 2.4 Evaluation of the Chinese EIP standards...................................................................................3. Comparative Analysis of the Chinese and International EIP Frameworks............................... 3.1 Park management: “General vs. specific” and “implicit vs. explicit” requirements................ 3.2 Environmental performance: “Result-based” vs. “process-based” assessment........................ 3.3 Social performance: “Implicit vs. explicit” and “moral standards vs. legal requirements”...... 3.4 Economic performance: “Economic standards vs. socioeconomic standards”.........................4. Application of the EIP Framework in the Fuzhou High-Tech Zone........................................... 4.1 Overview of FHTZ..................................................................................................................... 4.2 Compliance barriers...................................................................................................................5. Fiscal and financial instruments to promote and develop EIPs.................................................. 5.1 Evaluation of the incentive frameworks of the Chinese EIP standards.................................... 5.2 Green finance for the green transformation and development of IPs in China........................6. Conclusions and Policy Recommendations...................................................................................Appendixes........................................................................................................................................... Appendix A. Regulatory framework of IP management and EIP promotion in China................... Appendix B. Standard for National Demonstration EIPs (MEE)................................................... Appendix C. Basic requirements and performance indicators of applying for circular economy transformation demonstration IPs (NDRC and MOF)............................... Appendix D. Requirements/Qualifications of Green IPs (MIIT).................................................... Appendix E. Comparison of “China Green Triangle” against the EIP Framework........................ Appendix F. Self-assessment by Fuzhou High-tech Zone against the EIP Framework.................. Appendix G. Financial instrument/policies promoting the development of EIPs in China............ Appendix H. Comparison between the Chinese EIP standards...................................................... Appendix I. An overview of the WBG/UNIDO/GIZ International Framework for EIPs............... Appendix J. Examples of potential incentives for complying with EIP standards.........................
viiviii
177
111313141720252627282831313341414449535361
6568718295
101102104

References............................................................................................................................................Figures Figure 2.1 General managerial and operational structure of Chinese EIPs.................................... Figure 2.2 Number of “green-certified” IPs in China regulated by MEE, MIIT, and NRDC........ Figure 2.3 Summary of the indicator comparison.......................................................................... Figure 3.1 Comparison between the Chinese green standards and the EIP Framework................ Figure I.1 Core EIP categories and topics...................................................................................... Figure J.1 Potential incentives for complying with EIP standards.................................................
Tables Table ES1. Improvement in environmental performance of eco-/green and circular economy demonstration pilot parks in China, 2011−15................................................................ Table ES2. Number and proportion of certified EIPs in China....................................................... Table 2.1 Number and proportion of “green-certified” IPs in China.............................................. Table 2.2 Environmental performance improvement of EIPs and circular economy demonstration pilot parks in China, 2011-15................................................................. Table 3.1 Summary of the comparative analysis between the EIP Framework and Chinese standards......................................................................................................................... Table 4.1 Summary of FHTZ’s 2018 self-assessment against the EIP Framework....................... Table C.1 Performance indicators................................................................................................... Table D.1 Green IP Indicator System.............................................................................................. Table E.1 A detailed comparison of the three Chinese IP green standards..................................... Table E.2 A detailed comparison between the Chinese standards and the EIP Framework...........
Boxes Box 1.1 Leading international EIP examples.................................................................................. Box 2.1 China’s regulatory frameworks on monitoring and evaluation of EIP standards.............. Box 4.1 Summary of FHTZ’s self-assessment against the MIIT Framework................................ Box 4.2 Performance monitoring and data collection systems for EIPs......................................... Box 4.3 Environmental management systems and ISO 14000 standards for IEs........................... Box 4.4 Fostering industrial symbiosis through regional networks................................................ Box 6.1 Example of a tiered EIP certification system..................................................................... Box J.1 Influence of foreign investment on environmental awareness...........................................
107
14222325
102104
22
21
22
293266687179
9193233363850
105
This report was prepared by a team led by Marcin Piatkowski (Senior Economist, World Bank) and comprising Antoine Coste (Economist, World Bank), Lei Shi, Yufan Du, and Zezhou Cai (Consultants). The report benefit-ted from valuable comments from Barjor Mehta, Wanli Fang, Douglas Zeng, Sinem Demir, and Etienne Kechi-chian. It was written under the overall guidance of Jennifer Isern and Irina Astrakhan.
Acknowledgments
vii
Acronyms
CBRCCDBCIRCCNISCSRCEIAEIPEMSEnMSFHTZGHGGIZIAVIPISOMOCM&EMEEMEPMIITMOFMOSTNDRCNPCOH&S PBoCPPPRMBSMEsTEDAUNIDO
China Banking Regulatory CommissionChina Development BankChina Insurance Regulatory CommissionChina National Institute of StandardizationChina Securities Regulatory Commissionenvironmental impact assessmenteco-industrial parkenvironment management systemenergy management systemFuzhou High-Tech Zonegreenhouse gasDeutsche Gesellschaft für Internationale Zusammenarbeitindustrial added value industrial parkInternational Organization for StandardizationMinistry of Commerce monitoring and evaluationMinistry of Ecology and Environment Ministry of Environment ProtectionMinistry of Industry and Information Technology Ministry of Finance Ministry of Science and TechnologyNational Development and Reform Commission National People’s Congress Occupational Health and SafetyPeople’s Bank of Chinapublic-private partnershiprenminbi (Chinese currency unit)small and medium enterprisesTianjin Economic-Technological Development AreaUnited Nations Industrial Development Organization
viii

1 China’s GDP per capita increased from US$308 (in constant 2010 US dollars) in 1978 to US$7,329 in 2017, according to the World Bank’s World Development Indicators (WDI) database. In 2018, it likely reached around US$7800, or almost 26 times more than in 1978. 2 Sheng Tai Wen Ming (生态文明) in Chinese. 3 The State Council of the People’s Republic of China (2016a). 4 President Xi Jinping (2017).5 The State Council of the People’s Republic of China (2016a).6 National Bureau of Statistics of the People’s Republic of China (2018). 7 China Environment News (2015). 8 An industrial park (IP), also commonly called an industrial estate or zone, can be defined as “a tract of land developed and subdivided into plots according to a comprehensive plan with or without built-up factories, sometimes with common facilities for the use of a group of industries” (UNIDO 1997). IPs are generally characterized by a geographically delimited area, usually physically secured, above-average infrastructure for the country, and a single management entity or adminis-tration. They may offer certain other benefits based on physical location within the zone, such as streamlined business regulations and procedures. In the case of Special Economic Zones (SEZs), they may also form a separate customs area, distinct from the national customs area (duty-free benefits). In China, this may correspond to different types of develop-ments, including SEZs, economic and technological development zones (ETDZs), free trade zones (FTZs), export-process-ing zones (EPZs), and high-tech industrial development zones (HIDZs). (Zeng 2011).
China has impressed the world with its rapid economic growth over the past four decades, during which time it has increased its real income per capita by more than 25 times. 1 However, the attendant environmental costs have also been significant, jeopardizing economic and social gains from growth. To move toward sustainable development and reduce the environmental impact of further economic growth, the Chinese government has started to prioritize green development and the building of an “ecological civilization.” 2 China’s 13th Five-Year Plan (2016−2020) has upgraded the building of the “ecological civilization” to the level of “national strate-gy”—a policy target of top priority. During the 19th National Congress of the Communist Party of China in October 2017, President Xi Jinping emphasized that “energy conservation and environmental protection are fundamental national strategies” and “lucid waters and lush mountains are invaluable assets.” President Xi called for enhanced efforts to “continue the ‘Beautiful China’ initiative to create good working and living environments for our people and play our part in ensuring global ecological security.” 4 Prime Minister Li Keqiang also noted that “the level of ecological civilization should be progressively upgraded to promote green development and achieve a co-development of economic prosperity and environmental protection.”5 The sustainable transition of the Chinese industrial sector is a key factor that will determine the success of the “ecological civilization.” The industrial sector is one of the largest contributors to the country’s economy (40.5 percent of national GDP in 2017), 6 but also to the overall environmental pollution (approximately 70 percent of total environmental pollution in 2015).7 According to the Ministry of Ecology and Environment (MEE), industrial parks (IPs) 8 are the key source of industrial production and “all new industrial projects are required to be operated within industrial parks” (Zhang 2018). The growing concentration of industrial activities within IPs suggests that an increasing proportion of industrial pollution will be produced in IPs. Thus, promoting green development of IPs will be vital for the achievement of China’s and the world’s sustainable development goals.
Effective management of IPs toward green development requires a well-functioning regulatory framework to provide standards, requirements, guidelines, and robust monitoring and evaluation (M&E) frameworks. Although China does not have a specific IP management law, a comprehensive regulatory framework is in place, covering different legislative levels including (from top to bottom in terms of their importance) laws, regulations, national policies, and standards and indicators. This regulatory framework covers multiple aspects of IP management, including requirements concerning the economic and environmental performances of IPs.
Executive Summary
1
However, higher-level regulations (law > regulation > policy > standards and indicators) tend to be less specific in managing and promoting the green development and transformation of IPs: they do not target IPs when it comes to managing industrial activities, most of which focus on either a broader scale (industrial sector) or a more micro scale (industrial firms and enterprises).
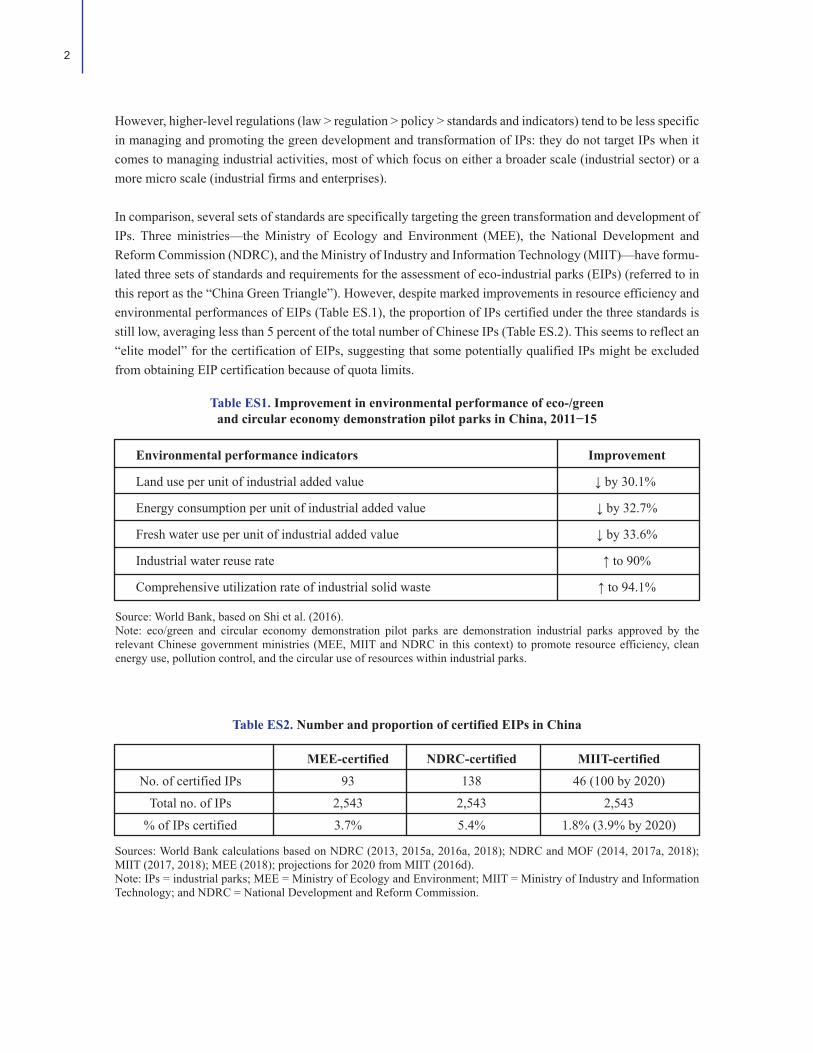
In comparison, several sets of standards are specifically targeting the green transformation and development of IPs. Three ministries—the Ministry of Ecology and Environment (MEE), the National Development and Reform Commission (NDRC), and the Ministry of Industry and Information Technology (MIIT)—have formu-lated three sets of standards and requirements for the assessment of eco-industrial parks (EIPs) (referred to in this report as the “China Green Triangle”). However, despite marked improvements in resource efficiency and environmental performances of EIPs (Table ES.1), the proportion of IPs certified under the three standards is still low, averaging less than 5 percent of the total number of Chinese IPs (Table ES.2). This seems to reflect an “elite model” for the certification of EIPs, suggesting that some potentially qualified IPs might be excluded from obtaining EIP certification because of quota limits.
Table ES1. Improvement in environmental performance of eco-/greenand circular economy demonstration pilot parks in China, 2011−15
Table ES2. Number and proportion of certified EIPs in China
Environmental performance indicators
Land use per unit of industrial added value
Energy consumption per unit of industrial added value
Fresh water use per unit of industrial added value
Industrial water reuse rate
Comprehensive utilization rate of industrial solid waste
Improvement
↓ by 30.1%
↓ by 32.7%
↓ by 33.6%
↑ to 90%
↑ to 94.1%
Source: World Bank, based on Shi et al. (2016).Note: eco/green and circular economy demonstration pilot parks are demonstration industrial parks approved by the relevant Chinese government ministries (MEE, MIIT and NDRC in this context) to promote resource efficiency, clean energy use, pollution control, and the circular use of resources within industrial parks.
Sources: World Bank calculations based on NDRC (2013, 2015a, 2016a, 2018); NDRC and MOF (2014, 2017a, 2018); MIIT (2017, 2018); MEE (2018); projections for 2020 from MIIT (2016d). Note: IPs = industrial parks; MEE = Ministry of Ecology and Environment; MIIT = Ministry of Industry and Information Technology; and NDRC = National Development and Reform Commission.
No. of certified IPs
Total no. of IPs
% of IPs certified
MEE-certified
93
2,543
3.7%
NDRC-certified
138
2,543
5.4%
MIIT-certified
46 (100 by 2020)
2,543
1.8% (3.9% by 2020)
2

9 Circular economy refers to an economic model that encourages the circular use (reuse/recycle) of resources in economic activities to improve the resource efficiency of production and support the overall economic development.10 WBG, UNIDO, and GIZ (2017). See Appendix I for a presentation of the EIP Framework.
Comparisons between each set of the Chinese green standards show that the MEE and MIIT standards are highly consistent in terms of both categorization (economic development performance, resource use efficiency, environmental protection, energy utilization, and managerial capacity) and indicator design—21 out of 31 MIIT indicators and 19 out of 32 MEE indicators are identical or similar, suggesting a potential opportunity to merge the two standards. The NDRC standard is somewhat different in scope as it emphasizes the circular economy performance of IPs.9 Unlike the MIIT and MEE standards, which cover managerial, environmental, and economic performance of IPs, the NDRC indicators focus more on resource efficiency and pollutant emissions. They also measure the environmental performance of IPs differently. The different emphasis of the NDRC standard translates into a relatively lower consistency with the MEE and MIIT standards. Overall, multiple sets of EIP standards formulated by different government ministries might leave IPs ambiguous about which standards to comply with, potentially slowing the green development of IPs.
As a country with a large industrial sector, a leading role in combating global environmental challenges, and a strong ambition for green development, China is among the best positioned economies to take the lead in formulating effective EIP standards that would not only guide the green development and transformation of Chinese IPs, but also serve as a useful reference for the formulation of EIP standards by other countries. China’s standards were notably considered for the preparation of the global EIP standards recently adopted by the World Bank Group, United Nations Industrial Development Organization (UNIDO), and the German development agency, Deutsche Gesellschaft für Internationale Zusammenarbeit (GIZ), referred to as the “EIP Framework” in this report. 10 While this EIP Framework is a flexible tool with indicative requirements and targets meant to be adapted to local circumstances, it may serve as a useful reference for China to assess the quality of its EIP standards and consider opportunities to improve them.
This report conducts a comparative analysis between the Chinese green standards and the EIP Framework across all four dimensions—park management and economic, social, and environmental performance— to identify differences and share policy recommendations for further improvements of the Chinese standards. The main differences identified between the Chinese and the EIP Framework are the following:
Park management
“General vs. specific” requirements: The Chinese standards formulate more general requirements for park management, while the EIP Framework sets more specific requirements, including detailed description of prerequisites and performance indicators.
“Implicit vs. explicit” requirements: Many prerequisites included in the EIP Framework are not explicitly listed in the Chinese standards because they are usually compulsory (covered by other pieces of legislation or regulations) for any planned IP in China to be approved by local, provincial, or national authorities. Hence, the fact that Chinese green standards do not have certain provisions does not necessarily mean that the IPs are exempt from these requirements. In general, considering both implicit and explicit requirements regarding park management, the Chinese standards and the EIP Framework are largely in line with each other.
3

Environmental performance
“Result-based” vs. “process-based” assessment: Differences in environmental performance requirements ensue from different approaches to green standards. The Chinese standards are result-oriented and focus more on the ultimate impact in terms of pollution reduction or resource efficiency. On the other hand, the EIP Frame-work complements outcome-based targets (such as the proportion of solid waste reused) with “process-based” indicators, focusing on the systems and processes established for pollution control and resource efficiency. The EIP Framework sets dual requirements on both the environmental performance and the process to achieve such results.
Social performance
“Implicit vs. explicit” requirements: Some EIP Framework requirements in the social performance section are not part of the Chinese standards, but they are usually included in additional Chinese legislation.
“Moral standards vs. legal requirements”: Differences in harassment-related and women-right-related requirements between the Chinese standards and the EIP Framework seem to result from different cultural norms on treating harassment prevention and women’s rights/welfare. In China, when harassment occurs, it is more often dealt with by using moral suasion instead of legal regulations. Other countries tend to rely on social norms and robust regulatory frameworks at the same time.
“Beyond regulatory consideration”: The EIP Framework has requirements on occupational health and safety (OH&S) management systems, community dialogue and community outreach. The Chinese standards do not specifically address these requirements.
Economic performance
“Economic standards vs. socioeconomic standards”: Chinese standards and the EIP Framework have different definition of IPs’ economic performances. The evaluation criteria used by the Chinese standards focus on the economic output of IPs, mainly GDP, while the EIP Framework emphasizes the socioeconomic effect of IPs on local economic development and well-being of the local population—as reflected in, for instance, indicators on local employment generation, and opportunities for development of small and medium enterprises (SMEs). The EIP Framework assesses the overall socioeconomic performance of IPs going beyond the park level, not only the newly created GDP.
The analysis shows that the differences between the Chinese and EIP standards are largely a result of different approaches to evaluation of IPs and are not necessarily indicative of inherent weaknesses in the Chinese regula-tory framework. The Chinese standards seem to be quite comprehensive and cover key requirements for the evaluation and promotion of EIPs. However, the comparison with the EIP Framework suggests that the Chinese standards could be further improved and move closer toward the EIP Framework.
4

Lack of data: FHTZ has a department of statistics that collects data at the park level. The data measure key economic and environmental performance indicators such as industrial output, industrial added value, tax revenue, and energy consumption, in line with municipal and/or provincial requirements. However, data going beyond municipal or provincial requirements are usually not collected. As a result, FHTZ does not have data to assess its compliance with many EIP Framework requirements.
Incomplete infrastructure: Compliance with the environmental performance requirements of the EIP Frame-work usually requires additional investments in park infrastructure. In the case of FHTZ, to meet the EIP standards, it would have to invest in, for instance, internationally certified environmental/energy management systems, capacity to recover waste heat, and a greenhouse gas (GHG) monitoring system. The Chinese standards do not specifically address requirements on the availability of “green infrastructure” (except for wastewater treatment facilities, green buildings, and public buses in the MIIT and MEE standards) or focus on different type of green infrastructure. This indicates an area where the Chinese standards could be upgraded and move closer toward the EIP Framework.
Insufficient incentives: FHTZ and other Chinese IPs strive to meet the green requirements listed in provincial or national guidelines/regulations. However, local economic, regulatory, and technical conditions do not seem to provide sufficient incentives to go beyond the local standards and comply with some of the more demanding EIP Framework environmental and economic requirements (such as use of renewable energy, reduction of GHG emissions, and energy efficiency). In some cases, park management and tenant firms may not see benefits in adopting international standards, such as environment management systems (EMS) and energy management systems (EnMS) certified by the International Organization for Standardization (ISO), although the experience in China and abroad suggests these can bring benefits, including in terms of attracting foreign investment. This suggests a role for awareness raising and technical support to identify institutional reforms and investments that can yield environmental, economic and social benefits for the IP, its tenants, and surrounding communities.
All three Chinese green standard-makers (MEE, MIIT and NDRC) have a systematic incentive framework in place to promote compliance with the Chinese green standards, and the green transformation and development of Chinese IPs overall. The incentives include direct subsidies, preferential tax policies, and easier access to financing from financial institutions. Some nonfinancial incentives are also planned, such as including indica-tors on EIP certification in the assessment of IP’s business environment and competitiveness by local authori-ties and recognition through awards—although it is not clear how effective they have been so far. Most incen-tives are provided for both IPs and tenant firms.
Nevertheless, the incentive frameworks of the Chinese green standards could benefit from establishing a more explicit link between the provision of incentives for firms and whether a firm resides in an EIP. Currently,
China could also strengthen the incentives for IPs to meet EIP standards. The case study of the first application of the EIP Framework in China by the Fuzhou High-Tech Zone (FHTZ), Jiangxi Province, shows that Chinese IPs may face several challenges in moving toward EIP standards. The key challenges include:
5
incentives for parks and firms are often separate. Except for one of the MIIT policies for promoting the estab-lishment of green IPs that specifically promotes projects proposed by green factories, green IPs, and green industrial chains, as well as resident firms within them, there is no link between getting access to financial support and residing in green-certified IPs. The Chinese authorities could consider offering additional incen-tives for EIP tenant firms to strengthen incentives for IPs to comply with green standards. In addition, IPs with, for instance, a larger percentage of green tenant firms, could also be prioritized in public support schemes, providing strong incentives for both IPs and tenant firms to seek green certifications.
Better access to finance could also motivate IPs and firms to become greener. As China continues to develop its green financial system, it is important to ensure that green finance is fully leveraged to support the develop-ment of EIPs. Among other general issues for the implementation of green finance, this will require (i) coordi-nation with the different EIP standards in place, as well as with industrial and other relevant policies, to ensure that the link between IPs’ environmental performance and access to green finance is strengthened; (ii) increased focus on data collection and the evaluation of the impacts of green finance initiatives; and (iii) capac-ity building for green finance at the local level (IIGF and UNEP 2017). Public fiscal incentives, while import-ant, will not be sufficient for the green development and transformation of Chinese IPs, and will increasingly have to be complemented by commercial and private capital. Green credit and green bonds are promising instruments to help achieve this. Likewise, the Ministry of Finance (MOF) and NDRC have developed a policy framework for green public-private partnerships (PPPs) (NDRC and MOF 2014), which have grown rapidly and could increase financing for green infrastructure in EIPs.
Overall, China has been a trailblazer by adopting several EIP standards in recent years and promoting them at a large scale. While voluntary, these standards have started to be adopted by a growing, although a still small number of Chinese IPs and can be a way for IPs to effectively reconcile economic, environmental, and social objectives. As various supporting schemes for IPs continue to be rolled out in the coming years, important implementation issues will have to be addressed, including the mainstreaming of EIPs and building of local capacity in all regions of the country; strengthening of verification and supervision mechanisms to ensure continuous compliance with the standards; data collection and the quantitative assessment of economic, environmental, and social benefits from EIP models; and development of appropriate business models to expand EIPs. The report concludes by sharing policy recommendations that the Chinese authorities could consider to further upgrade the green standards and promote green IPs. The recommendations include the need to:
‐ Introduce more ambitious targets to increase the number of EIPs.‐ Consider consolidating, updating (for example, by using a tiering certification system to foster competition and continuous improvement), and streamlining EIP standards.‐ Seek an optimal set of indicators to balance economic competitiveness and environmental protection.‐ Improve data collection and analysis systems to track park performance of IPs against domestic and international EIP standards and expand access to information‐ Strengthen enforcement of existing regulations‐ Consider adopting a specific Law on IP Management.‐ Leverage green finance for EIP development.
6

Introduction
1.1 Project background and context
China has achieved remarkable success in economic growth and development in the past four decades, during which time it has increased its GDP per capita by more than 25 times. However, this strong performance has been accompanied with adverse environmental impacts, jeopardizing economic and social gains from growth. To move toward sustainable development and reduce the environmental impact of further economic growth, the Chinese government has started to prioritize green development and the building of an “ecological civiliza-tion.” 11 China’s 13th Five-Year Plan (2016−2020) has upgraded the building of this “ecological civilization” to the level of “national strategy”—a policy target of top priority. 12 During the 19th National Congress of the Communist Party of China in October 2017, President Xi Jinping emphasized that “energy conservation and environmental protection are fundamental national strategies” and “lucid waters and lush mountains are invalu-able assets.” President Xi also called for enhanced efforts to “continue the ‘Beautiful China’ initiative to create good working and living environments for our people and play our part in ensuring global ecological securi-ty.”13 Prime Minister Li Keqiang also noted that “the level of ecological civilization should be progressively upgraded to promote green development and achieve a co-development of economic prosperity and environ-mental protection.” 14
The greening of the Chinese industrial sector is a key factor that will determine the success of the “ecological civilization.” The industrial sector is one of the largest contributors to the country’s economy (40.5 percent of national GDP in 2017), 15 but also to overall pollution (approximately 70 percent of total environmental pollu-tion in 2015). 16 While some progress has been made to improve the sector’s resource efficiency and to reduce industrial pollution, there is still a large untapped potential for improvement.
Industrial parks (IPs) have played a particularly important role in industrial development in China. 17 According to the Ministry of Ecology and Environment (MEE), “IPs have become the ‘key vehicle’ for industrial develop-ment in China […] all new industrial projects are required to be operated within IPs” (Zhang 2018). In 2016, the economic output of all Chinese IPs amounted to 60 percent of the country’s GDP, and national IPs alone contributed 17 trillion RMB (23 percent of GDP) in the same year (Zhang 2018). The ongoing concentration of industrial activities within IPs suggests that an increasing proportion of industrial pollution is generated by IPs. Thus, guiding and managing IPs in line with green development principles will be vital for the achieve-ment of China’s and the world’s sustainable development goals.
There has been increasing pressure from the top over the last decade for improved environmental performance of industries. Despite significant efforts in this direction by many IPs, economic objectives often continue to be given priority over environmental and social ones. IPs have continued to face increasing environmental issues and resource access constraints. In some IPs, environmental systems infrastructure has lagged other invest-ment, leading to negative environmental impacts. It is estimated that IPs in over 80 percent of Chinese
11 Sheng Tai Wen Ming (生态文明) in Chinese.12 The State Council of the People’s Republic of China (2016a).13 President Xi Jinping (2017). 14 The State Council of the People’s Republic of China (2016a).15 National Bureau of Statistics of People’s Republic of China (2018). 16 China Environment News (2015). 17 See the definition of IPs provided in the executive summary (footnote 8).
7
18 China Enterprise News (2017). 19 For example, in April 2018, three IPs (Yanweigang, Duigougang, and Chenjiagang) in Jiangsu Province were found to illegally emit wastewater to the nearby Guan River, causing serious environmental damage to both water and land. Ineffec-tive environmental management by the three IPs was the main reason for the pollution. On-site investigation showed that: (i) the water and air pollution level of many resident firms was over 50 times higher than the national standards; (ii) residents’ health was negatively affected: residents report a constant pungent smell from factories and a higher frequency of illness; (iii) the fishing industry was badly hit: before the pollution, approximately 500kg of fish, shrimp, and shellfish could be gathered within an hour; while after the pollution, 6 hours of fishing could gather less than 10kg of small fish; (iv) surrounding agricultural land polluted by industrial wastewater is no longer able to be cultivated or fertilized (CCTV 2018). 20 For overviews of EIP development, see notably UNIDO (2016, 2017); WBG, UNIDO, and GIZ (2017); Chertow and Park (2016); and Shenoy (2016).21 ISO 14001 is an international standard developed by the International Organization for Standardization for certification of environmental management systems (EMS). The standard aims to help companies and organizations enhance their environmental performance and improve ecological sustainability. More information on: https://www.iso.org/stan-dard/60857.html 22 See, for instance, Geng and Côté (2003); Geng et al. (2009); Shi et al. (2010); Zhang et al. (2010) ; Bai et al. (2014); Shi and Yu (2014); Liu and Bi (2015); Wang, Lei, and Bi (2015), Wang, Deutz, and Gibbs (2015), Yu, Han, and Cui (2015); Yu, Lu, and Wang (2018); Yang et al. (2018). 23 See Taddeao (2016) for Italy and Massard, Leuenberger, and Dong (2018) for Vietnam.24 Specifically, Tian et al. (2014) find that “(1) industrial added value of the 17 eco-industrial parks as a whole increased by 56%; (2) for comprehensive energy consumption, fresh water consumption, industrial wastewater generation, and solid waste production, the 17 eco-industrial parks had an overall increase of 20%, 18%, 12%, and 6%, respectively. The quantity of energy and fresh water consumption, wastewater and solid waste generation in some eco-industrial parks started to decrease with economic growth. Meanwhile, the average intensity of the four metrics decreased by 22%, 25%, 28%, and 32%, respectively; (3) for chemical oxygen demand and sulfur dioxide, the eco-industrial parks accomplished a two-fold decrease in both total quantity of emissions and intensity. Chemical oxygen demand emissions and its intensity decreased by 25% and 52%, respectively. Sulfur dioxide emissions and its intensity decreased by 51% and 69%, respectively.”
provinces have environmental problems, which include illegal production, excessive pollutant emissions, and ineffective environmental monitoring— making industrial zones “pollution-concentrated zones.” 18 In some cases, lax environmental protection has led to serious environmental pollution. 19 This has become a major barrier for China to proceed with environmental rehabilitation (Zhang 2018).
China is not the only country in which the concentration of industrial activity in dedicated zones has led to rising environmental challenges. An increasing interest among academics and policy makers for eco-industrial parks (EIPs) has been observed globally over the last two decades, in high-, medium- and low-income coun-tries alike. 20 An EIP can broadly be defined as “a dedicated area for industrial use at a suitable site that ensures sustainability through the integration of social, economic, and environmental quality aspects into its siting, planning, management and operations” (WBG, UNIDO, and GIZ 2017). EIPs can seek to reduce their environ-mental impacts by (i) investing in common pollution and waste management facilities; (ii) promoting invest-ments in resource efficiency and cleaner production (RECP) by each tenant company; (iii) fostering exchanges of waste material, water, and energy between tenants (“industrial symbiosis”), as well as with surrounding urban areas; (iv) promoting circularity (such as remanufacturing, reuse, and/or recycling); (v) adopting green building and other environmental standards (such as ISO 1400121 ); (vi) increasing access to renewable energy sources; and (vii) ensuring strategic recruitment of tenants and increasing green cover in the estate. While many IPs around the world have claimed the “eco” label, there are still few actual EIPs in operation, especially in developing and emerging economies (UNIDO 2016). Good examples of IPs that have reaped economic, environmental and social gains from shifting to EIP models can nonetheless be found in several countries, such as China, Denmark, and the Republic of Korea (Box 1.1). China has been one of the pioneers in implementing the EIP concept, and one of the main subjects of the literature on the topic. 22 It is one of the few countries, along with Italy and Vietnam, that has sought to introduce standards to define EIP requirements and monitor their performance. 23 There is emerging evidence that Chinese EIPs have recorded a strong improvement in economic and environmental performance: according to one study by Tian et al. (2014), 17 Chinese EIPs analyzed in the study have increased value added by 56 percent over the studied period, while solid waste production increased by only 6 percent. 24
8
Box 1.1 Leading international EIP examples
Tianjin (China): Tianjin Economic-Technological Development Area (TEDA), located 130 kilome-ters southeast of Beijing, is a leading industrial area in China and hosts thousands of foreign and domestic companies, mainly in the electronics, automobile & machinery, biotechnology & pharma-ceutical, and food & beverage industries.
It was the first national economic-technological development area to create an independent environ-mental regulatory body in 1990 and a tenant environment protection association in 1996. Since then, it has continuously upgraded its environmental management capacity ( through, for example, environ-mental impact assessments of new investment projects, and environmental monitoring of existing key water and air pollution sources, pollution discharge levies). TEDA obtained ISO 14001 certification in 2000, in parallel with several tenant companies, and was nominated as a national demonstration zone for ISO 14001 the same year. In the early 2000s, TEDA formulated an EIP development plan, and was subsequently recognized as a national demonstration EIP and pilot circular economy zone. In addition to regulatory requirements and resource scarcity, one of TEDA management’s main motiva-tions to transition to an EIP model was fierce competition for foreign investment from other leading IPs in China.
Over the years, TEDA and its tenant companies have developed a complex system of public infrastructure and symbiotic exchanges between companies to recover materials and improve the management of energy, wastewater, and solid waste. Economic and environmental benefits have been considerable.
Ulsan (Korea): The city of Ulsan, located in the southeastern part of Korea, is the country’s industrial capital. The metropolitan area includes two national industrial complexes (Ulsan-Mipo and Onsan), as well as several regional ones, which include over 1,000 firms in diverse heavy industries, including vehicle manufacturing, shipbuilding, oil refineries, machinery, nonferrous metals, fertilizer, and chemical industries.
Rapid industrial development between the 1960s and 1980s resulted in serious air and water pollution issues, with dire economic, environmental, and social impacts. This led the Korean government to impose stricter environmental quality standards in Ulsan industrial complexes from the late 1980s, pushing resident firms to invest in pollution management and prevention, and to promote resource efficiency and cleaner production from the 1990s onward. Ulsan was one of the main pilot sites of the national EIP program launched in 2003, which focused on the development of industrial symbiosis. This built on synergies previously established by industrial firms in Ulsan, including shared utilities and exchanges of by-products. The Ulsan Regional EIP Center, led by an advisory board with repre-sentatives from the local government, industry, and academia, was established to collect data, identify potential industrial symbiosis projects, coordinate with the national level for the provision of technical
9

and financial support to individual projects, and monitor economic, social, and environmental impacts.
Under the program, 77 projects were funded for research and development and 34 for operations. Investments amounted to US$14.8 in project research and development from the government and US$245.8 million from industries. Overall, the projects supported have led to US$65 million in new business income from the sale of waste and by-products and US$78 million in energy and material costs savings each year. Between 2005 and 2016, they also saved 279,761 tons of oil equivalent in energy use through a reduction of 665,712 tons of CO2 emissions and 4,052 tons of air pollutants, such as SOx and NOx); a decrease of 79,357 tons of water; and the reuse of 40,044 tons of by-products and waste (GGGI 2017).
Kalundborg (Denmark): Kalundborg is among the world’s best-known example of EIP and has been the object of numerous studies over the last three decades.
Rather than a government-planned estate, it is a business-led industrial symbiosis and utility-sharing network, which has been progressively established since the 1960s. The system is currently made up of 25 different exchanges of water, energy/heat, and materials, with flows emanating from six differ-ent industrial firms and three public organizations with 5,000 employees. Since 2011, this partnership has been formalized as a private association, Kalundborg Symbiosis (http://www.symbiosis.dk/en/), which manages matters involving all partners and explores opportunities for further collaboration.
A life-cycle assessment based on data for 2015 and comparing production with and without the current industrial symbiosis network showed that it generated annual financial savings of over €24 million for all the partners involved, and reduced GHG emissions by 635,000 tonnes of CO2 equiva-lent.
Source: Park and Won (2007); GGGI (2017); Shi, Chertow, and Song (2010); https://www.ellenmacarthurfoun-dation.org/case-studies/effective-industrial-symbiosis, Kechichian and Mi Hoon Jeong. 2016.
10

‐ Briefly discusses the history and development of IPs in China ‐ Evaluates the effectiveness of the Chinese regulatory framework of IP management and EIP promotion at all
legislative levels (laws, national regulations, national policies, standards & indicators)‐ Identifies the similarities and differences among the Chinese EIP standards and evaluates their effectiveness
in guiding and promoting the green transformation of IPs, as well as room for further improvement‐ Conducts a comparative analysis between the Chinese standards and the EIP Framework ‐ Identifies challenges for Chinese IPs to comply with the EIP Framework through a case study of Fuzhou
High-tech Zone (FHTZ), Jiangxi Province‐ Assesses the current incentive structure for Chinese IPs to undertake a green transition‐ Evaluates the development of green finance for EIP development and promotion and identifies opportunities
for establishing a more effective green finance system‐ Provides policy recommendations for the Chinese standards to guide the green development and transforma-
tion of Chinese IPs, but also serve as a model for the formulation of future international EIP standards.
1.2 Scope of the report
To help China achieve a greener development, this report aims at assessing the adequacy of the existing Chinese regulatory framework in promoting the green transition of IPs, including the different EIP standards in force, and at identifying obstacles and opportunities for this transition. Specifically, this report:
11

12
2.1 From industrial parks to eco-industrial parks
In the past 40 years of Chinese economic development, IPs have been playing a key role as “policy pioneers.” China started developing various forms of IPs in the 1980s as part of the country’s economic reform program. Since then, IPs have been a major force in the development and concentration of Chinese industries, notably enabled by strong political commitment at the highest level, proactive support from different levels of govern-ments, institutional autonomy for zones, experimentation with new policies and institutions, and adoption of clear targets and competition between zones (Zeng 2011). By the end of 2017, China had a total of 2,543 IPs, including 552 national IPs and 1,991 provincial ones.
Over time, the increasing concentration of industries and a booming number of IPs have created increasing pressure on land and resources, with chaotic infrastructure construction and growing pollution. In parallel with renewed efforts over the last two decades to enforce environmental regulations and to ensure industry compli-ance, this led the Chinese government to take a series of actions to encourage a more rational development of IPs in the 2000s. During this period, EIPs received increasing attention and gradually became a mainstream model for IP development.
MEE (then the State Environment Protection Administration—SEPA) initiated the EIP Demonstration Program in the early 2000s to minimize pollution and waste generation in existing IPs and was later joined by the Ministry of Science and Technology (MOST) and the Ministry of Commerce (MOC). Some sector-specific IPs—such as chemical parks in the Yangtze Delta Area and sugar-making parks in the Zhujiang Delta Area—adopted measures early on to balance economic growth and environmental sustainability. After 2004, several leading parks joined the EIP pilot project, including the Tianjin and Fuzhou Economic-Technological Development Areas (TEDA/FEDA) and Suzhou IP. The pace of certification under the EIP Demonstration Program increased after 2010 (Thieriot and Sawyer 2015).
Other initiatives to green IPs were adopted in parallel. This includes the Circular Economy Pilot Zones program initiated in 2001 by the Ministry of Environment Protection (MEP) (now MEE) and taken over in 2005 by the National Development and Reform Commission (NDRC), which since 2012 has jointly led it with the Ministry of Finance (MOF) as the Circular Transformation Industrial Parks program. In addition, the Low-Carbon IP Pilot Program was launched in 2013 by the Ministry of Industry and Information Technology (MIIT) jointly with the NDRC.25 The general managerial and operational structure of Chinese EIPs at the current stage is presented in Figure 2.1.
25 See Thieriot and Sawyer (2015) for an earlier presentation of the three programs, their governance structure, and certifica-tion procedures. The rest of the report uses the term “EIP” to refer in general to the different programs in place.
Green Industrial Parks in China: History, Development, and Regulatory Framework
13

2.2 Regulatory framework of IP management and EIP promotion in China
Effective management of IPs toward green development and transformation requires a well-functioning regula-tory framework. The current regulatory framework for IP management in China has the following key charac-teristics:26
26 See Appendix A for details on relevant provisions of each law, regulation, policy and standard analyzed.
Figure 2.1 General managerial and operational structure of Chinese EIPs
Source: World Bank.Note: MEE = Ministry of Ecology and Environment; MIIT = Ministry of Industry and Information Technology; MOC = Ministry of Commerce; MOF = Ministry of Finance; MOST = Ministry of Science and Technology; NDRC = National Development and Reform Commission.
‐ Contrary to some countries, such as Turkey, China does not have a specific law on IP management. However, a comprehensive regulatory framework is in place, which covers different legislative levels, including (from top to bottom) laws, regulations, national policies, and standards & indicators.
‐ The regulatory framework covers multiple aspects of IP management, including requirements on IPs’ economic and environmental performance, which are generally consistent with the principle of sustainable development.
‐ Complementary policy instruments are used in the regulatory framework, including command and control, economic/financial incentives, moral suasion, and supporting policy.
‐ IPs at different levels (such as national, provincial, municipal, county) face regulations of different stringency.
14
NDRCMIITMEEMOST MOC MOF Others
Eco-industrial parks
Industrial park management committee
Green industrial parks Circular economy upgrade demonstration parks
Firm-related projects
Infrastructure-related projects
Provincial governments (provincial demonstration pilots)
Com
pany
Industrial park promotion institutionsExternal supportive
institutions
Central government (national demonstration pilots)
Financial institutions
Capacity building projects
Infrastructure
External verification institutions
Public
National laws
Five comprehensive national-level laws are directly relevant for the environmental impact and greening of industrial activities. However, most provisions focus on managing and regulating industrial activities in gener-al, targeting industrial projects and firms, rather than IPs specifically.
In addition, five specific laws include articles that are related to IP management. They focus on the firm level rather than the park level. Compared with the comprehensive laws discussed previously, these laws deal with specific aspects, such as waste management, renewable energy, and energy saving. The specific laws include:
27 中华人民共和国环境保护法 (NPC 2015). 28 中华人民共和国环境影响评价法 (NPC 2016c).29 中华人民共和国清洁生产促进法 (NPC 2012). 30 中华人民共和国循环经济促进法 (NPC 2009a). 31 中华人民共和国环境保护税法 (NPC 2018).32 中华人民共和国水污染防治法 (NPC 2017). 33 中华人民共和国大气污染防治法 (NPC 2016a). 34 中华人民共和国固体废物污染环境防治法 (NPC 2016d). 35 中华人民共和国可再生能源法 (NPC 2009b). 36 中华人民共和国节约能源法 (NPC 2016b)
‐ Environmental Protection Law: 27 6 out of 70 articles in this law are related to IP management. Industrial firms and enterprises are obliged to perform due diligence in reducing environmental pollution, prioritizing the use of clean and renewable energy, applying less-polluting technologies in production, and installing pollution control facilities. However, the 6 articles do not directly target IPs, but instead focus on industrial activities in general.
‐ Environmental Impact Assessment Law:28 3 out of 37 articles in this law are related to IP management, focus-ing on specific environmental impact assessment (EIA) requirements procedures for industrial projects. The law targets all industrial projects rather than IPs specifically.
‐ Cleaner Production Promotion Law: 29 4 out of 42 articles in this law are related to IP management, including the compulsory requirement for all industrial projects to conduct an environmental impact assessment (EIA) before construction or production, prioritizing the use of resource-efficient and low-waste technologies, recycling and reusing wastes when economically and technically feasible, and monitoring resource use and waste generation during production. Like the Environmental Protection Law and the Environmental Impact Assessment Law, IPs are not specifically targeted.
‐ Circular Economy Promotion Law: 30 2 out of 58 articles in this law are related to IP management. They share similar ideas with the “3R principle” (Reduce, Reuse, Recycle), requiring efficient and circular utilization of resources, including waste, energy, land and water. Article IV-29 specifically regulates and encourages IPs to organize firms within the parks to fulfill the principle of circular economy.
‐ Environmental Protection Tax Law: 31 2 out of 28 articles in this law are related to IP management. The Law sets the “threshold emission level” for different pollutants, above which emitting firms must pay the environ-mental protection tax.
‐ Water Pollution Prevention and Control Law: 32 4 relevant articles out of 103.‐ Air Pollution Prevention and Control Law:33 3 relevant articles out of 129.‐ Law on the Prevention and Control of Environmental Pollution by Solid Waste: 34 3 relevant articles out of 91.‐ Renewable Energy Law:35 1 relevant articles out of 33.‐ Energy Conservation Law:36 2 relevant articles out of 87.
15
National regulations
Three major national regulations include articles relevant to IP management. These regulations set targets on a broader scale (industrial sector level) and formulate regulations on a more micro level (firm level), but do not specifically address the IP level.
National policies
At the policy level, more sections and paragraphs specifically deal with IP management.
37 大气污染防治十条措施 (The State Council of the People's Republic of China 2013).38 水污染防治行动计划 (The State Council of the People's Republic of China 2015a).39 土壤污染防治行动计划 (The State Council of the People's Republic of China 2016b). 40 生态文明体制改革总体方案 (The State Council of the People's Republic of China 2015c).41 国务院关于印发〈中国制造2025〉的通知 (The State Council of the People's Republic of China 2015b). 42 中华人民共和国国民经济和社会发展第十三个五年规划纲要 (NDRC 2016b). 43 循环发展引领行动 (NDRC 2017).44 关于加强国家生态工业示范园区建设的指导意见 (MEE, MOC, and MOST 2011). 45 国家生态工业示范园区管理办法 (MEE, MOC, and MOST 2015).46 工业绿色发展规划(2016−2020)(MIIT 2016c).
‐ Ten Measures of Air Pollution Prevention and Control: 37 3 relevant articles out of 10.‐ Action Plan for Water Pollution Prevention and Control: 38 3 relevant articles out of 35. Article I-1 specifical-
ly focuses on industrial zones (enhancing water pollution management, wastewater treatment facilities, and real-time monitoring system for wastewater emissions at the park-level).
‐ Action Plan for Soil Pollution Prevention and Control:39 1 relevant article out of 35.
‐ General Guidelines on the Institutional Reform of Ecological Civilization: 40 This document outlines the requirements, principles, and objectives of building an “ecological civilization” and promoting green devel-opment. Among the key requirements are supporting green, circular, and low-carbon development and balancing economic development and environmental protection. Establishing an effective green finance system is also emphasized.
‐ Notice by the State Council on the “Made in China 2025” Project: 41 This policy proposes to pursue “green manufacturing,” with the establishment of 100 “green demonstration IPs” by 2020 as a key objective.
‐ The 13th Five-Year Plan on the Economic and Social Development of the People’s Republic of China:42 Article 43-5 includes the promotion of circular economy modification within IPs and industrial symbiosis between firms within parks.
‐ Action Plan for Leading Circular Economy Development:43 Three articles offer roadmaps and quantitative targets for “circular economy upgrade for industrial parks.”
‐ Guiding Notice on Strengthening the Development of National Eco-Industrial Parks: 44 This is a general guideline that targets the development of EIPs in China and points out the general requirements, key objec-tives, and supporting policies (such as financial incentives and capacity building) for establishing national EIPs.
‐ Guidelines on the Management of National Eco-Industrial Parks:45 This provides detailed requirements and procedures of the application, construction/establishment, approval, performance verification, and manage-ment of national EIPs.
‐ Plan for Industrial Green Development (2016−2020):46 This Plan outlines the blueprint for the green devel-opment of China’s industrial sector during the 13th Five- Year period. The establishment of a green manufac-turing system is among the ten key objectives, including the construction of green IPs. The Plan proposes to establish 100 representative and high-level demonstration green IPs by 2020.
16

2.3 The “Green Triangle” of Chinese EIP standards
In 2006, China was the first country to adopt national standards to assess the performance of EIPs (Geng et al. 2009). Since then, three separate EIP standards have been formulated: namely, National Demonstration Eco-In-dustrial Parks; Industrial Parks for Circular Economy Transformation; and Green Industrial Parks. The devel-opment of several parallel initiatives has political roots. Different agencies took the lead on each of them—MEE, NDRC, and MIIT, respectively. Accordingly, the different standards have a slightly different focus according to their own agenda.
The development of the three standards can be better understood from a historical perspective. The first standard was developed by MEE (then called the State Environmental Protection Administration) in 2000, to promote the idea of industrial ecology in China. Thus, the focus is on environmental protection and resource saving. The second standard was developed by NDRC in 2012, to implement China’s Circular Economy Promotion Law passed in 2008 and the Twelfth Five-Year Plan formulated in 2011. Thus, the focus is on circu-lar economy transformation. The third standard was developed by MIIT in 2016, when MIIT wanted to develop a holistic green manufacturing system under the framework of China Manufacture 2025 unveiled in 2015. Thus, in addition to green industrial parks, MIIT is also promoting green factories, green design products, and green supply chain management demonstration firms.
MEE Standard: Standard for National Demonstration Eco-Industrial Parks 51
The latest version of the MEE standard was adopted in January 2016 and builds the MEE’s EIP demonstration program. The MEE standard contains 32 indicators, categorized into 5 groups: economic development (4); industrial symbiosis (3); resource saving (9); environmental protection (13); and information disclosure (3). For an IP to be considered a national demonstration EIP, the park is required to meet the requirements of 17 compulsory indicators and a minimum of 6 optional indicators. Requirements on environmental protection and resource saving are the key focus of the MEE standard, including 13 and 9 indicators, respectively. For environmental protection indicators especially, 12 out of 13 are compulsory, covering requirements of
Standards and Indicators
Four different Chinese ministries have formulated relevant evaluation frameworks, focusing on upgrading of ordinary IPs into (i) green industrial parks, (ii) EIPs, and (iii) IPs in line with the circular economy principle. Standards and indicators are specifically designed to manage and guide the green development of Chinese IPs. Three of them (referred to here as the “Green Triangle”) are analyzed in more detail in the next section.
47 国家生态工业示范园区标准(HJ 274-2015)(MEE 2016).48 关于开展绿色制造体系建设的通知 (MIIT 2016b).49 关于请组织推荐2017年国家园区循环化改造重点支持备选园区的通知 (NDRC and MOF 2017b).50 工业园区循环经济评价规范(GB/T 33567-2017) (CNIS 2017).51 国家生态工业示范园区标准(HJ274-2015)(MEE 2016). See details on requirements and indicators in Appendix B.
‐ Standard for National Demonstration Eco-Industrial Parks 47
‐ Notice on the Establishment of a Green Manufacturing System48 ‐ Notice on Recommending Key Candidate Industrial Parks for Circular Economy Transformation in 2017 49
‐ Specification for Circular Economy Performance Evaluation of IPs 50
17

52 Green coverage refers to the area covered by green plants, such as trees, grass, flowers, etc. It is one of the indicators used to monitor industrial parks’ environmental performance.53 关于请组织推荐2017年国家园区循环化改造重点支持备选园区的通知. See details on requirements and indicators in Appendix C.54 关于开展2017年国家园区循环化改造示范试点、“城市矿产”示范基地终期验收和资金清算的通知 (NDRC and MOF 2017c).55 These indicators are left blank for each IPs to fill in if an IP believes that it is becoming more “green” or “circular” in areas going beyond specific requirement of the standard.56 绿色园区评价标准, 关于开展绿色制造体系建设的通知. See details on requirements and indicators in Appendix D.
pollution emission levels, soundness of environmental management and risk control systems, wastewater and solid waste generation per unit of industrial output, reuse and safe disposal of various kinds of wastes, and the green coverage rate. 52 Detailed description and calculating methods of each indicator are provided as well.
NDRC Standard: Notice on Recommending Key Candidate Industrial Parks for Circular Economy Trans-formation in 2017 53
The Notice provides a guideline for the application, evaluation, and selection of demonstration IPs for circular economy transformation. It specifies 11 basic requirements/qualifications for an IP to be able to apply for becoming a “circular economy” demonstration park, and provides template indicators that measure the perfor-mance of IPs.
In addition, the Notice on the End-of-term Evaluation and Capital Settlement of the National Demonstration Industrial Parks of Circular Economy Upgrade and Urban Mining Demonstration Pilots (2017)54 extends the template indicators and offers a more comprehensive set of indicators that evaluate the “circular economy performance” of IPs. The combination of basic requirements/qualifications and indicators from these two documents is referred to in this report as the “NDRC standard.”
The NDRC standard includes 31 indicators in total, categorized into 8 groups: resource productivity (5); resource consumption (5); comprehensive utilization of resources (5); pollutant emissions (8); other indicators (3); “characteristic indicators” ;55 projects subsidized by central government finance (3); and self-implemented projects (2). The NDRC standard emphasizes the circular economy performance of IPs, leading to a focus on resource productivity, efficiency, and pollutant emissions. Given this specific focus, economic, social, and managerial performances receive less emphasis than the MEE standard. The NDRC standard also does not set target values for indicators. Instead, it provides an information sheet for IPs’ self-assessment against their previous performance and estimated future progress. Rather than providing a general and comprehensive evaluation framework for IPs’ performance, the NDRC standard focuses on assessing and promoting circulari-ty.
MIIT Standard: Requirement for the Evaluation of Green Industrial Parks, under the Notice on the Estab-lishment of a Green Manufacturing System 56
There are 31 indicators and 8 basic requirements within the MIIT standard. The indicators are divided into 6 categories: energy utilization (3); resource utilization (8); infrastructure (5); industry (4); ecology and environ-ment (8); and management (3). Similar to the MEE standard (with its categories of “resource saving” and “environmental protection”), “resource utilization” and “ecology and environment” indicators are the most numerous, consisting of over half (16/31) of all the indicators of the MIIT Standard. A balance is nonetheless achieved among different categories: managerial, environmental, and economic performance are all assessed through a number of indicators, although social performance indicators are not specifically included. For an IP to qualify as a MIIT-certified green IP, the park needs to meet 17 compulsory requirements and at least 6 optional requirements. In addition, all the 8 basic requirements must be met. A formula calculating
18

the “green index” of IPs is given based on their performance on the 31 indicators (see Appendix D). This score is an important reference for the assessment and selection of candidate MIIT-certified national green IPs.Monitoring and evaluation (M&E) is a critical element of enforcing EIP standards. China has so far developed a relatively comprehensive framework (Box 2.1).
Box 2.1 China’s regulatory frameworks on monitoringand evaluation of EIP standards
Both MEE and NDRC have relatively comprehensive M&E frameworks to supervise the performance and promote the continual improvement of IPs. Since MIIT just developed its standards in 2016, it has not formulated a regulatory framework on M&E yet.
MEE formulated its first M&E regulatory framework in 2005 and revised it in 2015. The process consists of two parts—self-assessment by industrial parks every year and review by MEE every three years. Specifically, every year, each national demonstration eco-industrial park conducts a self-as-sessment on its performance on eco-industrial development, writes a self-assessment report, and sends the report to MEE for examination and record-keeping. Every three years, MEE makes a spot check of a number of parks. If any park does not pass the check, it will be required to rectify within a prescribed time limit. If it fails again after rectification, it will be removed from MEE’s list. In addition, MEE pushes hard on information-sharing to enhance public participation and supervision.NDRC, along with Ministry of Finance, issued its framework to enforce the implementation of the circular economy transformation plan of IPs in 2015. The process also consists of two parts—mid-term evaluation and end-of-term acceptance test. The mid-term evaluation applies to IPs whose transformation plan was approved more than three years but fewer than five years ago. The parks first undertake a self-assessment and send the reports to provincial agencies. Provincial agencies then conduct on-site evaluations and send the results to NDRC and the Ministry of Finance. Finally, NDRC and the Ministry of Finance entrust a third party to verify the self-assessment reports. If any park does not pass the evaluation, it will be removed from NDRC’s list and return the funding from the central government’s budget.
The end-of-term acceptance test applies to IPs whose circular economy transformation plan was approved more than five years ago. Again, the parks first undertake a self-assessment and apply to NDRC and Ministry of Finance for end-of-term acceptance test through provincial agencies. NDRC and Ministry of Finance will then entrust a third party to make an on-site evaluation. If any park does not pass the test, it could be given up to one year to make adjustments. But if it fails again, it will be removed from NDRC’s list and return 50 percent of the funding from the central government’s budget.
Sources: MEE, MOC, and MOST (2015); NRDC and MOF (2015)
19

57 See MEE, MOC, and MOST (2015).58 NDRC and MOF (2017b).
Different emphasis on IP performance assessment: The MEE standard evaluates the performance of IPs from the angle of ecological and environmental protection, with an emphasis on pollution control and environmental quality. The NDRC standard focuses on the circular use of resources and its efficiency, following the method of life-cycle assessment of resource utilization. The MIIT standard covers the most dimensions and attempts to evaluate the development and performance of IPs from an integrative and multi-dimensional “resource-envi-ronment-economy-society” angle. This reflects the different administrative functions of the three government ministries that issued each standard. In general, the indicators in all the three sets of standards serve their respective regulatory functions well. However, room for further improvement exists: for instance, social performance requirements are not addressed in all three standards.
Different evaluation methods: The MEE and MIIT standards both set target values or threshold values for each indicator. However, in the NDRC standard, IPs self-assess their performance on each indicator and provide an estimated value for a certain year in the future. Differences also exist between the MEE and MIIT standards. The latter calculates a score (green index) using a formula based on IPs’ performance on the indicators. This score, rather than the performance on certain indicators, determines whether or not an IP qualifies as a green IP. In other words, failure to reach the target value of certain standards does not necessarily mean a failure to become a MIIT-certified green IP. The MEE standard, on the other hand, requires IPs to reach the target values of all necessary indicators before being considered MEE-certified EIPs.
Different evaluation procedures: IPs that want to apply for the MEE certification of EIP need to first draft an “EIP development plan” according to the Guideline on Drafting EIP Development Plan (MEE 2007) and submit it to provincial authorities of environmental protection, commerce, and science & technology. If agreed by the three provincial authorities, the application will be passed on for approval to the EIP construction leader-ship group led by MEE, MOFCOM, and MOST. 57 Meanwhile, the MIIT and NDRC standards adopt an assess-ment framework of “provincial recommendation–national evaluation”: provinces evaluate and recommend IPs to relevant national ministries and the latter make the final evaluation and selection. The NDRC standard requires interested IPs to first draft an Implementation Plan for Circular Economy Transformation following the instructions of Guideline for IPs on Drafting Implementation Plan for Circular Economy Transformation. 58 Provincial departments of circular economy development management and finance organize experts to assess the implementation plans, select IPs with the best foundation, the greatest potential for circular economy trans-formation, and the best implementation plan, and recommend these IPs to NDRC and the Ministry of Finance. NDRC and MOF then organize experts to evaluate the implementation plans of the recommended IPs
2.4 Evaluation of the Chinese EIP standards
Comparison of different Chinese EIP standards
An examination of the three EIP standards indicates three major differences among them:
20
and decide which parks to certify (NRDC and MOF 2017b). The MIIT standard requires interested IPs to self-assess their performance against the standard and invite third-party “evaluation institutions” (selected and authorized by MIIT) to conduct on-site park performance assessments. Eligible IPs can apply to the relevant department at the provincial level. Provincial departments then assess and check the applications (focusing on IPs’ performance against the MIIT standard indicators and on the assessment report by the third party), and recommend the most qualified IPs to MIIT. MIIT then organizes experts to further evaluate the recommended IPs through discussions, public announcements, and spot-checks before confirming the IPs to be certified (MIIT 2016b).
In general, the assessment and selection process of green-certified IPs for all three standards allows only a limited number of IPs to compete for relevant green certification. For instance, the NDRC standard each year allows only two candidate IPs from each province in the Beijing-Tianjin-Hebei region and the Yangtze River Economic Belt, and one candidate IP in each of the other provinces to be recommended from provincial level to national level as candidates for NDRC-certified circular economy demonstration IPs (NDRC and MOF 2017b). MEE and MIIT standards are similarly restrictive, even though many IPs could be qualified to comply with the green standards.
The environmental impact of green-certified IPs in China
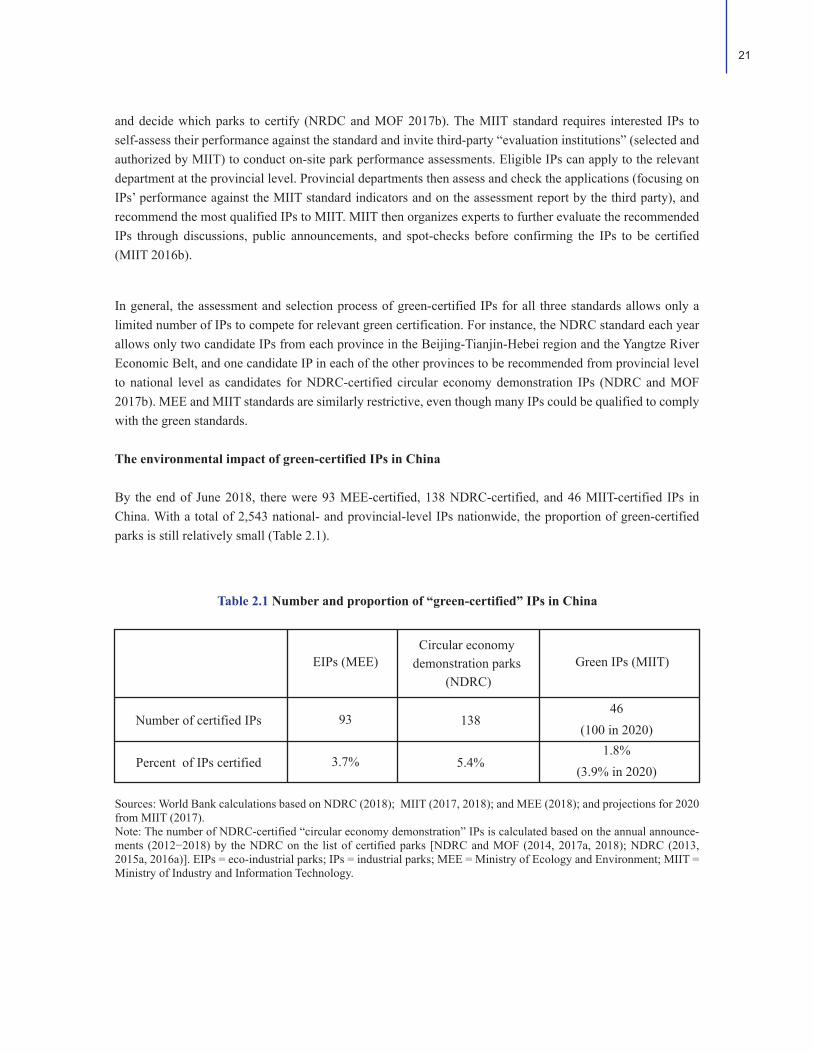
By the end of June 2018, there were 93 MEE-certified, 138 NDRC-certified, and 46 MIIT-certified IPs in China. With a total of 2,543 national- and provincial-level IPs nationwide, the proportion of green-certified parks is still relatively small (Table 2.1).
Table 2.1 Number and proportion of “green-certified” IPs in China
Sources: World Bank calculations based on NDRC (2018); MIIT (2017, 2018); and MEE (2018); and projections for 2020 from MIIT (2017).Note: The number of NDRC-certified “circular economy demonstration” IPs is calculated based on the annual announce-ments (2012−2018) by the NDRC on the list of certified parks [NDRC and MOF (2014, 2017a, 2018); NDRC (2013, 2015a, 2016a)]. EIPs = eco-industrial parks; IPs = industrial parks; MEE = Ministry of Ecology and Environment; MIIT = Ministry of Industry and Information Technology.
Number of certified IPs
Percent of IPs certified
EIPs (MEE)
93
3.7%
138
5.4%
46(100 in 2020)
Circular economy demonstration parks
(NDRC)Green IPs (MIIT)
1.8%(3.9% in 2020)
21

The evidence suggests that Chinese EIP standards have generally been effective in fostering the greening of IPs. Table 2.2 shows a substantial improvement in the environmental performance of green-certified IPs in China between 2011 and 2015. For instance, the average energy consumption per unit of industrial added value among the certified parks has declined by almost one-third, providing evidence of a successful decoupling of growth in industrial output and its environmental impact (Shi et al. 2016).
Table 2.2 Environmental performance improvement of EIPs and circular economy demonstration pilot parks in China, 2011-15
Figure 2.2 Number of “green-certified” IPs in China regulated by MEE, MIIT, and NRDC
Sources: World Bank calculations based on NDRC (2018); MIIT (2017, 2018); and MEE (2018); projections for 2020 from MIIT (2017). Note: The number of NDRC-certified “circular economy demonstration” IPs is calculated based on the annual announce-ments (2012−18) by the NDRC on the list of certified parks [NDRC and MOF (2014, 2017a, 2018); NDRC (2013, 2015a, 2016a)]. One IP (Tianjin Economic-Technological Development Area) holds all three of the certifications, while 8 hold two certifications from MEE and MITT, 11 from MIIT and NDRC, and 14 from MEE and NDRC. The remaining 208 IPs hold one certification from either of the three agencies.
Source: World Bank based on Shi et al. (2016).
70MEE 26
MIIT
NDRC112
8
11411
Environmental performance indicator
Land use per unit of industrial added value
Energy consumption per unit of industrial added value
Fresh water use per unit of industrial added value
Industrial water reuse rate
Comprehensive utilization rate of industrial solid waste
Improvement
↓ by 30.1%
↓ by 32.7%
↓ by 33.6%
↑ to 90%
↑ to 94.1%
22
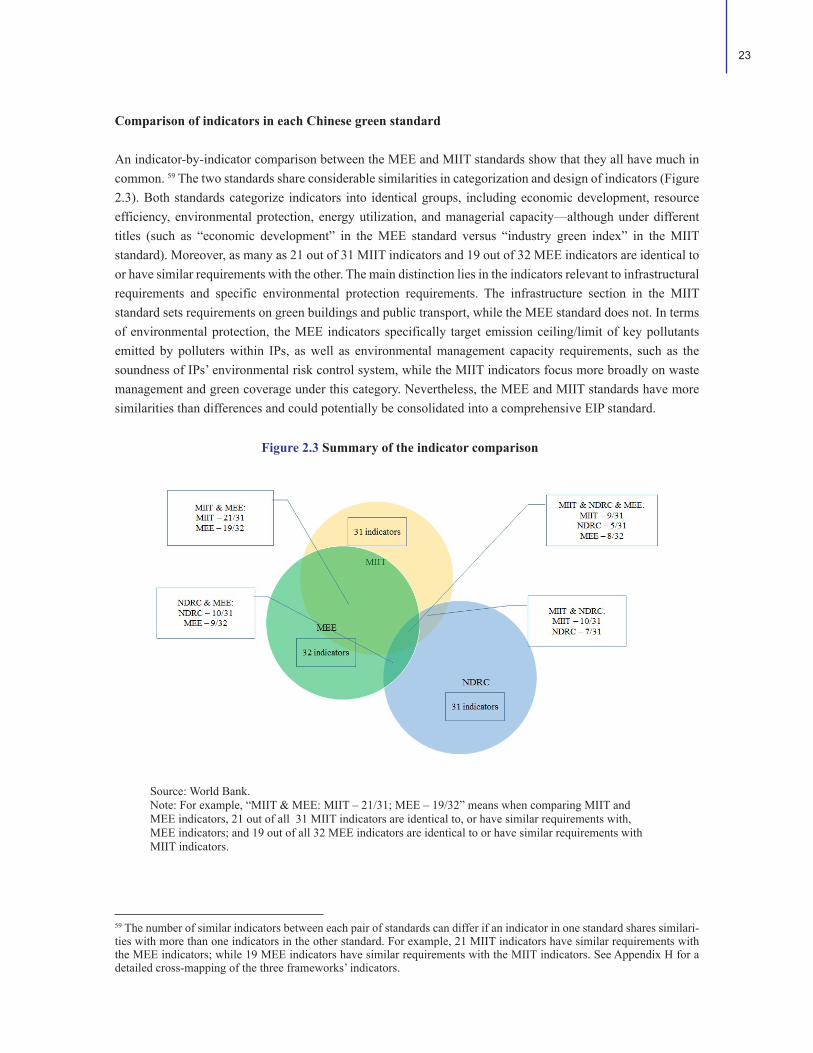
Comparison of indicators in each Chinese green standard
An indicator-by-indicator comparison between the MEE and MIIT standards show that they all have much in common. 59 The two standards share considerable similarities in categorization and design of indicators (Figure 2.3). Both standards categorize indicators into identical groups, including economic development, resource efficiency, environmental protection, energy utilization, and managerial capacity—although under different titles (such as “economic development” in the MEE standard versus “industry green index” in the MIIT standard). Moreover, as many as 21 out of 31 MIIT indicators and 19 out of 32 MEE indicators are identical to or have similar requirements with the other. The main distinction lies in the indicators relevant to infrastructural requirements and specific environmental protection requirements. The infrastructure section in the MIIT standard sets requirements on green buildings and public transport, while the MEE standard does not. In terms of environmental protection, the MEE indicators specifically target emission ceiling/limit of key pollutants emitted by polluters within IPs, as well as environmental management capacity requirements, such as the soundness of IPs’ environmental risk control system, while the MIIT indicators focus more broadly on waste management and green coverage under this category. Nevertheless, the MEE and MIIT standards have more similarities than differences and could potentially be consolidated into a comprehensive EIP standard.
59 The number of similar indicators between each pair of standards can differ if an indicator in one standard shares similari-ties with more than one indicators in the other standard. For example, 21 MIIT indicators have similar requirements with the MEE indicators; while 19 MEE indicators have similar requirements with the MIIT indicators. See Appendix H for a detailed cross-mapping of the three frameworks’ indicators.
Figure 2.3 Summary of the indicator comparison
Source: World Bank.Note: For example, “MIIT & MEE: MIIT – 21/31; MEE – 19/32” means when comparing MIIT and MEE indicators, 21 out of all 31 MIIT indicators are identical to, or have similar requirements with, MEE indicators; and 19 out of all 32 MEE indicators are identical to or have similar requirements with MIIT indicators.
23

The NDRC standard has much less in common with the other standards, as it emphasizes the circular economy performance of IPs. Instead of covering multiple aspects, including managerial, environmental, and economic performance of IPs, similarly to the MIIT and MEE standards, the NDRC standard targets specific aspects of IP management and operation. It therefore shares fewer similar indicators (10 and 7 indicators) with the MEE and MIIT standards but serves its specific function well.
Summary
China has a large industrial sector, an increasingly leading role in combating global environmental challenges such as climate change, and a pioneering experience in adopting regulations and policies for green develop-ment, notably for IPs. This places it among the best positioned countries to take the lead in formulating effec-tive EIP standards that would not only guide the green development and transformation of Chinese IPs, but also serve as a useful reference for the formulation of international EIP standards.
However, the existing Chinese regulatory framework for IPs and EIPs appears relatively complex. For IPs willing to become EIPs, multiple sets of standards by different governmental ministries can create uncertainty about which certification to strive for. While the different standards pursue closely related objectives, the responsible agencies have not yet coordinated and aligned their standards and indicators, which could slow the greening of IPs in China. This suggests a scope for establishing a consolidated set of EIP standards in China, covering all key requirements from various aspects.
In this regard, the EIP Framework jointly adopted by the World Bank Group, UNIDO, and GIZ in 2017 may serve as a useful blueprint for the Chinese authorities to assess their domestic EIP standards and identify oppor-tunities for improvement.60 In the next chapter, a comparative analysis between the Chinese EIP standards and the EIP Framework is conducted to identify the differences between them. Based on this, some recommenda-tions for the Chinese green standards to move toward becoming an internationally exemplary EIP standard are provided.
60 See Appendix I for a presentation of the EIP Framework.
24
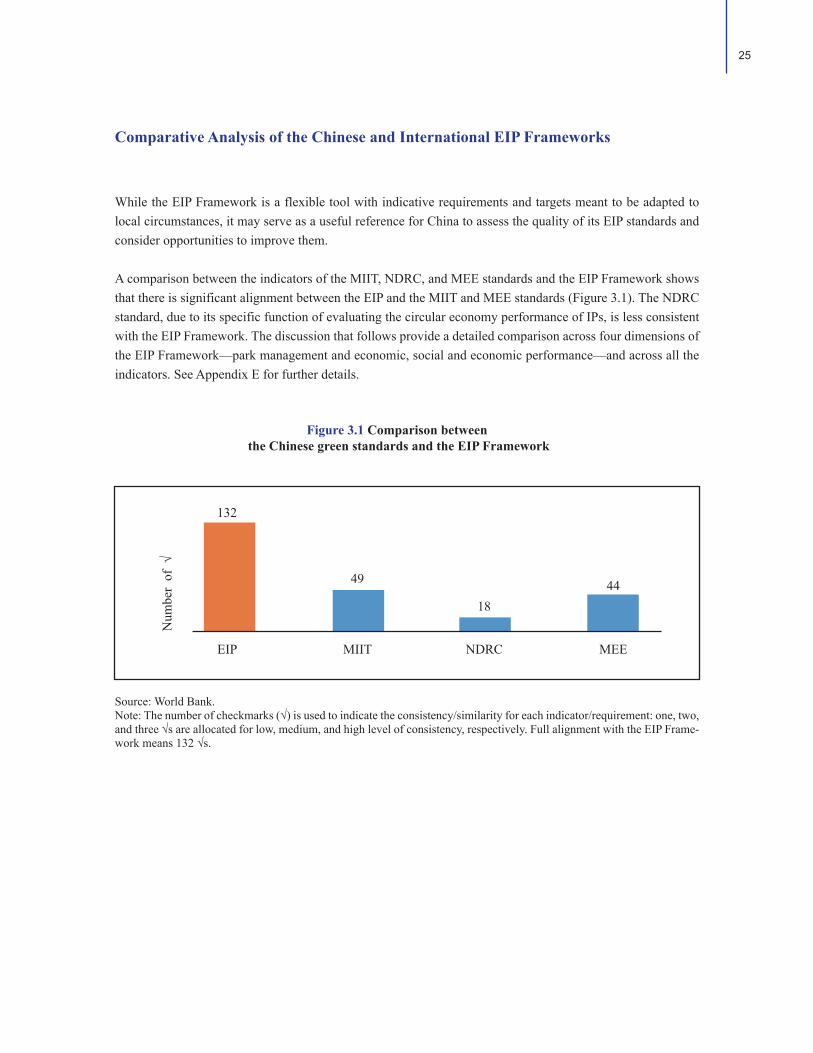
Comparative Analysis of the Chinese and International EIP Frameworks
While the EIP Framework is a flexible tool with indicative requirements and targets meant to be adapted to local circumstances, it may serve as a useful reference for China to assess the quality of its EIP standards and consider opportunities to improve them.
A comparison between the indicators of the MIIT, NDRC, and MEE standards and the EIP Framework shows that there is significant alignment between the EIP and the MIIT and MEE standards (Figure 3.1). The NDRC standard, due to its specific function of evaluating the circular economy performance of IPs, is less consistent with the EIP Framework. The discussion that follows provide a detailed comparison across four dimensions of the EIP Framework—park management and economic, social and economic performance—and across all the indicators. See Appendix E for further details.
Figure 3.1 Comparison between the Chinese green standards and the EIP Framework
Source: World Bank.Note: The number of checkmarks (√) is used to indicate the consistency/similarity for each indicator/requirement: one, two, and three √s are allocated for low, medium, and high level of consistency, respectively. Full alignment with the EIP Frame-work means 132 √s.
Num
ber
of √
132
49
1844
EIP MIIT NDRC MEE
25

3.1 Park management: “General vs. specific” and “implicit vs. explicit” requirements
The MIIT and MEE standards are moderately in line with the EIP Framework regarding park management requirements, while the NDRC standard is less aligned with the EIP Framework.
The preceding examples show that considering both implicit and explicit requirements regarding park manage-ment in the Chinese context, the Chinese standards and the EIP Framework are quite in line with each other. That said, it would be useful for the Chinese authorities to (i) include implicit requirements in the standards to enhance transparency and (ii) describe each requirement in sufficient detail to avoid ambiguity.
61 Indicator MG-30 and 31 of the MIIT standard and EP-20, ID-30, and ID-31 of the MEE standard require IPs to ensure that the IP’s environmental management ability, green IP information platform, and standard system are sufficiently sound.
- General vs. specific: The Chinese standards on park management requirements are rather general, while the EIP Framework sets more specific prerequisites and performance indicators. For example, the EIP Frame-work requires IPs to have specific systems to monitor park performance (tracking IPs’ environmental, social, and economic performance, as well as critical risk factors and related responses) and comply with local/na-tional regulations and international standards. The Chinese standards have similar requirements, 61 but do not describe in detail what specifically is needed to meet the requirements.
- Implicit vs. explicit: The fact that some requirements are included in the EIP Framework but are not included in the Chinese standards does not necessarily mean that Chinese IPs are exempt from these requirements. Some requirements are not explicitly listed in the Chinese standards because they are usually prerequisites for any planned IP to obtain permission for establishment and operation from local, provincial, and national authorities. For instance, while the EIP Framework provides a list of required park property, common infrastructure and services (such as waste and wastewater treatment plants, waste collection areas and services, and maintenance and repair workshops), the Chinese standards do not list these requirements (except for concentrated wastewater treatment facilities in the MIIT and MEE standards, and environmental protection facilities in the NDRC standard). Nonetheless, all Chinese IPs are required to provide all necessary basic infrastructure and common services for resident firms. Depending on specific circumstances in each IP, this may still fall short of the infrastructure needed to address park-level environmental issues emphasized in the EIP Framework. Another example is the EIP Framework requirement of having a dedicated park manage-ment entity to handle park planning, operations and management, and monitoring. Most Chinese IPs are state-owned and an “IP management committee” (under the administration of the municipal government) is empowered to provide the required services.
26

3.2 Environmental performance: “Result-based” vs. “process-based” assessment
The environmental performance section has the most similarities between the Chinese standards and the EIP Framework. Under the goal of building an “ecological civilization,” environmental protection has become a key (if not the key) factor in policy making in the Chinese industrial sector. Requirements targeting environ-mental performance of IPs comprise the largest portion of all three sets of Chinese standards, focusing on subjects similar to the EIP Framework, including resource efficiency, waste management, and pollution control.
Differences still exist with the EIP Framework, which notably requires internationally certified environmen-tal/energy management systems (EMS/EnMS), ecosystem services, monitoring systems for energy consump-tion, sustainable use of water, maximum percentage of waste that is landfilled, and so on. There is nonetheless a considerable degree of consistency between the Chinese standards (especially the MIIT and MEE standards) and the EIP Framework, notably on water reuse efficiency, renewable and clean energy, energy efficiency, waste/by-product reuse and recycling, and pollution prevention and management strategies.
Nevertheless, different approaches are taken by the Chinese standards and the EIP Framework in setting environmental performance requirements. The Chinese standards are largely result-oriented, focusing more on the result of pollution control or resource reuse/recycle (such as the minimum percentage of resource reused, minimum percentage of energy consumption from renewable and clean sources, maximum level of pollutant emissions and waste generation). In turn, the EIP Framework complements outcome-based targets (such as the proportion of solid waste reused) with “process-based” indicators, focusing on the systems and processes established for pollution control and resource efficiency. In addition to overseeing the results of final emission level of pollutants or the total amount of waste generation, the EIP Framework also includes requirements on how to achieve such results. All the prerequisites and almost half of the performance indicators in the EIP Framework directly require IPs and resident firms to set up EMS, monitoring and metering systems, energy recovery and efficiency strategies, resource reuse and environmental assessment plans, carbon intensity and energy intensity targets, and environmental risk management frameworks. These process-focused requirements offer a roadmap that can help IPs and firms achieve environmental protection targets and provide for continu-ous improvement.
China could consider including more process-based indicators in its EIP standards to signal to IPs and firms the systems and processes needed to achieve current and future environmental targets. Future reviews of national EIP standards could also lead to further improvements, such as a stronger focus on the efficient use of materi-als: like the EIP Framework, the Chinese standards include indicators on energy and water efficiency, but mostly consider the efficient use of materials through the angle of industrial waste and its reuse/recycling. In line with circular economy principles, park- and firm-level indicators could be considered to assess results in fostering the third “R” (reduce) and a more sustainable material use (such as “eco-design,” the amount of scarce or polluting raw materials used per unit of output, switching to more sustainable inputs, and adoption of best available technologies). Likewise, China’s EIP standards focus on production processes within IPs and do not consider broader life-cycle impacts, including at the resource extraction, usage, and disposal stages. The Chinese authorities could consider including life-cycle indicators for key products, reflecting efforts and results by IPs and tenant firms to reduce upstream/downstream impacts.
27
3.3 Social performance: “Implicit vs. explicit” and “moral standards vs. legal require-ments”
There are significant differences between the Chinese standards and the EIP Framework regarding social performance requirements. 62 Specifically:
In addition, the EIP Framework has requirements on occupational health and safety (OH&S) management systems, and community dialogue and community outreach, while the Chinese standards do not specifically address such topics.
To further improve the Chinese standards, adjustments could be made to explicitly list all the requirements regarding IPs’ social performance. For harassment-related requirements, explicit rules could be introduced to strengthen harassment prevention and women’s rights, including in the evaluation of IPs. In addition, China could consider including broader labor and social dimensions, such as OH&S management systems, social infrastructure, jobs generated in green industries or through circular economy initiatives, and community outreach activities.
3.4 Economic performance: “Economic standards vs. socioeconomic standards”
The MIIT and MEE standards contain some requirements for assessing the economic performance of IPs. However, apart from one indicator in the MIIT standard, the remaining requirements in the Chinese standards share little consistency with the EIP Framework.
62 The NDRC standard shares no requirement with the EIP Framework on this dimension. The MIIT standard and the EIP Framework have only 1 (out of 2) prerequisite and 1 (out of 8) performance indicators in common with the EIP Frame-work; the MEE standard has no similar requirement with the EIP Framework prerequisites and overlaps with only 2 (out of 8) EIP Framework performance indicators.
‐ Implicit vs. explicit requirements: A functioning management system that ensures the provision of funda-mental social infrastructure and services (such as lighting systems, security systems, and night transporta-tion) is a necessary requirement for an IP to be established. Accordingly, some of the requirements in the EIP Framework are not explicitly listed in the Chinese standards but apply to Chinese IPs.
‐ Cultural norms vs. legal requirements: The absence in Chinese standards of EIP Framework indicators on sexual harassment and skills/vocational training of women could partly be attributed to cultural differences. The more conservative nature of the Chinese culture has, to some extent, made topics such as harassment prevention and women’s rights less explicitly or openly discussed by the Chinese public, which tends to see these more as moral standards and less as legal requirements. If harassment occurs, it is more often dealt with using social customs rather than legal regulations.
28

A prominent reason is that the Chinese standards and the EIP Framework have a different perspective on the measurement of economic performance of IPs. The evaluation criteria used by the Chinese standards focus on the economic output of IPs, with a concentration on industrial output and industrial added value (such as indus-trial added value generated from reuse and recycling of resources, industrial output from high-tech firms, and industrial added value growth rate). In turn, instead of measuring the economic performance of the IPs them-selves, the EIP Framework emphasizes the socioeconomic effect of IPs on local economic and social develop-ment (such as requirements to generate local employment, provide local businesses with opportunities to grow, and promote local SMEs). In other words, the EIP Framework assesses the overall socioeconomic performance of IPs beyond the park level.
Going forward, the Chinese standards could productively broaden their coverage to include indicators on local economic and social development. Summary
The Chinese EIP standards are quite comprehensive and cover key requirements for the evaluation and promo-tion of EIPs. However, the comparative analysis of the Chinese green standards and the EIP Framework reveals several differences (Table 3.1). The differences are largely a result of a different perspective on the functions of IPs and a stronger reliance of the Chinese standards on other standards and legislation.
The comparison with the EIP Framework suggests the areas where the Chinese standards could be further improved. These include the need to increase transparency, make certain standards more explicit and introduce specific legislation on women’s rights. Table 3.1 provides specific recommendations. If adopted, the Chinese standards would be strengthened and could become a blueprint for other countries.
29
Table 3.1 Summary of the comparative analysis between the EIP Framework and Chinese standards
Identified differencesGeneral vs. specific requirements: The Chinese standards on park management requirements are rather general, while the EIP Framework sets more specific prereq-uisites and performance indicators.Implicit vs. explicit requirements: The fact that some requirements are included in the EIP Framework but are not included in the Chinese standards does not necessarily mean that Chinese IPs are exempt from these requirements. They are not explicitly listed because they are usually prerequi-sites (covered by other legislation or requirements) for any planned IP to obtain permission for establishment and operation from local, provincial, and national author-ities.
Recommendations
Describe each requirement in sufficient detail to avoid any ambiguity.
Include both implicit and explicit requirements in the Chinese standards to enhance transparency.
Park management

Note: EIP = eco-industrial park; IP = industrial park; OS&H = occupational health and safety.
Identified differencesResult-based vs. process-based approaches to environmental management: The Chinese standards are largely result-based and focus more on the result of pollution control or resource reuse/recycle. In addition to outcome-based targets, the EIP Framework covers process-based indica-tors focusing on the systems and processes established for pollution control and resource efficiency. This offers a roadmap that can help IPs and firms achieve environmental protection targets and provide for continuous improvement.Implicit vs. explicit requirements: Some requirements are in place but are not explicitly listed in the Chinese standards because they are usually prerequisites (covered under other pieces of legislation or requirements) for any planned IP to obtain permission for establishment and operation from local, provincial, and national authorities.Cultural norms vs. legal requirements: The general public in China tends to see harass-ment prevention and the protection of women’s welfare more as moral standards and less as legal requirements. Within an IP, if harassment occurs, it is more often dealt with by using social customs rather than legal regulations.The EIP Framework requirements on OH&S management systems, community dialogue, and community outreach are not specifically addressed by the Chinese standards.Economic standards vs. socioeconomic standards: The Chinese standards and the EIP Framework have different emphasis and definitions of IPs’ economic perfor-mance. The evaluation criteria used by the Chinese standards focus specifically on the economic output of IPs, such as industrial output and industrial added value; the EIP Framework emphasizes IPs’ socioeconom-ic impacts on local economic and social development.
Recommendations
Include more process-based indicators in Chinese standards to signal to IPs and firms the systems and process needed to achieve current and future environmental targets.
Assess possibilities to make require-ments more specific to avoid any ambiguity.
Introduce explicit rules to strengthen harassment prevention and women’s rights in the management and evalua-tion of IPs.
Include broader labor and social dimensions, such as OH&S manage-ment systems and community outreach activities in the Chinese standards.
The Chinese standards could produc-tively broaden their coverage to include indicators on the local economic and social development.
Social performance
Economic performance
30
Environmental
performance
This chapter analyzes the result of the first application of the EIP Framework in China, using the Fuzhou High-Tech Industrial Zone (FHTZ) as a case study. The main objectives of this analysis are to (i) identify the key challenges faced by the Chinese IPs to move toward complying with the EIP framework and (ii) use the results of the case study as a reference for further upgrading of Chinese standards to better promote green development and transformation of IPs.
4.1 Overview of FHTZ
FHTZ is located in eastern China, in Fuzhou, Jiangxi Province. It was established in August 1992. It has a total area of 21.48 square kilometers, which comprises about 270 tenant firms and over 30,000 employees. The zone has a mix of sectors, including automobile and auto parts, bio-pharmaceuticals, and IT instrument and equip-ment as its leading industries. They each take up 21.5 percent, 13.7 percent , and 7.4 percent of the total number of firms in the park. 63 In terms of revenues, in 2016, firms in FHTZ generated a total value-added of RMB29.2 billion (US$4.2 billion at the exchange rate on October 15, 2018), and the three leading industries generated 34.2 percent , 15.2 percent , and 20.0 percent of the total revenues, respectively. 64
In February 2015, FHTZ was upgraded to a national-level high-tech zone by the State Council and currently ranks 109 of all 156 national high-tech zones for overall performance in terms of innovation capability. 65 Over the past few years, it has been making efforts to become NDRC-certified “Circular Economy Transformation Demonstration IP” and MIIT-certified “National Green IP.” Compared to the MIIT framework, Fuzhou has advanced in moving toward being eco-friendly in energy utilization and industrialization, but has fallen short of being eco-friendly in resource utilization (see box 4.1). It is continuing the process to be fully certified as a green IP in the future. Efforts completed or underway include the following:
Application of the EIP Framework in the Fuzhou High-Tech Zone
‐ Established a circular economy transformation leadership council‐ Is in the process of producing a circular economy development plan‐ Formed two circular industrial chains (copper processing and construction material)‐ Undertaking clean production audits, with audits for 25 firms completed and 15 underway‐ Started a series of energy conservation and water saving projects‐ Completed various environment- and energy-related projects (such as constructing a concentrated wastewater treatment plant; switching coal-fired boilers to gas; building natural gas pipelines and network; and installing rooftop solar panels)‐ Started the “Internet Plus Smart Park” project with the establishment of online supervision systems on both production and environmental protection‐ Improved pollution prevention and reduction by closing 10 and expelling 2 heavily polluting firms‐ Conducted an environmental impact assessment of all resident firms and established a normalized environ-mental impact supervision platform.
63 Management Committee of Fuzhou High-Tech Industrial Zone (2017).64 Management Committee of Fuzhou High-Tech Industrial Zone (2017).65 The ranking is based on the indicator system constructed by the Ministry of Science and Technology (MOST) and China Academy of Sciences to evaluate the innovation capabilities of national high-tech zones. The system consists of 25 indica-tors divided into five categories: agglomeration of innovation resources; environment of innovation and entrepreneurship; performance of innovation activities; internationalization of innovation; and innovation-driven development. Each national high-tech zone is ranked according to the weighted average of all the scores given to each of the indicators and the weighted average of all scores is used to rank the national high-tech zone in comparison to all the other zones.
31

FHTZ was selected for this case study, as part of cooperation with the World Bank, to become a pilot IP in China’s move toward meeting the EIP Framework. In addition, FHTZ, a national-level IP, is a useful blueprint for most “average” IPs in China, which would have difficulty in meeting stringent national and international standards. Finally, FHTZ’s management has an ambitious plan to become a leading green park in China.
Preliminary assessment results
In May 2018, FHTZ completed a preliminary self-assessment against the EIP Framework (Table 4.1); see Appendix F for detailed results). Although further work is needed to fully flush out the self-assessment on an indicator-by-indicator basis, the preliminary evaluation results indicate great potential for (i) FHTZ to fully comply with the EIP Framework and (ii) for the EIP Framework to serve as a blueprint and reference for the Chinese EIP standards to further improve and better guide the green development of IPs.
Box 4.1 Summary of FHTZ’s self-assessment against the MIIT Framework
In 2018, FHTZ completed a self-assessment against the MIIT Framework of Green Industrial Parks, using data from 2016. It did fairly well in 13 out of the 24 indicators in 6 categories, and fell short of the remaining 11 ones. The gaps were particularly big in the “resource utilization” category, in which FHTZ failed to meet the requirements of 5 indicators: namely, land productivity rate, comprehensive utilization rate of industrial solid waste, recycling rate of industrial water, recycling rate of reclaimed water, and recycling rate of reused resources.
A comparison of FHTZ’s performance under the MIIT Framework and the EIP Framework suggests that under both frameworks, FHTZ fell short of the indicators related to renewable and clean energy; water efficiency, reuse, and recycling; and air, GHG emissions and pollution prevention.
Source: World Bank
32
Table 4.1 Summary of FHTZ’s 2018 self-assessment against the EIP Framework
Source: World Bank.Note: FHTZ = Fuzhou High-Tech Zone.
Management
6/6 (100%)
0
0
2/3 (66.7%)
1/3 (33.3%)
0
Environment
3/6 (50%)
1/6 (16.7%)
2/6 (33.3%)
5/14 (35.7%)
2/14 (14.3%)
7/14 (50%)
Social
2/2 (100%)
0
0
1/11 (9.1%)
10/11 (90.9%)
0
Economic
4/4 (100%)
0
0
0
3/5 (60%)
2/5 (40%)
Prerequisites met
Unclear/lack of data but FHTZ believes it meets
Prerequisites not met OR data not available but FHTZ believes it does not meet
Performance indicators met
Unclear/lack of data but FHTZ believes it meetsDoes not meet performance indicators OR data not available but FHTZ believes it does not meet
Number of indicators and percent
4.2 Compliance barriers
The self-assessment highlights several barriers to achieving full compliance with the EIP Framework (Table 4.1). FHTZ meets most (15/18) of the EIP Framework prerequisites (qualitative standards) across the four categories of the EIP Framework. However, it meets fewer of its performance indicators, which tend to be more quantitative. This reflects one of the leading obstacles for FHTZ to comply with the EIP Framework require-ments – data unavailability. Incomplete infrastructure and insufficient incentives also hamper compliance.
Data unavailability
As many as 18 EIP Framework prerequisites and performance indicators 66 that are not met by FHTZ could be attributed (fully or partly) to the absence of relevant data. FHTZ does not collect data or keep records on firm-level environmental management and risk control strategies (environmental requirements), the efficiency and effectiveness of grievance management, harassment response, park security management, and community outreach (social requirements) at both the firm and park level, as well as local employment generation and local economy promotion in general (economic requirements). FHTZ believes that it meets most of the require-ments, but without the data it is unable to prove it.
FHTZ has a dedicated department in charge of collecting and analyzing park-level statistics. However, most of the data collected measure key economic and environmental performance such as industrial output, income, industrial added value, tax revenue, and energy consumption—in line with municipal and provincial require-ments. However, data beyond municipal or provincial requirements are usually not collected.
FHTZ seems to be well positioned to expand its data collection and meet the EIP requirements, in line with international good practice in park performance monitoring (Box 4.2). The benefits of enhanced monitoring would go beyond the compliance with the EIP standards: they would also help further enhance the park’s efficiency and attractiveness to investors.
Box 4.2 Performance monitoring and data collection systems for EIPs
The establishment and effective implementation of a strong monitoring system, based on sound indica-tors and data collection mechanisms, have been highlighted as key elements to improve EIP perfor-mances and ensure accountability (UNIDO 2017). This system should provide an adequate balance of economic, environmental and social indicators, reflecting the local context and priorities. UNIDO provides further recommendations regarding the choice of indicators, including that they (i) be easy to understand and communicate even to nonexperts; (ii) reflect relevant environmental, social, and economic impacts or benefits that can be influenced at the company and/or park level; and (iii) be based on reliable, available, or easily obtainable data that is updated regularly. Around the world, (eco-)indus-trial parks have followed a wide variety of practices regarding performance monitoring beyond regula-tory requirements. Relatively few parks regularly monitor and publish data on key impacts, especially beyond park boundaries.
66 Data are unavailable for 1 environmental prerequisite and 1 out of 3 managerial indicators, 2 out of 14 environmental indicators, 10 out of 11 social indicators, and 3 out of 5 economic performance indicators.
33
The establishment and effective implementation of a strong monitoring system, based on sound indica-tors and data collection mechanisms, have been highlighted as key elements to improve EIP perfor-mances and ensure accountability (UNIDO 2017). This system should provide an adequate balance of economic, environmental and social indicators, reflecting the local context and priorities. UNIDO provides further recommendations regarding the choice of indicators, including that they (i) be easy to understand and communicate even to nonexperts; (ii) reflect relevant environmental, social, and economic impacts or benefits that can be influenced at the company and/or park level; and (iii) be based on reliable, available, or easily obtainable data that is updated regularly. Around the world, (eco-)indus-trial parks have followed a wide variety of practices regarding performance monitoring beyond regula-tory requirements. Relatively few parks regularly monitor and publish data on key impacts, especially beyond park boundaries.
A good example of the integrated assessment of the economic, social and environmental performances of industrial areas is provided by the Kwinana Industrial Area (KIA), and the broader Western Trade Coast (WTC) industrial region it belongs to, in western Australia. The Kwinana Industries Council (KIC) and WTC Industries Committee have taken the lead in preparing repeated integrated assessments of the industrial region’s environmental, social, and economic impacts. These assessments were published in 1990, 2002, 2007 (for KIA only), and 2014 (for the WTC), allowing trends to be identified over time. These periodic assessments complement more continuous monitoring of key dimensions, such as air and water quality. The scope of the analysis has gradually expanded to cover a large range of issues relevant to the zone and surrounding community. Regarding economic benefits (such as output, jobs and wages, and investment), the latest assessment looked not only at direct impacts from firms located in the zone, but also considered broader local impacts in the surrounding region. For instance, while the WTC was estimated to generate A$15.6 billion in sales and 13,757 jobs, the corre-sponding indirect impacts were A$10,3 billion and 18,274 jobs. On the social side, the assessment notably looked at the composition of the labor force (for example, in terms of gender, age, and residence), employee transportation modes, provision of social services and benefits for employees, skill development, and community engagement. Finally, the report also assessed environmental aspects, including pollution levels, development of resource efficiency/cleaner production, and indus-trial synergies. Another good example is regional regulation of “Ecologically Equipped Industrial Areas” in Italy, which requires the management body of EIPs to perform an analysis of the environment in the area in and surrounding the park, and of the main pressures exerted by industries. This analysis aims to lead to the establishment of a program and action plan to address the main issues, and should be updated at least every three years, or any time a change with significant environmental implications occurs in the park or surrounding area .
Sources: http://www.westerntradecoast.wa.gov.au; https://kic.org.au; WTCIC (2014); UNIDO (2016, 2017); Daddi et al. (2016).Note : EIP = eco-industrial park.
34

Incomplete infrastructure
Specific infrastructure could be improved or added within FHTZ to better comply with certain environmental performance requirements in the EIP Framework. FHTZ fails to meet two EIP Framework environmental prerequisites and three performance indicators due to an absence of internationally certified environmental/en-ergy management systems, waste heat recovery capacity, a monitoring system of the emission of greenhouse gases (GHG) and other pollutants within the park, an energy consumption metering and monitoring system, and sufficient capacity for water and waste reuse.
As explained in the previous section, the Chinese EIP standards that FHTZ and other IPs are striving to comply with generally do not specify required “green infrastructure” (except for wastewater treatment facilities, green building, and public buses in the MIIT and MEE standards). This difference between the Chinese standards and the EIP Framework may contribute to the performance gap of FHTZ against the EIP Framework on this level. Using the EIP Framework as a reference to assess green infrastructure needs could be useful to further the green transformation of FHTZ and other Chinese IPs, and to improve Chinese EIP standards.
Insufficient incentives
Insufficient incentives can explain the gaps between FHTZ’s current performance and several EIP Framework performance indicators, both economic (such as promoting local SMEs) and environmental (such as maintain-ing a functioning EMS/EnMS in line with international standards; more ambitious renewable energy use than the national average level; more aggressive carbon intensity reduction and energy intensity improvement; and waste reuse and appropriate disposal) .
Projects have been designed by FHTZ to move toward meeting requirements in renewable energy use, carbon intensity, and energy efficiency. However, FHTZ management argues that it would be difficult to identify further potential for increasing energy efficiency and the use of renewable energy in the brownfield considering the existing energy use structure (electricity mainly from the grid) and the cost of upgrading or changing the current infrastructure. Incentives to increase the use of renewables and energy efficiency depend on several context-specific regulatory, economic, and technical factors, which should be considered when setting EIP performance standards. These considerations also suggest a role for more awareness raising and technical support to identify profitable investment opportunities in renewable energy and energy efficiency at the park and firm level.
Insufficient incentives to go beyond domestic requirements and standards, or low awareness of the benefits of doing so, can also explain FHTZ’s performance gap in meeting other EIP Framework requirements, such as:
35
- EMS/EnMS in line with international standards:67 FHTZ argues that meeting international standards does not provide sufficient additional incentives in terms of investor attraction, public support and recognition, and economic benefits. Unless specifically required by provincial or national standards, IPs may not voluntarily make efforts to meet such requirements. However, many IPs in China and elsewhere have sought international certification for their EMS and have reaped corresponding environmental and economic benefits, including in terms of attracting additional domestic and foreign investment. (Box 4.3). Sound systems and processes for continuous improvement have been highlighted as a key success factor for EIPs by a global assessment of EIPs in developing and emerging countries conducted by the United Nations Industrial Development Organization (UNIDO 2016). Promoting the adoption of certified EMS/EnMS at the park and firm level could be considered by FHTZ and for Chinese EIP standards.
- Linkages with local businesses: FHTZ benefits the local economy by providing employment, contributing to the local and regional GDP, and stimulating the growth of local enterprises. However, FHTZ explained that tenant firms rarely procure products and services from local enterprises; instead, they source their inputs from the most competitive suppliers in a larger market. The targets for local sourcing in the EIP Framework are indicative, 68 and the appropriate level is context-specific. Such indicators are mostly relevant in countries where foreign-owned companies in IPs or Special Economic Zones largely rely on imported inputs and do not foster significant domestic value addition. This is less of an issue in China, which has successfully fostered linkages between industrial zones/parks and local suppliers to enhance domestic value added and to strengthen the local skills and capacity base. Performance monitoring by FHTZ and other EIPs in China could nonetheless look at local-level efforts to promote more advanced forms of linkages, such as industrial symbiosis, which is a key element of the circular economy and has been successfully fostered through dedicated initiatives in sever-al countries, including China (Box 4.4).
Box 4.3 Environmental management systems and ISO 14000 standards for IEs
Environmental management systems (EMS) can be defined as a system of organizational objectives, policies, and processes adopted by an organization with the aim to achieve domestic environmental compliance but also to continuously improve environmental performance and operating efficiency,including for nonregulated issues. The main elements of sound EMS are defined internationally through the ISO 1400 series of voluntary standards and guidelines. This includes the ISO 14001 standard, for which the organization can self-declare its participation or formally register, which requires verification by an accredited third party. Countries can develop their own schemes to accredit certifiers and approve training programs. The adoption of EMS and ISO 14001 certification have been actively promoted among industrial companies in China since the late 1990s, notably through the adoption of accreditation mechanisms and the designation of pilot regions and cities for the promotion of ISO 14000.
67 The EIP Framework suggests this requirement for firms with at least 250 employees.68 The EIP Framework mentions that local sourcing is to be promoted by EIPs “when appropriate and cost effective to do so.”
36
While generally applied at the level of an individual company, EMS and ISO 14001 can also be adopted by larger organizations, such as industrial estates. This can be done to manage the environmental impact of an estate’s own activities and services, which is mostly relevant if the estate management is responsi-ble for major services, such as common effluent treatment plants (CETPs) and solid waste management facilities. Various industrial estates in countries such as Belgium, France, Germany, Japan, Indonesia, the Philippines, Spain, and Thailand have obtained ISO 14001 certification for their activities over the last two decades. A more ambitious version is that of a comprehensive EMS (CEMS), in which estate management and tenant companies each establish their own certified EMS and adopt joint policies and activities to address common issues at the estate level. Given the possible reluctance or incapacity of some tenant companies (especially SMEs) to invest in a formal EMS, the intermediate option of an “environmental quality charter” has been promoted in France by the association Orée. Estate managers and tenants sign a contractual charter specifying their respective environmental responsibilities and areas of collaboration.
In China, the State Environment Protection Administration (SEPA) launched an IP-wide ISO 14001 demonstration program in 1999. Several industrial estates have been certified since then and have promoted the use of EMS among their tenant companies, which has been credited with improved environmental management as well as diverse economic benefits (including increased attractiveness for foreign investors) and social benefits in these estates. Given the tendency of Chinese industrial estates to be large and include industrial and residential areas, these EMS generally address the environmental impacts of both. For instance, the Dalian Economic and Technological Development Zone (DETDZ) adopted an EMS covering air emission control, integrated management of water and of solid waste, emergency preparedness, and promotion of cleaner production and supported ISO 14001 certification among local enterprises through technical assistance and partial payment of certification costs.
Sources: Geng and Côté (2003); UNEP (2001); FOEN (2014).Note: IP = industrial park; ISO = International Organization for Standardization. For more on ISO 14001 certification, see https://www.iso.org/iso-14001-environmental-management.html
37
Box 4.4 Fostering industrial symbiosis through regional networks
Industrial symbiosis (IS) is the process by which by-products or waste (such as material, water, and heat) from one industry that would otherwise have been discarded become valuable inputs for one or several other industries. This can benefit all parties involved economically and can generate environ-mental gains. There has been an expert debate since this concept emerged in the 1990s to determine what the success drivers of IS are, and whether such relationships between firms could be planned from scratch (Costa and Ferrao 2010). While IS is largely seen as a business-driven process, as in the case of the most famous example of Kalundborg in Denmark, a it is widely recognized that appropriate regulato-ry and institutional frameworks can play an important role to facilitate the emergence of successful symbiotic exchanges. Along with other countries, such as the United Kingdom, Australia, and Korea, China has been one of the countries where policy makers have sought to promote IS over the last two decades.
One approach to do so is the establishment of national/regional IS networks. This arrangement has been successfully implemented in the United Kingdom under the National Industrial Symbiosis Programme (NISP). Inspired by an earlier similar initiative in Mexico, a regional IS network initiative was first piloted in the Humber region in 2000 by the UK Business Council for Sustainable Develop-ment, in cooperation with an academic institution and local business groups. It has subsequently been extended to other regions, and coordinated at the national level under NISP with government funding since 2004.
Activities under the different regional initiatives included convening stakeholders, raising awareness , playing a coordination role to address potential barriers to IS or leverage opportunities/resources (tech-nical, economic, political, informational, social), providing data collection and analysis, offering support to design and implement symbiotic exchanges, and conducting independent impact evalua-tions. The experience has shown that it was essential to identify well-established and capable local institutions and practitioners with deep knowledge of local industries to animate the network, and to ensure the participation of committed champions from key local companies. Moreover, NISP was facilitated by conducive policies (such as a resource productivity policy) and tax incentives (including a climate change levy and a landfill tax and credit), although some regulations hampered IS (such as those restricting the alternative use of waste).
After five years, NISP had over 12,500 member companies (mostly SMEs) and contributed to signifi-cant economic and environmental gains, including reducing the use of virgin material by almost 10 million tons, diverting 7 million tons of waste from landfill, reducing carbon emissions by over 6 million tons, enabling ₤156 million in cost savings and ₤176 million in additional sales for participating firms, creating 3,683 jobs and saving 5,087 ones.b NISP has been recognized as best practice by the EU and has been emulated in several other countries, including Brazil, South Africa,c and Canada.d
38

In China, IS has been included in the scope of EIP development early on. NISP implemented a pilot circular economy project in Yunan Province in 2008, and established a partnership with the Tianjin Economic Development Area (TEDA) in 2010 to develop an IS network in the surrounding Tianjin Binhai New Area (TBNA), as a step toward introducing this approach nation-wide. However, this coop-eration initially struggled to generate broad interest from local companies, due to a less conducive policy environment compared to the United Kingdom (including lack of regulatory or fiscal disincen-tives to engage in landfilling). Between 2010 and 2013, the program was nonetheless credited with having facilitated 99 synergies and diverted 1,430,000 tons of material from landfill.e The Eco-Center established by TEDA management to implement the program was maintained after its completion to continue promoting industrial symbiosis and other environmentally sound business practices in TBNA.f Beside TEDA, other IPs in China have had a long and successful experience fostering IS, such as the Rizhao Economic Technological Development Area (REDA) (Yu, Han, and Cui 2015).
Sources: Mirata (2004); Laybourn and Morrissey (2009); Costa and Ferrao (2010); Wang, Deutz, and Gibbs (2015); Wang, Deutz, and Chen (2017); Yu, Han, and Cui (2015).a. http://www.symbiosis.dk/en/.b. https://www.international-synergies.com/project-types/government c. http://greencape.co.za/wisp/.d. http://nispcanada.ca.e. It must be noted, however, that a substantial IS base had already been developed in TEDA since the 1990s, with active involvement of TEDA management, notably with the establishment of a dedicated information platform to facilitate by-product exchanges among tenants (Geng, Haight, and Zhu 2007; Shi, Chertow, and Song 2010).f. http://www.ecoteda.org/english/.
39

40
Fiscal and financial instruments to promote and develop EIPs
The experience in China and beyond shows that IPs and their tenant firms do not always have the information, technical capacity, and financial capacity necessary to improve their environmental performance and shift toward an EIP model. This section assesses the set of fiscal incentives and financial instruments used by MIIT, NDRC, and MEE to foster this shift, assesses their strengths, and offers ideas for further improvement.
5.1 Evaluation of the incentive frameworks of the Chinese EIP standards
MEE
‐ Supportive financial policies using provincial/local public finance
The Guidelines on the Management of National Eco-Industrial Parks briefly state that provincial and local governments, as well as their environmental protection departments, should formulate supportive policies for EIPs to prioritize projects such as infrastructure for pollution prevention and control, energy/resources efficien-cy and eco-industrial chains (MEE, MOC, and MOST 2015). Specific supportive funds or preferential taxation policies should also be in place to support such projects.
In December 2011,69 MEE, MOFCOM, and MOST published more comprehensive guidelines on the incentive framework for supporting EIPs.70 The Guiding Notice encourages public funds for energy conservation and emission reduction, green development, technological innovation, and environmental protection at the provin-cial and local level to support EIPs. It also encourages the establishment of public funds that specifically support EIP development. Loans with preferential interest rate and preferential taxation policy are also required to be in place to assist key projects and research within EIPs. In addition, the Guiding Notice also encourages IPs to establish “special construction funds” for EIP development to support projects on park planning, infrastructure sharing, and industrial symbiosis, as well as the capacity building of IPs (for example, through information sharing platform, consulting services, innovation activities, and R&D).
‐ Financing from financial institutions and other private sources
In addition to financial support from provincial/local public finance, the Guiding Notice also proposes to guide and promote financial institutions to provide financial support for the development of EIPs. Domestic and foreign private investors are encouraged to participate and assist the construction of EIPs.
69 The Ministry of Environmental Protection (MEP) at that time.70 Guiding Notice on Strengthening the Development of National Eco-Industrial Parks (MEE, MOC, and MOST 2011). EIPs here mean MEE-certified “National Demonstration Eco-Industrial Parks” (国家生态工业示范园区).
41

‐ Nonfinancial incentives
In addition to financial support provided to EIPs, nonfinancial incentives are also in place. The Guiding Notice proposes to improve the “evaluation system for the comprehensive development of national development zones” by including the establishment of EIPs as a key indicator. Provincial and local departments of commerce are required to include indicators relevant to the construction of EIPs in the assessment of industrial zones’ “investment/business environment and competitiveness,” and gradually increase the weight of such indicators. EIPs with notable performances will be honored and awarded. However, it is not clear how well these incentives have worked so far.
NDRC and MOF
‐ Direct subsidies from NDRC and MOF
Unlike indirect support from the MEE, the NDRC, working together with MOF, provides direct financial support for selected green transformation projects proposed by demonstration IPs. 71 Each year, interested IPs are required to draft an Implementation Plan for Circular Economy Transformation according to the published guidelines. 72 Through assessment and recommendation at the provincial level, and evaluation and selection by the NDRC and MOF at national level, certain investment projects in the implementation plans proposed by IPs are financially supported by the MOF and NDRC using funds from the central government’s budget.
‐ General fiscal and financial support from public finance and public-private partnership
In April 2017, NDRC, together with 13 other government ministries and departments, 73 adopted An Action Plan for Leading Circular Economy Development, in which “circular economy transformation of IPs” is one of the key projects (NRDC 2017). The Action Plan proposes to financially support projects relevant to circular economy transformation and development with funds from public finance, as well as the leveraging of private capital through public-private partnerships (PPPs). It also proposes to promote the use of green finance, includ-ing green credits, bonds, insurance funds, and industry funds, to support circular economy transformation projects.
NDRC also provides financial support to circular economy transformation projects. Akin to the MIIT incentive framework, NDRC provides incentives (including access to green finance) for both IPs and tenant firms for the promotion of circular economy, although the link between getting access to financial support and residing in green-certified IPs is not explicitly specified.
MIIT
‐ Supportive fiscal/financial policy at the national and provincial level
According to the Notice on the Establishment of a Green Manufacturing System, which sets the MIIT’s green IP standard, the MIIT “will use ‘funds for industrial transformation and upgrade’, special funds for
71 Notice on Recommending Key Candidate Industrial Parks for Circular Economy Transformation in 2017 (NDRC and MOF 2017b).72 Guideline for Industrial Parks on Drafting Implementation Plan for Circular Economy Transformation.(NDRC and MOF 2017b; NDRC 2015b)73 MOST, MIIT, MOF, MEE, MOC, Ministry of Natural Resources, Ministry of Housing and Urban-Rural Development, Ministry of Water Resources, Ministry of Agriculture and Rural Affairs, State-owned Assets Supervision and Administra-tion Commission of the State Council, State Administration of Taxation, National Bureau of Statistics, National Forestry and Grassland Administration.
42
74 See the Plan for Industrial Green Development (2016−2020) (MIIT 2016c); Implementation Plan for the 2016 Action on Green Manufacturing (MIIT 2016a); and Notice on Establishing the Integration of Green Manufacturing Systems (MIIT and MOF 2016).75 Including budgetary resources from the central government ; special funds for construction; other funds relevant to technological transformation, energy conservation and emission reduction, and clean production; preferential taxation policy; government procurement of green products; and financing from public-private partnerships.76 Including expanding the scale of green credits and green bonds, establishing green industry development funds, innovat-ing new green financial instruments and services, linking “green performance” of firms to their credit rating, and encourag-ing financial institutions to provide more convenient and preferential credit support and guarantee service for the green transformation of SMEs.77 Strategic Cooperation Agreement on Jointly Promoting the Implementation of the ‘Made in China 2025 Strategy’ (MIIT and CDB 2016). 78 Notice on Recommending Key Green Credit Projects of Industrial Energy Conservation and Green Development in 2017 (MIIT and CDB 2017).
industrial transformation and upgrade’, special funds for construction, green credits, and other supportive financial policies to assist the building of a green manufacturing system (including green factories, green products, green industrial parks, and green industrial chains)” (MITT 2016d). Furthermore, products from the green manufacturing system are prioritized in government procurement. Other relevant documents from MIIT74 emphasize the objective to promote the development of green IPs and firms through supportive fiscal instruments75 and green finance. Provincial government and financial76 institutions are equally required to support such projects.
‐ Credit support through cooperation with China Development Bank (CDB)
In November 2016, MIIT and CDB reached an agreement to offer credit support for the “Made in China 2025 Strategy,” which includes the development of green factories, firms, and IPs. 77 CDB will provide no less than RMB 300 billion of financing during the 13th Five Year Plan period (2016−2020) for selected projects in the form of loans, investment, bonds, leasing, and securities. MIIT and CDB subsequently clarified priority project categories, including resource efficiency and green transformation of industrial production (with the establish-ment of green factories, IPs, and industrial chains as key priorities); digitalization of energy management; clean production; and comprehensive utilization of resources 78—all of which are closely related to EIPs and are in line with the requirements in both the Chinese standards and the EIP Framework. The maturity of CDB loans is 5 to 10 years, and both firms and IPs are encouraged to apply. Application should be submitted to provincial Department of Industry and Information Technology (DIIT) first and be evaluated by provincial DIIT and CDB branch. Shortlisted projects (no more than 10 projects per province) are then recommended to MIIT. CDB decides which projects to offer green credits to, as well as the amount of loans.
In summary, MIIT has a broad array of instruments in place to promote the green transformation and develop-ment of IPs, their compliance with the MIIT green IP standards, and more generally, the building of the green manufacturing system. Supportive policies and financing are provided from government departments at both the national and provincial level, as well as from green finance, including from CDB. Sources of financial support are diverse, and incentives are provided for both firms and IPs. Importantly, a link between getting access to financial support for firms and residing in green-certified IPs is established.
Summary
All three Chinese green standard-makers have a broad set of policy instruments in place to promote indirect compliance with the Chinese green standards, and the green transformation and development of IPs overall. The sources of incentives are various, including direct subsidies from the central government’s budget; supportive fiscal policies from national, provincial, and local governments; financing from financial institu-tions; and preferential tax rates and interest rates (for loans); as well as nonfinancial incentives. To enhance
43

79 EDGE (Excellence in Design for Greater Efficiencies), is a green building certification system developed by the Interna-tional Finance Corporation (IFC), part of the World Bank Group, to promote resource-efficiency in building design. More information on: https://www.edgebuildings.com/marketing/edge/ 80 LEED (Leadership in Energy and Environmental Design) is a green building rating system developed by the U.S. Green Building Council. More information on: https://new.usgbc.org/leed81 Opinions on Enforcing Environmental Protection Regulations and Preventing Credit Risks (CBRC, PBoC, and MEP 2007). 82 Guideline on Establishing a Green Finance System (PBoC et al. 2016). 83 For an overview, see, for instance, IIGF and UNEP (2017).
the efficiency of public financing, it will be important to ensure that the different fiscal incentives to support EIPs adopted in recent years are not duplicative but complementary, and are regularly evaluated to ensure value-for-money.
Most of the incentives are provided for both IPs and firms, but these are often separate. A more explicit link could thus be established between the provision of incentives for firms and their location in an EIP. This would provide additional incentives for IPs to comply with the green standards because in addition to the incentives for parks themselves, resident firms within parks would also expect to comply with green standards to get access to additional financial support. IPs with a larger percentage of resident firms that are green-certified ( for such standards as EDGE79 , LEED80 , ISO14001/5001) or have demonstrated other efforts in green transfor-mation and upgrade could be prioritized for financial support, which could potentially strengthen incentives for both IPs and firms. Finally, it would also be useful to provide direct incentives to parks for compliance with the MEE and MIIT green standards, in the form of, for instance, direct subsidies, akin to those provided by NDRC.
5.2 Green finance for the green transformation and development of IPs in China
The Chinese authorities have increasingly considered green finance as an important tool to support the large investments required to build an “ecological civilization” in China. One of the first government documents relevant to green finance was jointly published by the China Banking Regulatory Commission (CBRC), People’s Bank of China (PBoC), and the Ministry of Environmental Protection (MEP) in July 2007. 81 The Opinions explicitly required that bank loans should preferentially support green industries that promote circu-lar economy development, energy efficiency, and pollution reduction, while strictly limiting the provision of bank loans to industries with high pollution and emissions. Subsequently, a comprehensive and consolidated policy framework to establish a green financial system was adopted by seven government ministries and departments in 2016. 82
Since then, green finance has developed rapidly in China, making it one of its leading green financial markets worldwide.83 For instance, Chinese green bond issuance aligned with international definitions reached US$22.9 billion in 2017, accounting for 15 percent of the record US$155.5 global issuance and making China the second largest green bond market behind the United States (Climate Bonds Initiative 2018). China’s green credit takes up about 90 percent of the total green financial market (Yicai.com 2018). By the end of 2017, the balance of green credit issued by 21 major Chinese banking institutions was about 8.5 trillion RMB, totaling approximately 9 percent of the total credit balance (Yicai.com 2018).
This section presents key green finance instruments most closely related to EIP promotion and development in China, namely green credit, green bonds, green development funds, and international cooperation.
44
84 Notice on Guiding the Use of Green Credits (CBRC 2012); Statistical System of Green Credit (CBRC 2013).85 Notice on Issuing Key Evaluation Indicators of Issuing Green Credit (CBRC 2014). 86 Notice on Recommending Key Green Credits Projects of Industrial Energy Saving and Green Development in 2017 (MIIT and CDB 2017). See also CSRC 2017.87 Guideline on the Issuance of Green Bonds (NDRC 2015c). 88 These are special-purpose funds run by different central government departments (专项建设基金).
Green credit
Green credit is a major area of green finance in China, which has grown rapidly in recent years and has received significant policy support. Under the instructions of CBRC, banks are required to increase lending to green projects, and banking regulatory commissions at all levels are required to enhance their regulatory activities in the area of green credit. Moreover, to promote transparency and enhance supervision of banks, CBRC has formulated the Statistical System of Green Credit,84 requiring banks to collect and disclose data on their loans to firms with significant risks in environment and security, as well as on their loans to projects and services in energy conservation and environmental protection (CBRC 2013). Lastly, to further incentivize banks in issuing green credit, CBRC has created an evaluation system of green banks and designed a set of qualitative and quan-titative indicators for performance appraisal and evaluation, such as whether the bank has established its strate-gy, goal, and specific measures for developing green credit, and whether the bank has classified its clients according to environmental and social risks when issuing loans.85
In the current green credit policy system, projects supporting environmental protection, resource efficiency, clean energy, green production, and green transportation and building are the ones that get the most support. Industrial parks are highly encouraged to apply. For example, in 2016, ten Chinese commercial banks signed a memorandum with the Shanghai Municipal Economic and Information Commission agreeing to provide RMB 50 billion in loans to key green transformation projects within IPs during the implementation of the 13th Five-Year Plan period (2016−2020) (People.cn 2016). This is by far the largest green credit program that specifically targets the promotion of green IPs. In another example, in 2017, MIIT and China Development Bank (CDB) jointly launched a program for developing green credits for projects in key areas of energy conser-vation and green development; green industrial parks are given priority in getting loans compared to other parks meeting all the same other conditions. 86
Green bonds
In December 2015, the NDRC initiated the use of green bonds in the Chinese financial market by allowing firms to issue green bonds to finance green development projects.87 The NDRC adopted guidelines, which specify preferential policies such as a higher maximum proportion of capital collected through green bonds in total investments or exemption from regular quota restrictions on bond issuance to encourage and promote the use of green bonds among local governments. In addition, local governments are required to actively guide private investors to participate in green projects and support the issuance of green bonds and the implementa-tion of green projects through investment aid, interest subsidy, and direct capital injection. Lastly, a combina-tion of green bonds and special construction funds for investment in EIP infrastructure is encouraged: green projects that have already issued green bonds are prioritized in receiving special construction funds. 88
Several key project types mentioned in the NDRC’s Guidelines are relevant for EIPs, including technological upgrade for resource efficiency and emission reduction, energy efficiency, renewable energy, circular economy upgrade, pollution prevention and waste disposal, and “ecological civilization” and low-carbon demonstration zones. Some IPs have already issued green bonds. For instance, Shanghai Lingang Economic Development Co. Ltd., which develops and operates IPs, issued a US$160 million bond in March 2018 to finance the construc-tion of green-certified office buildings in a selected IP (Climate Bonds Initiative 2018).
45

89 Guideline on Establishing a Green Finance System (PBoC et al. 2016).90 Presentation of Dr. Ma Jun at the Green Finance Workshop organized by the World Bank on June 26, 2018.91 Presentation given by Ma’anshan Rural Commercial Bank at the Green Finance Workshop held by the World Bank in Beijing on June 26, 2018.
Green development funds
Green development funds to be established at different administrative levels are the third financial instrument for promoting the development of EIPs. 89 China plans to combine existing funds for environmental protection into a national green development fund and invest in green industries. The central government also encourages financially capable local governments to establish regional green development funds.
By the end of 2016, more than 50 green development funds have been established by various provincial and municipal governments, including Zhejiang Industrial Fund, Guangdong Environmental Protection Fund, and Xinjiang Green Industrial Fund at the provincial level, and Pu’er (Yunan) Green Economic Development Fund, Zhangjiakou (Hebei) Green Industrial Development Fund, and Xin’anjiang (Anhui) Green Development Fund at the municipal level (Sohu.com 2018).
Nongovernmental green development funds of various types (established by domestic and foreign investors) are also supported. For example, the US-China Green Fund was announced in the US-China Strategic and Economic Dialogue in 2016 and managed by US-China Green Investment Management Ltd (US-China Green Fund 2017). China Green Energy Development Fund was founded by China Green Fund, the Academy of China Energy at Peking University, and Beijing Meilinfudi Energy and Technology Consulting Company (China Green Times 2011). As of the end of 2017, there were about 250 green funds (governmental and nongovernmental) located in all provinces across the country. 90
Green financing from international institutions
In addition to domestic sources, international institutions are also an increasingly important option for financ-ing green development in China. The Guideline on Establishing a Green Finance System encourages coopera-tion on green finance with international partners and institutions (PBoC et al. 2016). Joint-venture green devel-opment funds are also encouraged to be established together with foreign investors.
The Chinese government has, for instance, worked closely with the World Bank Group on green finance. The Bank’s US$200 million lending project on green infrastructural improvement in FHTZ (under preparation) is an ongoing example. A green finance project between the International Finance Corporation (IFC) and the Ma’anshan municipal government (Anhui Province) also started in 2017 to establish the first small and medium commercial bank in China (Ma’anshan Rural Commercial Bank), with green finance as its core business. In 2017, the total scale of Ma’anshan Rural Commercial Bank’s 164 green loans amounted to RMB2.05 billion, covering areas such as renewable energy, water pollution prevention, green building, green agriculture, and energy efficiency. The current scale of the 23 green loans in 2018 has reached RMB 1.22 billion.91 Three to five similar “green commercial banks” are expected to be established through joint efforts by the IFC and Chinese commercial banks (Wei 2017).
46
Summary
As China continues to develop its green financial system, it is important to ensure that green finance is fully leveraged to support the development of EIPs. Among other general issues for the implementation of green finance, this will require (i) coordination with the different EIP standards in place, as well as with industrial and other relevant policies; (ii) increased focus on data collection and the evaluation of green finance initiatives’ impacts; and (iii) capacity building for green finance at the local level for local authorities, financial institu-tions, IPs, and industrial firms alike (IIGF and UNEP 2017). Public fiscal incentives, while important, will not be sufficient for the green development and transformation of Chinese IPs, and will increasingly have to be complemented by commercial and private capital. Green credit and green bonds are promising instruments to help achieve this goal. Likewise, the MOF and NDRC have developed the policy framework for green PPPs (NDRC and MOF 2014), which have grown rapidly and could provide sufficient financing of green infrastruc-ture in EIPs.
47

48
Conclusions and Policy Recommendations
This report reviewed China’s policy and regulatory framework for greening IPs, which will be a key element of building an “ecological civilization.” IPs have become a major source of resource use and pollution, as well as a major generator of waste, but they also offer opportunities to target efforts to mitigate adverse environmen-tal impacts from industries.
An important instrument to guide this process is the definition of national EIP standards. China has been a trailblazer by adopting several such standards in recent years and promoting them at a large scale. While volun-tary, these standards have started to be adopted by a growing, although still small number of Chinese IPs. They can be a way for IPs to effectively reconcile economic, environmental, and social objectives. As various supporting schemes for IPs continue to be rolled out in the coming years, critical implementation issues will have to be addressed, including the mainstreaming of EIPs and building of local capacity in all regions of the country; the strengthening of verification and supervision mechanisms to ensure continuous adherence to the standards by recognized EIPs; and data collection and the quantitative assessment of economic, environmen-tal, and social benefits from EIP models.
This report shows that China’s policy and regulatory framework for EIP promotion is comprehensive and has started to drive the green transformation of IPs. A comparison between the Chinese standards and the EIP Framework recently developed by the World Bank Group, UNIDO, and GIZ confirms that both sets of standards are generally aligned, although there are opportunities to further strengthen Chinese standards by more closely aligning them with the EIP Framework.
As they continue to evolve, the Chinese policy framework and standards for EIP promotion have significant potential to improve the sustainability of industries and to serve as a model internationally. To contribute to this objective, this report proposes the following policy recommendations:
1. Introduce more ambitious targets to increase the number of EIPs. The proportions of MEE-certified, NDRC-certified, and MIIT-certified EIPs are all lower than 5 percent of the total number of IPs in China. MIIT plans to increase the number of green certified parks to 100 by 2020 (which would increase the proportion of MIIT-certified green IPs to 3.9 percent of the total) and the NDRC plans to support “circular economy upgrade projects” in 75 percent of all national parks and in half of all provincial parks. Nonetheless, the achievement of these targets—which could take time and could face challenges in implementation—would still leave many Chinese IPs uncertified. Thus, China could consider setting more ambitious targets to promote EIPs. It could become mandatory, for instance, for all national IPs to gradually achieve compliance with national EIP standards by a specific date, taking the starting points of different IPs into account (for example, 10 percent of all national IPs should achieve compliance by 2020, 50 percent by 2025, and 100 percent by 2030). As part of this effort, it would be useful to scrap limits on the number of parks that can seek EIP certification.
49

2. Consider consolidating, updating, and streamlining EIP standards. The coexistence of three sets of standards managed by different government ministries and with significant overlap leads to a lack of clarity for IP managers and industries. Based on the experience acquired to date with the different standards, a consolidat-ed set of requirements for EIPs could be prepared and adopted. This new standard could include different categories to cover specific aspects emphasized by current standards, such as circularity. In addition, it would be useful to upgrade the scope of requirements and indicator, by, for instance, making all requirements explicit, adding indicators on processes and systems to achieve environmental targets, and developing indicators on the management of social aspects, which would allow the Chinese standards to become more aligned with the EIP Framework and become a global blueprint. Moreover, as recommended in the EIP Framework(Box 6.1), China could adopt a more complex framework that allows for tiering (such as bronze-level, silver-level, and gold-lev-el or one-star, two-star, three-star certification) to encourage competition between EIPs and continuous improvement. This effort could build on the green index used in the MIIT standard, for instance. Lastly, if consolidating the standards proves difficult in the short term, efforts could be made in the meantime to stream-line the disparate and cumbersome application procedures for each of the certificates.
Box 6.1 Example of a tiered EIP certification system
The figure below presents an illustrative example of approach for assessing EIP performance through a tiered certification system. Starting from the understanding that compliance with all applicable interna-tional, national, and local regulations should be the minimum requirement for any IP, this system includes three successive performance levels. Bronze-level certification would be awarded to IPs meet-ing the minimum requirements under the EIP Framework. The silver and gold levels would be reserved to EIPs meeting more stringent requirements. This system would send clearer signals about each EIP’s performance, foster competition among EIPs, and encourage continuous improvement by each individ-ual IP.
Source: WBG, UNIDO, and GIZ (2017), p. 61
50

3 Seek an optimal set of indicators to balance economic competitiveness and environmental protection. An important objective of EIPs is to simultaneously achieve increased economic competitiveness and lower environmental impact. However, when comparing the three sets of Chinese EIP standards among themselves and with the EIP Framework, it is difficult to identify which indicators are best placed to achieve such a balance. Identifying an optimal set of indicators and targets, based on the economic modelling of IP’s economic and environmental performance and marginal trade-offs between them, would be useful.
4. Improve data collection and analysis systems to track IP performance against domestic and interna-tional EIP standards and expand access to information. Robust performance monitoring is key to track IPs’ progress against all environmental, social, and economic goals and EIP requirements, and to ensure transparen-cy and accountability. However, the comparative analysis and FHTZ case study suggest that management of Chinese IPs often does not have access to sufficient data to conduct such monitoring. To address this issue, China could put more emphasis on park-level data collection systems for EIP compliance. This could include the requirement for EIPs to conduct periodic assessments of economic, social, and environmental impacts within and beyond park gates, or to establish real-time environmental monitoring systems and publish the data collected on a common platform that would enable a comparison of IPs based on their environmental perfor-mance. Such results could be summarized in a yearly environmental report, a common platform, or a nation-wide ranking, which could help enhance park performance transparency and public engagement, strengthen incentives to improve environmental performance, and help build consensus on which indicators should be monitored and enforced at the institutional level.
5. Strengthen enforcement of existing regulations. While China has made considerable progress in building a comprehensive green regulatory framework for industrial parks, many of the regulations are not always fully enforced. This is because of several reasons, including insufficient administrative capacity, lack of clarity of the regulations or lack of strong incentives for local authorities to enforce the environmental regulations if they could undermine economic targets. The solution could be to further strengthen the local government capacity by allocating additional resources and providing relevant trainings, simplifying the regulations, and enhancing the transparency of IPs’ environmental performance to “name and shame” those IPs that do not meet the standards. Finally, a stronger central government’s supervision over IPs performance could also be useful.
6. Consider adopting a specific Law on IP Management. Although China has a comprehensive regulatory framework in place, it seems to suffer from excessive complexity, fragmentation, and possible duplication. To alleviate these concerns, the adoption of a stand-alone legislative act to promote efficient management of IPs and support their green transformation may be beneficial. Several countries, such as Korea, Turkey, and Vietnam, have adopted such laws to provide a clearer and more systematic legislative framework and could share their experience with China.
51

7. Leverage green finance for EIP development. As China continues to develop its green financial system, it will be important to ensure that green finance is fully leveraged to support the development of EIPs. The policy push to develop green credit, bonds, and PPPs should be well coordinated with the EIP strategy to ensure that sufficient financial resources can be channeled to meet the large need for green infrastructure projects in EIPs. To start, the main green credit and green bond initiatives could be reviewed to ensure that they give priority to projects supporting the greening of IPs and their tenants.
52

App
endi
xes
Plea
se n
ote
that
the
Engl
ish
trans
latio
n in
the
appe
ndix
es is
mea
nt o
nly
as a
refe
renc
e fo
r non
-Chi
nese
spea
kers
. Ple
ase
refe
r to
the
orig
inal
Chi
nese
text
s for
any
cla
rific
atio
ns.
App
endi
x A
. Reg
ulat
ory
fram
ewor
k of
IP m
anag
emen
t and
EIP
pro
mot
ion
in C
hina
Arti
cle
I-6:
“Fi
rms a
nd e
nter
pris
es sh
ould
pre
vent
or r
educ
e en
viro
nmen
tal
pollu
tion
and
ecol
ogic
al d
egra
datio
n, a
nd sh
ould
be
lega
lly re
spon
sibl
e fo
r the
da
mag
e ca
used
.”
Arti
cle
II-1
9: “
Any
indu
stria
l pro
ject
whi
ch w
ould
pot
entia
lly c
ause
env
ironm
en-
tal i
mpa
cts s
houl
d b
e ap
prov
ed b
y an
env
ironm
enta
l im
pact
ass
essm
ent (
EIA
).”
Arti
cle
IV-4
0: “
Firm
s and
ent
erpr
ises
shou
ld p
riorit
ize
the
use
of c
lean
ene
rgy,
le
ss-p
ollu
ting
tech
nolo
gies
and
equ
ipm
ent,
and
tech
nolo
gies
that
ena
ble
com
pre-
hens
ive
use
and
harm
less
dis
posa
l of w
aste
.”
Arti
cle
IV-4
1: “
Indu
stria
l pro
ject
s sho
uld
be c
onst
ruct
ed to
geth
er w
ith p
ollu
tion
cont
rol f
acili
ties,
and
shou
ld b
e de
sign
ed, i
nsta
lled,
and
app
lied
sim
ulta
neou
sly.
”
Arti
cle
IV-4
2: “
Ente
rpris
es th
at p
rodu
ce p
ollu
tion
shou
ld p
erfo
rm d
ue d
ilige
nce
in
prev
entin
g an
d co
ntro
lling
the
prod
uctio
n of
was
te g
as, w
aste
wat
er, s
olid
was
te,
etc.
”
Arti
cle
IV-4
6: “
The
use
and
sale
of i
ndus
trial
tech
nolo
gies
, equ
ipm
ent,
and
prod
ucts
whi
ch c
ause
seve
re e
nviro
nmen
tal p
ollu
tion
are
stric
tly fo
rbid
den.
”
Cha
pter
VI:
“Ent
erpr
ises
that
vio
late
the
artic
les o
f Law
of E
nviro
nmen
tal
Prot
ectio
n sh
ould
be
held
lega
lly re
spon
sibl
e ba
sed
on re
leva
nt re
gula
tions
.”
Law
s
Envi
ronm
enta
l
Prot
ectio
n La
w
(NPC
201
5)
NPC
Janu
ary
1, 2
015
53
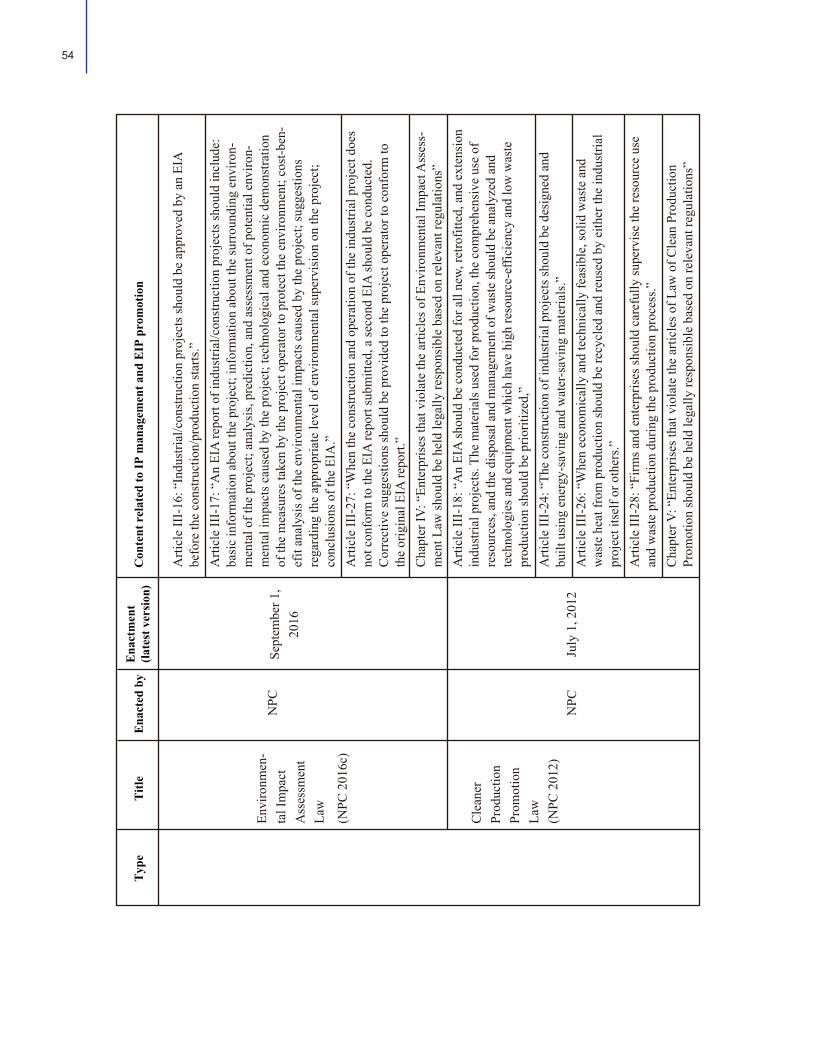
Arti
cle
III-
16: “
Indu
stria
l/con
stru
ctio
n pr
ojec
ts sh
ould
be
appr
oved
by
an E
IA
befo
re th
e co
nstru
ctio
n/pr
oduc
tion
star
ts.”
Arti
cle
III-
17: “
An
EIA
repo
rt of
indu
stria
l/con
stru
ctio
n pr
ojec
ts sh
ould
incl
ude:
ba
sic
info
rmat
ion
abou
t the
pro
ject
; inf
orm
atio
n ab
out t
he su
rrou
ndin
g en
viro
n-m
enta
l of t
he p
roje
ct; a
naly
sis,
pred
ictio
n, a
nd a
sses
smen
t of p
oten
tial e
nviro
n-m
enta
l im
pact
s cau
sed
by th
e pr
ojec
t; te
chno
logi
cal a
nd e
cono
mic
dem
onst
ratio
n of
the
mea
sure
s tak
en b
y th
e pr
ojec
t ope
rato
r to
prot
ect t
he e
nviro
nmen
t; co
st-b
en-
efit
anal
ysis
of t
he e
nviro
nmen
tal i
mpa
cts c
ause
d by
the
proj
ect;
sugg
estio
ns
rega
rdin
g th
e ap
prop
riate
leve
l of e
nviro
nmen
tal s
uper
visi
on o
n th
e pr
ojec
t; co
nclu
sion
s of t
he E
IA.”
Arti
cle
III-
27: “
Whe
n th
e co
nstru
ctio
n an
d op
erat
ion
of th
e in
dust
rial p
roje
ct d
oes
not c
onfo
rm to
the
EIA
repo
rt su
bmitt
ed, a
seco
nd E
IA sh
ould
be
cond
ucte
d.
Cor
rect
ive
sugg
estio
ns sh
ould
be
prov
ided
to th
e pr
ojec
t ope
rato
r to
conf
orm
to
the
orig
inal
EIA
repo
rt.”
Cha
pter
IV: “
Ente
rpris
es th
at v
iola
te th
e ar
ticle
s of E
nviro
nmen
tal I
mpa
ct A
sses
s-m
ent L
aw sh
ould
be
held
lega
lly re
spon
sibl
e ba
sed
on re
leva
nt re
gula
tions
”A
rticl
e II
I-18
: “A
n EI
A sh
ould
be
cond
ucte
d fo
r all
new,
retro
fitte
d, a
nd e
xten
sion
in
dust
rial p
roje
cts.
The
mat
eria
ls u
sed
for p
rodu
ctio
n, th
e co
mpr
ehen
sive
use
of
reso
urce
s, an
d th
e di
spos
al a
nd m
anag
emen
t of w
aste
shou
ld b
e an
alyz
ed a
nd
tech
nolo
gies
and
equ
ipm
ent w
hich
hav
e hi
gh re
sour
ce-e
ffici
ency
and
low
was
te
prod
uctio
n sh
ould
be
prio
ritiz
ed,”
Arti
cle
III-
24: “
The
cons
truct
ion
of in
dust
rial p
roje
cts s
houl
d be
des
igne
d an
d bu
ilt u
sing
ene
rgy-
savi
ng a
nd w
ater
-sav
ing
mat
eria
ls.”
Arti
cle
III-
26: “
Whe
n ec
onom
ical
ly a
nd te
chni
cally
feas
ible
, sol
id w
aste
and
w
aste
hea
t fro
m p
rodu
ctio
n sh
ould
be
recy
cled
and
reus
ed b
y ei
ther
the
indu
stria
l pr
ojec
t its
elf o
r oth
ers.”
Arti
cle
III-
28: “
Firm
s and
ent
erpr
ises
shou
ld c
aref
ully
supe
rvis
e th
e re
sour
ce u
se
and
was
te p
rodu
ctio
n du
ring
the
prod
uctio
n pr
oces
s.”C
hapt
er V
: “En
terp
rises
that
vio
late
the
artic
les o
f Law
of C
lean
Pro
duct
ion
Prom
otio
n sh
ould
be
held
lega
lly re
spon
sibl
e ba
sed
on re
leva
nt re
gula
tions
”
NPC
NPC
Envi
ronm
en-
tal I
mpa
ct
Ass
essm
ent
Law
(NPC
201
6c)
Cle
aner
Pr
oduc
tion
Prom
otio
n La
w
(NPC
201
2)
Sept
embe
r 1,
2016
July
1, 2
012
54
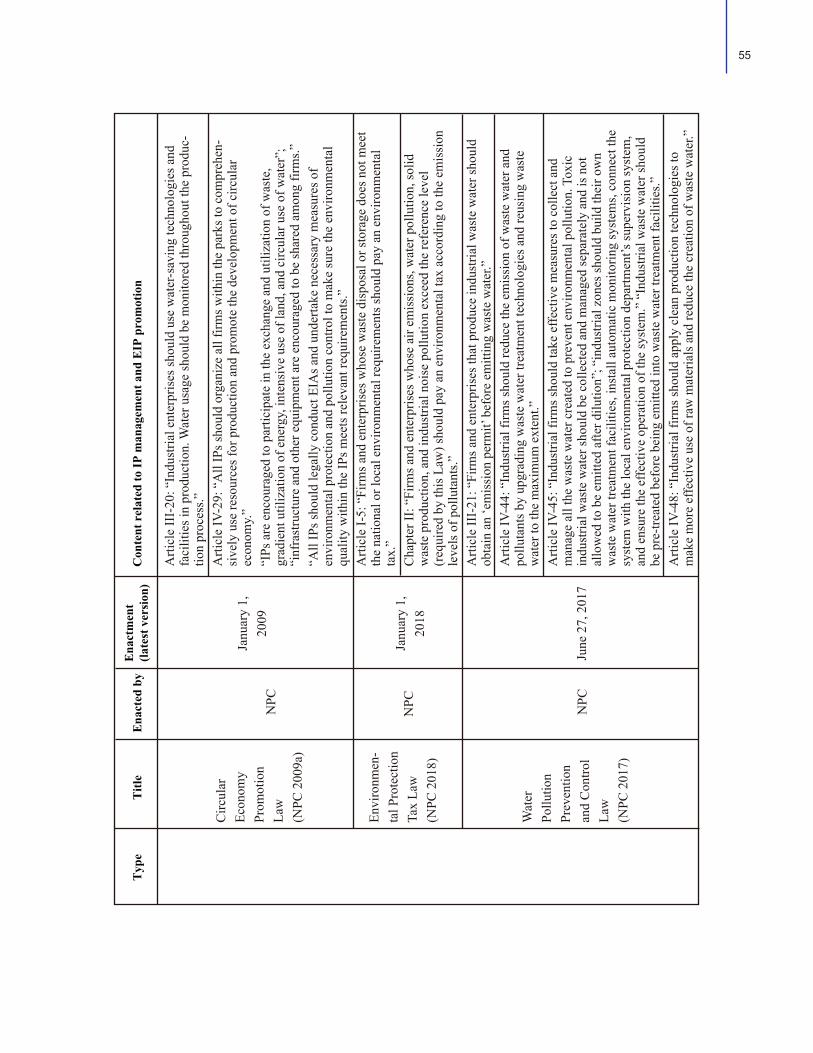
Arti
cle
III-
20: “
Indu
stria
l ent
erpr
ises
shou
ld u
se w
ater
-sav
ing
tech
nolo
gies
and
fa
cilit
ies i
n pr
oduc
tion.
Wat
er u
sage
shou
ld b
e m
onito
red
thro
ugho
ut th
e pr
oduc
-tio
n pr
oces
s.”A
rticl
e IV
-29:
“A
ll IP
s sho
uld
orga
nize
all
firm
s with
in th
e pa
rks t
o co
mpr
ehen
-si
vely
use
reso
urce
s for
pro
duct
ion
and
prom
ote
the
deve
lopm
ent o
f circ
ular
ec
onom
y.”
“IPs
are
enc
oura
ged
to p
artic
ipat
e in
the
exch
ange
and
util
izat
ion
of w
aste
, gr
adie
nt u
tiliz
atio
n of
ene
rgy,
inte
nsiv
e us
e of
land
, and
circ
ular
use
of w
ater
”;
“inf
rast
ruct
ure
and
othe
r equ
ipm
ent a
re e
ncou
rage
d to
be
shar
ed a
mon
g fir
ms.”
“All
IPs s
houl
d le
gally
con
duct
EIA
s and
und
erta
ke n
eces
sary
mea
sure
s of
envi
ronm
enta
l pro
tect
ion
and
pollu
tion
cont
rol t
o m
ake
sure
the
envi
ronm
enta
l qu
ality
with
in th
e IP
s mee
ts re
leva
nt re
quire
men
ts.”
Arti
cle
I-5:
“Fi
rms a
nd e
nter
pris
es w
hose
was
te d
ispo
sal o
r sto
rage
doe
s not
mee
t th
e na
tiona
l or l
ocal
env
ironm
enta
l req
uire
men
ts sh
ould
pay
an
envi
ronm
enta
l ta
x.”
Cha
pter
II: “
Firm
s and
ent
erpr
ises
who
se a
ir em
issi
ons,
wat
er p
ollu
tion,
solid
w
aste
pro
duct
ion,
and
indu
stria
l noi
se p
ollu
tion
exce
ed th
e re
fere
nce
leve
l (r
equi
red
by th
is L
aw) s
houl
d pa
y an
env
ironm
enta
l tax
acc
ordi
ng to
the
emis
sion
le
vels
of p
ollu
tant
s.”A
rticl
e II
I-21
: “Fi
rms a
nd e
nter
pris
es th
at p
rodu
ce in
dust
rial w
aste
wat
er sh
ould
ob
tain
an
‘em
issi
on p
erm
it’ b
efor
e em
ittin
g w
aste
wat
er.”
Arti
cle
IV-4
4: “
Indu
stria
l firm
s sho
uld
redu
ce th
e em
issi
on o
f was
te w
ater
and
po
lluta
nts b
y up
grad
ing
was
te w
ater
trea
tmen
t tec
hnol
ogie
s and
reus
ing
was
te
wat
er to
the
max
imum
ext
ent.”
Arti
cle
IV-4
5: “
Indu
stria
l firm
s sho
uld
take
effe
ctiv
e m
easu
res t
o co
llect
and
m
anag
e al
l the
was
te w
ater
cre
ated
to p
reve
nt e
nviro
nmen
tal p
ollu
tion.
Tox
ic
indu
stria
l was
te w
ater
shou
ld b
e co
llect
ed a
nd m
anag
ed se
para
tely
and
is n
ot
allo
wed
to b
e em
itted
afte
r dilu
tion”
; “in
dust
rial z
ones
shou
ld b
uild
thei
r ow
n w
aste
wat
er tr
eatm
ent f
acili
ties,
inst
all a
utom
atic
mon
itorin
g sy
stem
s, co
nnec
t the
sy
stem
with
the
loca
l env
ironm
enta
l pro
tect
ion
depa
rtmen
t’s su
perv
isio
n sy
stem
, an
d en
sure
the
effe
ctiv
e op
erat
ion
of th
e sy
stem
.” “
Indu
stria
l was
te w
ater
shou
ld
be p
re-tr
eate
d be
fore
bei
ng e
mitt
ed in
to w
aste
wat
er tr
eatm
ent f
acili
ties.”
Arti
cle
IV-4
8: “
Indu
stria
l firm
s sho
uld
appl
y cl
ean
prod
uctio
n te
chno
logi
es to
m
ake
mor
e ef
fect
ive
use
of ra
w m
ater
ials
and
redu
ce th
e cr
eatio
n of
was
te w
ater
.”
NPC
NPC
NPC
Circ
ular
Ec
onom
y Pr
omot
ion
Law
(N
PC 2
009a
)
Envi
ronm
en-
tal P
rote
ctio
n Ta
x La
w(N
PC 2
018)
Wat
er
Pollu
tion
Prev
entio
n an
d C
ontro
l La
w(N
PC 2
017)
Janu
ary
1,
2009
Janu
ary
1,
2018
June
27,
201
7
55

Arti
cle
III-
19: “
Indu
stria
l firm
s tha
t em
it in
dust
rial a
ir po
lluta
nts (
liste
d in
Arti
cle
78 o
f thi
s Law
) sho
uld
obta
in e
mis
sion
per
mits
bef
ore
emitt
ing
pollu
tant
s.”A
rticl
e II
I-24
: “In
dust
rial f
irms t
hat e
mit
indu
stria
l air
pollu
tant
s (lis
ted
in A
rticl
e 78
of t
his L
aw) s
houl
d in
stal
l and
effe
ctiv
ely
use
real
-tim
e au
tom
atic
air
pollu
tant
m
onito
ring
syst
ems,
conn
ect t
he sy
stem
with
loca
l env
ironm
enta
l pro
tect
ion
depa
rtmen
t’s su
perv
isio
n sy
stem
, and
kee
p th
e in
form
atio
n pu
blic
at a
ll tim
es.”
Arti
cle
IV-4
3: “
Indu
stria
l firm
s tha
t em
it TS
P (to
tal s
uspe
nded
par
ticul
ates
), SO
x (s
ulfu
r oxi
des)
, and
NO
x (n
itrog
en o
xide
s) sh
ould
app
ly c
lean
pro
duct
ion
tech
nol-
ogie
s and
inst
all p
ollu
tant
con
trol f
acili
ties t
o re
duce
air
emis
sion
s to
the
max
i-m
um e
xten
t.”
“Ind
ustri
al fi
rms s
houl
d re
cycl
e co
mbu
stib
le w
aste
gas
cre
ated
dur
ing
indu
stria
l pr
oduc
tion.
”A
rticl
e II
I-31
: “In
dust
rial f
irms s
houl
d se
lect
raw
mat
eria
ls, e
nerg
y, a
nd o
ther
re
sour
ces—
as w
ell a
s app
ly a
dvan
ced
prod
uctio
n te
chno
logi
es –
that
redu
ce th
e cr
eatio
n of
indu
stria
l sol
id w
aste
and
low
er th
e ha
rm b
roug
ht b
y in
dust
rial s
olid
w
aste
.”A
rticl
e II
I-32
: “In
dust
rial f
irms s
houl
d re
port
accu
rate
info
rmat
ion
on th
e ty
pe,
amou
nt, f
low
dire
ctio
n, st
orag
e, a
nd d
ispo
sal o
f ind
ustri
al so
lid w
aste
to lo
cal
envi
ronm
enta
l pro
tect
ion
depa
rtmen
ts.”
Arti
cle
III-
33: “
Indu
stria
l firm
s sho
uld
mak
e ef
fect
ive
use
of so
lid w
aste
cre
ated
ba
sed
on th
eir e
cono
mic
and
tech
nolo
gica
l con
ditio
ns. F
or so
lid w
aste
that
can
not
be u
tiliz
ed, s
peci
fic p
lace
s for
safe
stor
age
or h
arm
less
dis
posa
l of s
olid
was
te
shou
ld b
e bu
ilt.”
Arti
cle
IV-1
7: “
Firm
s and
ent
erpr
ises
are
enc
oura
ged
to u
se so
lar-p
ower
ed w
ater
he
atin
g sy
stem
, sol
ar h
eatin
g an
d co
olin
g sy
stem
, and
sola
r PV
(pho
tovo
ltaic
) sy
stem
s.”A
rticl
e II
I-30
: “H
igh
ener
gy-c
onsu
min
g in
dust
rial f
irms s
houl
d up
grad
e th
eir
prod
uctio
n te
chno
logi
es to
be
‘ene
rgy-
savi
ng.’”
Arti
cle
III-
31: “
Indu
stria
l firm
s are
enc
oura
ged
to a
pply
adv
ance
d en
ergy
use
m
onito
ring
syst
ems a
nd e
nerg
y us
e co
ntro
l tec
hnol
ogie
s.”
NPC
NPC
NPC
NPC
Air
Pollu
tion
Prev
entio
n an
d C
ontro
l La
w(N
PC 2
016a
)
Law
on
the
Prev
entio
n an
d C
ontro
l of
Env
iron-
men
tal
Pollu
tion
by
Solid
Was
te
(NPC
201
6d)
Ren
ewab
le
Ener
gy L
aw(N
PC 2
009)
Ener
gy
Con
serv
atio
n La
w(N
PC 2
016b
)
Janu
ary
1,
2016
Nov
embe
r 7,
2016
Dec
embe
r 26,
20
09
July
2, 2
016
56
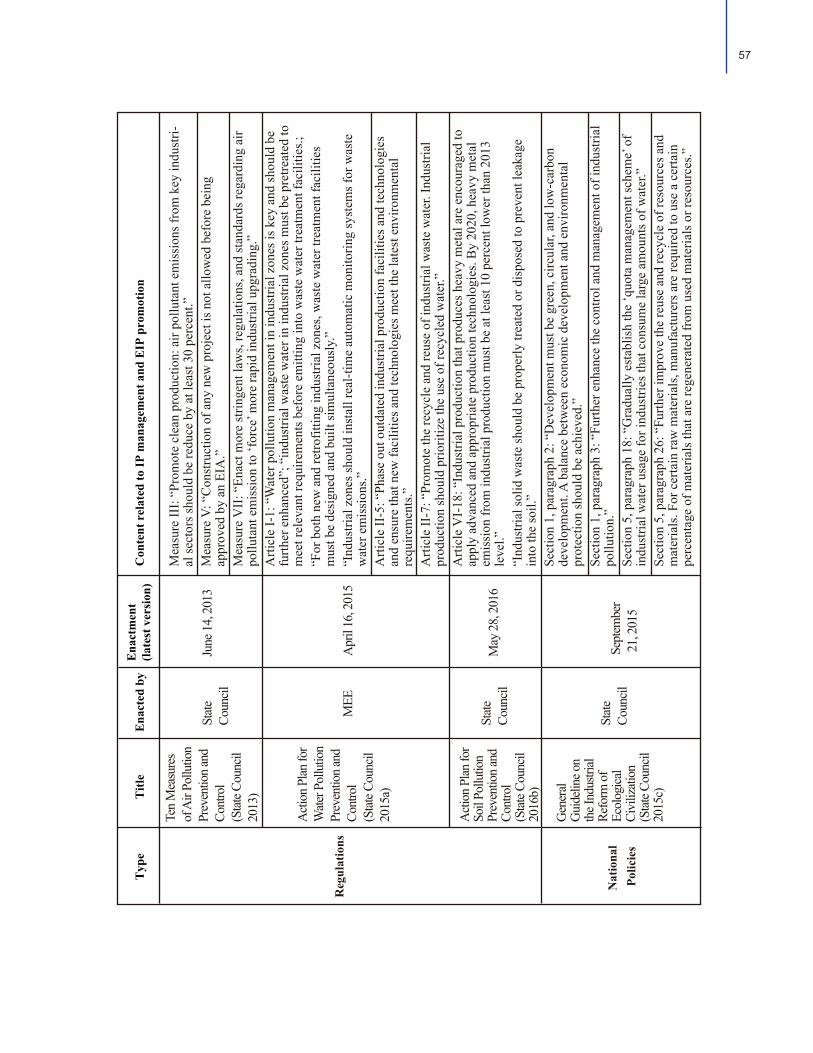
Reg
ulat
ions
Nat
iona
l Po
licie
s
Mea
sure
III:
“Pro
mot
e cl
ean
prod
uctio
n: a
ir po
lluta
nt e
mis
sion
s fro
m k
ey in
dust
ri-al
sect
ors s
houl
d be
redu
ce b
y at
leas
t 30
perc
ent.”
Mea
sure
V: “
Con
stru
ctio
n of
any
new
pro
ject
is n
ot a
llow
ed b
efor
e be
ing
appr
oved
by
an E
IA.”
Mea
sure
VII
: “En
act m
ore
strin
gent
law
s, re
gula
tions
, and
stan
dard
s reg
ardi
ng a
ir po
lluta
nt e
mis
sion
to ‘f
orce
’ mor
e ra
pid
indu
stria
l upg
radi
ng.”
Arti
cle
I-1:
“W
ater
pol
lutio
n m
anag
emen
t in
indu
stria
l zon
es is
key
and
shou
ld b
e fu
rther
enh
ance
d”; “
indu
stria
l was
te w
ater
in in
dust
rial z
ones
mus
t be
pret
reat
ed to
m
eet r
elev
ant r
equi
rem
ents
bef
ore
emitt
ing
into
was
te w
ater
trea
tmen
t fac
ilitie
s.;
“For
bot
h ne
w a
nd re
trofit
ting
indu
stria
l zon
es, w
aste
wat
er tr
eatm
ent f
acili
ties
mus
t be
desi
gned
and
bui
lt si
mul
tane
ousl
y.”
“Ind
ustri
al z
ones
shou
ld in
stal
l rea
l-tim
e au
tom
atic
mon
itorin
g sy
stem
s for
was
te
wat
er e
mis
sion
s.”A
rticl
e II
-5: “
Phas
e ou
t out
date
d in
dust
rial p
rodu
ctio
n fa
cilit
ies a
nd te
chno
logi
es
and
ensu
re th
at n
ew fa
cilit
ies a
nd te
chno
logi
es m
eet t
he la
test
env
ironm
enta
l re
quire
men
ts.”
Arti
cle
II-7
: “Pr
omot
e th
e re
cycl
e an
d re
use
of in
dust
rial w
aste
wat
er. I
ndus
trial
pr
oduc
tion
shou
ld p
riorit
ize
the
use
of re
cycl
ed w
ater
.”A
rticl
e V
I-18
: “In
dust
rial p
rodu
ctio
n th
at p
rodu
ces h
eavy
met
al a
re e
ncou
rage
d to
ap
ply
adva
nced
and
app
ropr
iate
pro
duct
ion
tech
nolo
gies
. By
2020
, hea
vy m
etal
em
issi
on fr
om in
dust
rial p
rodu
ctio
n m
ust b
e at
leas
t 10
perc
ent l
ower
than
201
3 le
vel.”
“I
ndus
trial
solid
was
te sh
ould
be
prop
erly
trea
ted
or d
ispo
sed
to p
reve
nt le
akag
e in
to th
e so
il.”
Sect
ion
1, p
arag
raph
2: “
Dev
elop
men
t mus
t be
gree
n, c
ircul
ar, a
nd lo
w-c
arbo
n de
velo
pmen
t. A
bal
ance
bet
wee
n ec
onom
ic d
evel
opm
ent a
nd e
nviro
nmen
tal
prot
ectio
n sh
ould
be
achi
eved
.”Se
ctio
n 1,
par
agra
ph 3
: “Fu
rther
enh
ance
the
cont
rol a
nd m
anag
emen
t of i
ndus
trial
po
llutio
n.”
Sect
ion
5, p
arag
raph
18:
“G
radu
ally
est
ablis
h th
e ‘q
uota
man
agem
ent s
chem
e’ o
f in
dust
rial w
ater
usa
ge fo
r ind
ustri
es th
at c
onsu
me
larg
e am
ount
s of w
ater
.”Se
ctio
n 5,
par
agra
ph 2
6: “
Furth
er im
prov
e th
e re
use
and
recy
cle
of re
sour
ces a
nd
mat
eria
ls. F
or c
erta
in ra
w m
ater
ials
, man
ufac
ture
rs a
re re
quire
d to
use
a c
erta
in
perc
enta
ge o
f mat
eria
ls th
at a
re re
gene
rate
d fr
om u
sed
mat
eria
ls o
r res
ourc
es.”
Ten
Mea
sure
s of
Air
Pollu
tion
Prev
entio
n an
d Co
ntro
l(S
tate C
ounc
il 20
13)
Acti
on P
lan fo
r W
ater P
ollu
tion
Prev
entio
n an
d Co
ntro
l(S
tate C
ounc
il 20
15a)
Acti
on P
lan fo
r So
il Po
llutio
n Pr
even
tion
and
Cont
rol
(Stat
e Cou
ncil
2016
b)
Gen
eral
Gui
delin
e on
the I
ndus
trial
Refo
rm o
f Ec
olog
ical
Civi
lizati
on(S
tate C
ounc
il 20
15c)
State
Co
uncil
State
Co
uncil
State
Co
uncil
June
14,
201
3
MEE
Apr
il 16
, 201
5
May
28,
201
6
Sept
embe
r 2
1, 2
015
57

Sect
ion
3, p
arag
raph
5 p
ropo
ses t
o pr
omot
e gr
een
man
ufac
turin
g an
d es
tabl
ish
a gr
een
man
ufac
turin
g sy
stem
, inc
ludi
ng th
e de
velo
pmen
t of g
reen
IPs:
“…
to
deve
lop
gree
n IP
s and
pro
mot
e in
dust
rial s
ymbi
osis
with
in IP
s… su
ppor
t gre
en
firm
s tha
t im
plem
ent g
reen
dev
elop
men
t stra
tegy
, gre
en st
anda
rds,
gree
n m
anag
e-m
ent,
and
gree
n pr
oduc
tion.
”Th
e “M
ade
in C
hina
202
5” p
roje
ct a
lso
prop
oses
to e
stab
lish
100
gree
n de
mon
-st
ratio
n IP
s and
1,0
00 g
reen
dem
onst
ratio
n fa
ctor
ies b
y 20
20.
Arti
cle
43-1
: “Pr
omot
e en
ergy
savi
ng in
indu
stria
l sec
tors
.”A
rticl
e 43
-5: “
Prom
ote
and
acce
lera
te th
e ‘c
ircul
ar e
cono
my
trans
form
atio
n’ in
IP
s. Pr
omot
e in
dust
rial s
ymbi
osis
bet
wee
n en
terp
rises
and
bet
wee
n in
dust
ries.”
Arti
cle
44-2
: “Im
plem
ent p
lans
and
pol
icie
s tha
t ens
ure
all i
ndus
trial
pol
lute
rs
mee
t em
issi
on st
anda
rds.”
“E
nhan
ce th
e su
perv
isio
n on
indu
stria
l pol
lutio
n an
d pu
blis
h th
e na
mes
of i
ndus
-tri
al fi
rms w
hich
do
not m
eet e
mis
sion
stan
dard
s.”A
rticl
e 46
-1: “
Effe
ctiv
ely
cont
rol c
arbo
n em
issi
ons f
rom
the
indu
stria
l sec
tor a
nd
prom
ote
low
-car
bon
deve
lopm
ent o
f the
indu
stria
l sec
tor.”
Sect
ion
1, “
key
obje
ctiv
es”:
“Es
tabl
ish
a pr
elim
inar
y gr
een,
circ
ular
, and
low
-car
-bo
n in
dust
ry sy
stem
. To
achi
eve
circ
ular
pro
duct
ion
of e
nter
pris
es, [
prom
ote]
ci
rcul
ar d
evel
opm
ent o
f IPs
, and
circ
ular
com
bina
tion
of d
iffer
ent i
ndus
tries
so
that
reso
urce
effi
cien
cy is
incr
ease
d an
d w
aste
gen
erat
ion
is re
duce
d.”
Sect
ion
2, p
arag
raph
5: “
Des
ign
spec
ific
circ
ular
eco
nom
y de
velo
pmen
t pla
ns fo
r ne
w a
nd re
trofit
ted
IPs t
o m
eet t
he re
quire
men
ts o
f hav
ing
‘rea
sona
ble
spat
ial
arra
ngem
ent,
optim
al in
dust
ry st
ruct
ure,
circ
ular
indu
stry
cha
ins,
effic
ient
reso
urce
us
e, c
once
ntra
ted
pollu
tion
man
agem
ent,
gree
n in
fras
truct
ure,
and
nor
mal
ized
pa
rk o
pera
tion
and
man
agem
ent’
with
in IP
s. U
pgra
de e
xist
ing
IPs t
o m
ove
tow
ard
ci
rcul
ar e
cono
my
perf
orm
ance
, est
ablis
h ci
rcul
ar e
cono
my
indu
stria
l cha
in, a
nd
stre
ngth
en c
onne
ctio
ns b
etw
een
ente
rpris
es a
nd b
etw
een
indu
strie
s.”Se
ctio
n 5,
par
agra
ph 1
7: “
Esta
blis
h ci
rcul
ar e
cono
my
perf
orm
ance
eva
luat
ion
syst
ems b
ased
on
the
two
indi
cato
rs: r
esou
rce
prod
uctiv
ity a
nd th
e re
sour
ce
recy
clin
g ra
te. C
ondu
ct e
valu
atio
n of
IPs r
egul
arly
on
thei
r circ
ular
eco
nom
y pe
rfor
man
ce.”
Sect
ion
7, p
arag
raph
25:
“D
raft
and
impl
emen
t an
Act
ion
Plan
on
Circ
ular
Ec
onom
y U
pgra
de fo
r IPs
. Eac
h pr
ovin
ce sh
ould
dra
ft an
d im
plem
ent i
ts o
wn
prov
inci
al a
ctio
n pl
ans.
Enco
urag
e th
e na
tiona
l EIP
s to
lead
the
“circ
ular
eco
nom
y up
grad
e” a
nd in
clud
e th
e ev
alua
tion
of th
is u
pgra
de in
the
gene
ral I
P as
sess
men
t sc
hem
e. B
y 20
20, a
“ci
rcul
ar e
cono
my
upgr
ade
is p
lann
ed to
get
star
ted
in 7
5 pe
rcen
t of n
atio
nal I
Ps a
nd 5
0 pe
rcen
t of p
rovi
ncia
l IPs
.”
Not
ice b
y th
e St
ate C
ounc
il on
the “
Mad
e in
Chi
na 2
025”
Pr
ojec
t(S
tate C
ounc
il 20
15b)
13th F
ive-
Year
Pl
an o
n th
e Ec
onom
ic an
d So
cial
Dev
elopm
ent
of th
e Peo
ple’s
Re
publ
ic of
Ch
ina
(ND
RC 2
016b
)
Acti
on P
lan fo
r Le
adin
g Ci
rcul
ar
Econ
omy
Dev
elop-
men
t(ND
RC
2017
)
State
Co
uncil
ND
RC
ND
RC
May
8,
2015
Mar
ch
16, 2
016
Apr
il 21
, 20
17
58

59
Stan
dard
s &
in
dica
tors
The
Gui
delin
es c
lear
ly in
trodu
ce th
e re
quire
men
ts a
nd p
roce
dure
of a
pplic
atio
n,
esta
blis
hmen
t, ap
prov
al, p
erfo
rman
ce c
heck
, and
man
agem
ent f
or a
n or
dina
ry IP
to
bec
ome
a na
tiona
l EIP
. Sup
porti
ve p
olic
ies f
or b
ecom
ing
EIPs
are
brie
fly
intro
duce
d, a
nd n
egat
ive
cons
eque
nces
for a
ppro
ved
EIPs
to fa
il to
mai
ntai
n go
od
perf
orm
ance
are
des
crib
ed a
s wel
l.
The
Gui
ding
Not
ice
spec
ifica
lly c
over
s the
dev
elop
men
t and
pro
mot
ion
of E
IPs i
n C
hina
, des
crib
ing
the
sign
ifica
nce,
gen
eral
requ
irem
ents
, key
obj
ectiv
es a
nd ta
sks,
supp
ortiv
e po
licie
s, an
d m
easu
res f
or e
stab
lishi
ng E
IPs.
The
Plan
out
lines
the
blue
prin
t for
the
gree
n de
velo
pmen
t of C
hina
’s in
dust
rial
sect
or d
urin
g th
e 13
th F
ive-
Year
Pla
n pe
riod.
The
est
ablis
hmen
t of a
gre
en
man
ufac
turin
g sy
stem
is a
mon
g th
e te
n ke
y ob
ject
ives
, inc
ludi
ng th
e co
nstru
ctio
n of
gre
en IP
s (to
geth
er w
ith th
e de
velo
pmen
t of g
reen
pro
duct
s, gr
een
fact
orie
s, an
d gr
een
indu
stria
l cha
ins)
. The
Pla
n pr
opos
es to
est
ablis
h 10
0 re
pres
enta
tive
and
high
-leve
l dem
onst
ratio
n gr
een
IPs b
y 20
20.
The
Stan
dard
est
ablis
hes e
valu
atin
g m
etho
ds, i
ndic
ator
s, an
d m
etho
ds fo
r dat
a co
llect
ion
and
the
calc
ulat
ion
met
hod
of in
dica
tors
.
It is
use
d as
a re
fere
nce
for t
he a
sses
smen
t and
eva
luat
ion
of N
atio
nal D
emon
stra
-tio
n EI
Ps (w
heth
er a
n EI
P is
qua
lifie
d as
a N
atio
nal D
emon
stra
tion
EIP)
, whi
ch
faci
litat
es th
e co
nstru
ctio
n an
d m
anag
emen
t of E
IPs.
App
endi
x 2
of th
is N
otic
e in
trodu
ces t
he re
quire
men
ts fo
r the
eva
luat
ion
of
“Gre
en IP
s” (w
hat r
equi
rem
ents
shou
ld b
e m
et to
qua
lify
as a
“gr
een
IP”)
, the
qu
alifi
catio
n in
dica
tors
use
d to
eva
luat
e th
e “g
reen
ness
” of
IPs,
and
the
calc
ulat
ion
met
hods
for t
he “
gree
n in
dex
for I
Ps.”
MEE
, MO
C,
MO
ST
MEE
, MO
C,
MO
ST
MIIT
MEE
MIIT
Dec
embe
r 16,
20
15
Dec
embe
r 5,
2011
June
30,
201
6
Janu
ary
1, 2
016
Sept
embe
r 3,
2016
Gui
delin
es o
n th
e M
anag
emen
t of N
atio
nal
Eco-
Indu
stria
l Par
ks(M
EE, M
OC
, and
M
OST
201
5)
Guidi
ng N
otice
on S
treng
then-
ing th
e Dev
elopm
ent o
f Na
tiona
l Eco
-Indu
strial
Park
s(M
EE, M
OC, a
nd M
OSt 2
011)
Plan
for I
ndus
trial
Gre
en
Dev
elop
men
t (20
16−
2020
)(M
IIT
2016
c)
Stan
dard
for N
atio
nal
Dem
onst
ratio
n Ec
o-in
-du
stria
l Par
ks(M
EE 2
016)
Not
ice
on th
e Es
tabl
ish-
men
t of A
Gre
en
Man
ufac
turin
g Sy
stem
(MII
T 20
16b)

The
ND
RC
stan
dard
incl
udes
a to
tal o
f 31
indi
cato
rs, c
ateg
oriz
ed in
to 8
gro
ups:
re
sour
ce p
rodu
ctiv
ity (5
); re
sour
ce c
onsu
mpt
ion
(5);
com
preh
ensi
ve u
tiliz
atio
n of
re
sour
ces (
5); p
ollu
tant
em
issi
ons (
8); o
ther
indi
cato
rs (3
); ch
arac
teris
tic in
dica
tors
(to
be
fille
d in
by
indu
stria
l par
ks (5
); pr
ojec
ts su
bsid
ized
by
cent
ral g
over
nmen
t fin
ance
(3);
and
self-
impl
emen
ted
proj
ects
(2).
The
stan
dard
em
phas
izes
the
circ
ular
eco
nom
y pe
rfor
man
ce o
f IPs
, lea
ding
to a
fo
cus o
n re
sour
ce p
rodu
ctiv
ity, e
ffici
ency
, and
pol
luta
nt e
mis
sion
s.
The
stan
dard
doe
s not
set t
arge
t val
ue fo
r ind
icat
ors.
Inst
ead,
it p
rovi
des a
n in
form
atio
n sh
eet f
or IP
s’ se
lf-as
sess
men
t aga
inst
thei
r pre
viou
s per
form
ance
and
es
timat
ed fu
ture
pro
gres
s.
The
Spec
ifica
tion
esta
blis
hes t
he b
asic
requ
irem
ents
for C
ircul
ar E
cono
my
Perf
orm
ance
Eva
luat
ion
of IP
s, th
e in
dica
tors
for t
he e
valu
atio
n—na
mel
y, th
e “r
esou
rce
prod
uctiv
ity”
(eco
nom
ic o
utpu
t/res
ourc
e in
put)
and
“res
ourc
e re
cycl
ing
rate
” (r
ecyc
led
reso
urce
s/to
tal w
aste
cre
ated
) — a
nd th
e ca
lcul
atio
n m
etho
d of
the
“Circ
ular
Eco
nom
y In
dex.
” It
is u
sed
to e
valu
ate
the
circ
ular
eco
nom
y pe
rfor
-m
ance
of n
atio
nal a
nd p
rovi
ncia
l ind
ustri
al z
ones
/par
ks.
Not
ice o
n Re
com
men
d-in
g K
ey
Cand
idate
In
dustr
ial P
arks
fo
r Circ
ular
Ec
onom
y Tr
ansfo
rmati
on
in 2
017
(NRD
C an
d M
OF
2017
b)
Spec
ifica
tion
for C
ircul
ar
Econ
omy
Perfo
rman
ce
Evalu
ation
of
Indu
strial
Par
ks(C
NIS
201
7)
ND
RC,
MO
F
CNIS
Mar
ch 2
9,
2017
Mar
ch 1
, 201
7
Sour
ce: W
orld
Ban
k co
mpi
latio
ns.
Not
e: P
leas
e not
e tha
t the
Eng
lish
trans
latio
n in
the a
ppen
dix
is m
eant
onl
y as
a re
fere
nce f
or n
on-C
hine
se sp
eake
rs. P
leas
e ref
er to
the o
rigin
al C
hine
se te
xts f
or cl
arifi
catio
n.
CNIS
=Ch
ina N
atio
nal I
nstit
ute o
f Sta
ndar
diza
tion;
EIA
= en
viro
nmen
tal i
mpa
ct as
sess
men
t; EI
P =
eco-
indu
stria
l par
k; IP
= in
dustr
ial p
ark;
M
EE =
Min
istry
of E
nviro
nmen
tal P
rote
ctio
n; M
IIT =
Min
istry
of M
inist
ry o
f Ind
ustry
and
Info
rmat
ion
Tech
nolo
gy; M
OC
= M
inist
ry o
f Com
mer
ce;
MO
ST =
Min
istry
of S
cien
ce an
d Te
chno
logy
; ND
RC =
Nat
iona
l Dev
elop
men
t and
Ref
orm
Com
miss
ion;
NPC
= N
atio
nal P
eopl
e’s C
ongr
ess.
60

Appendix B. Standard for National Demonstration EIPs (MEE)
Category No Indicators Unit
Require
-
ment
Compulsory or
optional
Economic
development
1
Industrial output from high-
tech firms/total industrial
output
% ≥30
Meet at least 1
of these 4
requirements
2 Industrial added value (IAV)
per capita
RMB10,000
/person ≥15
3 IAV growth rate of the IP in
the past 3 years % ≥15
4
IAV generated from reuse and
recycling of resources/total
IAV
% ≥30
Industrial
symbiosis
5 Number of newly established
eco-industrial chains / ≥6 Compulsory
6 Comprehensive utilization
rate of industrial solid waste % ≥70 Meet at least 1
of these 2
requirements 7 Circular utilization rate of
reusable resources % ≥80
Resource
saving
8 IAV per unit of land for
industrial use
RMB100
million /km2 ≥9
Meet at least 1
of these 2
requirements 9
Growth rate of IAV per unit
of land for industrial use in
the past 3 years
% ≥6
10 Energy consumption elasticity
rate
Annual
growth rate
of total
energy
consump-
tion/annual
growth rate
of IAV)
≤0.6
when
IAV
growth
rate is
positive;
≥0.6
when
IAV
growth
Compulsory
Resource saving
61
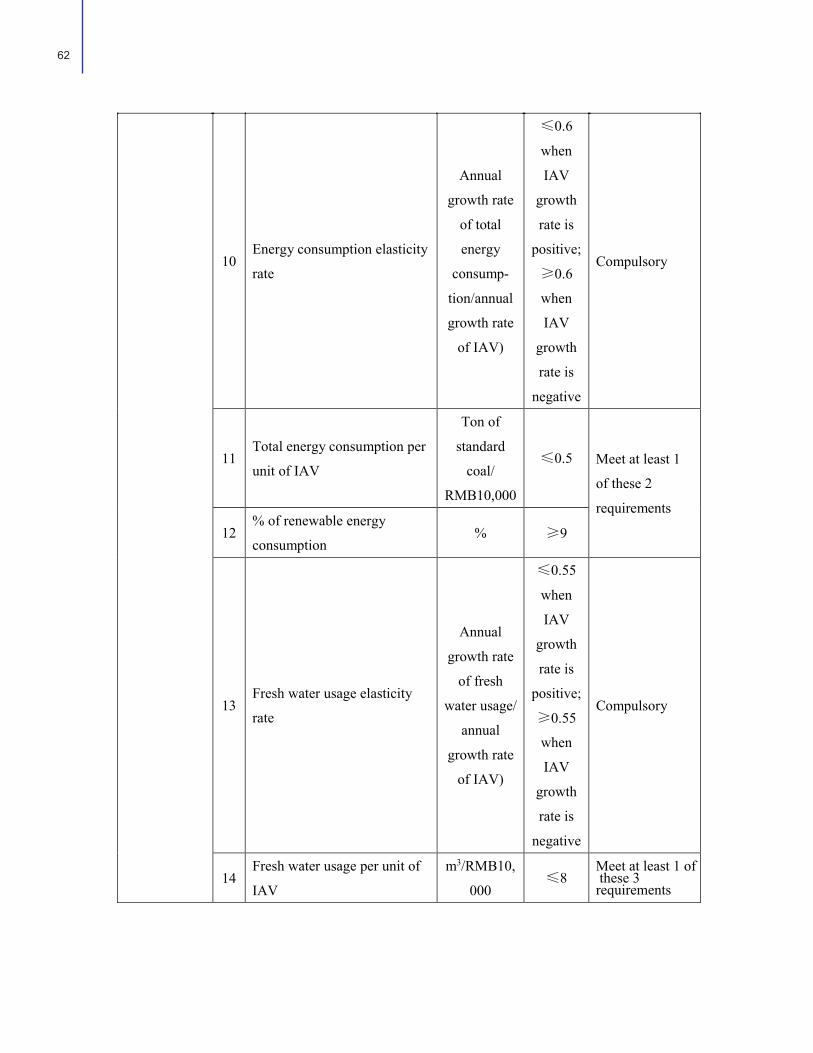
Resource
saving
10 Energy consumption elasticity
rate
Annual
growth rate
of total
energy
consump-
tion/annual
growth rate
of IAV)
≤0.6
when
IAV
growth
rate is
positive;
≥0.6
when
IAV
growth
rate is
negative
Compulsory
11 Total energy consumption per
unit of IAV
Ton of
standard
coal/
RMB10,000
≤0.5 Meet at least 1
of these 2
requirements
12 % of renewable energy
consumption % ≥9
13 Fresh water usage elasticity
rate
Annual
growth rate
of fresh
water usage/
annual
growth rate
of IAV)
≤0.55
when
IAV
growth
rate is
positive;
≥0.55
when
IAV
growth
rate is
negative
Compulsory
14 Fresh water usage per unit of
IAV
m3/RMB10,
000 ≤8
Meet at least 1 of these 3 requirements
62

63
Environ-
mental
protection
17 Key pollution emitters in IPs
meet emission requirements Yes/No Yes Compulsory
18
Total emission of national and
local key pollutants in IPs
meet emission requirements
Yes/No Yes Compulsory
19
Number of extremely severe
and severe emergent
environmental accidents in IPs
Number 0 Compulsory
20
Soundness/completeness of
IPs’ environmental
management ability
% 100 Compulsory
21
Enforcement rate of clean
production verification for key
firms in IPs
% 100 Compulsory
22 Concentrated wastewater
treatment facilities Yes/No Yes Compulsory
23
Soundness/completeness of
IPs’ environmental risk
control system
% 100 Compulsory
24
Reuse and safe disposal rate
of industrial solid waste
(including dangerous waste)
% 100 Compulsory
Reuse rate of industrial waste water15
16
≥75
At least 20% for cities withwater shortage;30% for Jing-Jin-Ji region; and 10%for others
Meet at least 1 of these 3 requirements
%
%Reuse rate of reclaimed water

64
Informationdisclosure
Source: World Bank compilations.Note: Please note that the English translation in the appendix is meant only as a reference for non-Chinese speakers and readers. Please refer to the original Chinese texts for any clarifications. When the economic output of a certain industrial sector exceeds 70 percent of the total industrial output of an IP, it is considered a Level I industry under the clean production evaluation system, or internationally advanced level. IAV = industrial added value; IP = industrial park; MEE = Ministry of Ecology and Environment.
24
25
26
27
28
29
30
31
32
Reuse and safe disposal rate of industrial solid waste (includ-ing dangerous waste)
Emission elasticity rate of key pollutants
Annual growth rate of pollutant emission/annual growth rate of IAV)
≤0.3 when IAV growth rate is positive;≥0.3 when IAV growth rate is negative
Carbon emission abatement rate per unit of IAV
Wastewater emission per unit of IAV
Ton/RMB10,000
Ton/ RMB10,000 RMB
Times/year
Solid waste generation per unit of IAV
Green coverage rate (area covered by plants/total area of IP)
Environmental information disclosure rate for key firms in IPs
Soundness/completeness of ecological industry informa-tion platform
Promotional activities with the topic of ecological industry
% ≥3
≤7
≤0.1
≥15
100
100
≥2
%
%
%
Compulsory
Compulsory
Compulsory
Compulsory
Compulsory
Compulsory
Meet at least 1 of these 2 requirements

Appendix C. Basic requirements and performance indicators of applying for circular economy transfor-mation demonstration IPs (NDRC and MOF)
Basic requirements
Circular economy transformation demonstrations IPs must meet the following requirements from the National Development and Reform Commission (NDRC) and the Ministry of Finance (MOF):
- The applicant IP should have already submitted the Demand for Circular Economy Transformation during the 13th Five-Year Period a according to the requirements by the NDRC in the Notice on Conducting Surveys of the Demand of IPs for Circular Economy Transformation.b
- The recommended IPs from each province should be on the list of the Catalogue of Verified Development Zones in China,c or development zones that have been approved by the State Council since 2007, or national circular economy pilot zones that have already been verified since 2007.
- The applicant IP should be in line with the general plan of land use and the general plan of urban develop-ment.
- Projects within the applicant IP should accord with national industry policies.- The applicant IP should have clear boundaries and a managerial committee or an investment/operation entity
in place for park management.- The applicant IP should reach a certain level of industry basis and industrial scale.- The applicant IP should have relatively large potentials for land use.- The applicant IP has a relatively large amount of waste generation with relatively large potentials in the
“reduce, reuse, and recycle” of resource utilization and circular economy transformation.- The applicant IP has sound/complete infrastructure and environmental protection facilities that are in line
with national standards. The park has not had serious environmental pollution accidents or other unexpected incidents in the past three years.
- The applicant IP has the foundation for circular economy transformation, and has already started relevant preparation or work.
- Priority goes to IPs recommended by demonstration cities for fiscal policies in energy conservation and national demonstration cities or counties for circular economy development; national and provincial circular economy transformation pilots are prioritized.
65
Source: NDRC and MOF (2017b)Note: IP = industrial park.a. 十三五”循环化改造需求b. 国家发展改革委办公厅关于开展园区循环化改造需求调查的通知(发改办环资〔2016〕513号)c. 中国开发区审核公告目录(2007年第18号)

Table C.1 Performance indicators
Categories No. Indicators Unit
Resource
productivity
1 Total industrial output of the IP RMB10,000
2 *Resource productivity RMB10,000/ton
3 *Energy productivity RMB10,000/ton of standard coal
4 *Land productivity RMB10,000 /hectare
5 Water resource productivity RMB/m3
Resource
consumption
6 *Total energy consumption 10,000 tons of standard coal
7 *Total consumption of water
resources m3
8 *Water usage per unit of GDP m3/RMB10,000
9 Energy consumption per unit of
industrial output
Tons of standard
coal/RMB10,000
10 Key product I: energy consumption
per unit of production Tons of standard coal/ton
Key product I: water consumption
per unit of production m3/ton
Comprehen-
sive utilization
of resources
11 *Comprehensive utilization of
industrial solid waste 10,000 tons
12 *Comprehensive utilization rate of
industrial solid waste %
13 *Reuse of industrial wastewater 10,000 m3
14 *Reuse rate of industrial wastewater %
15 Comprehensive utilization of used
resources (including imports) 10,000 tons
Pollutant
emissions
16 *SO2 emission 10,000 tons
17 *COD emission 10,000 tons
18 *Ammonia and NOx emission 10,000 tons
66

Pollutant
emissions
19 *Nitride emission 10,000 tons
20 *CO2 emission per unit of local
economic output
Ton/
RMB10,000
21 Industrial solid waste generation 10,000 tons
22 Industrial solid waste disposal 10,000 tons
23 Industrial wastewater emission 10,000 m3
Other
indicators
24 *Connectivity of the IP’s circular
economy industrial chain %
25 *Non-fossil fuel consumption / total
primary energy consumption %
26 Ratio of renewable energy %
Characteristic
indicators
Projects
subsidized by
central
government
finance
27 Number of projects Number
28 Total investment RMB10,000
29 Subsidy from central government
finance RMB10,000
Self-
implement
projects
30 Number of projects Number
31 Total investment RMB10,000
Pollutant emissions
67
Source: NDRC and MOF (2017c)Note:Please note that the English translation in the appendix is meant only as a reference for non-Chinese speakers and readers. Please refer to the original Chinese texts for any clarifications. Indicators marked with asterisks (*) are key indicators and must be filled in the table. IP = industrial park; CO2 = carbon dioxide; COD = Chemical Oxygen Demand; NOX = nitrogen oxide; SO2 = sulfur dioxide.

Appendix D. Requirements/Qualifications of Green IPs (MIIT)
Basic requirements
Green IPs must meet the following basic requirements from the Ministry of Industry and Information Technology (MIIT):
- IPs must comply with and effectively implement relevant regulations and policies on green, circular, and low-carbon economy that were established on both the national and provincial/municipal levels.
- IPs must have had no severe environmental accidents (resulting in major pollution or ecological damage) in the past three years.
- IPs must achieve the goal regarding energy efficiency and carbon reduction set by the national or provincial/-municipal government.
- The level of emissions of key pollutants must not exceed the limit set by national or provincial/municipal government.
- All key enterprises must pass the Clean Production Examination. Key enterprises are enterprises that are required by the Law of Clean Production Promotion to pass the Clean Production Examination.
- Enterprises should not use outdated technologies and equipment, or produce products, that are listed in “elim-ination directory.”
- A specific institute for green development should be established in the parks with at least two professionals.- Parks are encouraged to establish and operate environmental management systems, energy management
systems, and energy surveillance platforms.- Parks are encouraged to use renewable energy, such as wind and solar.
General
indicators No. Specific indicators
Reference
value
Compulsory
or optional
Energy
utilization
green index
(EG)
1 industrial added value (IAV)/energy input
ratio (RME10,000/tce) 3 Compulsory
2 renewable energy (%) 15 Compulsory
3 clean energy (%) 75 Compulsory
Resource
utilization
green index
(RG)
4 IAV/water input ratio (RMB/m3) 1,500 Compulsory
5 IAV/land use ratio (100 million RMB/km2) 15 Compulsory
6 solid waste that is comprehensively utilized
(%) 95 Compulsory
7 water (for industrial use) that is reused (%) 90 Compulsory
8 reclaimed water that is reused (%) 30 Select 2 out
of 4
68

Select 2 out
of 4
9 residual heat that is reused (%) 60
10 waste gas that is recycled/reused (%) 90
11 renewable resources that are reused (%) 80
Infrastructure
green index
(IG)
12 wastewater treatment facilities (Yes/No) Yes Compulsory
13 green buildings among all newly constructed
industrial buildings (%) 30
Select 1 out
of 2 14
green buildings among all newly constructed
public buildings (%) 60
15 park area that can be covered by public
transport (%) 90 Select 1 out
of 2 16 renewable energy public buses (%) 30
Industry green
index (CG)
17 IAV from high-tech industries/total IAV (%) 30 Compulsory
18 IAV from green industries/total IAV (%) 30 Compulsory
19 IAV per capita (RMB10,000/person) 15 Select 1 out
of 2 20 modern service industry (%) 30
Ecological
environment
green index
(HG)
21 industrial solid waste (dangerous waste
included) properly disposed and utilized (%) 100 Compulsory
22 carbon emission reduction % per RMB10,000
of IAV (%) 3 Compulsory
23 wastewater emission per IAV
(ton/RMB10,000) 5 Compulsory
24 elasticity rate of main pollutantsa 0.3 Compulsory
25 days when air quality falls into the first two
tiers (“Very good” and “Good”) (%) 80 Compulsory
26 green coverage rate (%) 30
Select 1 out
of 3
27 road area that is covered by tree shadows (%) 80
28 parking lot area that is covered by tree
shadow (%) 80
69

Method of calculating the IP green index and other green indexes
The IP green index is calculated as follows:
where: GI is the green index of IPs, EG is the energy utilization green index EGi is the index value of indicator i (within the EG category) of the IP, and EGbi is the reference value of indicator i (within the EG category).
This formula also applies to the: -Resource utilization green index (RG) -Infrastructure green index (IG) -Industry green index (CG) -Ecological environment green index (HG) -Management green index (MG).
Note: Please note that the English translation in the appendix is meant only as a reference for non-Chinese speakers and readers. Please refer to the original Chinese texts for any clarifications.
Management
green index
(MG)
29 soundness of the Green IP Standard System
(Sound/Not sound) Sound Compulsory
30 completed a development plan of the Green
IP (Yes/No) Yes Compulsory
31 soundness of the Green IP Information
Platform (Sound/Not sound) Sound Compulsory
70
Source: MIIT (2016b)Note: IAV = industrial added value; IP = industrial park; tce = ton of standard coal equivalenta.The elasticity rate of a certain pollutant = the annual rate of increase of emissions (%)/the annual growth rate of industrial added value (%); the elasticity rate of key pollutants = the sum of elasticity rates of pollutants/number of key pollutants.

Appendix E. Comparison of “China Green Triangle” against the EIP Framework
Table E.1 A detailed comparison of the three Chinese IP green standards
The EIP Framework MIIT NDRC MEE
Park management (prerequisites)
Topic Subtopic
Park
management
services
Park management entity
(Available [Yes/No])
√√√
BR-6
√√√
BR-5
√√√
EP-20
Park property, common
infrastructure and services
(Available [Yes/No])
√√
IG-12, BR-7
√√
BR-9
√
EP-22, ID-31
Monitoring
and risk
management
Monitoring performance and risks
(Available [Yes/No])
√√
MG-30, 31 ×
√√
EP-20, ID-30,
31
Information on applicable
regulations and standards
(Available [Yes/No])
√√
MG-29 ×
√√
ID-30, 31
Planning and
zoning
Master plan
(Available [Yes/No])
√√
MG-30, 31 ×
√
ID-31
Park management (performance indicators)
Topic Subtopic (unit [target value])
Park
management
services
Park management empowerment
(% of firms [100%]) × × ×
Park management entity property
and common infrastructure
(% of firms [75%])
× × ×
71
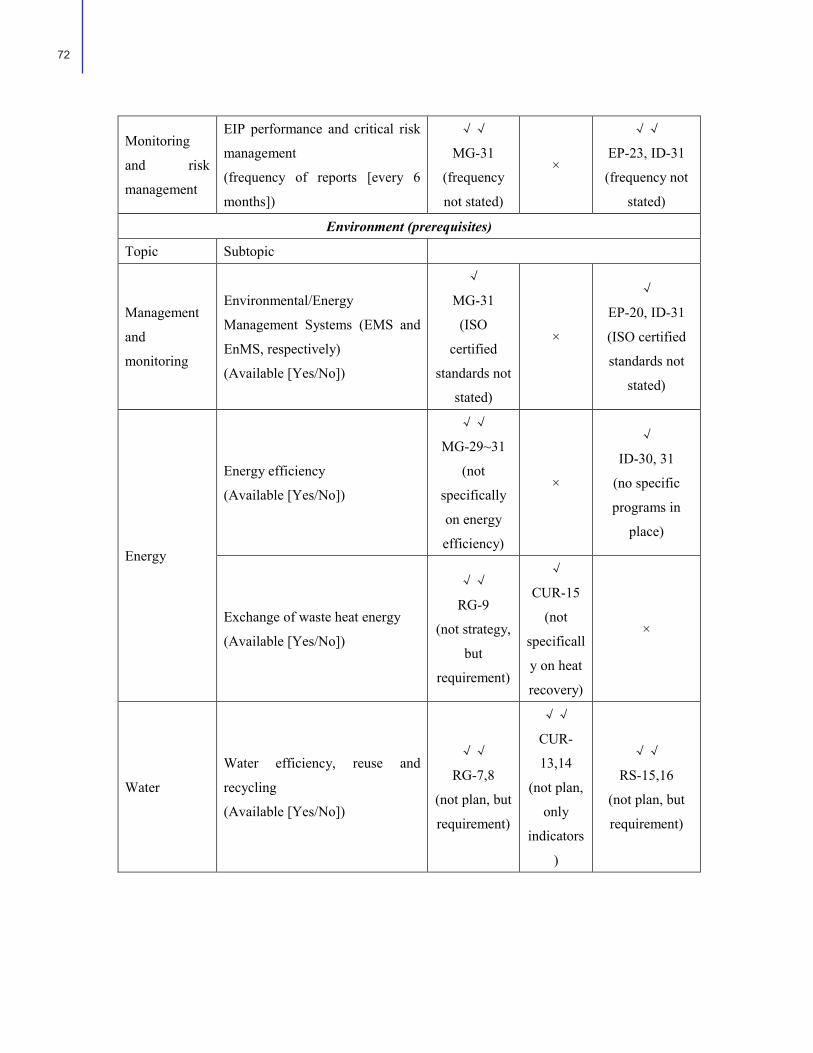
Monitoring
and risk
management
EIP performance and critical risk
management
(frequency of reports [every 6
months])
√√
MG-31
(frequency
not stated)
×
√√
EP-23, ID-31
(frequency not
stated)
Environment (prerequisites)
Topic Subtopic
Management
and
monitoring
Environmental/Energy
Management Systems (EMS and
EnMS, respectively)
(Available [Yes/No])
√
MG-31
(ISO
certified
standards not
stated)
×
√
EP-20, ID-31
(ISO certified
standards not
stated)
Energy
Energy efficiency
(Available [Yes/No])
√√
MG-29~31
(not
specifically
on energy
efficiency)
×
√
ID-30, 31
(no specific
programs in
place)
Exchange of waste heat energy
(Available [Yes/No])
√√
RG-9
(not strategy,
but
requirement)
√
CUR-15
(not
specificall
y on heat
recovery)
×
Water
Water efficiency, reuse and
recycling
(Available [Yes/No])
√√
RG-7,8
(not plan, but
requirement)
√√
CUR-
13,14
(not plan,
only
indicators
)
√√
RS-15,16
(not plan, but
requirement)
72

Climate
change and the
natural
environment
Air, GHG emissions and pollution
prevention
(Available [Yes/No])
√√
EG-2,3; HG-
22
(target for
carbon
reduction, no
monitoring
program
required for
other GHGs)
√
PE-20;
OI-25,26
(only
includes
CO2
emission
and
renewable
energy
indicators
)
√√
RS-12; EP-26
(target for
carbon
reduction, no
monitoring
program
required for
other GHGs)
Environmental assessment and
ecosystem services
(Available [Yes/No])
√
HG-26~28
(green
coverage in
particular)
×
√
EP-29
(green coverage
in particular)
Environment (performance indicators)
Topic Subtopic (unit [target value])
Management
and
monitoring
Environmental/Energy
Management Systems (EMS and
EnMS, respectively)
(% of firms with >250 employees
which have such systems [40%])
√
BR-7, MG-
31
(ISO
certified
standards not
stated)
×
√
EP-20, ID-31
(ISO certified
standards not
stated)
Energy
Energy consumption
(% of combined park & firm level
energy consumption metered and
monitored [90%])
× × ×
73
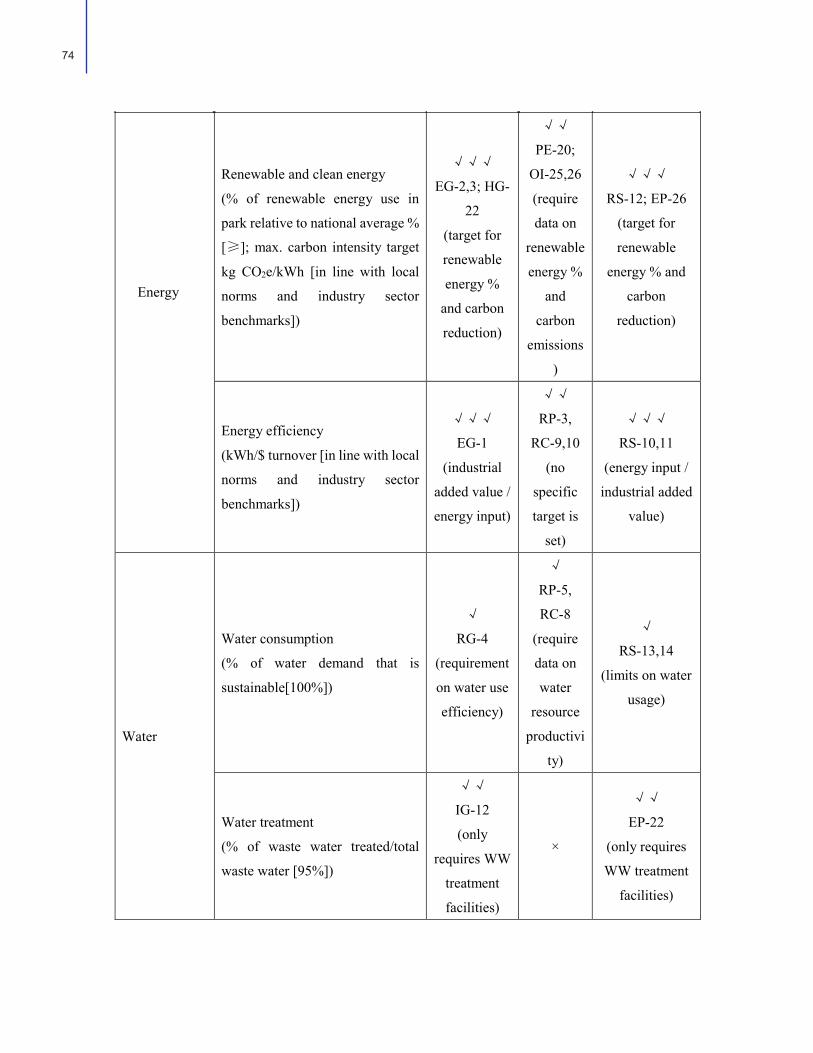
Energy
Renewable and clean energy
(% of renewable energy use in
park relative to national average %
[≥]; max. carbon intensity target
kg CO2e/kWh [in line with local
norms and industry sector
benchmarks])
√√√
EG-2,3; HG-
22
(target for
renewable
energy %
and carbon
reduction)
√√
PE-20;
OI-25,26
(require
data on
renewable
energy %
and
carbon
emissions
)
√√√
RS-12; EP-26
(target for
renewable
energy % and
carbon
reduction)
Energy efficiency
(kWh/$ turnover [in line with local
norms and industry sector
benchmarks])
√√√
EG-1
(industrial
added value /
energy input)
√√
RP-3,
RC-9,10
(no
specific
target is
set)
√√√
RS-10,11
(energy input /
industrial added
value)
Water
Water consumption
(% of water demand that is
sustainable[100%])
√
RG-4
(requirement
on water use
efficiency)
√
RP-5,
RC-8
(require
data on
water
resource
productivi
ty)
√
RS-13,14
(limits on water
usage)
Water treatment
(% of waste water treated/total
waste water [95%])
√√
IG-12
(only
requires WW
treatment
facilities)
×
√√
EP-22
(only requires
WW treatment
facilities)
Energy
74

Water efficiency, reuse and recycling
(% of water reused/total water consumed
[50%])
√√√
RG-7,8
(90%) (higher
target value than
EIP)
√√
CUR-14
(no target
value is set)
√√√
RS-15,16
(75%) (higher
target value than
EIP)
Waste/by-products re-use and recycling
(% of solid waste reused/total waste
[20%])
√√√
RG-6
(95%) (higher
target value than
EIP)
√√
CUR-12
(no target
value is set)
√√√
IS-6
(70%) − (higher
target value than
EIP)
Dangerous and toxic materials
(% of firms which appropriately handle
such materials [100%])
√√√
HG-21
(target value
[100%])
×
√√√
EP-24
(target value
[100%])
Waste disposal
(% of waste to landfill [<50%]) × × ×
Flora and fauna
(% of open space used for native flora and
fauna [5%])
√
HG-26~28
(green coverage
instead of native
flora and fauna)
×
√
EP-29
(green coverage
instead of native
flora and fauna)
Air, GHG emissions, and pollution
prevention
(% of firms which have pollution
prevention and emission reduction
strategies beyond national regulations
[50%]; % of largest polluters which have
a risk management framework [30%])
√√
BR-3,4
HG-24,25
(emission
requirements for
all firms &
environmental
management
framework on
park level)
×
√√
EP-17,18,20,
21,23
(emission
requirements for
key firms & risk
management
framework on park
level)
75

Social (performance indicators)
Topic Subtopic (unit [target value])
Social
management
systems
OH&S management system
(% of firms with more than 250
employees that have a well-
functioning OH&S system [75%])
× × ×
Grievance management
(% of grievances addressed within
90 days [100%]; % of grievances
brought to conclusion [60%]; % of
firms with more than 250
employees that have a code of
conduct system to deal with
grievances [75%])
× × ×
Harassment response
(% of firms with more than 250
employees that have a harassment
prevention and response system in
place [75%])
× × ×
Social
infrastructure
Primary social infrastructure
(% of surveyed employees
reporting satisfaction with social
infrastructure [80%])
× × ×
IP security
(% of reported security and safety
issues adequately addressed within
30 days [100%])
× × ×
76
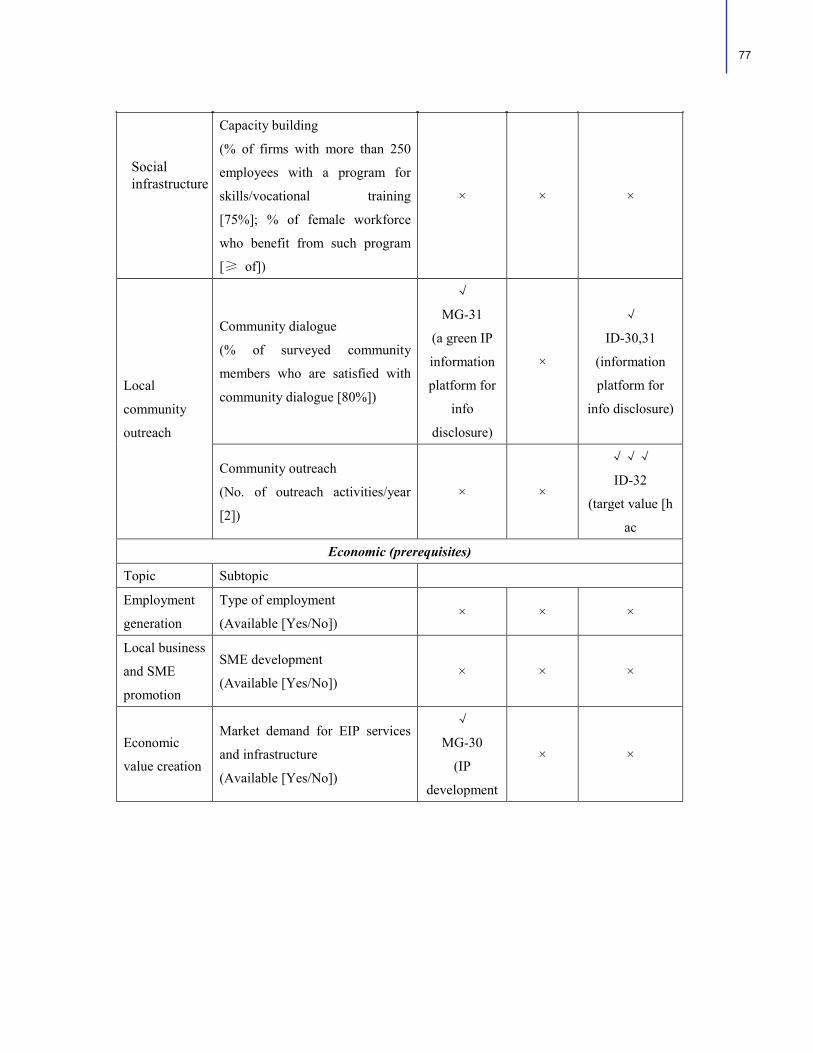
Capacity building
(% of firms with more than 250
employees with a program for
skills/vocational training
[75%]; % of female workforce
who benefit from such program
[≥ of])
× × ×
Local
community
outreach
Community dialogue
(% of surveyed community
members who are satisfied with
community dialogue [80%])
√
MG-31
(a green IP
information
platform for
info
disclosure)
×
√
ID-30,31
(information
platform for
info disclosure)
Community outreach
(No. of outreach activities/year
[2])
× ×
√√√
ID-32
(target value [h
ac
Economic (prerequisites)
Topic Subtopic
Employment
generation
Type of employment
(Available [Yes/No]) × × ×
Local business
and SME
promotion
SME development
(Available [Yes/No]) × × ×
Economic
value creation
Market demand for EIP services
and infrastructure
(Available [Yes/No])
√
MG-30
(IP
development
× ×
Socialinfrastructure
77

Economic (performance indicators)
Topic Subtopic (unit [target value])
Employment
generation
Local employment generation
(% of employees who live within
daily commuting distance [60%])
× × ×
Type of employment
(% of employees employed
through direct employment [25%])
× × ×
Local business
and SME
promotion
Local value added
(% of firms using local suppliers or
service providers for munity
dialogue [ training [75%];25%]; %
of total procurement value of park
management entity by local firms
or service providers [90%])
× × ×
Economic
value creation
Investment-ready park for firms
(average percent occupancy rate –
rented or used by resident firms
over 5 years [50%])
× × ×
78
Source: World Bank compilationNote: The number of check markets (√) refer to the extent of compatibility/similarity between requirements/stan-dards. √√√ = high level of compatibility/similarity√√ = medium level of compatibility/similarity√ = low level of compatibility/similarity but still share similarities× = no or extremely low compatibility/similarity
The letters and numbers in the final three columns refer to the index and indicators' number. BR = basic requirements;CUR = comprehensive utilization of resources; EP = environmental protection; HG = ecological environment green index; ID = information disclosure; IG = infrastructure green index; MG = management green index; RS = resource saving;CO2 = carbon dioxide;
EIP = eco-industrial park; GHG = greenhouse gas emissions; ISO = International Organization for Standardization; MEE = Ministry of Ecology and Environment; MIIT = Ministry of Industry and Information Technology; NDRC = National Development and Reform Commission; OH&S = occupational health and safety; SME = small and medium enterprise.

Table E.2 A detailed comparison between the Chinese standards and the EIP Framework
The EIP Framework standards MIIT NDRC MEE
Park
management
Prerequisites
(subtopics) (5)
√√√
√√
√
×
1/5
3/5
1/5
0
0
0
0
5/5
1/5 2/5 2/5 0
√/× 5/0 0/5 5/0
No. of
√ 10 0 9
Performance
indicators
(subtopics) (3)
√√√
√√
√
×
0
1/3
0
2/3
0
0
0
3/3
0 1/3 0
2/3 √/× 1/2 0/3 1/2 No. of
√ 2 0 2
Environment
Prerequisites
(subtopics) (6)
√√√
√√
√
×
0
4/6
2/6
0
0
1/6
2/6
3/6
0 2/6 3/6 1/6
√/× 6/0 3/3 5/1 No. of
√ 10 4 7
Performance
indicators
(subtopics)
(12)
√√√
√√
√
×
5/12
2/12
3/12
2/12
0
4/12
1/12
7/12
5/12 2/12 3/12 2/12
√/× 10/2 5/7 10/2 No. of
√ 22 9 22
79
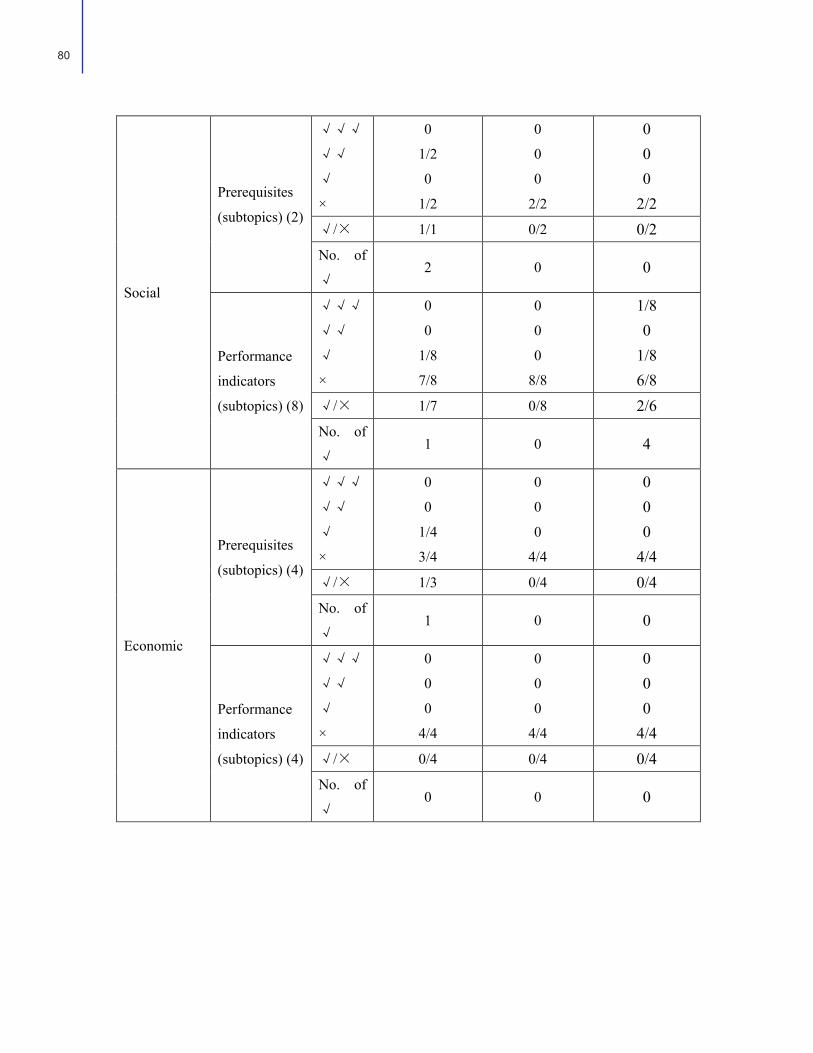
Social
Prerequisites
(subtopics) (2)
√√√
√√
√
×
0
1/2
0
1/2
0
0
0
2/2
0 0 0
2/2 √/× 1/1 0/2 0/2 No. of
√ 2 0 0
Performance
indicators
(subtopics) (8)
√√√
√√
√
×
0
0
1/8
7/8
0
0
0
8/8
1/8 0
1/8 6/8
√/× 1/7 0/8 2/6 No. of
√ 1 0 4
Economic
Prerequisites
(subtopics) (4)
√√√
√√
√
×
0
0
1/4
3/4
0
0
0
4/4
0 0 0
4/4 √/× 1/3 0/4 0/4 No. of
√ 1 0 0
Performance
indicators
(subtopics) (4)
√√√
√√
√
×
0
0
0
4/4
0
0
0
4/4
0 0 0
4/4 √/× 0/4 0/4 0/4 No. of
√ 0 0 0
80
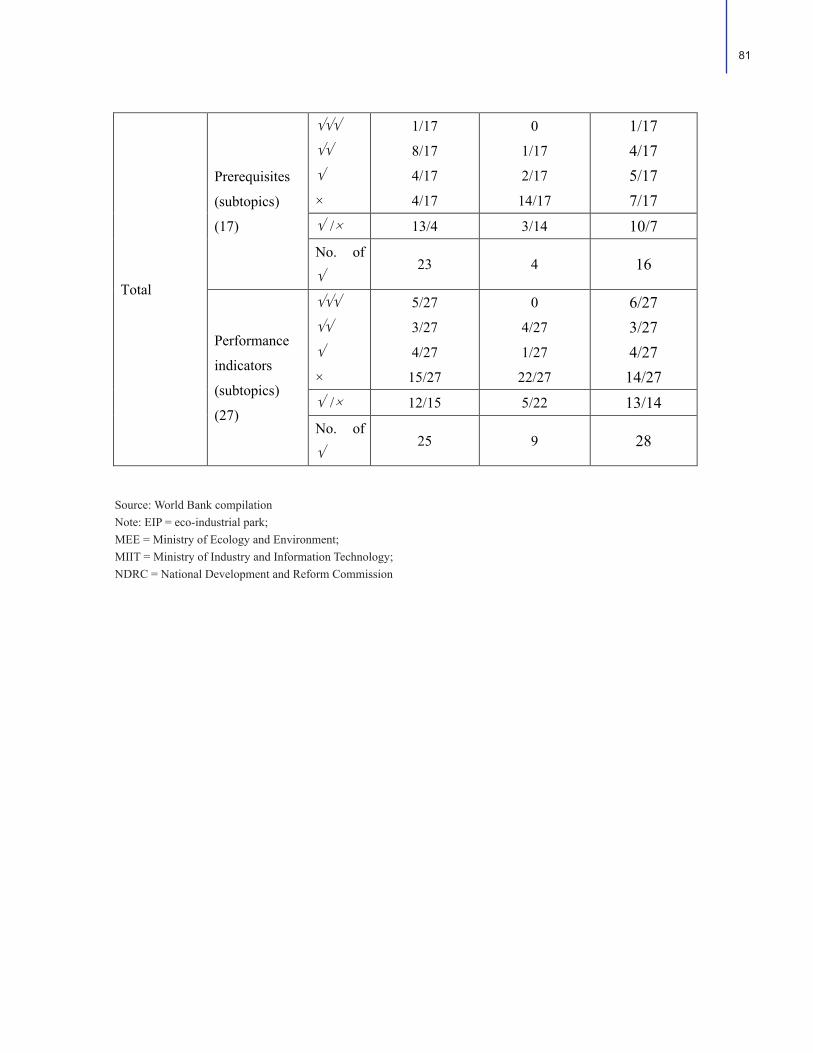
Source: World Bank compilationNote: EIP = eco-industrial park; MEE = Ministry of Ecology and Environment; MIIT = Ministry of Industry and Information Technology; NDRC = National Development and Reform Commission
Total
Prerequisites
(subtopics)
(17)
√√√
√√
√
×
1/17
8/17
4/17
4/17
0
1/17
2/17
14/17
1/17 4/17 5/17 7/17
√ /× 13/4 3/14 10/7 No. of
√ 23 4 16
Performance
indicators
(subtopics)
(27)
√√√
√√
√
×
5/27
3/27
4/27
15/27
0
4/27
1/27
22/27
6/27 3/27 4/27 14/27
√ /× 12/15 5/22 13/14 No. of
√ 25 9 28
81
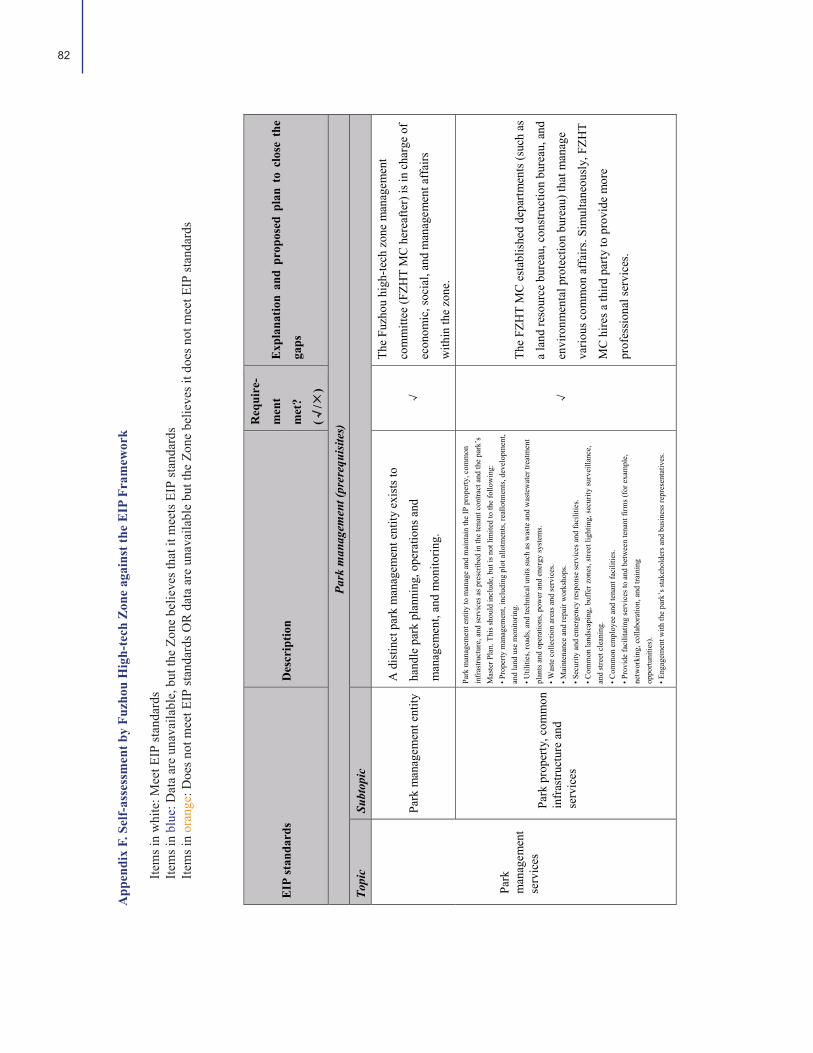
App
endi
x F.
Sel
f-as
sess
men
t by
Fuzh
ou H
igh-
tech
Zon
e ag
ains
t the
EIP
Fra
mew
ork
Item
s in
whi
te: M
eet E
IP st
anda
rds
Item
s in
blue
: Dat
a ar
e un
avai
labl
e, b
ut th
e Zo
ne b
elie
ves t
hat i
t mee
ts E
IP st
anda
rds
Item
s in
oran
ge: D
oes n
ot m
eet E
IP st
anda
rds O
R d
ata
are
unav
aila
ble
but t
he Z
one
belie
ves i
t doe
s not
mee
t EIP
stan
dard
s
EIP
stan
dard
s D
escr
iptio
n
Req
uire
-
men
t
met
?
(√/×
)
Exp
lana
tion
and
prop
osed
pla
n to
clo
se t
he
gaps
Park
man
agem
ent (
prer
equi
site
s)
Topi
c Su
btop
ic
Park
man
agem
ent e
ntity
A d
istin
ct p
ark
man
agem
ent e
ntity
exi
sts t
o
hand
le p
ark
plan
ning
, ope
ratio
ns a
nd
man
agem
ent,
and
mon
itorin
g.
√
The
Fuzh
ou h
igh-
tech
zon
e m
anag
emen
t
com
mitt
ee (F
ZHT
MC
her
eafte
r) is
in c
harg
e of
econ
omic
, soc
ial,
and
man
agem
ent a
ffai
rs
with
in th
e zo
ne.
√
The
FZH
T M
C e
stab
lishe
d de
partm
ents
(suc
h as
a la
nd re
sour
ce b
urea
u, c
onst
ruct
ion
bure
au, a
nd
envi
ronm
enta
l pro
tect
ion
bure
au) t
hat m
anag
e
vario
us c
omm
on a
ffai
rs. S
imul
tane
ousl
y, F
ZHT
MC
hire
s a th
ird p
arty
to p
rovi
de m
ore
prof
essi
onal
serv
ices
.
Park
man
agem
ent
serv
ices
Pa
rk p
rope
rty, c
omm
on
infr
astru
ctur
e an
d se
rvic
es
Park
man
agem
ent e
ntity
to m
anag
e an
d m
aint
ain
the
IP p
rope
rty, c
omm
on
infr
astru
ctur
e, a
nd se
rvic
es a
s pre
scrib
ed in
the
tena
nt c
ontra
ct a
nd th
e pa
rk’s
M
aste
r Pla
n. T
his s
houl
d in
clud
e, b
ut is
not
lim
ited
to th
e fo
llow
ing:
• Pro
perty
man
agem
ent,
incl
udin
g pl
ot a
llotm
ents
, rea
llotm
ents
, dev
elop
men
t, an
d la
nd u
se m
onito
ring.
• Util
ities
, roa
ds, a
nd te
chni
cal u
nits
such
as w
aste
and
was
tew
ater
trea
tmen
t pl
ants
and
ope
ratio
ns, p
ower
and
ene
rgy
syst
ems.
• Was
te c
olle
ctio
n ar
eas a
nd se
rvic
es.
• Mai
nten
ance
and
repa
ir w
orks
hops
.• S
ecur
ity a
nd e
mer
genc
y re
spon
se se
rvic
es a
nd fa
cilit
ies.
• Com
mon
land
scap
ing,
buf
fer z
ones
, stre
et li
ghtin
g, se
curit
y su
rvei
llanc
e,
and
stre
et c
lean
ing.
• Com
mon
em
ploy
ee a
nd te
nant
faci
litie
s.• P
rovi
de fa
cilit
atin
g se
rvic
es to
and
bet
wee
n te
nant
firm
s (fo
r exa
mpl
e,
netw
orki
ng, c
olla
bora
tion,
and
trai
ning
oppo
rtuni
ties)
.• E
ngag
emen
t with
the
park
’s st
akeh
olde
rs a
nd b
usin
ess r
epre
sent
ativ
es.
82
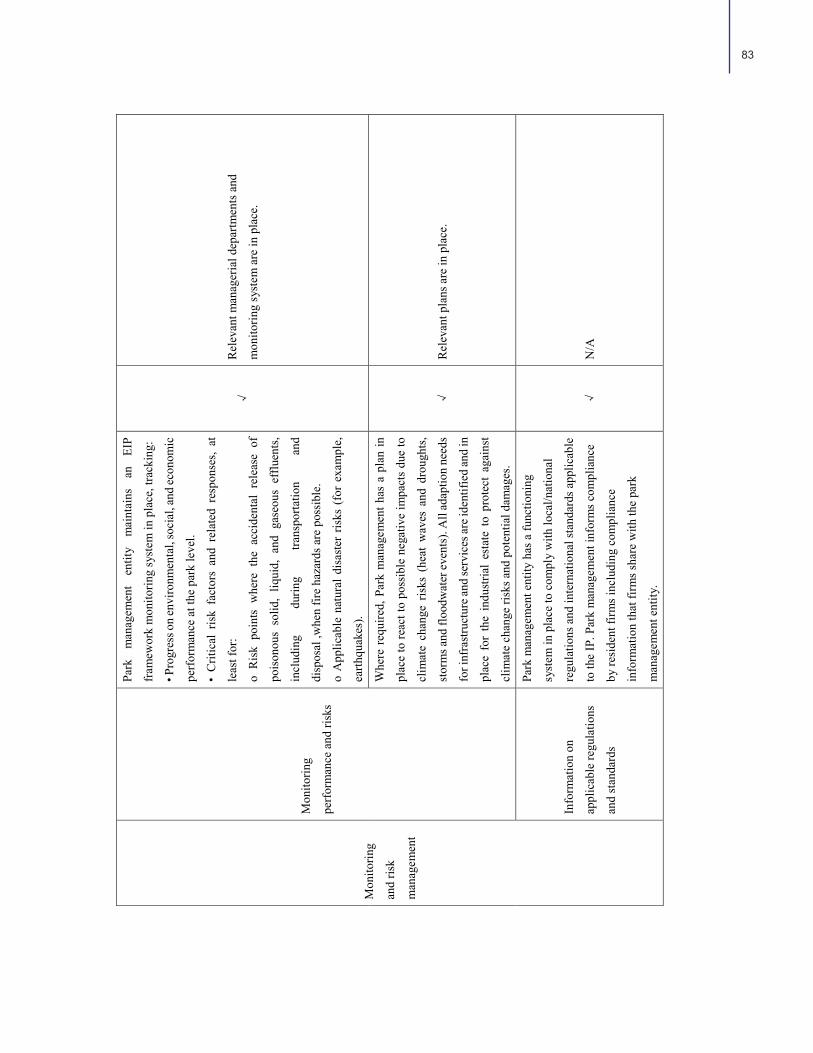
Mon
itorin
g
and
risk
man
agem
ent
Mon
itorin
g
perf
orm
ance
and
risk
s
Park
m
anag
emen
t en
tity
mai
ntai
ns
an
EIP
fram
ewor
k m
onito
ring
syst
em in
pla
ce, t
rack
ing:
• Pro
gres
s on
envi
ronm
enta
l, so
cial
, and
econ
omic
perf
orm
ance
at t
he p
ark
leve
l.
• C
ritic
al r
isk
fact
ors
and
rela
ted
resp
onse
s, at
leas
t for
:
o R
isk
poin
ts w
here
the
acc
iden
tal
rele
ase
of
pois
onou
s so
lid,
liqui
d, a
nd g
aseo
us e
fflu
ents
,
incl
udin
g du
ring
trans
porta
tion
and
disp
osal
,whe
n fir
e ha
zard
s are
pos
sibl
e.
o A
pplic
able
nat
ural
dis
aste
r ris
ks (
for
exam
ple,
earth
quak
es).
√
Rel
evan
t man
ager
ial d
epar
tmen
ts a
nd
mon
itorin
g sy
stem
are
in p
lace
.
Whe
re r
equi
red,
Par
k m
anag
emen
t has
a p
lan
in
plac
e to
reac
t to
poss
ible
neg
ativ
e im
pact
s du
e to
clim
ate
chan
ge r
isks
(he
at w
aves
and
dro
ught
s,
stor
ms a
nd fl
oodw
ater
even
ts).
All
adap
tion
need
s
for i
nfra
stru
ctur
e and
serv
ices
are i
dent
ified
and
in
plac
e fo
r th
e in
dust
rial
esta
te t
o pr
otec
t ag
ains
t
clim
ate
chan
ge ri
sks a
nd p
oten
tial d
amag
es.
√
Rel
evan
t pla
ns a
re in
pla
ce.
Info
rmat
ion
on
appl
icab
le re
gula
tions
and
stan
dard
s
Park
man
agem
ent e
ntity
has
a fu
nctio
ning
syst
em in
pla
ce to
com
ply
with
loca
l/nat
iona
l
regu
latio
ns a
nd in
tern
atio
nal s
tand
ards
app
licab
le
to th
e IP
. Par
k m
anag
emen
t inf
orm
s com
plia
nce
by re
side
nt fi
rms i
nclu
ding
com
plia
nce
info
rmat
ion
that
firm
s sha
re w
ith th
e pa
rk
man
agem
ent e
ntity
.
√
N/A
83

Prop
ortio
n of
firm
s in
the
IP to
hav
e si
gned
a re
side
ncy
cont
ract
/par
k ch
arte
r/cod
e of
con
duct
(dep
endi
ng o
n w
hat
is le
gally
bin
ding
on
park
firm
s acc
ordi
ng to
the
exis
ting
legi
slat
ion
in th
e co
untry
); an
d ad
ditio
nal l
egal
ly b
indi
ng
arra
ngem
ents
that
em
pow
er th
e pa
rk m
anag
emen
t ent
ity
to p
erfo
rm it
s res
pons
ibili
ties a
nd ta
sks a
nd c
harg
e fe
es
(som
etim
es a
bsor
bed
in re
ntal
fees
) for
com
mon
serv
ices
. Th
is m
ay in
clud
e tra
nspa
rent
fees
for s
ervi
ces p
erta
inin
g to
the
achi
evem
ent o
f EIP
per
form
ance
targ
ets.
Plan
ning
and
zoni
ng
Mas
ter p
lan
A M
aste
r Pla
n (o
r equ
ival
ent p
lann
ing
docu
men
t) fo
r any
new
and
exi
stin
g IP
has
bee
n
deve
lope
d an
d is
revi
ewed
per
iodi
cally
(and
upda
ted
if re
quire
d), i
nclu
ding
the
follo
win
g co
re
elem
ents
:
• Site
sel
ectio
n st
udy
base
d on
var
ious
risk
anal
yses
; ess
entia
l and
eff
icie
nt in
fras
truct
ure,
utili
ties,
and
tran
spor
tatio
n ne
twor
k;
envi
ronm
enta
l and
soc
ial i
ssue
s; in
tern
al p
ark
land
zon
ing;
buf
fer z
one
arou
nd th
e pa
rk;
proc
edur
e to
saf
ely
loca
te h
igh
risk
indu
strie
s;
and
clus
ter s
yner
gist
ic in
dust
ries.
• Int
egra
tion
into
Mas
ter P
lan
of re
leva
nt
requ
irem
ents
spe
cifie
d in
this
EIP
fram
ewor
k
that
hav
e sp
atia
l im
plic
atio
ns.
√
Soci
oeco
nom
ic d
evel
opm
ent p
lans
, urb
an
deve
lopm
ent p
lans
, lan
d re
sour
ce u
tiliz
atio
n
plan
s, a
nd in
dust
rial p
lans
are
all
in p
lace
.
Park
man
agem
ent (
perf
orm
ance
indi
cato
rs)
Topi
c Su
btop
ic
(uni
t [ta
rget
val
ue])
Park
man
agem
ent
serv
ices
Park
man
agem
ent
empo
wer
men
t
100%
[100
%]
N/A
Park
man
agem
ent e
ntity
prop
erty
and
com
mon
infr
astru
ctur
e
The
resi
dent
firm
s ind
icat
e sa
tisfa
ctio
n w
ith re
gard
to
the
prov
isio
n of
serv
ices
and
com
mon
infr
astru
ctur
e by
the
park
man
agem
ent’s
ent
ity (o
r alte
rnat
ive
agen
cy,
whe
re a
pplic
able
).
≥95
%
[75%
]
Park
surv
eys f
irm sa
tisfa
ctio
n w
ith th
e pa
rk
man
agem
ent e
very
six
mon
ths.
The
aver
age
satis
fact
ion
rate
is a
bove
95%
.
84
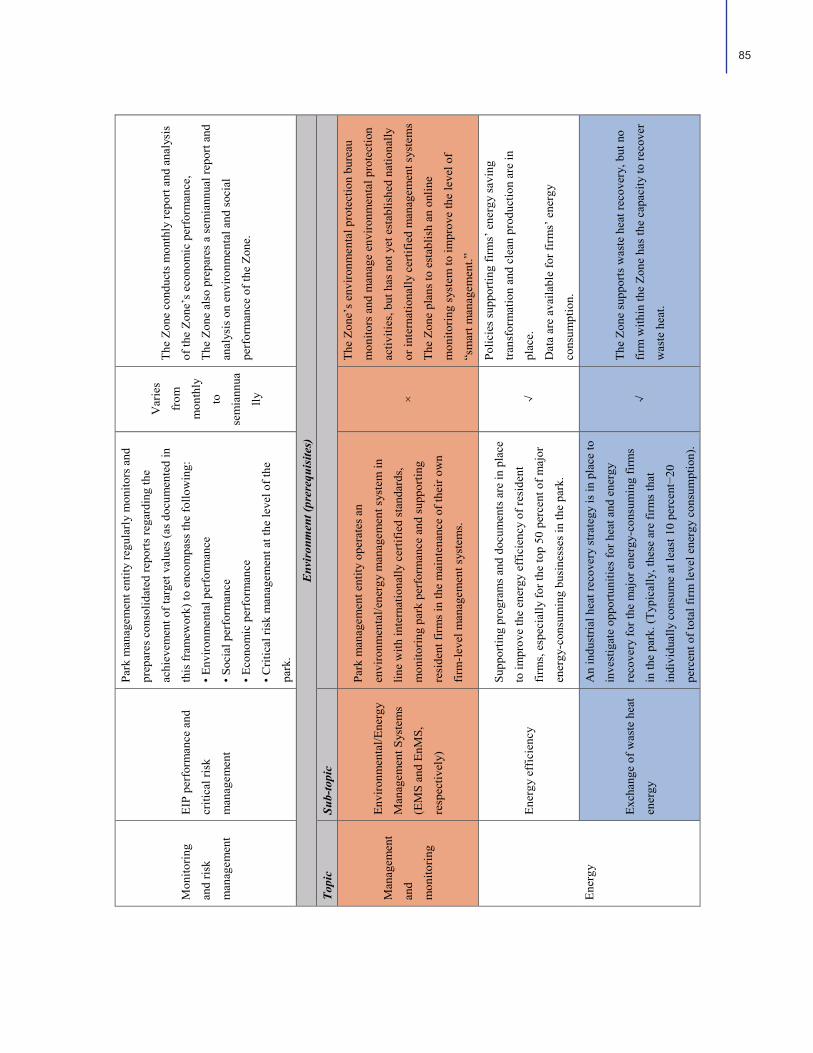
Mon
itorin
g
and
risk
man
agem
ent
EIP
perf
orm
ance
and
criti
cal r
isk
man
agem
ent
Park
man
agem
ent e
ntity
regu
larl
y m
onito
rs a
nd
prep
ares
con
solid
ated
repo
rts re
gard
ing
the
achi
evem
ent o
f tar
get v
alue
s (a
s do
cum
ente
d in
this
fram
ewor
k) to
enc
ompa
ss th
e fo
llow
ing:
• Env
ironm
enta
l per
form
ance
• Soc
ial p
erfo
rman
ce
• Eco
nom
ic p
erfo
rman
ce
• Crit
ical
risk
man
agem
ent a
t the
leve
l of t
he
park
.
Var
ies
from
mon
thly
to
sem
iann
ua
lly
The
Zone
con
duct
s m
onth
ly re
port
and
anal
ysis
of th
e Zo
ne’s
eco
nom
ic p
erfo
rman
ce,
The
Zone
als
o pr
epar
es a
sem
iann
ual r
epor
t and
anal
ysis
on
envi
ronm
enta
l and
soc
ial
perf
orm
ance
of t
he Z
one.
Env
iron
men
t (pr
ereq
uisi
tes)
Topi
c Su
b-to
pic
Man
agem
ent
and
mon
itorin
g
Envi
ronm
enta
l/Ene
rgy
Man
agem
ent S
yste
ms
(EM
S an
d En
MS,
resp
ectiv
ely)
Park
man
agem
ent e
ntity
ope
rate
s an
envi
ronm
enta
l/ene
rgy
man
agem
ent s
yste
m in
line
with
inte
rnat
iona
lly c
ertif
ied
stan
dard
s,
mon
itorin
g pa
rk p
erfo
rman
ce a
nd s
uppo
rting
resi
dent
firm
s in
the
mai
nten
ance
of t
heir
own
firm
-leve
l man
agem
ent s
yste
ms.
×
The
Zone
’s e
nviro
nmen
tal p
rote
ctio
n bu
reau
mon
itors
and
man
age
envi
ronm
enta
l pro
tect
ion
activ
ities
, but
has
not
yet
est
ablis
hed
natio
nally
or in
tern
atio
nally
cer
tifie
d m
anag
emen
t sys
tem
s
The
Zone
pla
ns to
est
ablis
h an
onl
ine
mon
itorin
g sy
stem
to im
prov
e th
e le
vel o
f
“sm
art m
anag
emen
t.”
Ener
gy
Ener
gy e
ffic
ienc
y
Supp
ortin
g pr
ogra
ms
and
docu
men
ts a
re in
pla
ce
to im
prov
e th
e en
ergy
eff
icie
ncy
of re
side
nt
firm
s, e
spec
ially
for t
he to
p 50
per
cent
of m
ajor
ener
gy-c
onsu
min
g bu
sine
sses
in th
e pa
rk.
√
Polic
ies
supp
ortin
g fir
ms’
ene
rgy
savi
ng
trans
form
atio
n an
d cl
ean
prod
uctio
n ar
e in
plac
e.
Dat
a ar
e av
aila
ble
for f
irms’
ene
rgy
cons
umpt
ion.
Exch
ange
of w
aste
hea
t
ener
gy
An
indu
stria
l hea
t rec
over
y st
rate
gy is
in p
lace
to
inve
stig
ate
oppo
rtuni
ties
for h
eat a
nd e
nerg
y
reco
very
for t
he m
ajor
ene
rgy-
cons
umin
g fir
ms
in th
e pa
rk. (
Typi
cally
, the
se a
re fi
rms
that
indi
vidu
ally
con
sum
e at
leas
t 10
perc
ent−
20
perc
ent o
f tot
al fi
rm le
vel e
nerg
y co
nsum
ptio
n).
√
The
Zone
sup
ports
was
te h
eat r
ecov
ery,
but
no
firm
with
in th
e Zo
ne h
as th
e ca
paci
ty to
reco
ver
was
te h
eat.
85
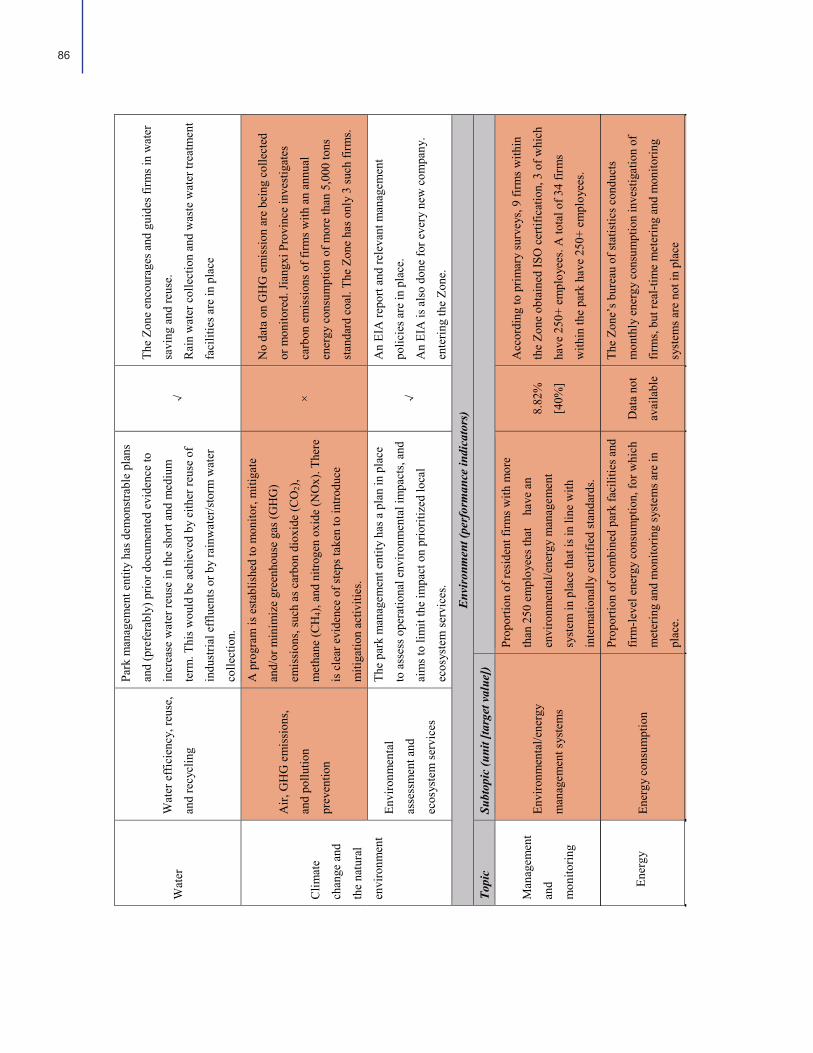
Wat
er
Wat
er e
ffic
ienc
y, re
use,
and
recy
clin
g
Park
man
agem
ent e
ntity
has
dem
onst
rabl
e pl
ans
and
(pre
fera
bly)
prio
r doc
umen
ted
evid
ence
to
incr
ease
wat
er re
use
in th
e sh
ort a
nd m
ediu
m
term
. Thi
s wou
ld b
e ac
hiev
ed b
y ei
ther
reus
e of
indu
stria
l eff
luen
ts o
r by
rain
wat
er/s
torm
wat
er
colle
ctio
n.
√
The
Zone
enc
oura
ges a
nd g
uide
s firm
s in
wat
er
savi
ng a
nd re
use.
Rai
n w
ater
col
lect
ion
and
was
te w
ater
trea
tmen
t
faci
litie
s are
in p
lace
Clim
ate
chan
ge a
nd
the
natu
ral
envi
ronm
ent
Air,
GH
G e
mis
sion
s,
and
pollu
tion
prev
entio
n
A p
rogr
am is
est
ablis
hed
to m
onito
r, m
itiga
te
and/
or m
inim
ize
gree
nhou
se g
as (G
HG
)
emis
sion
s, su
ch a
s car
bon
diox
ide
(CO
2),
met
hane
(CH
4), a
nd n
itrog
en o
xide
(NO
x). T
here
is c
lear
evi
denc
e of
step
s tak
en to
intro
duce
miti
gatio
n ac
tiviti
es.
×
No
data
on
GH
G e
mis
sion
are
bei
ng c
olle
cted
or m
onito
red.
Jian
gxi P
rovi
nce
inve
stig
ates
carb
on e
mis
sion
s of f
irms w
ith a
n an
nual
ener
gy c
onsu
mpt
ion
of m
ore
than
5,0
00 to
ns
stan
dard
coa
l. Th
e Zo
ne h
as o
nly
3 su
ch fi
rms.
Envi
ronm
enta
l
asse
ssm
ent a
nd
ecos
yste
m se
rvic
es
The
park
man
agem
ent e
ntity
has
a p
lan
in p
lace
to a
sses
s ope
ratio
nal e
nviro
nmen
tal i
mpa
cts,
and
aim
s to
limit
the
impa
ct o
n pr
iorit
ized
loca
l
ecos
yste
m se
rvic
es.
√
An
EIA
repo
rt an
d re
leva
nt m
anag
emen
t
polic
ies a
re in
pla
ce.
An
EIA
is a
lso
done
for e
very
new
com
pany
.
ente
ring
the
Zone
.
Env
iron
men
t (pe
rfor
man
ce in
dica
tors
)
Topi
c Su
btop
ic (u
nit [
targ
et v
alue
])
Man
agem
ent
and
mon
itorin
g
Envi
ronm
enta
l/ene
rgy
man
agem
ent s
yste
ms
Prop
ortio
n of
resi
dent
firm
s with
mor
e
than
250
em
ploy
ees t
hat
hav
e an
envi
ronm
enta
l/ene
rgy
man
agem
ent
syst
em in
pla
ce th
at is
in li
ne w
ith
inte
rnat
iona
lly c
ertif
ied
stan
dard
s.
8.82
%
[40%
]
Acc
ordi
ng to
prim
ary
surv
eys,
9 fir
ms w
ithin
the
Zone
obt
aine
d IS
O c
ertif
icat
ion,
3 o
f whi
ch
have
250
+ em
ploy
ees.
A to
tal o
f 34
firm
s
with
in th
e pa
rk h
ave
250+
em
ploy
ees.
Ener
gy c
onsu
mpt
ion
Prop
ortio
n of
com
bine
d pa
rk fa
cilit
ies a
nd
firm
-leve
l ene
rgy
cons
umpt
ion,
for w
hich
met
erin
g an
d m
onito
ring
syst
ems a
re in
plac
e.
Dat
a no
t
avai
labl
e
The
Zone
’s b
urea
u of
stat
istic
s con
duct
s
mon
thly
ene
rgy
cons
umpt
ion
inve
stig
atio
n of
firm
s, bu
t rea
l-tim
e m
eter
ing
and
mon
itorin
g
syst
ems a
re n
ot in
pla
ce
Ener
gy
86
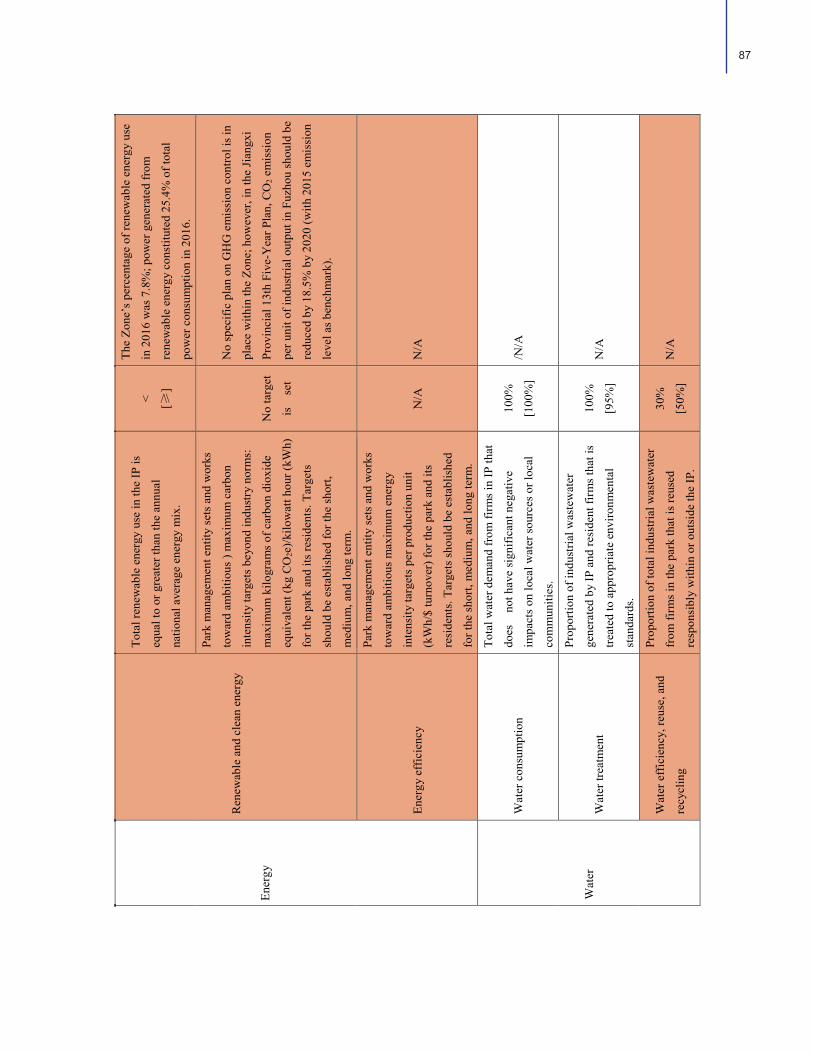
Ener
gy
Ren
ewab
le a
nd c
lean
ene
rgy
Tota
l ren
ewab
le e
nerg
y us
e in
the
IP is
equa
l to
or g
reat
er th
an th
e an
nual
natio
nal a
vera
ge e
nerg
y m
ix.
< [≥]
The
Zone
’s p
erce
ntag
e of
rene
wab
le e
nerg
y us
e
in 2
016
was
7.8
%; p
ower
gen
erat
ed fr
om
rene
wab
le e
nerg
y co
nstit
uted
25.
4% o
f tot
al
pow
er c
onsu
mpt
ion
in 2
016.
Park
man
agem
ent e
ntity
set
s an
d w
orks
tow
ard
ambi
tious
) m
axim
um c
arbo
n
inte
nsity
targ
ets
beyo
nd in
dust
ry n
orm
s:
max
imum
kilo
gram
s of
car
bon
diox
ide
equi
vale
nt (k
g C
O2e
)/kilo
wat
t hou
r (kW
h)
for t
he p
ark
and
its re
side
nts.
Tar
gets
shou
ld b
e es
tabl
ishe
d fo
r the
sho
rt,
med
ium
, and
long
term
.
No
targ
et
is
set
No
spec
ific
plan
on
GH
G e
mis
sion
con
trol i
s in
plac
e w
ithin
the
Zone
; how
ever
, in
the
Jian
gxi
Prov
inci
al 1
3th
Five
-Yea
r Pla
n, C
O2 e
mis
sion
per u
nit o
f ind
ustri
al o
utpu
t in
Fuzh
ou s
houl
d be
redu
ced
by 1
8.5%
by
2020
(with
201
5 em
issi
on
leve
l as
benc
hmar
k).
Ener
gy e
ffic
ienc
y
Park
man
agem
ent e
ntity
set
s an
d w
orks
tow
ard
ambi
tious
max
imum
ene
rgy
inte
nsity
targ
ets
per p
rodu
ctio
n un
it
(kW
h/$
turn
over
) for
the
park
and
its
resi
dent
s. T
arge
ts s
houl
d be
est
ablis
hed
for t
he s
hort,
med
ium
, and
long
term
.
N/A
N
/A
Wat
er
Wat
er c
onsu
mpt
ion
Tota
l wat
er d
eman
d fr
om fi
rms
in IP
that
does
no
t hav
e si
gnifi
cant
neg
ativ
e
impa
cts
on lo
cal w
ater
sou
rces
or l
ocal
com
mun
ities
.
100%
[100
%]
/N/A
Wat
er tr
eatm
ent
Prop
ortio
n of
indu
stria
l was
tew
ater
gene
rate
d by
IP a
nd re
side
nt fi
rms
that
is
treat
ed to
app
ropr
iate
env
ironm
enta
l
stan
dard
s.
100%
[95%
] N
/A
Wat
er e
ffic
ienc
y, re
use,
and
recy
clin
g
Prop
ortio
n of
tota
l ind
ustri
al w
aste
wat
er
from
firm
s in
the
park
that
is re
used
resp
onsi
bly
with
in o
r out
side
the
IP.
30%
[50%
] N
/A
Ener
gy
87

Was
te a
nd
mat
eria
l use
Was
te/b
y-pr
oduc
ts re
use
and
recy
clin
g
Prop
ortio
n of
solid
was
te g
ener
ated
by
firm
s, w
hich
is re
used
by
othe
r firm
s,
neig
hbor
ing
com
mun
ities
, or
mun
icip
aliti
es.
86%
[20%
] N
/A
Dan
gero
us a
nd to
xic
mat
eria
ls
Prop
ortio
n of
firm
s in
park
, whi
ch
appr
opria
tely
han
dle,
stor
e, tr
ansp
ort a
nd
disp
ose
of to
xic
and
haza
rdou
s mat
eria
ls.
100%
[100
%]
N/A
Was
te d
ispo
sal
Max
imum
pro
porti
on o
f was
tes g
ener
ated
by fi
rms i
n th
e IP
that
goe
s t
o la
ndfil
ls.
100%
[<50
%]
All
was
te g
oes t
o la
ndfil
ls.
Clim
ate
chan
ge a
nd
the
natu
ral
envi
ronm
ent
Flor
a an
d fa
una
Min
imum
pro
porti
on o
f ope
n sp
ace
in th
e
park
use
d fo
r nat
ive
flora
and
faun
a.
46%
[5%
] G
reen
cov
erag
e ra
te o
f the
Zon
e re
ache
s 46%
.
Air,
GH
G e
mis
sion
s, an
d
pollu
tion
prev
entio
n
Prop
ortio
n of
firm
s in
park
that
hav
e
pollu
tion
prev
entio
n an
d em
issi
on
redu
ctio
n st
rate
gies
to re
duce
the
inte
nsity
and
mas
s flo
w o
f pol
lutio
n/em
issi
on
rele
ase
beyo
nd n
atio
nal r
egul
atio
ns.
Dat
a N
/A
but
belie
ves t
o
be 1
00%
[50%
]
All
firm
s mus
t est
ablis
h po
llutio
n pr
even
tion
and
redu
ctio
n st
rate
gies
to e
nsur
e th
at th
ey m
eet
emis
sion
requ
irem
ents
.
EIA
and
ene
rgy
cons
umpt
ion
inve
stig
atio
n m
ust
be c
ondu
cted
and
env
ironm
enta
l pro
tect
ion
and
ener
gy sa
ving
are
com
puls
ory
requ
irem
ents
Prop
ortio
n of
larg
est p
ollu
ters
in IP
that
have
a ri
sk m
anag
emen
t fra
mew
ork
in
plac
e th
at: (
a) id
entif
ies t
he a
spec
ts th
at
have
an
impa
ct o
n th
e en
viro
nmen
t, an
d
(b) a
ssig
n a
leve
l of s
igni
fican
ce to
eac
h
envi
ronm
enta
l asp
ect.
Dat
a N
/A
but
belie
ves t
o
be 1
00%
[30%
]
All
firm
s mus
t hav
e en
viro
nmen
tal r
isk
man
agem
ent f
ram
ewor
k in
pla
ce to
ens
ure
no
envi
ronm
enta
l acc
iden
t cou
ld o
ccur
.
An
EIA
mus
t be
cond
ucte
d an
d av
oidi
ng
envi
ronm
enta
l acc
iden
ts is
a c
ompu
lsor
y
requ
irem
ent
88

Soci
al (p
rere
quis
ites)
Topi
c Su
btop
ic
Soci
al
man
agem
ent
syst
ems
Man
agem
ent t
eam
Ded
icat
ed p
erso
nnel
exi
st (a
s par
t of t
he
park
man
agem
ent e
ntity
) to
plan
and
man
age
soci
al q
ualit
y st
anda
rds.
√
The
Zone
’s b
urea
u of
soci
al a
ffai
rs, b
urea
u of
hum
an re
sour
ces a
nd so
cial
secu
rity,
and
the
depa
rtmen
t of h
ousi
ng m
anag
emen
t are
in
char
ge o
f pla
nnin
g an
d m
anag
ing
soci
al
deve
lopm
ent.
Soci
al
infr
astru
ctur
e Pr
imar
y so
cial
infr
astru
ctur
e
Prov
isio
n of
fund
amen
tal s
ocia
l
infr
astru
ctur
e in
the
IP o
r its
pro
xim
ity
also
faci
litat
e an
d en
cour
age
wom
en’s
empl
oym
ent,
for e
xam
ple,
lava
torie
s and
publ
ic to
ilets
(for
men
and
wom
en),
drin
king
wat
er fo
unta
ins,
prov
isio
n of
cafe
teria
s with
in re
ach
of th
e em
ploy
ees,
recr
eatio
nal a
reas
, and
chi
ldca
re
prog
ram
s. Th
is in
fras
truct
ure
need
s to
be
fully
ope
ratio
nal t
o en
cour
age
wom
en’s
empl
oym
ent.
√
N/A
89

Soci
al (p
erfo
rman
ce in
dica
tors
)
Topi
c Su
btop
ic (u
nit [
targ
et v
alue
])
Soci
al
man
agem
ent
syst
ems
OH
&S
man
agem
ent s
yste
m
Perc
enta
ge o
f all
firm
s in
the
IP w
ith m
ore
than
250
em
ploy
ees t
hat h
ave
a w
ell-
func
tioni
ng O
H&
S m
anag
emen
t sys
tem
in
plac
e.
Dat
a N
/A
but
belie
ves t
o
be 1
00%
[75%
]
All
firm
s mus
t est
ablis
h a
safe
pro
duct
ion
and
voca
tiona
l hea
lth m
anag
emen
t fra
mew
ork
to
ensu
re e
mpl
oyee
s’ h
ealth
and
that
no
prod
uctio
n
acci
dent
wou
ld o
ccur
. The
se
are
com
puls
ory
requ
irem
ents
Grie
vanc
e m
anag
emen
t
Perc
enta
ge o
f grie
vanc
es re
ceiv
ed b
y th
e
park
man
agem
ent e
ntity
that
ar
e
addr
esse
d w
ithin
90
days
.
Dat
a N
/A
but
belie
ves t
o
be 1
00%
[100
%]
The
Zone
pro
vide
s a v
arie
ty o
f way
s for
firm
s
to e
xpre
ss g
rieva
nces
, as w
ell a
s cor
resp
ondi
ng
grie
vanc
e re
solv
ing
mec
hani
sms,
incl
udin
g si
te
surv
eys i
n fir
ms,
regu
lar s
essi
ons w
ith fi
rms,
and
a se
rvic
e ho
tline
for f
irms.
Perc
enta
ge o
f gr
ieva
nces
rec
eive
d by
the
park
man
agem
ent e
ntity
that
wer
e br
ough
t
to c
oncl
usio
n.
Dat
a N
/A
but
belie
ves t
o
be >
90%
[60%
]
Alm
ost
all
reas
onab
le
grie
vanc
es
can
be
reso
lved
.
Perc
enta
ge o
f all
firm
s in
the
IP w
ith m
ore
than
250
em
ploy
ees t
hat h
ave
a co
de o
f
cond
uct s
yste
m in
pla
ce to
dea
l with
grie
vanc
es.
Dat
a N
/A
but
belie
ves t
o
be 1
00%
[75%
]
The
Zone
bel
ieve
s tha
t all
firm
s with
mor
e th
an
250
empl
oyee
s hav
e ad
min
istra
tive
depa
rtmen
ts
in c
harg
e of
man
agin
g an
d re
solv
ing
grie
vanc
es
from
em
ploy
ees.
Har
assm
ent r
espo
nse
Perc
enta
ge o
f all
firm
s in
the
IP w
ith m
ore
than
250
em
ploy
ees t
hat h
ave
a
hara
ssm
ent p
reve
ntio
n an
d re
spon
se
syst
em in
pla
ce.
Dat
a N
/A
but
belie
ves t
o
be 1
00%
[75%
]
The
Zone
bel
ieve
s tha
t all
firm
s with
mor
e th
an
250
empl
oyee
s hav
e a
hara
ssm
ent p
reve
ntio
n
and
resp
onse
syst
em in
pla
ce.
90

Soci
al
infr
astru
ctur
e
Prim
ary
soci
al in
fras
truct
ure
Perc
enta
ge o
f the
surv
eyed
em
ploy
ees’
repo
rting
satis
fact
ion
with
soci
al
infr
astru
ctur
e.
Dat
a N
/A
Indu
stria
l par
k se
curit
y
Perc
enta
ge o
f rep
orte
d se
curit
y an
d sa
fety
issu
es th
at a
re a
dequ
atel
y ad
dres
sed
with
in 3
0 da
ys.
Dat
a N
/A
but
belie
ves t
o
be 1
00%
[100
%]
The
Zone
has
rele
vant
ope
ratio
n an
d
mai
nten
ance
dep
artm
ent h
andl
ing
all k
inds
of
secu
rity
and
safe
ty is
sues
Cap
acity
bui
ldin
g
Perc
enta
ge o
f all
firm
s in
the
IP w
ith m
ore
than
250
em
ploy
ees w
ith a
pro
gram
for
skill
s/vo
catio
nal t
rain
ing
and
deve
lopm
ent.
100%
[75%
] N
/A
Perc
enta
ge o
f fem
ale
wor
kfor
ce w
ho
bene
fit fr
om a
vaila
ble
supp
ortin
g
infr
astru
ctur
e/pr
ogra
ms f
or sk
ills
deve
lopm
ent.
Dat
a N
/A
Gen
eral
supp
ortin
g in
fras
truct
ure
and
prog
ram
s
for s
kill
deve
lopm
ent i
n th
e Zo
ne a
re a
vaila
ble
to a
ll, so
in p
rinci
ple,
all
fem
ale
wor
kfor
ce c
an
bene
fit u
nles
s som
e ar
e no
t will
ing
to
parti
cipa
te.
Loca
l
com
mun
ity
outre
ach
Com
mun
ity d
ialo
gue
Ove
r 80
perc
ent o
f the
surv
eyed
com
mun
ity m
embe
rs a
re sa
tisfie
d w
ith th
e
com
mun
ity d
ialo
gue.
Dat
a N
/A
The
Zone
has
est
ablis
hed
info
rmat
ion
disc
losu
re
and
feed
back
fram
ewor
k, b
ut h
as n
ot d
one
the
surv
eys i
n qu
estio
n,
Com
mun
ity o
utre
ach
Num
ber o
f out
reac
h ac
tiviti
es
impl
emen
ted
by th
e pa
rk m
anag
emen
t
entit
y an
nual
ly th
at a
re re
gard
ed a
s
posi
tive
by o
ver 8
0 pe
rcen
t of t
he
surv
eyed
com
mun
ity m
embe
rs.
Dat
a N
/A
Dat
a ar
e N
/A, b
ut th
e Zo
ne d
oes h
ave
outre
ach
activ
ities
such
as w
orke
r rec
ruitm
ent,
bloo
d
dona
tions
, and
fest
ival
gal
as. T
hese
act
iviti
es
rece
ive
a hi
gh le
vel o
f rec
ogni
tion
from
com
mun
ity m
embe
rs.
91
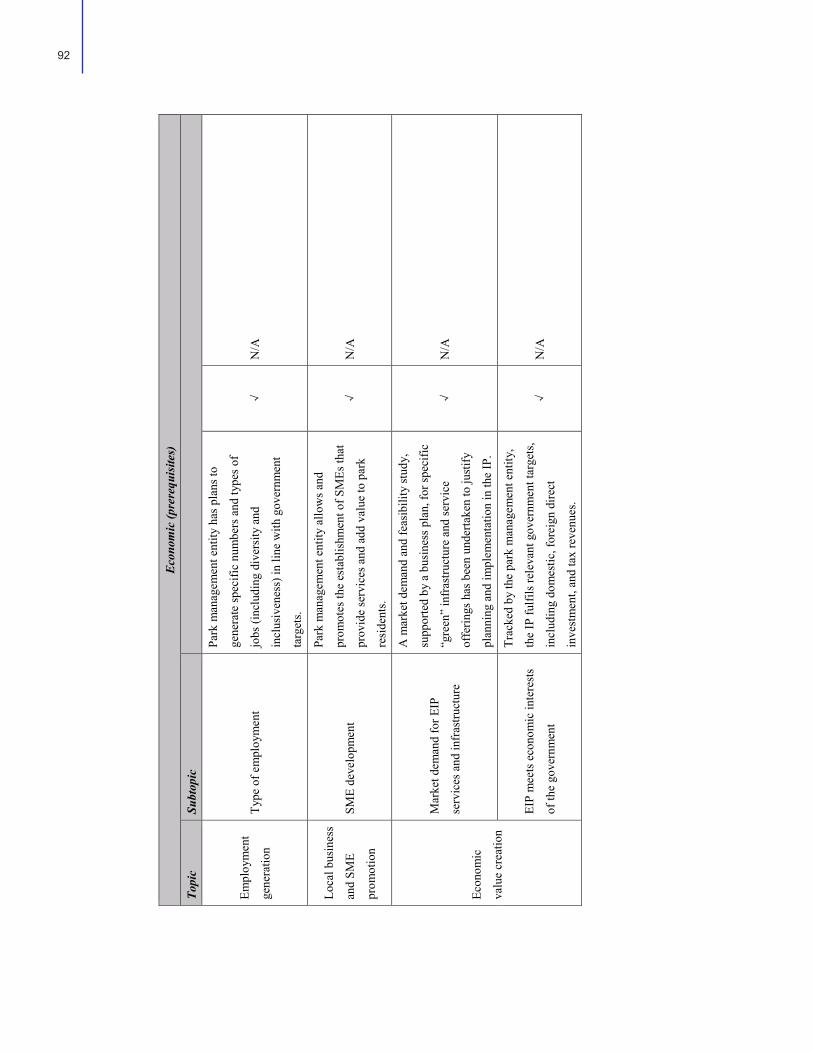
Eco
nom
ic (p
rere
quis
ites)
Topi
c Su
btop
ic
Empl
oym
ent
gene
ratio
n Ty
pe o
f em
ploy
men
t
Park
man
agem
ent e
ntity
has
pla
ns to
gene
rate
spec
ific
num
bers
and
type
s of
jobs
(inc
ludi
ng d
iver
sity
and
incl
usiv
enes
s) in
line
with
gov
ernm
ent
targ
ets.
√
N/A
Loca
l bus
ines
s
and
SME
prom
otio
n
SME
deve
lopm
ent
Park
man
agem
ent e
ntity
allo
ws a
nd
prom
otes
the
esta
blis
hmen
t of S
MEs
that
prov
ide
serv
ices
and
add
val
ue to
par
k
resi
dent
s.
√
N/A
Econ
omic
valu
e cr
eatio
n
Mar
ket d
eman
d fo
r EIP
serv
ices
and
infr
astru
ctur
e
A m
arke
t dem
and
and
feas
ibili
ty st
udy,
supp
orte
d by
a b
usin
ess p
lan,
for s
peci
fic
“gre
en”
infr
astru
ctur
e an
d se
rvic
e
offe
rings
has
bee
n un
derta
ken
to ju
stify
plan
ning
and
impl
emen
tatio
n in
the
IP.
√
N/A
EIP
mee
ts e
cono
mic
inte
rest
s
of th
e go
vern
men
t
Trac
ked
by th
e pa
rk m
anag
emen
t ent
ity,
the
IP fu
lfils
rele
vant
gov
ernm
ent t
arge
ts,
incl
udin
g do
mes
tic, f
orei
gn d
irect
inve
stm
ent,
and
tax
reve
nues
.
√
N/A
92
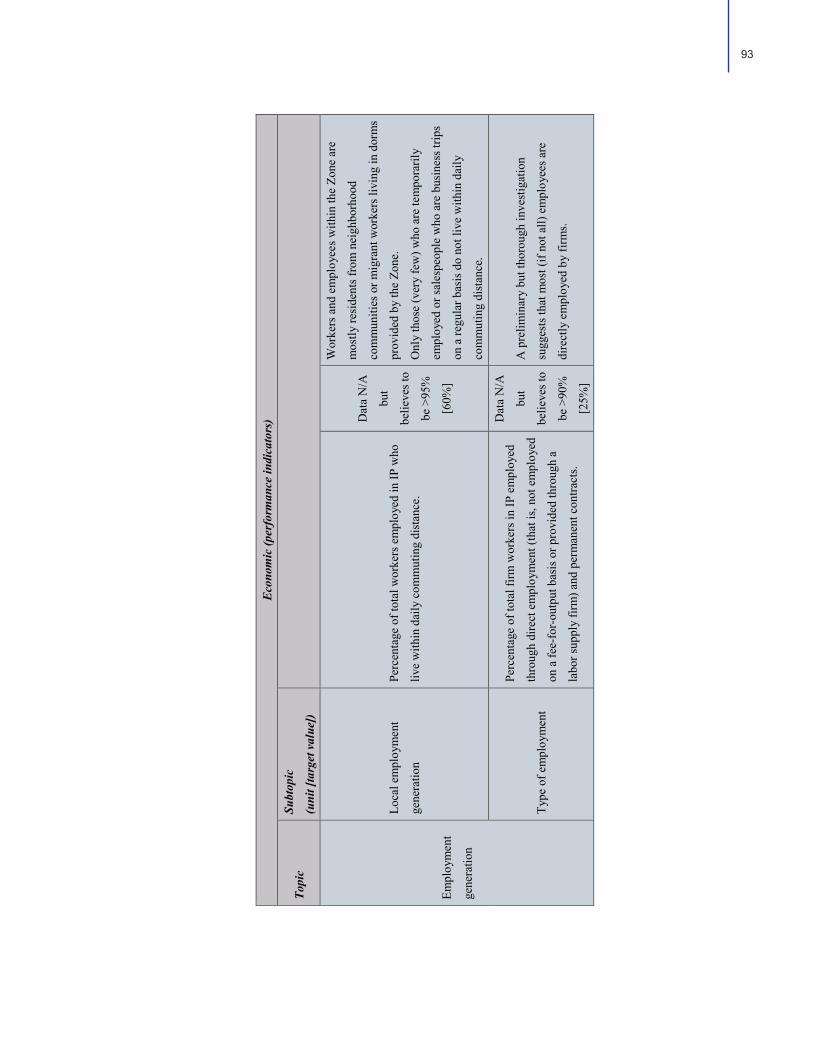
Eco
nom
ic (p
erfo
rman
ce in
dica
tors
)
Topi
c Su
btop
ic
(uni
t [ta
rget
val
ue])
Empl
oym
ent
gene
ratio
n
Loca
l em
ploy
men
t
gene
ratio
n
Perc
enta
ge o
f tot
al w
orke
rs e
mpl
oyed
in IP
who
live
with
in d
aily
com
mut
ing
dist
ance
.
Dat
a N
/A
but
belie
ves t
o
be >
95%
[60%
]
Wor
kers
and
em
ploy
ees w
ithin
the
Zone
are
mos
tly re
side
nts f
rom
nei
ghbo
rhoo
d
com
mun
ities
or m
igra
nt w
orke
rs li
ving
in d
orm
s
prov
ided
by
the
Zone
.
Onl
y th
ose
(ver
y fe
w) w
ho a
re te
mpo
raril
y
empl
oyed
or s
ales
peop
le w
ho a
re b
usin
ess t
rips
on a
regu
lar b
asis
do
not l
ive
with
in d
aily
com
mut
ing
dist
ance
.
Type
of e
mpl
oym
ent
Perc
enta
ge o
f tot
al fi
rm w
orke
rs in
IP e
mpl
oyed
thro
ugh
dire
ct e
mpl
oym
ent (
that
is, n
ot e
mpl
oyed
on a
fee-
for-
outp
ut b
asis
or p
rovi
ded
thro
ugh
a
labo
r sup
ply
firm
) and
per
man
ent c
ontra
cts.
Dat
a N
/A
but
belie
ves t
o
be >
90%
[25%
]
A p
relim
inar
y bu
t tho
roug
h in
vest
igat
ion
sugg
ests
that
mos
t (if
not a
ll) e
mpl
oyee
s are
dire
ctly
em
ploy
ed b
y fir
ms.
93

Sour
ce: W
orld
Ban
k co
mpi
latio
n
Not
e: N
/A =
not
ava
ilabl
e. E
IA =
env
ironm
enta
l im
pact
ass
essm
ent;
EIP
= ec
o-in
dust
rial p
ark;
FH
TZ M
C =
Fuz
hou
high
-tech
zon
e m
anag
emen
t com
mitt
ee;
IP =
indu
stria
l par
k; O
H&
S =
occu
patio
nal h
ealth
and
safe
ty.
Loca
l bus
ines
s
and
SME
prom
otio
n
Loca
l val
ue a
dded
Perc
enta
ge o
f res
iden
t firm
s usi
ng lo
cal s
uppl
iers
or se
rvic
e pr
ovid
ers f
or a
t lea
st 8
0 pe
rcen
t of
thei
r tot
al p
rocu
rem
ent v
alue
.
Dat
a N
/A
but
belie
ves t
o
be <
25%
[25%
]
Firm
s nor
mal
ly c
ompa
re a
nd se
lect
pro
duct
s or
serv
ices
on
a la
rge
scal
e in
a b
ig “
com
petit
ive
mar
ket”
The
trans
porta
tion
syst
em in
Fuz
hou
is
rela
tivel
y ad
vanc
ed; p
rocu
rem
ent o
utsi
de
Fuzh
ou is
eas
y.
The
indu
stria
l cha
in in
the
Zone
is n
ot
com
plet
e. S
ome
prod
ucts
and
serv
ices
nee
d to
be p
urch
ased
out
side
the
Zone
.
Perc
enta
ge o
f tot
al p
rocu
rem
ent v
alue
of p
ark
man
agem
ent e
ntity
supp
lied
by lo
cal f
irms o
r
serv
ice
prov
ider
s.
Dat
a N
/A
but
belie
ves t
o
be <
90%
[90%
]
The
Zone
pur
chas
es a
gre
at v
arie
ty o
f goo
ds a
nd
serv
ices
from
diff
eren
t ind
ustri
es/b
usin
esse
s;
how
ever
, m
ost f
irms w
ithin
the
Zone
are
IT,
bio-
phar
mac
eutic
al, a
utom
obile
, ren
ewab
le
ener
gy fi
rms:
The
90%
of l
ocal
pro
cure
men
t
valu
e is
just
impo
ssib
le to
mee
t.
Econ
omic
valu
e cr
eatio
n
Inve
stm
ent-r
eady
par
k
for f
irms
The
ratio
of r
ente
d or
use
d sp
ace
by re
side
nt
firm
s com
pare
d to
the
tota
l am
ount
of a
vaila
ble
spac
e ea
rmar
ked
for r
esid
ent f
irms w
ithin
IPs.
Dat
a N
/A
but
belie
ves t
o
be >
50%
[50%
]
Land
dem
and
from
the
deve
lopm
ent o
f IPs
is
stea
dy; i
n fa
ct, m
any
proj
ects
are
una
ble
to e
nter
the
Zone
bec
ause
they
do
not h
ave
the
quot
a fo
r
land
use
(as r
equi
red
by th
e lo
cal g
over
nmen
t,
right
s for
land
use
take
the
form
of “
land
quo
ta”
and
are
dist
ribut
ed to
pro
ject
s eac
h ye
ar.
Proj
ects
with
out s
uch
quot
a ar
e no
t allo
wed
to
oper
ate)
. The
cur
rent
ratio
is 6
9.9%
(are
a
deve
lope
d: 1
5 km
2 ; tot
al a
rea
of th
e Zo
ne: 2
1.48
km2 )
94
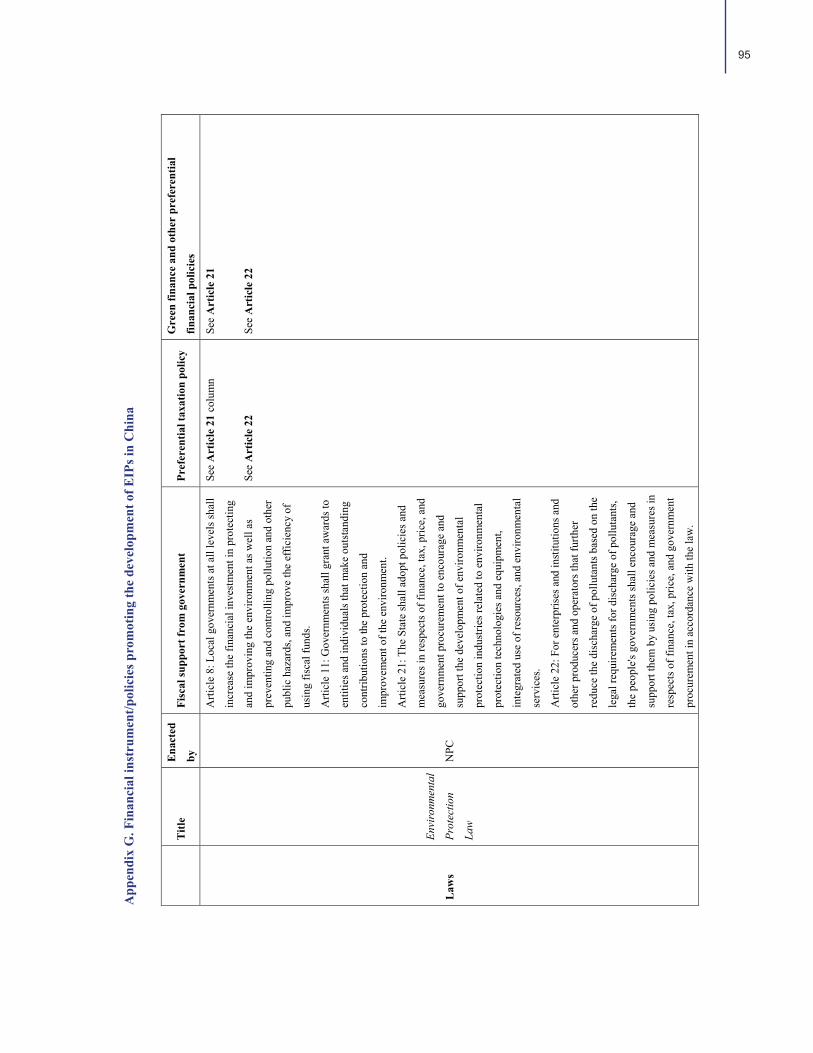
App
endi
x G
. Fin
anci
al in
stru
men
t/pol
icie
s pro
mot
ing
the
deve
lopm
ent o
f EIP
s in
Chi
na
T
itle
Ena
cted
by
Fisc
al su
ppor
t fro
m g
over
nmen
t Pr
efer
entia
l tax
atio
n po
licy
Gre
en fi
nanc
e an
d ot
her
pref
eren
tial
finan
cial
pol
icie
s
Law
s
Envi
ronm
enta
l
Prot
ectio
n
Law
NPC
Arti
cle
8: L
ocal
gov
ernm
ents
at a
ll le
vels
shal
l
incr
ease
the
finan
cial
inve
stm
ent i
n pr
otec
ting
and
impr
ovin
g th
e en
viro
nmen
t as w
ell a
s
prev
entin
g an
d co
ntro
lling
pol
lutio
n an
d ot
her
publ
ic h
azar
ds, a
nd im
prov
e th
e ef
ficie
ncy
of
usin
g fis
cal f
unds
.
Arti
cle
11: G
over
nmen
ts sh
all g
rant
aw
ards
to
entit
ies a
nd in
divi
dual
s tha
t mak
e ou
tsta
ndin
g
cont
ribut
ions
to t h
e pr
otec
tion
and
impr
ovem
ent o
f the
env
ironm
ent.
Arti
cle
21: T
he S
tate
shal
l ado
pt p
olic
ies a
nd
mea
sure
s in
resp
ects
of f
inan
ce, t
ax, p
rice,
and
gove
rnm
ent p
rocu
rem
ent t
o en
cour
age
and
supp
ort t
he d
evel
opm
ent o
f env
ironm
enta
l
prot
ectio
n in
dust
ries r
elat
ed to
env
ironm
enta
l
prot
ectio
n te
chno
logi
es a
nd e
quip
men
t,
inte
grat
ed u
se o
f res
ourc
es, a
nd e
nviro
nmen
tal
serv
ices
.
Arti
cle
22: F
or e
nter
pris
es a
n d in
stitu
tions
and
othe
r pro
duce
rs a
nd o
pera
tors
that
furth
er
redu
ce th
e di
scha
rge
of p
ollu
tant
s bas
ed o
n th
e
lega
l req
uire
men
ts fo
r dis
char
ge o
f pol
luta
nts,
the
peop
le's
gove
rnm
ents
shal
l enc
oura
ge a
nd
supp
ort t
hem
by
usin
g po
licie
s and
mea
sure
s in
resp
ects
of f
inan
ce, t
ax, p
rice,
and
gov
ernm
ent
proc
urem
ent i
n ac
cord
ance
with
the
law
.
See
Art
icle
21
colu
mn
See
Art
icle
22
See
Art
icle
21
See
Ar t
icle
22
95
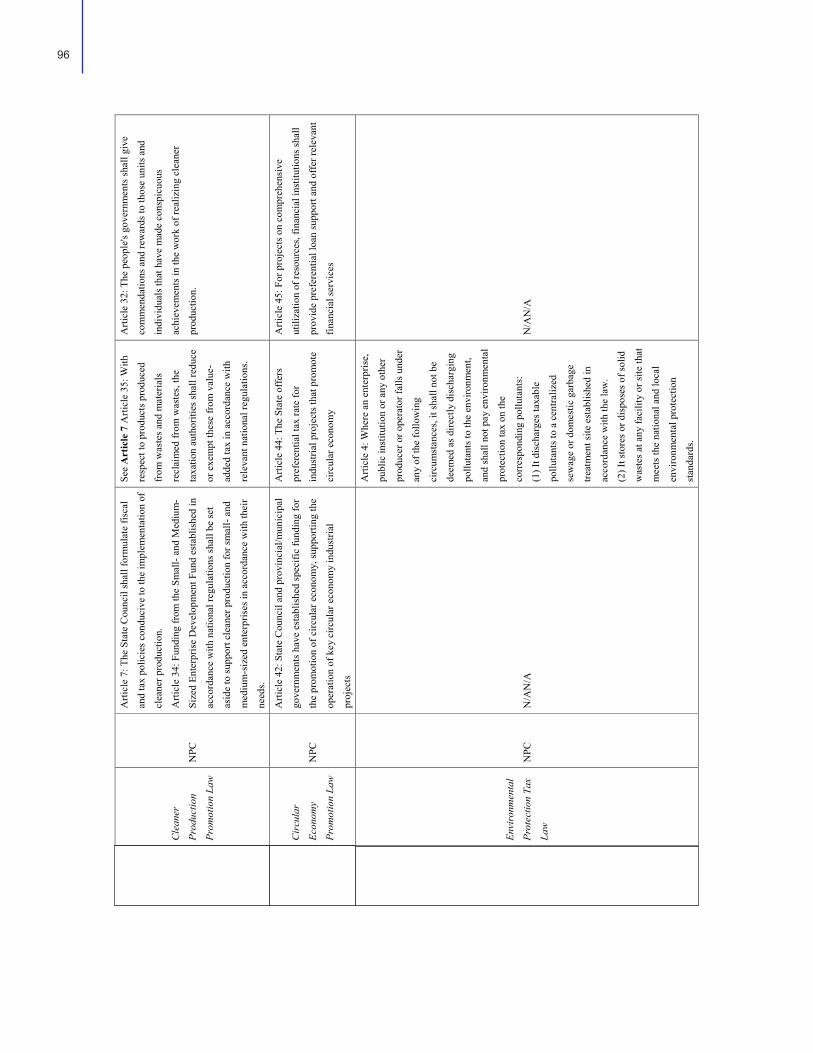
Cle
aner
Prod
uctio
n
Prom
otio
n La
w
NPC
Arti
cle
7: T
he S
tate
Cou
ncil
shal
l for
mul
ate
fisca
l
and
tax
polic
ies
cond
uciv
e to
the
impl
emen
tatio
n of
clea
ner p
rodu
ctio
n.
Arti
cle
34: F
undi
ng fr
om th
e Sm
all-
and
Med
ium
-
Size
d En
terp
rise
Dev
elop
men
t Fun
d es
tabl
ishe
d in
acco
rdan
ce w
ith n
atio
nal r
egul
atio
ns s
hall
be se
t
asid
e to
supp
ort c
lean
er p
rodu
ctio
n fo
r sm
all-
and
med
ium
-siz
ed e
nter
pris
es in
acc
orda
nce
wit h
thei
r
need
s.
See
Art
icle
7 A
rticl
e 35
: With
resp
ect t
o pr
oduc
ts p
rodu
ced
from
was
tes
and
mat
eria
ls
recl
aim
ed fr
om w
aste
s, th
e
taxa
tion
auth
oriti
es sh
all r
educ
e
or e
xem
pt th
ese
from
val
ue-
adde
d ta
x in
acc
orda
nce
with
rele
vant
nat
iona
l reg
ulat
ions
.
Arti
cle
32: T
he p
eopl
e's g
over
nmen
ts s
hall
give
com
men
datio
ns a
nd re
war
ds to
thos
e un
its a
nd
indi
vidu
als t
hat h
ave
mad
e co
nspi
cuou
s
achi
evem
ents
in th
e w
ork
of re
aliz
ing
clea
ner
prod
uctio
n.
Cir
cula
r
Econ
omy
Prom
otio
n La
w
NPC
Arti
cle
42: S
tate
Cou
ncil
and
prov
inci
al/m
unic
ipal
gove
rnm
ents
hav
e es
tabl
ishe
d sp
ecifi
c fu
ndin
g fo
r
the
prom
otio
n of
circ
ular
eco
nom
y, s
uppo
rting
the
oper
atio
n of
key
circ
ular
eco
nom
y in
dust
rial
proj
ects
Arti
cle
44: T
he S
tate
off
ers
pref
eren
tial t
ax ra
te fo
r
indu
stria
l pro
ject
s tha
t pro
mot
e
circ
ular
eco
nom
y
Arti
cle
45: F
or p
roje
cts
on c
ompr
ehen
sive
utili
zatio
n of
reso
urce
s, fin
anci
al in
stitu
tions
shal
l
prov
ide
pref
eren
tial l
oan
supp
ort a
nd o
ffer
rele
vant
finan
cial
ser
vice
s
Envi
ronm
enta
l
Prot
ectio
n Ta
x
Law
NPC
N
/AN
/A
Arti
cle
4: W
here
an
ente
rpris
e,
publ
ic in
stitu
tion
or a
ny o
ther
prod
ucer
or o
pera
tor f
alls
und
er
any
of th
e fo
llow
ing
circ
umst
ance
s, it
shal
l not
be
deem
ed a
s di
rect
ly d
isch
argi
ng
pollu
tant
s to
the
envi
ronm
ent,
and
shal
l not
pay
env
ironm
enta
l
prot
ectio
n ta
x on
the
corr
espo
ndin
g po
lluta
nts:
(1) I
t dis
char
ges t
axab
le
pollu
tant
s to
a ce
ntra
lized
sew
age
or d
omes
tic g
arba
ge
treat
men
t site
est
ablis
hed
in
acco
rdan
ce w
ith th
e la
w.
(2) I
t sto
res
or d
ispo
ses
of s
olid
was
tes
at a
ny fa
cilit
y or
site
that
mee
ts th
e na
tiona
l and
loca
l
envi
ronm
enta
l pro
tect
ion
stan
dard
s.
N/A
N/A
96
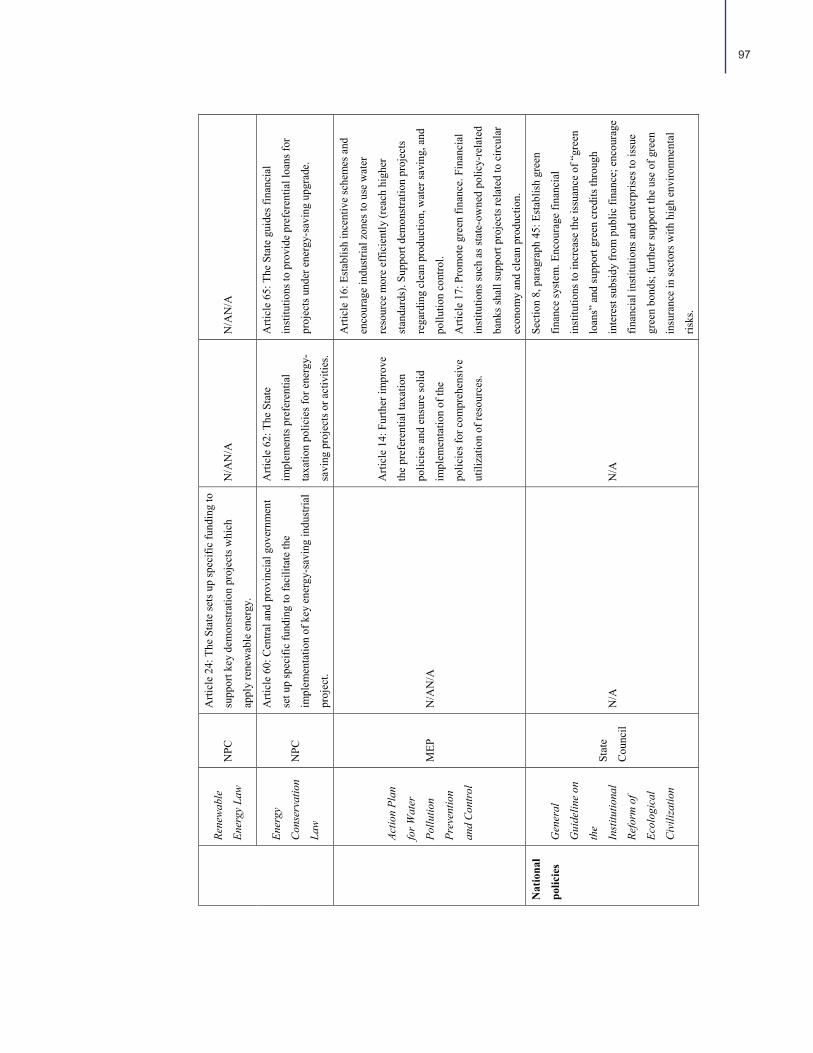
Rene
wab
le
Ener
gy L
aw
NPC
Arti
cle
24: T
he S
tate
sets
up
spec
ific
fund
ing
to
supp
ort k
ey d
emon
stra
tion
proj
ects
whi
ch
appl
y re
new
able
ene
rgy.
N/A
N/A
N
/AN
/A
Ener
gy
Con
serv
atio
n
Law
NPC
Arti
cle
60: C
entra
l and
pro
vinc
ial g
over
nmen
t
set u
p sp
ecifi
c fu
ndin
g to
faci
litat
e th
e
impl
emen
tatio
n of
key
ene
rgy-
savi
ng in
dust
rial
proj
ect.
Arti
cle
62: T
he S
tate
impl
emen
ts p
refe
rent
ial
taxa
tion
polic
ies f
or e
nerg
y-
savi
ng p
roje
cts o
r act
iviti
es.
Arti
cle
65: T
he S
tate
gui
des f
inan
cial
inst
itutio
ns to
pro
vide
pre
fere
ntia
l loa
ns fo
r
proj
ects
und
er e
nerg
y-sa
ving
upg
rade
.
Actio
n Pl
an
for W
ater
Pollu
tion
Prev
entio
n
and
Con
trol
MEP
N
/AN
/A
Arti
cle
14: F
urth
er im
prov
e
the
pref
eren
tial t
axat
ion
polic
ies a
nd e
nsur
e so
lid
impl
emen
tatio
n of
the
polic
ies f
or c
ompr
ehen
sive
utili
zatio
n of
reso
urce
s.
Arti
cle
16: E
stab
lish
ince
ntiv
e sc
hem
es a
nd
enco
urag
e in
dust
rial z
ones
to u
se w
ater
reso
urce
mor
e ef
ficie
ntly
(rea
ch h
ighe
r
stan
dard
s). S
uppo
rt de
mon
stra
tion
proj
ects
rega
rdin
g cl
ean
prod
uctio
n, w
ater
savi
ng, a
nd
pollu
tion
cont
rol.
Arti
cle
17: P
rom
ote
gree
n fin
ance
. Fin
anci
al
inst
itutio
ns su
ch a
s sta
te-o
wne
d po
licy-
rela
ted
bank
s sha
ll su
ppor
t pro
ject
s rel
ated
to c
ircul
ar
econ
omy
and
clea
n pr
oduc
tion.
Nat
iona
l
polic
ies
Gen
eral
Gui
delin
e on
the
Inst
itutio
nal
Refo
rm o
f
Ecol
ogic
al
Civ
iliza
tion
Stat
e
Cou
ncil
N/A
N
/A
Sect
ion
8, p
arag
raph
45:
Est
ablis
h gr
een
finan
ce sy
stem
. Enc
oura
ge fi
nanc
ial
inst
itutio
ns to
incr
ease
the
issu
ance
of “
gree
n
loan
s” a
nd su
ppor
t gre
en c
redi
ts th
roug
h
inte
rest
subs
idy
from
pub
lic fi
nanc
e; e
ncou
rage
finan
cial
inst
itutio
ns a
nd e
nter
pris
es to
issu
e
gree
n bo
nds;
furth
er su
ppor
t the
use
of g
reen
insu
ranc
e in
sect
ors w
ith h
igh
envi
ronm
enta
l
risks
.
97

Not
ice
by th
e
Stat
e C
ounc
il
on th
e “M
ade
in C
hina
202
5”
Proj
ect
Stat
e
Cou
ncil
Sect
ion
4, p
arag
raph
4: S
treng
then
fisc
al su
ppor
t
from
pub
lic fi
nanc
e to
rele
vant
pro
ject
s and
incr
ease
the
effic
ienc
y of
the
use
of p
ublic
finan
cing
.
Sect
ion
4, p
arag
raph
4:
Impl
emen
t pre
fere
ntia
l tax
atio
n
polic
ies f
or th
e tra
nsfo
rmat
ion
and
upgr
ade
of th
e
man
ufac
turin
g se
ctor
; car
ry
forw
ard
refo
rms i
n va
lue-
adde
d
tax
t o re
leas
e th
e ta
xatio
n
burd
en fo
r man
ufac
turin
g
ente
rpris
es
Sect
ion
4, p
arag
raph
3: F
urth
er im
prov
e su
ppor
tive
finan
cial
pol
icie
s for
the
“Mad
e in
Chi
na 2
025”
proj
ect;
expa
nd th
e so
urce
s of f
inan
cing
and
low
er
the
cost
of c
apita
l col
lect
ion
for t
he m
anuf
actu
ring
sect
or; e
ncou
rage
dev
elop
men
t ban
ks to
incr
ease
the
amou
nt o
f loa
ns to
man
ufac
turin
g fir
ms;
esta
blis
h a
mul
ti-le
vel c
apita
l mar
ket a
nd
enco
urag
e ca
pabl
e fir
ms t
o co
llect
cap
ital t
hrou
gh
IPO
s [in
itial
pub
lic o
ffer
ings
] and
var
ious
type
s of
finan
cial
inst
rum
ents
.
The
13th F
ive-
Yea
r Pla
n on
the
Econ
omic
and
Soci
al
Dev
elop
men
t
ND
RC
Arti
cle
43-7
: Est
ablis
h an
d im
prov
e th
e in
cent
ive
sche
mes
for e
nviro
nmen
tal p
rote
ctio
n. E
xpan
d
fisca
l pol
icie
s whi
ch p
rom
ote
ener
gy sa
ving
and
pollu
tion
redu
ctio
n
N/A
N
/A
Actio
n Pl
an fo
r
Lead
ing
Cir
cula
r
Econ
omy
Dev
elop
men
t
ND
RC
Sect
ion
8, p
arag
raph
37:
The
Act
ion
Plan
pro
pose
s
to fi
nanc
ially
supp
ort p
roje
cts r
elev
ant t
o ci
rcul
ar
econ
omy
trans
form
atio
n an
d de
velo
pmen
t thr
ough
the
use
of fu
nds f
rom
pub
lic fi
nanc
e, a
nd fu
rther
incr
ease
the
effic
ienc
y of
usi
ng p
ublic
fina
nce.
Sect
ion
8, p
arag
raph
36:
Pref
eren
tial t
axat
ion
polic
ies f
or
proj
ects
or e
nter
pris
es th
at u
se
reso
urce
s com
preh
ensi
vely
for
prod
uctio
n.
Sect
ion
8, p
arag
raph
37:
Pro
mot
e th
e us
e of
gre
en
cred
its, g
reen
bon
ds, i
nsur
ance
fund
s, an
d gr
een
indu
stry
fund
s to
supp
ort c
ircul
ar e
cono
my
trans
form
atio
n pr
ojec
ts;
enco
urag
e th
e PP
P m
odel
and
invo
lve
mor
e pr
ivat
e
capi
tal i
nto
gree
n in
vest
men
ts.
Gui
delin
es o
n
the
Man
agem
ent o
f
Nat
iona
l Eco
-
IPs
MEP
,
MO
C,
MO
ST
Arti
cle
32: P
rovi
ncia
l or l
ocal
gov
ernm
ents
shou
ld
set u
p sp
ecifi
c fu
nds o
r off
er p
refe
rent
ial t
ax ra
tes
for E
IPs t
hat c
arry
forw
ard
proj
ects
on
infr
astru
ctur
e fo
r pol
lutio
n co
ntro
l, co
mpr
ehen
sive
utili
zatio
n of
reso
urce
s, an
d ec
o-in
dust
rial c
hain
s
Arti
cle
32: P
rovi
ncia
l or l
ocal
gove
rnm
ents
shou
ld se
t up
spec
ific
fund
s or o
ffer
pref
e ren
tial t
ax ra
tes f
or E
IPs
that
ca
rry
forw
ard
proj
ects
on
infr
astru
ctur
e fo
r pol
lutio
n
cont
rol,
com
preh
ensi
ve
utili
zatio
n of
reso
urce
s, an
d ec
o-
indu
stria
l cha
ins
N/A
98

Gui
ding
Not
ice
on
Stre
ngth
enin
g
the
Dev
elop
men
t of
Nat
iona
l Eco
-
IPs
MEP
,
MO
C,
MO
ST
Sect
ion
5, p
arag
raph
22:
The
Gui
ding
Not
ice
enco
urag
es p
ublic
fund
s for
ene
rgy
cons
erva
tion
and
emis
sion
redu
ctio
n, g
reen
dev
elop
men
t,
tech
nolo
gica
l inn
ovat
ion,
and
env
ironm
enta
l
prot
ectio
n at
pro
vinc
ial a
nd lo
cal l
evel
to le
an
tow
ard
the
deve
lopm
ent o
f EIP
s. Pu
blic
fund
s tha
t
spec
ifica
lly su
ppor
t EIP
dev
elop
men
t ar e
enco
urag
ed to
be
esta
blis
hed
to p
rovi
de fi
scal
subs
idy
for t
he e
stab
lishm
ent o
f EIP
s.
Sect
ion
5, p
arag
raph
22:
Loa
ns
with
pre
fere
ntia
l int
eres
t rat
e
and
pref
eren
tial t
axat
ion
polic
y
are
also
requ
ired
to b
e in
pla
ce
to a
ssis
t key
pro
ject
s and
rese
arch
with
in E
IPs.
Sect
ion
5, p
arag
raph
22:
In a
dditi
on, t
he G
uidi
ng
Not
ice
also
enc
oura
ges I
Ps to
est
ablis
h “s
peci
al
cons
truct
ion
fund
s” fo
r EIP
dev
elo p
men
t to
supp
ort p
roje
cts o
n pa
rk p
lann
ing,
infr
astru
ctur
e
shar
ing,
and
indu
stria
l sym
bios
is, a
s wel
l as t
he
capa
city
bui
ldin
g of
IPs (
for e
xam
ple,
thro
ugh
info
rmat
ion
shar
ing
plat
form
s, co
nsul
ting
serv
ices
,
inno
vatio
n ac
tiviti
es, a
nd R
&D
).
Plan
for
Indu
stri
al
Gre
en
Dev
elop
men
t
(201
6−20
20)
MII
T
Sect
ion
4, p
arag
raph
3: F
urth
er st
reng
then
and
mak
e ef
fect
ive
use
of su
ppor
tive
fisca
l pol
icie
s
(fun
ding
from
the
cent
ral g
over
nmen
t’s b
udge
t,
spec
ial f
unds
for c
onst
ruct
ion,
oth
er fu
nds r
elev
ant
to te
chno
logi
cal t
rans
form
atio
n, e
nerg
y
cons
erva
tion
and
emis
sion
redu
ctio
n, c
lean
prod
uctio
n, a
nd g
over
nmen
t pro
cure
men
t of g
reen
prod
ucts
, as w
ell a
s fin
anci
ng fr
om p
ublic
-priv
ate
partn
ersh
ip) i
n pr
omot
ing
the
deve
lopm
ent o
f gre
en
IPs,
gree
n fir
ms,
and
the
gree
n m
anuf
actu
ring
syst
em o
vera
ll.
Sect
ion
4, p
arag
raph
3: F
urth
er
stre
ngth
en a
nd m
ake
effe
ctiv
e
use
of su
ppor
tive
taxa
tion
polic
ies (
pref
eren
tial t
axat
ion
polic
y) in
pro
mot
ing
the
deve
lopm
ent o
f gre
en IP
s, gr
een
firm
s, an
d th
e gr
een
man
ufac
turin
g sy
stem
ove
rall.
Sect
ion
4, p
arag
raph
4: F
urth
er in
crea
se th
e us
e of
gree
n fin
ance
(exp
and
the
scal
e of
gre
en c
redi
ts
and
gree
n bo
nds,
esta
blis
h gr
een
indu
stry
deve
lopm
ent f
unds
, inn
ovat
e ne
w g
reen
fina
ncia
l
inst
rum
ents
and
serv
ices
, lin
k “g
reen
per
form
ance
”
of fi
rms t
o th
eir c
redi
t rat
ing,
enc
oura
ge fi
nanc
ial
inst
itutio
ns to
pro
vide
mor
e co
nven
ient
and
pref
eren
tial c
redi
t sup
port
and
guar
ante
e se
rvic
e
for t
he g
reen
tran
sfor
mat
ion
of S
ME s
) in
prom
otin
g th
e de
velo
pmen
t of g
reen
IPs,
gree
n
firm
s, an
d th
e gr
een
man
ufac
turin
g sy
stem
ove
rall.
99

Stan
dard
s and
indi
cato
rs
Not
ice
on th
e
Esta
blis
hmen
t
of a
Gre
en
Man
ufac
turi
n
g Sy
stem
MII
T
Sect
ion
6, p
arag
raph
2: M
IIT
will
use
“fu
nds
for i
ndus
trial
tran
sfor
mat
ion
and
upgr
ade”
(工
业转
型升
级资
金),
spec
ial f
unds
for
cons
truct
ion
(专项
建设
基金
), an
d ot
her
supp
ortiv
e fin
anci
al p
olic
ies t
o as
sist
the
build
ing
of a
gre
en m
anuf
actu
ring
syst
em
(incl
udin
g gr
een
fact
orie
s, gr
een
prod
ucts
,
gree
n IP
s, an
d gr
een
indu
stria
l cha
ins)
.
Furth
erm
ore,
pro
duct
s fro
m th
e gr
een
man
ufac
turin
g sy
stem
are
prio
ritiz
ed in
gove
rnm
ent p
rocu
rem
ent.
N/A
Sect
ion
6, p
arag
raph
2: M
IIT
will
use
gre
en
cred
its a
nd o
ther
supp
ortiv
e fin
anci
al p
olic
ies
to a
ssis
t the
bui
ldin
g of
a g
reen
man
ufac
turin
g
syst
em (i
nclu
ding
gre
en fa
ctor
ies,
gree
n
prod
ucts
, gre
en IP
s, an
d gr
een
indu
stria
l
chai
ns);
MII
T en
cour
ages
fina
ncia
l ins
titut
ions
to
prov
ide
pref
eren
tial f
inan
cial
supp
ort f
or
indu
stria
l zon
es a
nd e
nter
pris
es th
at p
rom
ote
gree
n m
anuf
actu
ring
Not
ice
on
Reco
mm
end-
ing
Key
Can
dida
te IP
s
for C
ircu
lar
Econ
omy
Tran
sfor
ma-
tion
in 2
017
ND
RC
Sect
ion
3, p
arag
raph
3: T
hrou
gh a
sses
smen
t
and
reco
mm
enda
tion
at p
rovi
ncia
l lev
el, a
nd
eval
uatio
n an
d se
lect
ion
by th
e N
DR
C a
nd
MO
F at
nat
iona
l lev
el, c
erta
in in
vest
men
t
proj
ects
in th
e im
plem
enta
tion
plan
pro
pose
d
by se
lect
ed IP
s are
fina
ncia
lly su
ppor
ted
by th
e
MO
F an
d N
DR
C b
y us
ing
fund
s fro
m th
e
cent
ral g
over
nmen
t’s b
udge
t (th
e sp
ecifi
c
mon
etar
y am
ount
dep
ends
on
each
yea
r’s
finan
cial
bud
get).
N/A
N
/A
So
urce
: Wor
ld B
ank
com
pila
tion
Not
e: E
IP =
eco
-indu
stria
l par
k;
MEE
= M
inis
try o
f Eco
logy
and
Env
ironm
ent;
MII
T =
Min
istry
of I
ndus
try a
nd In
form
atio
n Te
chno
logy
; N
DR
C =
Nat
iona
l Dev
elop
men
t and
Ref
orm
Com
mis
sion
100
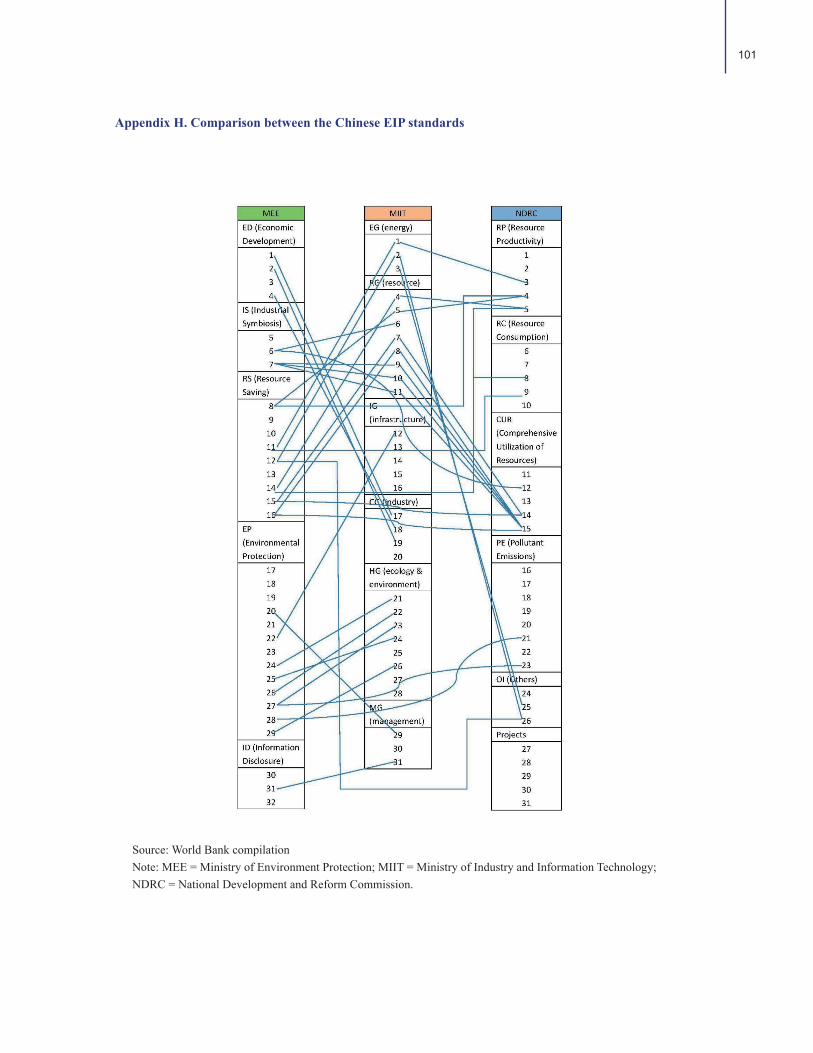
Source: World Bank compilationNote: MEE = Ministry of Environment Protection; MIIT = Ministry of Industry and Information Technology; NDRC = National Development and Reform Commission.
Appendix H. Comparison between the Chinese EIP standards
101

Source: WBG, UNIDO, and GIZ (2017).
Figure I.1 Core EIP categories and topics
Appendix I. An overview of the WBG/UNIDO/GIZ International Framework for EIPs
Aims and Objectives
Despite the growing interest for eco-industrial parks (EIPs) globally, the lack of national or international standards has become an obstacle to their development and credibility. Many IP have claimed the “eco” label, but the concrete features this refers to on the ground differ widely (UNIDO 2016). The aim of the EIP Frame-work published by the World Bank, UNIDO, and GIZ in December 2017 is to provide a common set of EIP standards, which could be relevant model for all countries willing to promote EIPs and use them as a basis to develop national standards. The EIP framework can thus guide policy makers and practitioners to identify the critical elements that governments and the private sector should focus on establishing for sustainable EIPs.
The EIP framework is intended to apply to all types of existing and planned IPs in developed, transition, and developing countries, covering all industrial sectors. It is expected to provide a common understanding of EIP at the international level, with broadly applicable performance requirements that can be tailored to national contexts.
Requirements for EIPs
The EIP framework divides EIP performance requirements into four categories, namely: park management performance, environmental performance, social performance, and economic performance. Core topics under each category are presented in Figure I.1.
102

Compliance with applicable national and local regulations is a prerequisite for all EIPs, whatever the geograph-ical location and specific characteristics of the park. The performance requirements for EIPs in this framework aim to go beyond compliance with local and national environmental and social regulations (“Compliance Plus”). EIPs are encouraged to go beyond these requirements and performance expectations where it is techni-cally, socially, and financially feasible and cost effective to do so.
The requirements within each category are divided into prerequisites and performance indicators. To be deemed an EIP, a park is expected to be compliant with all relevant prerequisites and performance expectations. The EIP performance requirements set the baseline expectations for EIPs globally, although sensitivity to local contexts is required (for example, when setting thresholds for fuel and industry mix, energy intensity, waste disposal, as well as requirements of the higher-level governance structures, institutions, regulating bodies, and so on).
103
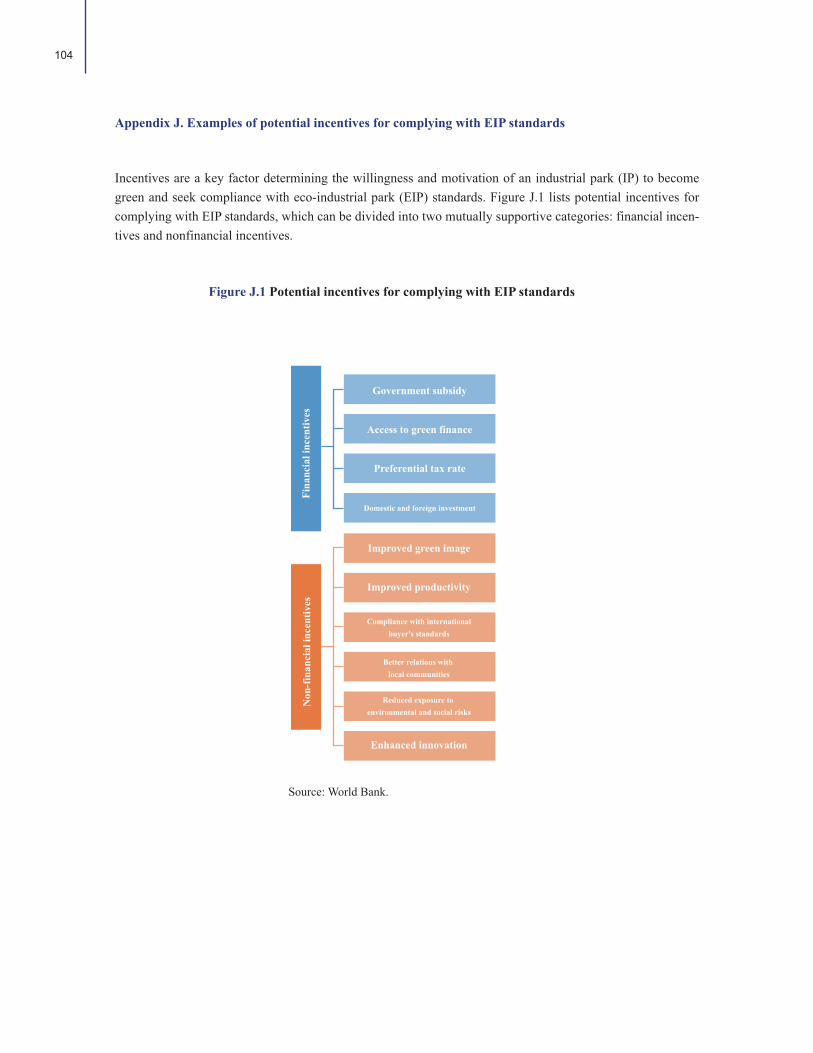
Figure J.1 Potential incentives for complying with EIP standards
Appendix J. Examples of potential incentives for complying with EIP standards
Incentives are a key factor determining the willingness and motivation of an industrial park (IP) to become green and seek compliance with eco-industrial park (EIP) standards. Figure J.1 lists potential incentives for complying with EIP standards, which can be divided into two mutually supportive categories: financial incen-tives and nonfinancial incentives.
Government subsidy
Access to green finance
Preferential tax rate
Domestic and foreign investment
Improved green image
Improved productivity
Compliance with internationalbuyer's standards
Better relations with local communities
Reduced exposure to environmental and social risks
Enhanced innovation
Fina
ncia
l inc
entiv
es
Non
-fin
anci
al in
cent
ives
Source: World Bank.
104
Box J.1 Influence of foreign investment on environmental awareness
Financial incentives
Major financial incentives to comply with the EIP Framework include:
-Access to government subsidy: Compliance with domestic and international EIP standards would potentially help IPs obtain government subsidies. For example, the National Development and Reform Commission (NDRC) directly offers subsidies to selected investment projects proposed by “circular economy upgrade” demonstration parks.
-Better access to green financing: Becoming certified as an EIP can enhance access to the growing set of green finance opportunities offered both by the public and private sectors (see Chapter 5).
-Preferential tax rate: The third potential financial incentive for compliance with green standards, subject to fiscal constraints, could be lower tax rates for tenant companies in EIPs. Such an approach could be piloted in selected parks and, if successful, rolled out to the rest of the country.
-Domestic and foreign investment: Meeting green standards (especially international standards) could bring IPs additional foreign investment, especially in the environmentally sensitive high-value-added industries. In addition, increased foreign investment (from economically and environmentally more advanced countries) would also help increase environmental awareness through more stringent environmental standards on production and higher environmental management targets (Box J.1.).
Thang Long IP Corporation (TLIP) in Vietnam is a Japanese-Vietnamese initiative that targets compa-nies with investment projects that use modern and high-end manufacturing technologies that are also environmentally friendly, clean or/and energy-efficient. Reported achievements in environmental management have been the treatment of wastewater, emissions and odor (companies must install their own systems), treatment of solid and hazardous waste, and management of trees and plants (23 percent of area cover).
Given that all the companies in TLIP are Japanese or Japan-Vietnam joint ventures, the average environmental awareness level is considerably high. This understanding of environmental responsibili-ty, together with the requirement of the TLIP Corporation, has resulted in the tenant companies adher-ing to high environmental management targets. The best examples of these companies include leading Japanese electronics companies such as Panasonic and Canon. These companies are pursuing policies guided by an ecoefficiency perspective, especially toward energy and materials. For example, Panason-ic is creating model factories that not only develop eco-products according to sustainable industry practices, but also take a lead role in promoting greater eco-awareness in the community through outreach activities.
Source: UNIDO (2016).
105

Nonfinancial incentives
Major nonfinancial incentives include:
- Improved green image: Becoming an internationally certified EIP can make a park a role model at both the international and national level and enhance its corporate social responsibility (CSR). This, in turn, could increase its attractiveness vis-à-vis domestic and foreign investors.
- Improved productivity: A natural advantage of complying with the green standards is improved productiv-ity with more efficient use of resources. Both the Chinese standards and the EIP Framework have require-ments on energy/resource efficiency and the reuse and recycle of resources.
- Compliance with international buyers’ standards: Meeting the EIP Framework requirements and becom-ing recognized as an international EIP would bring parks benefits in terms of attractiveness for international buyers. With increasing environmental awareness worldwide, buyers would increasingly prefer products made by green manufacturers in EIPs. Some international buyers follow or set procurement standards to ensure the “greenness” of the products they purchase. Compliance with domestic and international green standards would attract such “green buyers,” and thus incentivize the development of EIPs.
- Better relations with local communities: The EIP Framework has a specific focus on socioeconomic performance of IPs, measuring parks’ performance in driving the local economy and local employment. Requirements on environmental performance would also provide a cleaner and healthier environment for local residents through pollution control and environmental quality monitoring. Meeting such requirements would help IPs establish better relations with the local community, which is, in return, beneficial to the steady and long-term development of IPs. Reciprocal relationships could potentially incentivize IPs to comply with EIP standards.
- Reduced exposure to environmental and social risks: Compliance with both domestic and international green standards (especially on environmental and social performance) also means strengthened capacity in environmental and social risk management, reducing environmental and social risks.
- Enhanced innovation: The innovative capacity of IPs could also be enhanced through projects and capaci-ty building in the context of meeting EIP requirements, which improves the overall competitiveness of IPs.
106

Bai, Lu, Qi Qiao, Yang Yao, Jing Guo, and Minghui Xie. 2014. “Insights on the Development Progress of
National Demonstration Eco-Industrial Parks in China.” Journal of Cleaner Production 70 (1): 4–14.
CBRC (China Banking Regulatory Commission). 2012. Notice on Guiding the Use of Green Credits (中国银
监会关于印发绿色信贷指引的通知), February 24.
http://www.cbrc.gov.cn/chinese/home/docDOC_Read-
View/127DE230BC31468B9329EFB01AF78BD4.html.
---------. 2013. Statistical System of Green Credit (绿色信贷统计制度), June.
http://www.cbrc.gov.cn/chinese/files/2014/501344F75C984C158551B648F971B241.pdf.
---------. 2014. Notice on Issuing Key Evaluation Indicators of Issuing Green Credit (中国银监会办公厅关
于印发《绿色信贷实施情况关键评价指标》的通知), June 27. http://www.cbrc.gov.cn/chi-
nese/home/docView/FC5E38D62BE54E3D836E441D6FC2442F.html.
CBRC, PBoC, and MEP (China Banking Regulatory Commission, People’s Bank of China, and Ministry of
Environmental Protection). 2007. Opinions on Enforcing Environmental Protection Regulations and
Preventing Credit Risks (关于落实环境保护政策法规防范信贷风险的意见), July 12.
http://www.cbrc.gov.cn/chinese/home/docView/20080129C3-
FA6D993AC4AEF7FFE133D6E2AD0D00.html.
CCTV (China Central Television). 2018. “When Will Illegal Pollution Come to An End?” (非法排污几时休
), Economy in 30 Minutes (经济半小时), April 18.
http://tv.cctv.com/2018/04/18/VIDEtZPI05mzw7JdUUvrnYmE180418.shtml.
Chertow, Marian, and Jooyoung Park. 2016. “Scholarship and Practice in Industrial Symbiosis: 1989–2014.”
In Taking Stock of Industrial Ecology, edited by Angela Druckman and Roland Clift. SpringerOpen.
China Enterprise News. 2017. “How Can Industrial Parks Climb Over the Pollution Barrier?” (工业园区如
何翻越“污染”这道槛?), October 10.
http://www.sohu.com/a/197223548_115735.
China Environment News. 2015. “Is the ‘Blood Vessel’ to Third-Party Environmental Management Clear or
Not?” (第三方治理血脉通没通?), January 20.
http://49.5.6.212/html/2015-01/20/content_23397.htm.
China Green Times. 2011. “China Green Energy Development Fund Was Founded in Beijing” (中国绿色能
源发展基金在京成立), November 11.
http://www.ceca-china.org/news_view.asp?id=1658.
.
Climate Bonds Initiative. 2018. China Green Bond Market 2017. Jointly published by the Climate Bonds
Initiative and China Central Depository & Clearing Company.
References
107

https://www.climatebonds.net/files/files/China_Annual_Report_2017_EN_Final_14_02_2018.pdf.
CNIS (China National Institute of Standardization). 2017. Specification for Circular Economy Performance
Evaluation of Industrial Parks (GB/T 33567-2017) (工业园区循环经济评价规范), March 1. http://ww-
w.cnis.gov.cn/wzgg/201511/t20151110_21118.shtml.
Costa, Ines, and Paulo Ferrao. 2010. “A Case Study of Industrial Symbiosis Development Using a
Middle-Out Approach.” Journal of Cleaner Production 18 (10–11): 984–92.
CSRC (China Securities Regulation Commission). 2017. Opinions on Supporting the Development of Green
Bonds (中国证监会关于支持绿色债券发展的指导意见), March 2. http://www.csrc.gov.cn/pub/zjhpub-
lic/G00306201/201703/t20170303_313012.htm.
Daddi, Tiberio, Fabio Iraldo, Marco Frey, Paola Gallo, and Valentina Gianfrate. 2016. “Regional Policies and
Eco-Industrial Development: The Voluntary Environmental Certification Scheme of the Eco-Industrial
Parks in Tuscany (Italy).” Journal of Cleaner Production 114: 62–70.
FOEN (Federal Office for the Environment) (Switzerland). 2014. International Survey on Eco-Innovation
Parks. Bern: Federal Office for the Environment.
Geng, Yong, and Raymond Côté. 2003. “Environmental Management Systems at the Industrial Park Level in
China.” Environmental Management 31 (6): 784–94.
Geng, Yong, Murray Haight, and Qinghua Zhu. 2007. “Empirical Analysis of Eco-Industrial Development in
China.” Sustainable Development 15: 121–33.
Geng, Yong, Pan Zhang, Raymond Côté, and Tsuyoshi Fujita. 2009. “Assessment of the National Eco‐Indus-
trial Park Standard for Promoting Industrial Symbiosis in China.” Journal of Industrial Ecology 13 (1):
15–26.
GGGI (Global Green Growth Institute). 2017. Greening Industrial Parks: A Case Study on South Korea’s
Eco-Industrial Park Program. Seoul: Global Green Growth Institute.
IIGF and UNEP (International Institute of Green Finance and United Nations Environment Programme).
2017. Establishing China's Green Financial System: Progress Report 2017. International Institute of Green
Finance and United Nations Environment Programme.
Kechichian, Etienne, and Mi Hoon Jeong. 2016. Mainstreaming Eco-Industrial Parks. World Bank Group and
Korea Industrial Complex Corporation (KICOX).
Laybourn, Peter, and Maggie Morrissey. 2009. National Industrial Symbiosis Programme: The Pathway to a
Low Carbon Sustainable Economy. Birmingham, United Kingdom: International Synergies Ltd.
Liu, Lingxuan, Bing Zhang and Jun Bi. 2015. “Institutional Context of Eco-Industrial Park Development in
China: Environmental Governance in Industrial Parks and Zones.” In International Perspectives on
Industrial Ecology, edited by Pauline Deutz, Donald I. Lyons, and Jun Bi. Edward Elgar.
Management Committee of Fuzhou High-Tech Industrial Zone. 2017. Implementation Plan of the Circular
Economy Transformation of Fuzhou High-Tech Industrial Zone.
108
Massard, Guillaume, Heinz Leuenberger, and Tran Duy Dong. 2018. “Standards Requirements and a Road-
map for Developing Eco-Industrial Parks in Vietnam.” Journal of Cleaner Production 188 (1): 80–91.
MEE (Ministry of Ecology and Environment). 2007. Guideline on Drafting Eco-industrial Park Construction
Plan (HJ/T409-2007) (生态工业园区建设规划编制指南), December 20.
http://www.zhb.gov.cn/gkml/zj/gg/200910/t20091021_171774.htm.
---------. 2016. Standard for National Demonstration Eco-Industrial Parks (HJ 274-2015) (国家生态工业示
范园区标准), January 1.
http://kjs.mep.gov.cn/hjbhbz/bzwb/other/qt/201512/t20151224_320149.htm.
---------. 2018. Notice on the Submission of 2017 National Demonstration Eco-Industrial Park Assessment
Report (关于提交2017年国家生态工业示范园区建设评价报告的通知), March 12.http://www.zhb.gov-
.cn/gkml/hbb/bh/201803/t20180315_432540.htm.
MEE, MOC, and MOST (Ministry of Ecology and Environment, Ministry of Commerce, and Ministry of
Science and Technology). 2011. Guiding Notice on Strengthening the Development of National Eco-Indus-
trial Parks (关于加强国家生态工业示范园区建设的指导意见), December 5.
http://www.zhb.gov.cn/gkml/hbb/bwj/201112/t20111208_221112.htm.
---------. 2015. Guidelines on the Management of National Eco-Industrial Parks (国家生态工业示范园区管
理办法), December 16. http://www.gov.cn/gongbao/content/2016/content_5061695.htm.
MIIT (Ministry of Industry and Information Technology). 2016a. Implementation Plan for the 2016 Action
on Green Manufacturing (绿色制造2016专项行动实施方案), March 24.
http://www.miit.gov.cn/n1146285/n1146352/n3054355/n3057542/n3057544/c5150774/content.html.
---------. 2016b. Notice on the Establishment of a Green Manufacturing System (关于开展绿色制造体系建
设的通知), September 3.
http://www.miit.gov.cn/n1146295/n1146592/n3917132/n4061768/c5258400/content.html.
---------. 2016c. Plan for Industrial Green Development (2016–2020) [工业绿色发展规划(2016–2020)],
June 30.
http://www.miit.gov.cn/n1146285/n1146352/n3054355/n3057267/n3057272/c5118197/content.html.
--------. 2016d. Notice on the Building of Green Manufacturing Systems by MIIT (工业和信息化部办公厅
关于开展绿色制造体系建设的通知), September 20.
http://www.miit.gov.cn/n1146285/n1146352/n3054355/n3057542/n3057544/c5258400/content.html.
---------. 2017. Announcement of the First Batch of the “Green Manufacturing System” Demonstration
Factories and IPs (2017) (2017年第一批绿色制造体系示范名单公示), July 26. http://www.miit.gov-
.cn/n1278117/n1648113/c5748720/content.html.
---------. 2018. Notice on Publishing the Second Batch of Green Manufacturing Catalogue by MIIT (工业和
信息化部办公厅关于公布第二批绿色制造名单的通知), February 23. http://www.miit.gov-
.cn/n1146295/n1652858/n1652930/n3757016/c6066891/content.html.
109

MIIT and CDB (Ministry of Industry and Information Technology and China Development Bank). 2016.
Strategic Cooperation Agreement on Jointly Promoting the Implementation of the ‘Made in China’ 2025
Strategy (工业和信息化部 国家开发银行共同推进实施“中国制造2025”战略合作协议), November 8.
http://www.miit.gov.cn/n1146290/n1146397/c5347840/content.html.
---------. 2017. Notice on Recommending Key Green Credits Projects of Industrial Energy Saving and Green
Development in 2017 (工业和信息化部办公厅 国家开发银行办公厅关于推荐2017年工业节能与绿色
发展重点信贷项目的通知), April 24.
http://www.miit.gov.cn/newweb/n1146285/n1146352/n3054355/n3057542/n3057545/c5615678/content.html.
MIIT and MOF (Ministry of Industry and Information Technology and Ministry of Finance). 2016. Notice on
Establishing the Integration of Green Manufacturing Systems (财政部 工业和信息化部关于组织开展绿
色制造系统集成工作的通知), November 16.http://www.miit.gov-
.cn/n1146295/n1652858/n1652930/n3757016/c5378849/content.html.
Mirata, Murat. 2004. “Experiences from Early Stages of a National Industrial Symbiosis Programme in the
UK: Determinants and Coordination Challenges.” Journal of Cleaner Production 12 (8–10): 967–83.
National Bureau of Statistics of the People’s Republic of China. 2018. 2017 National Economic and Social
Development Statistics Report of China (中华人民共和国2017年国民经济和社会发展统计公报),
February 28.
http://www.stats.gov.cn/tjsj/zxfb/201802/t20180228_1585631.html.
NDRC (National Development and Reform Commission). 2013. Announcement of the 2013 Key Demonstra-
tion Organizations for Circular Economy Transformation (关于拟列为2013年循环经济重点工程示范试
点单位的公示), July 8. http://www.ndrc.gov.cn/wsgs/201307/t20130709_549368.html.
---------. 2015a. Announcement of the 2015 Demonstration Industrial Parks for Circular Economy Transfor-
mation (关于2015年园区循环化改造示范试点备选名单的公示), May 26. http://www.ndrc.gov.cn/g-
zdt/201505/t20150526_693492.html.
---------. 2015b. Action Plan on Promoting Circular Economy (2015) (2015年循环经济推进计划), April 14.
http://www.ndrc.gov.cn/zcfb/zcfbtz/201504/t20150420_688556.html.
---------. 2015c. Guideline on the Issuance of Green Bonds (绿色债券发行指引), December 31. http://ww-
w.ndrc.gov.cn/zcfb/zcfbtz/201601/W020160108387358036407.pdf and http://www.ndrc.gov.cn/zcf-
b/zcfbtz/201601/t20160108_770871.html.
---------. 2016a. Announcement of the 2016 Demonstration Industrial Parks to Receive Major Support for
Circular Economy Transformation (关于2016年园区循环化改造拟重点支持备选名单的公示), June 2.
http://www.ndrc.gov.cn/gzdt/201606/t20160602_806258.html.
---------. 2016b. The 13th Five-Year Plan on the Economic and Social Development of the People’s Republic
of China (中华人民共和国国民经济和社会发展第十三个五年规划纲要), March 16.
110

http://www.xinhuanet.com/politics/2016lh/2016-03/17/c_1118366322.htm#.
---------. 2017. Action Plan for Leading Circular Economy Development (循环发展引领行动), April
21.http://www.ndrc.gov.cn/gzdt/201705/t20170504_846514.html.
---------. 2018. Catalogue of Approved Development Zones in China (2018) (中国开发区审核公告目录
[2018年版]), February 26.
http://www.ndrc.gov.cn/gzdt/201803/W020180305343905091544.pdf.
NDRC and MOF (National Development and Reform Commission and Ministry of Finance). 2014.
Announcement of the 2014 Demonstration Industrial Parks for Circular Economy Transformation (关于
2014年园区循环化改造示范试点名单的公示), June 11.http://www.ndrc.gov-
.cn/wsgs/201406/t20140611_614933.html.
---------. 2015. Administrative Measures for Mid-term Evaluation and End-of-term Acceptance Test of
Circular Economy Transformation of Demonstration Industrial Parks (园区循环化改造示范试点中期评
估及终期验收管理办法), October 23. http://hzs.ndrc.gov.cn/newzwxx-
/201510/W020151029380691719599.pdf.
---------. 2017a. Announcement of the 2017 Demonstration Industrial Parks to Receive Major Support for
Circular Economy Transformation (关于2017年园区循环化改造拟重点支持园区的公示), June 2.
http://www.ndrc.gov.cn/gzdt/201706/t20170602_849885.html.
---------. 2017b. Notice on Recommending Key Candidate Industrial Parks for Circular Economy Transfor-
mation in 2017 (关于请组织推荐2017年国家园区循环化改造重点支持备选园区的通知), March 29.
http://www.ndrc.gov.cn/zcfb/zcfbtz/201704/t20170406_843662.html.
---------. 2017c. Notice on the End-of-term Evaluation and Capital Settlement of the National Demonstration
Industrial Parks of Circular Economy Upgrade and Urban Mining Demonstration Pilots (关于开展2017年
国家园区循环化改造示范试点、“城市矿产”示范基地终期验收和资金清算的通知), February 14.
http://www.ndrc.gov.cn/zcfb/zcfbtz/201702/t20170216_838001.html.
---------. 2018. Announcement of the Evaluation Result of 2018 Demonstration Industrial Parks for Circular
Economy Transformation and Demonstration Pilots for’ Urban Mining” (关于2018年园区循环化改造示
范试点和“城市矿产”示范基地验收结果的公示), June 1.
http://www.ndrc.gov.cn/gzdt/201806/t20180601_888590.html.
NPC (National People’s Congress of the People’s Republic of China). 2009a. Circular Economy Promotion
Law of the People’s Republic of China (中华人民共和国循环经济促进法), January 1.http://zfs.mep.gov-
.cn/fl/200809/t20080901_128001.shtml.
---------. 2009b. Renewable Energy Law of the People’s Republic of China (中华人民共和国可再生能源法
), December 26. http://zfs.mep.gov.cn/fl/200802/t20080202_117982.shtml.
---------. 2012. Cleaner Production Promotion Law of the People’s Republic of China (中华人民共和国清洁
生产促进法), July 1. http://zfs.mep.gov.cn/fl/200206/t20020629_84834.shtml.
111

---------. 2015. Environmental Protection Law of the People’s Republic of China (中华人民共和国环境保护
法), January 1. http://zfs.mep.gov.cn/fl/201404/t20140425_271040.shtml.
---------. 2016a. Air Pollution Prevention and Control Law of the People’s Republic of China (中华人民共和
国大气污染防治法), January 1. http://www.npc.gov.cn/npc/xinwen/2015-08/31/content_1945589.htm.
---------. 2016b. Energy Conservation Law of the People’s Republic of China (中华人民共和国节约能源法),
July 2. http://www.zhb.gov.cn/gzfw_13107/zcfg/fg/xzfg/201610/t20161008_365106.shtml.
---------. 2016c. Environmental Impact Assessment Law of the People’s Republic of China (中华人民共和
国环境影响评价法), September 1.
http://www.zhb.gov.cn/gzfw_13107/zcfg/fl/201609/t20160927_364752.shtml.
---------. 2016d. Law of the People’s Republic of China on the Prevention and Control of Environmental
Pollution by Solid Waste (中华人民共和国固体废物污染环境防治法), November 7.
http://zfs.mep.gov.cn/fl/200412/t20041229_65299.shtml.
---------. 2017. Water Pollution Prevention and Control Law of the People’s Republic of China (中华人民共
和国水污染防治法), June 27.http://zfs.mep.gov.cn/fl/200802/t20080229_118802.shtml.
---------. 2018. Environmental Protection Tax Law of the People’s Republic of China (中华人民共和国环境
保护税法), January 1. http://zfs.mep.gov.cn/fl/201704/t20170417_411610.shtml.
Park, Hung-Suck and Won, Jae-Yeon. 2007. “Ulsan eco-industrial park: challenges and opportunities”.
Journal of Industrial Ecology 11 (3).
PBoC, MOF, NDRC, MEP, CBRC, CSRC, and CIRC (People’s Bank of China, Ministry of Finance, National
Development and Reform Commission, China Banking Regulatory Commission, China Securities and
Regulatory Commission, and China Insurance Regulatory Commission). 2016. Guideline on Establishing a
Green Finance System (关于构建绿色金融体系的指导意见), August 31. http://www.zhb.gov.cn/gkm-
l/hbb/gwy/201611/t20161124_368163.htm.
People.cn. 2016. “New Measures for Shanghai to Establish Green Industrial Parks: The Commercial Banks
Provide 50 Billion RMB of Green Loans” (上海创建绿色园区新举措:十家银行提供500亿元绿色信贷
), June 16. http://sh.people.com.cn/n2/2016/0616/c134768-28520354.html.
Shenoy, Megha. 2016. “Industrial Ecology in Developing Countries.” In Taking Stock of Industrial Ecology,
edited by Angela Druckman and Roland Clift. SpringerOpen.
Shi, Lei, and Bing Yu. 2014. “Eco-Industrial Parks from Strategic Niches to Development Mainstream: The
Cases of China.” Sustainability 6: 6325–31.
Shi, Lei, Liu, Jingru and Song, Haiyan. 2016. “Ecologicalization Development Report of Chinese Industrial
Parks” (中国工业园区生态化发展报告). In China's New Town and New District Development Report,
edited by Kui Feng (中国新城新区发展报告). Beijing: Enterprise Management Publishing House.
Shi, Han, Chertow, Marian, and Song, Yuyan. 2010. “Developing Country Experience with Eco-Industrial
Parks: A Case Study of the Tianjin Economic-Technological Development Area in China.” Journal of
112

Cleaner Production 18 (3): 191–99.
Sohu.com. 2018. “Overview of China’s Green Finance in One Article” (一文读懂中国绿色金融的全貌),
June 14. http://www.sohu.com/a/235768682_352307.
State Council of the People’s Republic of China. 2013. Ten Measures of Air Pollution Prevention and Control
(大气污染防治十条措施), June 14.
http://www.zhb.gov.cn/home/ztbd/rdzl/dqst/.
---------. 2015a. Action Plan for Water Pollution Prevention and Control (水污染防治行动计划), April 16.
http://www.gov.cn/zhengce/content/2015-04/16/content_9613.htm.
---------. 2015b. Notice by the State Council on the “Made in China 2025” Project (国务院关于印发〈中国
制造2025〉的通知), May 8. http://www.gov.cn/zhengce/content/2015-05/19/content_9784.htm.
---------. 2015c. General Guideline on the Industrial Reform of Ecological Civilization (生态文明体制改革
总体方案), September 21. http://www.gov.cn/guowuyuan/2015-09/21/content_2936327.htm.
---------. 2016a. Guidelines and Plans for Ecological and Environmental Protection in the 13th Five Year
Period (十三五”生态环境保护规划), November 24. http://www.gov.cn/zhengce/content/2016-12/05/con-
tent_5143290.htm.
---------. 2016b. Action Plan for Soil Pollution Prevention and Control (土壤污染防治行动计划), May 28.
http://www.zhb.gov.cn/home/ztbd/rdzl/trfz/.
Taddeo, Raffaella. 2016. “Local Industrial Systems towards the Eco-Industrial Parks: The Model of the
Ecologically Equipped Industrial Areas.” Journal of Cleaner Production 131 (10): 189–97.
Thieriot, Hubert, and Dave Sawyer. 2015. Development of Eco-Efficient Industrial Parks in China: A Review.
Winnipeg: International Institute for Sustainable Development.
Tian, Jinping, Wei Liu, Binjie Lai, Xing Li, and Lujun Chen. 2014. "Study of the Performance of Eco-Indus-
trial Park Development in China." Journal of Cleaner Production 64 (2014): 486–94.
UNEP (United Nations Environment Programme). 2001. Environmental Management for Industrial Estates:
Information and Training Resources. http://www.unep.fr/shared/publications/pdf/3035-environmanag-
indusestates.pdf.
UNIDO (United Nations Industrial Development Organization). 1997. Industrial Estates: Principles and
Practice. Vienna: United Nations Industrial Development Organization.
---------. 2016. Global Assessment of Eco-Industrial Parks in Developing and Emerging Countries. Vienna:
United Nations Industrial Development Organization.
---------. 2017. Implementation Handbook for Eco-Industrial Parks. Vienna: United Nations Industrial
Development Organization.
US-China Green Fund. 2017. http://www.uschinagreenfund.com/home/aboutus/index.html.
Wang, Haikun, Yue Lei, and Jun Bi. 2015. “Greenhouse Gases Reduction Strategies for Eco-Industrial Parks
in China.” In International Perspectives on Industrial Ecology, edited by Pauline Deutz, Donald I. Lyons,
113

and Jun Bi. Edward Elgar.
Wang, Qiaozhi, Pauline Deutz, and Yong Chen. 2017. “Building Institutional Capacity for Industrial Symbio-
sis Development: A Case Study of an Industrial Symbiosis Coordination Network in China.” Journal of
Cleaner Production 142 (4): 1571–82.
Wang, Qiaozhi, Pauline Deutz, and David Gibbs. 2015. “UK-China Collaboration for Industrial Symbiosis: A
Multi-Level Approach to Policy Transfer Analysis.” In International Perspectives on Industrial Ecology,
edited by Pauline Deutz, Donald I. Lyons, and Jun Bi. Edward Elgar.
WBG, UNIDO, and GIZ (World Bank Group, United Nations Industrial Development Organization, and
Deutsche Gesellschaft für Internationale Zusammenarbeit). 2017. An International Framework for Eco-In-
dustrial Parks.
Wei, Yuping. 2017. “Accelerating Green Transformation of Traditional Industrial Zones: Ma’anshan’s
Attempt to Establish the First Green Commercial Bank in China” (老工业基地加快绿色转型:马鞍山试
水国内首个绿色商业银行), 21st Century Business Herald, December 19 (21世纪经济报道). http://epa-
per.21jingji.com/html/2017-12/19/content_76777.htm.
WTCIC (Western Trade Coast Industries Committee). 2014. Western Trade Coast Integrated Assessment:
Environmental, Social and Economic Impact. From: https://www.landcorp.com.au/Documents/Projects/In-
dustrial/Western%20Trade%20Coast/Western-Trade-Coast-Integrated-Assessment.pdf
Xi, Jinping, President. 2017. “Secure a Decisive Victory in Building a Modestly Prosperous Society in All
Respects and Strive for the Great Success of Socialism with Chinese Characteristics for a New Era” (决胜
全面建成小康社会 夺取新时代中国特色社会主义伟大胜利). Speech delivered at the 19th National
Congress of the Communist Party of China, October 18. http://cpc.peo-
ple.com.cn/n1/2017/1028/c64094-29613660-5.html.
Yang, Ting, Yanan Ren, Lei Shi, and Guohong Wang. 2018. “The Circular Transformation of Chemical
Industrial Parks: An Integrated Evaluation Framework and 20 Cases in China.” Journal of Cleaner Produc-
tion 196 (20): 763–72.
Yicai.com. 2018. “PBoC Took the Lead in Issuing China’s First Official Green Finance Report: Integrating
Central and Local Efforts to Facilitate Sustainable Development” (央行牵头发布国内首份权威绿色金融
报告:上下联动助力可持续发展),September 9.
https://www.yicai.com/news/100023641.html.
Yu, Fei, Feng Han, and Zhaojie Cui. 2015. “Evolution of Industrial Symbiosis in an Eco-Industrial Park in
China.” Journal of Cleaner Production 87 (15): 339–47.
Yu, Ziang, Bin Lu, and Ran Wang. 2018. “Analysis of Low-Carbon Pilot Industrial Parks in China: Classifi-
cation and Case Study.” Journal of Cleaner Production 187 (20): 763–69.
Zeng, Douglas Zhihua. 2011. “How Do Special Economic Zones and Industrial Clusters Drive China’s Rapid
Development?” Policy Research Working Paper 5583, World Bank, Washington, DC.
114
Zhang, Bo. 2018. Press conference held by the Ministry of Ecology and Environment of China, April 19.
http://www.mep.gov.cn/gkml/sthjbgw/qt/201804/t20180419_434980.htm.
Zhang, Ling, Zengwei Yuan, Jun Bi, Bing Zhang, and Beibei Liu. 2010. “Eco-Industrial Parks: National Pilot
Practices in China.” Journal of Cleaner Production 18 (5): 504–09.
115