Embed Size (px)
Citation preview

Enhancing activity and population mapping
Exploratory research
project interim report
Batista e Silva Filipe
Craglia Massimo
Freire Seacutergio
Rosina Konstantin
Lavalle Carlo
Marin Mario
Schiavina Marcello
2016
EUR 28335 EN
This publication is a Technical report by the Joint Research Centre (JRC) the European Commissionrsquos science
and knowledge service It aims to provide evidence-based scientific support to the European policymaking
process The scientific output expressed does not imply a policy position of the European Commission Neither
the European Commission nor any person acting on behalf of the Commission is responsible for the use that
might be made of this publication
Contact information
Name Filipe Batista e Silva
Address European Commission Joint Research Centre Via Enrico Fermi 2749 21027 Ispra (VA) Italy
Email filipebatistaeceuropaeu
Tel +39 0332 78 6470
JRC Science Hub
httpseceuropaeujrc
JRC104891
EUR 28335 EN
PDF ISBN 978-92-79-64588-4 ISSN 1831-9424 doi102791056071
Luxembourg Publications Office of the European Union 2016
copy European Union 2016
The reuse of the document is authorised provided the source is acknowledged and the original meaning or
message of the texts are not distorted The European Commission shall not be held liable for any consequences
stemming from the reuse
How to cite this report Batista e Silva F Craglia M Freire S Rosina K Lavalle C Marin M Schiavina M (2016)
Enhancing activity and population mapping Exploratory research project interim report JRC Technical Report
no EUR 28335 EN doi102791056071
All images copy European Union 2016 except front cover photo by Joseacute Martiacuten licensed under Creative Commons
Zero Source unsplashcom
i
Contents
Abstract 2
1 Introduction 3
2 Background and state-of-the-art 4
3 Project description 7
31 ENACT in a nutshell 7
32 Specific objectives of ENACT 9
33 Main specifications of output datasets 9
34 Workflow and schedule 11
4 State of the work 14
41 Participation in events 16
5 Conclusions main risks and challenges ahead 17
References 19
List of abbreviations and definitions 22
List of figures 23
List of boxes 24
List of tables 25
Annexes 26
Annex 1 Literature review 26
Annex 2 CLC-R nomenclature for lsquoArtificial surfacesrsquo 28
Annex 3 Classification of economic activities (NACE rev 2) 29
Annex 4 Short description of the CLC Refined 2012 (v10) 30
Annex 5 List of land use and activity data sources 36
2
Abstract
ENACT (ldquoENhancing ACTivity and population mappingrdquo) is a JRC Exploratory Research
Project involving various units at the JRC and spanning 2 years (2016-2017)
Current knowledge of population distribution is still very limited even for Europe Existing
spatial datasets refer only to lsquoresidentialrsquo population distribution and more complete
datasets reflecting spatiotemporal population variations are still lacking Yet this type of
information is essential for multiple purposes such as analysis of human exposure regional
and urban planning and impact assessment of new investments or infrastructures
ENACT aims at contributing to fill the existing knowledge gap by producing consistent
seamless multi-temporal and high-resolution population distribution grid maps for Europe
that take into account major daily and seasonal population variations Most of ENACTrsquos
tasks consist of exploring and combining new and unconventional datasets which can be
useful to map spatiotemporal population distribution
In the herein interim report we describe with some detail ENACTrsquos scope objectives and
workflow and make an account of the state of the work conducted so far with highlight
to the tasks related to the literature review activity mapping and collection of population
statistics at regional level
3
1 Introduction
ENACT (ldquoENhancing ACTivity and population mappingrdquo) is an Exploratory Research Project
awarded in 2015 by the JRC Scientific Committee following a selection procedure It has
a duration of 2 years (2016-2017) and involves three units at the JRC
- JRCB3 Territorial Development
- JRCB6 Digital Economy and
- JRCE1 Disaster Risk Management
ENACT fulfils the overall requirements of the 2015 call for Exploratory Research Projects
at the JRC a) it is an innovative project with ambitious goals b) links multiple units and
directorates within the JRC and c) builds new scientific competences for future policy
demands not necessarily linked to existing policy support Additionally the expected
outputs in terms of intermediate and final produced geo-datasets are expected to be useful
to other activities at the JRC namely for the territorial modelling community dealing with
issues such as transport land use regional economy etc and for disaster risk assessment
and management
The project has been granted dedicated human resources both from existing personnel
(partially dedicated to ENACT) and new recruits (ie three new recruits one for each unit
involved fully dedicated to ENACT) The project officially kicked-off in January 2016 The
first recruit joined unit JRCB3 on the 1st of August 2016 A second recruit joined unit
JRCE1 on the 1st of November 2016 and third recruit is expected to join unit JRCB6 in
2017 Therefore for most of 2016 the project ran understaffed with impact on the
schedule Despite these limitations significant progress has been accomplished throughout
2016
In this projectrsquos interim report we make an account of the state of the work conducted so
far with highlight to the following tasks literature review (chapter 2) activity mapping
and collection of population statistics at regional level (chapter 4) A thorough description
of the project (objectives product specifications workflow and schedule) is provided in
chapter 3 The report concludes with a discussion of the main risks and challenges identified
for the remainder of the project A number of relevant annexes complement the
information provided throughout the report
4
2 Background and state-of-the-art
The JRC has a long and recognized experience in population mapping and modelling Since
the early 1990rsquos it has contributed to revolutionize the way population is represented and
mapped at European level From the early works of Gallego and Peedell (2001) to most
recently Gallego et al (2011) and Batista e Silva et al (2013a) methods to map population
have been experimented and refined allowing the creation and update of maps
representing residential population across Europe Thanks to these early efforts
rudimentary ndash and to large extent ineffective ndash maps showing population density per
administrative unit have been replaced by more realistic and useful depictions of population
distribution at regular grid cell level typically with a 100x100 meters resolution and usually
referred to as lsquopopulation gridsrsquo The data structure and high resolution of population grids
allowed wider integration with other datasets in Geographical Information Systems (GIS)
and thus have become indispensable datasets among both social and environmental
researchers and spatial planners
The main principle underlying the construction of such maps relies on the combination of
two inputs population counts usually available per administrative units or census zones
and a covariate of population distribution at higher spatial resolution for example
residential areas extracted from land use maps building footprints impervious surfaces
road network or even night-time lights from remote sensing imagery (for an extensive
review of population estimation methods using GIS and Remote Sensing see Wu et al
2005) Using similar approaches population estimates for the Urban Atlas polygons1 have
also been created at the JRC at the request of DG REGIO (Batista e Silva et al 2013b
Batista e Silva and Poelman 2016) In addition the JRC has achieved to model future
population distributions at European level under different scenarios using the LUISA
territorial modelling platform given demographic projections within-region migration and
local potential for urbanization (Batista e Silva et al 2013c Lavalle et al 2016)
Despite the many improvements introduced by different researchers over the years
European population grids are ndash still nowadays ndash essentially static maps of lsquoresidential
populationrsquo Residential population refers to the number of people who declare to reside in
a given location As such when mapping residential population we are essentially mapping
the distribution of population during the night time assuming that most people stay in
their declared places of residence during the night for shelter and rest and excluding the
fraction of people who work outside their residences during night time Maps of residential
population have developed quicker due to easier access to data all European National
Statistical Institutes (NSI) at least once every 10 years count systematically the number
of residents per census zone
Residential population grid maps although sufficient for a range of purposes describe only
a fraction of reality The spatial distribution of people during the daytime or where people
stay in different seasons is practically unknown for any spatial scale Yet such information
is essential to an all range of applications (Martin et al 2010) The location of population
during the day is determined by the location of economic social and leisure facilities which
pull population off their residences driving commuting flows and other forms of daily trips
Daytime population distribution thus varies greatly from night-time distribution Contrary
to night-time population ndash which as already mentioned can be straightforwardly inferred
1 Urban Atlas httplandcopernicuseulocalurban-atlasurban-atlas-2012
5
by official statistics on residential population ndash it is much more challenging to infer daytime
population distribution
Addressing the needs of emergency response compatible day- and night-time population
grids have been produced in the mid-2000s for the USA (McPherson et al 2004 Bhaduri
et al 2007) In Europe such datasets have been mostly lacking with only a few countries
systematically collecting base data and modelling population distribution on the daily cycle
(eg Ahola et al 2007) More recent research (Martin et al 2015 Martin et al 2010
Aubrecht et al 2014 Smith et al 2016) has been increasing the resolution of the temporal
component andor including a seasonal dimension for limited regional areas by mining
conventional data Other authors have explored the contribution of non-conventional data
such as mobile phone activity records (Deville et al 2014 Tatem et al 2014) or
lsquogeotweetsrsquo (Patel el al 2016) for population mapping in selected countries a task which
is not without shortcomings and challenges A relatively straightforward approach was
proposed to estimate day- and night-time population distribution at high resolution for the
cities in Urban Atlas (Freire et al 2015) yet its quality depends largely on that of ancillary
datasets and availability of local parameters and its accuracy is still uncertain
The challenges posed by spatiotemporal mapping and modelling of population distribution
cannot be addressed effectively by conventional data sources alone (eg official statistics
and reference land use datasets) Significant advances in this field can only be attained if
data from conventional data sources are combined with data from emerging non-
conventional data sources in a coherent methodological framework Non-conventional data
sources may include volunteered geographical information (Goodchild 2007) web-based
social networks (Aubrecht et al 2016) thematic proprietary databases mobile phone
operator data or even navigation systems
Data mining from such (big) data sources is becoming a common task in many geospatial
applications Craglia and Granell (2014) reviewed a range of projects leveraging citizen
science or crowd sourcing in the area of environmental monitoring and smart cities
application There are several projects that demonstrate the benefits of combining official
and non-official sources These include for example the GEO-Wiki project focusing on global
land cover validated by local people in a game-inspired apps and its urban application
Cities Geo-wiki2 whose aim is to map the physical geography of all major cities in the world
to link to weather and climate models Another approach to augment local land use and
building use databases with crowd-sourced information is documented by Spyratos et al
(2014) who used data from lsquoFoursquarersquo to monitor the dynamic changes in building use
in commercial areas Other studies have also shown that thematic geospatial layers can be
obtained from disparate data sources and integrated with existing land use maps for
improved detail (Batista e Silva et al 2013d Jiang et al 2015) One of the most promising
data sources to estimate population density comes from mobile network operators Several
studies have documented the importance and usefulness of this data source (see for
example Steenbrugger et al 2014 and Deville et al 2014) but one key problem remains
data access which is normally negotiated with the data providers by individual researchers
for specific projects
Until a few years ago population grids were almost unknown to most researchers even in
domains with a strong spatial dimension But population grids gained momentum very
rapidly and have become mainstream input for many analyses Eurostat which was
initially reluctant to publish population figures using non-conventional zoning systems
6
kicked-off the GEOSTAT project in 20102 to promote the production dissemination and use
of lsquogriddedrsquo population among NSIs But despite all the referred advances Europe is still
lacking a wall-to-wall spatiotemporal model of population distribution Given its experience
in population mapping and big data mining as well as its fast track connection to Eurostat
and NSIs the JRC through the ENACT project is in good position to expand upon the state
of the art and fill the existing gaps in population mapping
Box 1 below summarizes the main challenges associated with spatiotemporal population
mapping
Box 1 Why mapping spatiotemporal population is a big challenge
Fast population dynamics People commute travel and migrate faster than ever
before
Multifaceted concept While during the night most of us are lsquoresident
populationrsquo during the day our (multiple) occupations
relate to the (multiple) locations of probable presence
Data availability issues No official statistical sources exist Daytime population
needs to be inferred from multiple indirect and perhaps
new data sources
State-of-the-art Few case studies often incomparable due to the use
different methodologies and input data of different
nature3
2 GEOSTAT initiative httpeceuropaeueurostatwebgiscogisco-activitiesintegrating-statistics-
geospatial-informationgeostat-initiative 3 See Annex 1 for an overview of previous efforts in spatiotemporal population modelling using conventional
data sources
7
3 Project description
31 ENACT in a nutshell
Population is a crucial variable for the social sciences the geosciences and for policy
support in many domains Yet our knowledge of its spatial distribution is still nowadays
very incomplete Population is a temporally dynamic variable with major shifts in its
distribution occurring in daily and seasonal cycles resulting in rapidly changing densities
Spatially detailed representations of residential population exist at EU level since several
years While these maps can be used as proxy for night-time population distribution the
distribution of population for other time frames is practically unknown at almost every
spatial scale Consequently all applied sciences and policy support that require spatially
detailed information on population distribution are based on only a fractional and static
representation of reality Overcoming this large knowledge gap is the main goal of the
ENACT exploratory research project
Several methodological challenges and data limitations have hindered progress in this field
in the past This project aims at addressing the challenges that are required to obtain (1)
the amount of people per type of activity per time-frame and per region and (2) their
likely location at a high spatial resolution The first element requires regional data on
residents employees per sector of activity students and tourists which can be derived
mostly from official sources The second element requires spatial data on the location of
activities (eg manufacturing retail health education leisuretourism) which will be
sought from various conventional (eg remote sensing imagery land use maps) and
unconventional data sources (eg volunteered geographical information large proprietary
geo-databases and web-services) The final challenge is to validate the produced multi-
temporal population distribution grid maps ENACTrsquos output will be compared against
reference data from independent sources such as multi-temporal population grids derived
from mobile phone operator data or other sources (eg produced by other researchers)
and micro-data from National Statistical Institutes (NSIs) on location of employment
Ultimately this project aims at developing and implementing a consistent and validated
methodology to produce multi-temporal (ie including daily and seasonal variations)
population distribution grids for Europe Such datasets will expand the knowledge base of
spatiotemporal population patterns across the continent Moreover multi-temporal
population grids can be a useful and straightforward (ie easy to integrate) input to several
models developed and run at the JRC particularly transport land use economic and
environmental models and exposure to hazards with potential positive impact on the
reliability of assessments
In addition to fostering a range of applications across Europe the forthcoming public
dissemination of ENACTrsquos final outputs may increase awareness among national authorities
on the importance of collecting good quality data on population and location of activities
8
Box 2 ENACTrsquos methodology in brief
The following questions define the main methodological aspects that need to be
addressed by ENACT in order to produce multi-temporal population grids for Europe
Question 1a How many people are inside and outside their residences during
the day in each region
Action To estimate total population per type of main activity per NUTS3 region
How By assembling official data from Eurostat on the no of workers per sector of
economic activity no students per main educational levels no of tourists and
number of inactive population (and thus likely to be at home during the day) per
region
Question 1b What is the seasonal variation of total present population in each
region
Action Seasonal variation of total present population in a region is mostly due to
touristic flows Therefore inbound and outbound tourist flows of each region per
season (or per month) must be taken into account by ENACT
How By first downscaling total yearly nights-spent per NUTS2 to NUTS3 using the
no of beds per NUTS3 Then breaking down the NUTS3 yearly nights-spent per
month using as proxy monthly flight traffic information from Eurostat Monthly
nights-spent per region can then be easily converted to average no of tourists
present in a given month by dividing total nights-spent in a month by the total no of
days comprised in that month Finally the number of tourists present in given a
region in a given month are removed from their likely regions of origin
Question 2 Where do people spend their time during the day and night
Action There is no one-stop shop for such multi-sector highly detailed locations of
activities ENACT needs to resort to various sources proprietary and open-source
conventional and non-conventional Specific population sub-groups then need to be
allocated to locations of probable presence
How By extracting relevant activity-location data from multiple sources namely
conventional (eg LULC maps remote sensing) volunteered geographic information
(eg OpenStreetMap) web-based services and proprietary sources (eg TomTom
PLATTS GISCO-EuroGeographics etc) At night-time residents will be located to
residential areas and tourists to touristic accommodation facilities At daytime the
various population sub-groups (eg students workers per sector of activity tourists)
will be allocated to the relevant activity types based on a probability matrix
Question 3 How accurate are ENACTrsquos multi-temporal population grid maps
Action To compare ENACTrsquos outputs with other reference data
How By resorting in particular to emerging population density grid maps derived
from mobile phone operator data but also to existing employment grids produced by
some NSIs Comparing ENACTrsquos grids with grids from other researchers is an
additional option
9
32 Specific objectives of ENACT
The ultimate objectivesoutputs of ENACT are as follows
mdash In terms of data production
To produce a set of multi-temporal population grid maps that take into account the
main seasonal and daily variations of population consistent with the most recent
census data (2011) and covering the largest possible number of EU28 countries
ENACT aims at least 6 population grid maps covering 3 main seasons of the year
(summer winter springautumn) for both night- and daytime
mdash In terms of dissemination of methods and results
To write a scientific paper summarizing the methodology and results and submit it
to a high-impact geographical science journal
To disseminate the final multi-temporal population grids following the INSPIRE
directive standards using JRC web channels
To fulfil the above objectives the following intermediate objectivesoutputs of ENACT are
expected
To review the most recent and significant scientific literature on daytime (or multi-
temporal) population mapping
To build a database of population stocks at regional level (NUTS23) with no of
residents employed population per main sector of activity nr of students nr of
tourists and inactive population The database must have a temporal dimension
(seasonal or monthly)
To build a geodatabase with land use and activity information at the highest possible
thematic and spatial resolution by assembling data from both conventional and non-
conventional sources
To produce an enhanced version of the CORINE Land Cover Map 2012 with
improved spatial resolution (minimum mapping unit of 1 hectare instead of 25) and
thematic resolution (further breakdown for specific CLCrsquos LULC classes)
To compare ENACTrsquos multi-temporal population grids with other independent
sources namely multi-temporal population grids derived from mobile phone
operator data or other sources (eg produced by other researchers) and micro-
data from National Statistical Institutes (NSIs) on location of employment4
33 Main specifications of output datasets
As per the above objectives two sets of data will be produced (a) geodatabase with land
use and activity information and (b) multi-temporal population grid maps The former item
comprises individual datasets with location of specific activities plus an overarching land-
use map herein referred to as CLC-R 2012 CLC-R 2012 is a refined version of CLC 2012
with increased spatial and thematic resolution and built by integrating geodata from
multiple sources (see Annex 4) Because CLC-R contains the location of many types of
activities it will be the backbone for the subsequent production of the multi-temporal
population grid maps
4 The comparison exercise however may only be feasible for selected regions or countries in Europe
depending on the amount of reference data the project is able to collect and handle
10
Table 1 summarizes the main specifications (spatial coverage spatial thematic and
temporal resolutions reference dates) of the two sets of data Figure 1 shows the area of
interest of ENACT
The multi-temporal population grid maps have a more limited spatial coverage than the
CLC-R because they require as input statistical data which is not fully available from
Eurostat for countries outside EU28 The spatial resolution is also somewhat more limited
for the final multi-temporal population grid maps due to the inability to validate these maps
at a resolution below 1 Km The temporal resolution is yet to be defined but ENACT aims
at least 6 maps (summer winter springautumn x day- and night-time) The possibility to
have higher temporal resolution (eg 24 maps each month x day- and night-time) is
currently under consideration depending on whether we will be able to break down yearly
tourist stocks per month
Table 1 Main expected specifications of output datasets
Land use and activity data
(CLC-R)
Multi-temporal population grid
maps
Spatial coverage EU28 + EFTA + Balkan countries
+ Turkey (see figure 1)
EU28 (see figure 1)
Spatial resolution 100 m 100 m (production) 1 Km
(dissemination)
Temporal resolution Single year Monthly or seasonal x day- and
night-time
Thematic resolution ~ 10 separate land use
categories relevant for
population mapping
(see Annex 2)
Population per various sub-groups
(residents employees per sector
of activity students tourists
inactive)
Reference date 2012 2011
11
Figure 1 Area of interest of ENACT Legend Green area of interest for the multi-temporal
population grids (EU28) Yellow area of interest for land use and activity data Grey outside area
of interest
34 Workflow and schedule
The main phases and tasks of the project are mapped in the Gantt chart of Figure 2 with
an approximate schedule of the work The herein project planning is a revision of the
original schedule included in the project proposal It has a slightly revised arrangement of
the main phases and divides each of the 6 mains phases into sub-activities or tasks The
green bars correspond to the originally scheduled duration of each task The grey bars
correspond to the revised duration For many tasks the duration was prolonged for
additional months as the project ran significantly understaffed for most of 2016 The
flowchart in Figure 3 shows how the main phases of the project (in square brackets) are
interconnected
The first crucial phase of the project (lsquoPreparationrsquo) paves the way for a structured and
solid kick-off It includes a literature review of the most recent and relevant work in the
field as well as an inventory of the data needs and potential data sources In addition
linkages between the nomenclatures used in the various data sources will be established
using the NACE rev2 as pivotal nomenclature
The second phase (lsquoRegional flows and stocks of peoplersquo) includes the collection of
statistical data primarily from official sources (Eurostat and NSIs) The statistical data will
be worked in order to produce seasonal or monthly regional balances of various population
sub-groups namely residents workers per 6 sectors of economic activity students
tourist and inactive population
12
The third phase (lsquoActivity mappingrsquo) goes in parallel with the second phase and consists
of collecting land use and activity location data from all available data sources These data
will be combined to improve both the spatial and thematic resolutions of CLC 2012 and
thus generate the lsquoCLC-Rrsquo The CLC-R will be the base map for the allocation of population
sub-groups in different land use and activity categories for different time-frames (seasons
or months and night-time and daytime) The spatial allocation or disaggregation of
population will be carried in the fourth phase of the project (lsquoModelling spatiotemporal
population distributionrsquo)
In the fifth phase of the project (lsquoValidationrsquo) a comparison will be made between ENACTrsquos
main outputs (ie multi-temporal population grid maps) and reference data from
independent sources namely multi-temporal population grids derived from mobile phone
operator data or other sources (eg produced by other researchers) and micro-data from
National Statistical Institutes (NSIs) on location of employment With the comparison
exercise we expect to assess the validity of ENACTrsquos outputs Although the ENACTrsquos
outputs may not be fully comparable with the independent sources used in the validation
(eg due to differences in total estimated population within a given spatial unit of analysis)
appropriate indicators will be established to check the degree of agreement in terms of
relative difference of population between various time frames (eg night-time vs daytime
or seasonmonth lsquoArsquo vs seasonmonth lsquoBrsquo) The comparison exercise may only be feasible
for selected regions or countries in Europe depending on the amount of reference data the
project is able to collect and handle The validation is indispensable for the lsquoReporting and
disseminationrsquo of ENACTrsquos outputs (phase 6 of the project)
Figure 2 Schedule of main phases and tasks and units involved
1 2 3 4 5 6 7 8 9 10 11 12 1 2 3 4 5 6 7 8 9 10 11 12
11 Literature review B3 B6 E1
12 Assessment of data needs and
sourcesB3 B6 E1
13 Harmonization of data
nomenclaturesB3
21 Collect population employment
tourism and students statisticsB3
22 Seasonal or monthly regional
population balancesE1 B3
31 Collect geo-referenced land use
and activity dataB3
32 Spatial refinement of CLC2012 B3
33 Thematic enhacement of CLC2012 B3
E1 B3
51 Collect reference data (NSIs and
mobile phone operator data)B6
52 Carry validation exercise B6 E1 B3
61 Interim report B3 B6 E1
62 ER workshop presentation B3 B6 E1
64 Preparation of peer-reviewed paper B3 E1 B6
65 Public dissemination of GIS layers B3 E1 B6
4 Modelling spatiotemporal population distribution
Time bar main tasks and units involved
2016 2017
2 Regional flows
and stocks of
people
3 Activity
mapping
Tasks
5 Validation
6 Reporting and
dissemination
Phase
1 Preparation
13
Figure 3 Workflow and interlinkages between the projectrsquos main phases
14
4 State of the work
So far we have mostly focused on phases 1 2 and 3 of the project although some
preparatory tasks for the subsequent phases have also initiated Below we list and describe
the main tasks completed on-going and forthcoming
Table 2 State of the work
Phasetask Description Actors Depen-
dencies Status
1 Preparation
11 Literature
review
lsquoFirst roundrsquo of literature review of multi-temporal population
mapping to steer the kick-off of the project lsquoSecond roundrsquo
complementary literature review to done by the time of the writing
of the final paper
B3 B6
E1 None
lsquoFirst
roundrsquo of
review
complete
See
summary
in chapter
2 of the
herein
report +
annex 1
12 Assessment of
data needs and
sources
List of potentially useful sources of geographical and statistical data
to be used in different stages of the project
B3 B6
E1 11
Complete
See annex
5
13 Harmonization
of data
nomenclatures
Check data nomenclatures and classifications from the different
sources of data useful to the project Make the necessary
correspondences between classifications
B3 12 Complete
2 Regional flows and stocks of people
21 Collect
population
employment
tourism and
students statistics
Collection of raw statistical data from Eurostat on number of
residents employees per sector of economic activity students per
main educational levels number of nights-spent by tourists per
NUTS23 and flight data per airport unemployment rates
B3 12
On-going
(close to
completio
n)
22 Seasonal or
monthly regions
population
balances
Production of seasonal or monthly tables of population balances per
NUTS3 and per the following population categories resident
population employees (per sector of activity) students (per main
educational levels) tourists and non-active population taking into
account outbound tourism and to avoid double counting of
population
E1 B3 21
On-going
(just
initiated)
3 Activity mapping
31 Collect geo-
referenced land
use and activity
data
Collection and preparation of available data on land use and
activities locations from multiple sources (openproprietary
conventionalnon-conventional)
B3 12 Complete
32 Spatial
refinement of CLC
2012
Improvement of the spatial resolution of CLC 2012 Reduction of
minimum mapping unit (MMU) from 25 ha to 1 ha for all lsquoartificial
surfacesrsquo group of LULC classes See Annex 4 for a more complete
description
B3 31 Complete
33 Thematic
refinement of CLC
2012
Improvement of the thematic resolution of CLC 2012 Add additional
breakdown (lsquolevel 4rsquo) to some lsquoartificial surfacesrsquo LULC classes B3 31 32 On-going
15
4 Modelling spatiotemporal population distribution
Modelling
spatiotemporal
population
distribution
Downscaling of multi-temporal population balances per NUTS3 (task
22) to grid cell level based on the location of land uses and
activities
E1 B3 2 3
On-going
First
prototype
scripts
under
constructi
on
5 Validation
51 Collect
reference data
(NSIs and mobile
phone operator
data)
Establish methods to estimate population density distribution from
network-based mobile phone data1 Obtain data on population
densities derived from mobile phone operator data (MPOD) The
sample should ideally include more than one European
regioncountry and have both daily and seasonal resolution Obtain
employment grids for a sample of European regionscountries
B6 12
On-going
Data for
Belgium
collected
(see figure
4)
52 Carry
validation
exercise
Define a methodology for the validation exercise Preparation of
MPOD for the comparison with ENACTrsquos multi-temporal population
grids Construct indicators of agreement between the reference grids
and ENACTrsquos multi-temporal population grids
B6 E1
B3 41 51
To be
initiated
6 Reporting and dissemination
61 Interim report Interim report describing the projectrsquos objectives and progress of the
work
B3 B6
E1 na Complete
62 Exploratory
research
workshop
presentation
Oral presentation of the projectrsquos progress to the JRC Scientific
Committee
B3 B6
E1 na
To be
scheduled
63 Preparation of
peer-reviewed
paper
Scientific paper describing the newly produced datasets B3 B6
E1 4 5
To be
initiated
64 Public
dissemination of
GIS layers
Public dissemination of GIS layers possibly using JRC web channels B3 B6
E1 4 5
To be
initiated
Notes 1 Published journal article Estimating population density distribution from network-based mobile phone datardquo PUBSY JRC96568
Figure 4 Population density in 8102015 derived from mobile phone operator data (Proximus) in Belgium at 1 km resolution
16
41 Participation in events
The ENACT project has already been presented in the following occasionseventsworking
groups
10-12 November 2015 European Forum for Geography and Statistics (EFGS) 2015
Conference Vienna Austria
Presentation by Filipe Batista e Silva titled rdquoThe ENACT project Towards
spatiotemporal population mappingrdquo
12 February 2016 1st JRC-Eurostat workshop on Big Data Ispra Italy
Presentation by Filipe Batista e Silva titled rdquoThe ENACT project Towards
spatiotemporal population mappingrdquo
1-2 September 2016 JRC Big data for science and policy workshop Ispra Italy
Presentation by Filipe Batista e Silva titled rdquoBig data for rsquoEnhancing
activity and population mappingrsquordquo
22 November 2016 ERSAREGIOUCL joint international workshop rdquoHow can
regional policy benefit from Big Datardquo Louvain-la-Neuve Belgium
Presentation by Filipe Batista e Silva titled rdquoSpatiotemporal population
mapping in Europerdquo
Participation in the work of the European Statistical System Big data Task Force
chaired by ESTAT which is the forum in which collaboration with statistical agencies
and some mobile phone operators takes place that can assist in the validation of
the ENACT outputs (Massimo Craglia)
Participation in collaborative work between ESTAT the Belgian Statistical agency
and Proximus mobile phone operator5 (Massimo Craglia)
5 See description here
httpeconomiefgovbefrbinariesCarrefour_economie_2016_10_tcm326-280315pdf pages 38-53
17
5 Conclusions main risks and challenges ahead
The work is progressing well given the stated limitations (project running considerably
understaffed for most of 2016) Nonetheless significant progress has been made (see
summary in chapter 4) As main milestones achieved we highlight the conclusion of the
spatial refinement of CLC-R 2012 and the collection of most data inputs necessary for the
detailed mapping of activities and construction of regional population balances
At project proposal stage we had identified the following main risks
1 The collection of land-use relevant VGI has not been assessed at EU scale addressing
redundancy between data sources and assessing data quality (ie completeness
consistency updatehellip) at EU level are key challenges
2 The accuracy levels of the resulting population grids will determine the appropriate
spatial resolution of the final layers for public dissemination A low spatial resolution
(eg cell size gt 1 Km) can limit the range of potential applications
3 The delivery schedule and sample size of the mobile phone data are not fully known at
this stage
4 Potential delays in the production of the CLC 2012 for some countries could lead to
gaps in the spatial coverage of the CLC-R 2012
Risks 2 and 3 remain open at the current stage of the project Risk 1 will be address by
applying Machine Learning methods to classify CLC-R polygons into a more detailed a set
of discrete LULC classes Risk 4 is now obsolete CLC 2012 has been completed and is
available at the Copernicus Land Monitoring Service website The spatial refinement of CLC
2012 has been already accomplished for the entire extent of the CLC mapped area The
thematic refinement of CLC is on-going and progressing as expected so far
However as the work progressed we identified additional challenges
mdash Related to the construction of NUTS3 population balance tables
Tourism and student data only available at NUTS2 for some countries ndash downscaling
to NUTS3 possibly using proxies
Breakdown of yearly NUTS3 tourists per seasonmonth necessary Method based
on using monthly flight traffic as proxy still under testing phase
Workers in one NUTS3 region can be resident in another NUTS3 region (commuting
between NUTS3) Commuting data between municipalities or even NUTS3 seems to
be completely inexistent at EU-level Pragmatic assumptions might be necessary
Statistics for activeinactive population and unemployment available only at NUTS2
Downscaling to NUTS3 might be necessary using proxies available at NUTS3 (eg
total population and population per age-groups)
Inbound tourists in one NUTS3 have other NUTS3 as regions of origin which need
to be identified Method still to be defined
Construction of NUTS3 consistent population balance tables that avoid double
counting of total population
mdash Concerning the disaggregation of population stocks from regional to pixel level
The relationship between certain population sub-groups (eg employees per sector
of economic activity or tourists) and the land uses is of rsquoone-to-manyrsquo In other
words a population category can occur in more than one land use type This will
inevitably call for additional parametrization of the downscaling algorithms possibly
18
using probability matrices defining the probability of land use class holding
population from the various sub-groups
mdash Related to the use of lsquoBig Datarsquo sources
Extractionminingscrapping of data from the web is sometimes challenging (a
dedicated procedure needs to be constructed for each website)
The big data sources screened for the ENACT project are mostly proprietary with
strict terms and conditions of use
Dialogue with individual data providers would be required to gain legal access
Quality of data unknown difficult to measure accuracy and completeness of
bottom-up generated data
Methodological challenges making sense out of the multiple big data sources for
our specific needs
19
References
Ahola T Virrantaus K Krisp JM and Hunter GJ (2007) A spatio‐temporal population model
to support risk assessment and damage analysis for decision‐making International
Journal of Geographical Information Science 21(8) 935-953
Aubrecht C Oumlzceylan Aubrecht D Ungar JK et al (2016) VGDI - Advancing the Concept
Volunteered Geo-Dynamic Information and its Benefits for Population Dynamics
Modeling Transactions in GIS
Aubrecht C Steinnocher K and Huber H (2014) DynaPop - Population distribution dynamics
as basis for social impact evaluation in crisis management In S R Hiltz et al (eds)
Proceedings of ISCRAM 2014 - 11th Int Conf on Information Systems for Crisis
Response and Management University Park PA USA
Batista e Silva F and Poelman H (2016) Mapping population density in Functional Urban
Areas - A method to downscale population statistics to Urban Atlas polygons JRC
Technical Report no EUR 28194 EN doi10279106831
Batista e Silva F Gallego J Lavalle C (2013a) A high-resolution population grid map for
Europe Journal of Maps 9(1) 16-28
Batista e Silva F Koomen E Diogo V et al (2014) Estimating demand for industrial and
commercial land use given economic forecasts PLOS ONE 9 e91991
Batista e Silva F Lavalle C Jacobs-Crisioni C et al (2013c) Direct and indirect land use
impacts of the EU cohesion policy Assessment with the Land Use Modelling Platform
JRC scientific and policy report 26460 Luxembourg Publications office of the European
Union
Batista e Silva F Lavalle C Koomen C (2013d) A procedure to obtain a refined European
land usecover map Journal of Land Use Science 8(3) 255-283
Batista e Silva F Poelman H Martens V Lavalle C (2013b) Population Estimation for the
Urban Atlas Polygons JRC Technical Report 26437 Luxembourg Publications office of
the European Union
Bhaduri B Bright E Coleman P and Urban M (2007) LandScan USA a high-resolution
geospatial and temporal modeling approach for population distribution and dynamics
GeoJournal 69 103-117
Craglia M and Granell C (2014) Citizen Science and Smart Cities JRC Technical Report
26652 Publications Office Luxembourg
Craglia M and Shanley L (2015) Data democracy - increased supply of geospatial
information and expanded participatory processes in the production of data
International Journal of Digital Earth
Craglia M Ostermann F and Spinsanti L (2012) Digital Earth from vision to practice making
sense of citizen-generated content International Journal of Digital Earth 5(5) 398-416
Deville P Linard C Martin S et al (2014) Dynamic population mapping using mobile phone
data Proceedings National Academies of Science 111(45) 15888-15893
Freire S and Aubrecht C (2012) Integrating population dynamics into mapping human
exposure to seismic hazard Natural Hazards amp Earth Systems Sciences 12(11) 3533-
3543
20
Freire S Aubrecht C and Wegscheider S (2013) Advancing tsunami risk assessment by
improving spatio-temporal population exposure and evacuation modeling Natural
Hazards 681311-1324
Freire S Florczyk A and Ferri A (2015) Modeling Day- and Nighttime Population Exposure
at High Resolution Application to Volcanic Risk Assessment in Campi Flegrei In Palen
Buumlscher Comes and Hughes (eds) Proceedings of the ISCRAM 2015 Conference
Kristiansand May 24-27 2015
Gallego FJ and Peedell S (2001) Using Corine Land Cover to map population density In
European Environment Agency ldquoTowards agri-environmental indicators Integrating
statistical and administrative data with land cover informationrdquo Copenhagen pp 94ndash
105
Gallego FJ Batista F Rocha C and Mubareka S (2011) Disaggregating population density
of the European Union with CORINE Land Cover International Journal of Geographical
Information Science 25(12) 2051ndash2069
Goodchild MF (2007) Citizens as sensors the world of volunteered geography GeoJournal
69 (4) 211ndash221
Goodchild MF Guo H Annoni A et al (2012) Next Generation Digital Earth Proceedings of
the National Academies of Science 109(28) 11088ndash11094
Jiang S Alves A Rodrigues F et al (2015) Mining point-of-interest data from social
networks for urban land use classification and disaggregation Computers Environment
and Urban Systems In press
Lavalle C Baranzelli C Batista e Silva F et al (2011) A high resolution land usecover
modelling framework for Europe ICCSA 2011 Part I LNCS 6782 60ndash75
Lavalle C Batista e Silva F Baranzelli C et al (2016) Land Use and Scenario Modeling for
Integrated Sustainability Assessment in J Feranec et al (eds) European Landscape
Dynamics CORINE Land Cover Data CRC Press - Taylor amp Francis Group pp 237-262
Martin D Cockings S and Leung S (2010) Progress report 24-hour gridded population
models Proceedings of European Forum for Geostatistics 2010 Tallinn Estonia
Martin D Cockings S and Leung S (2015) Developing a Flexible Framework for
Spatiotemporal Population Modeling Annals of the Association of American
Geographers 105(4) 754ndash772
McPherson TN and Brown MJ (2004) Estimating daytime and nighttime population
distributions in US cities for emergency response activities In Symposium on Planning
Nowcasting and Forecasting in the Urban Zone 84th AMS Annual Meeting AMS Seattle
2004
Patel NN Stevens FR Huang Z et al (2016) Improving Large Area Population Mapping
Using Geotweet Densities Transactions in GIS
Pesaresi M and Ehrlich D (2009) A methodology to quantify built-up structures from optical
VHR imagery In Gamba P and Herold M (eds) Global Mapping of Human Settlement
Experiences Datasets and Prospects Boca Raton FL USA CRC Press ch 3 pp 27ndash
58
Pesaresi M Guo H Blaes X et al (2013) A Global Human Settlement Layer from optical
HRVHR RS data Concept and first results IEEE J Sel Topics Appl Earth Observ
Remote Sens 6(5) 2102-2131
21
Smith A Martin D and Cockings S (2016) Spatio-Temporal Population Modelling for
Enhanced Assessment of Urban Exposure to Flood Risk Applied Spatial Analysis and
Policy 9(2) 145-163
Smith A Newing A Quinn N et al (2015) Assessing the impact of seasonal population
fluctuation on regional flood risk management ISPRS International Journal of Geo-
Information 4(3) 1118-1141
Spyratos S Lutz M and Pantisano F (2014) Characteristics of Citizen-contributed
Geographic Information in Huerta Schade Granell (eds) Connecting a Digital Europe
through Location and Place Proceedings of the AGILE 2014 International Conference on
Geographic Information Science Castellon Spain
Steenbrugger J Tranos E and Nijkamp P (2014) Data from Mobile phone operators A tool
for smarter cities Telecommunications Policy 39(3-4) 335-346
Tatem AJ Huang Z Narib C et al (2014) Integrating rapid risk mapping and mobile phone
call 545 record data for strategic malaria elimination planning Malaria journal 13(52)
Wu SS Qiu X and Wang L (2005) Population estimation methods in GIS and remote
sensing A review GIScience and Remote Sensing 42(1) 80ndash96
22
List of abbreviations and definitions
CLC CORINE Land Cover
CLC-R CORINE Land Cover ndash Refined
EC European Commission
EFTA European Free Trade Association
EPRTR European Pollutant Release and Transfer Register
ESM European Settlement Map
GIS Geographical Information Systems
JRC Joint Research Centre
LULC Land useland cover
MMU Minimum Mapping Unit
MPOD Mobile Phone Operator Data
NACE Nomenclature Statistique des activiteacutes eacuteconomiques dans la Communauteacute
europeacuteenne
NSI National Statistical Institute
NUTS Nomenclature of Territorial Units for Statistics
OSM OpenStreetMap
VGI Volunteered Geographic Information
23
List of figures
Figure 1 Area of interest of ENACT 11
Figure 2 Schedule of main phases and tasks and units involved 12
Figure 3 Workflow and interlinkages between the projectrsquos main phases 13
Figure 4 Population density in 8102015 derived from mobile phone operator data
(Proximus) in Belgium at 1 km resolution 15
24
List of boxes
Box 1 Why mapping spatiotemporal population is a big challenge 6
Box 2 ENACTrsquos methodology in brief 8
25
List of tables
Table 1 Main expected specifications of output datasets 10
Table 2 State of the work 14
26
Annexes
Annex 1 Literature review
The table below provides an overview of previous efforts in spatiotemporal population
modelling using mostly conventional data sources (ie excluding studies using mobile
phone data social media and other lsquobig datarsquo sources)
Publication
(Authors
and year)
Main application
objective
Temporal
resolution
Spatial
resolution Study area
Proxies for
population
allocation
Method
McPherson
amp Brown
2004
Emergency
response
(manmade disaster
- release of
hazardous
material)
Night-time
Daytime 250 m USA
StreetMap USA
ESRIGDT 1998
NAVTEC Premium
Streets Data State
Business Directory
Night-time population
disaggregation of
census data based on
road network Daytime
population worker
population
disaggregated based
on State Business
Directory + residual
residential population
Ahola et al
2007
Risk assessment
and damage
analysis (fire and
rescue services)
14 time
periods
Vector
based
(building
level)
Helsinki
(centre)
Finland
Buildings Enterprise
and agency data
related to buildings
Person traffic data
Shopping centres
Kindergartens
Schools Central
traffic buildings
Disaggregation into
point locations using a
matrix of weights (per
population subgroup
and time period)
includes expert
knowledge based
weights
Bhaduri et
al 2007
Enhancing the
temporal resolution
of population
distribution data in
the US (general
purpose)
Night-time
Daytime
3 arc
seconds
(~90 m)
USA
Roads Railroads
Airports Large Area
Landmarks Water
Recreation Areas
Retail Centers
National Land Cover
Data Elevation
Data Education
Employment Jails
and prisons Aerial
imagery
Disaggregation into
cells based on
modelled cumulative
weights Methodology
includes extensive
manual checking and
refinement
Aubrecht et
al 2014
Social impact
evaluation in crisis
management
Quasi
continuous
(1 hour
step)
100 m Baden Austria
Land use Land
cover (national data
CORINE Urban
Atlas) Street
network Building
layer
DynaPop model ndash
three components of
population (Home
Commuting Work)
disaggregated from
census zone level to
grids using a set of
spatial and temporal
weights
Freire et al
2015
Assessment of
human exposure to
volcanic hazard
Night-time
Daytime 50 m Naples Italy
Urban Atlas
European settlement
map LandScan
Census tracts
Night-time population
disaggregation of
census data based on
land use Daytime
population derived
using commuting
ratios + estimated
27
residual residential
population
Martin et al
2015
Proposal and
implementation of
a flexible
framework for
spatiotemporal
population
modeling
Quasi
continuous
(15 min
step)
200 m Southampton
UK
Residential locations
Prisons Care
homes Workplaces
Schools
Universities
Hospitals Roads
SurfaceBuilder 247 ndash
variable kernel density
estimation several
ageactivity based
population subgroups
are redistributed
across space subject
to a series of weights
constraints and
temporal profiles
Smith et al
2015
Assessment of
human exposure to
flood risk in a
coastal touristic
region
Quasi
continuous
(1 h step)
100 m St Austell area
UK
Centroids
representing
residential locations
Centroids
representing places
of work study
leisure healthcare
and retail Roads
Smith et al
2016
Assessment of
urban exposure to
flood risk
Quasi
continuous
(2 h step)
200 m Southampton
UK
28
Annex 2 CLC-R nomenclature for lsquoArtificial surfacesrsquo
Brief description examples
111 Continuous urban
fabric
1111 Dense urban fabric
1121 Medium density urban fabric
1122 Low density urban fabric
1123 Very low density or isolated urban
fabric
1211 Industry Manufacturing facilities refineries large farm
buildings
1212 Energy production water supply
waste management
Power plants (non-renewable and renewable)
water supply waste management and treatment
plants
1213 Commerce and private services Wholesale retail and business areas office
buildings exposition sites research facilities
food and beverage services (eg bars and
restaurants)
1214 Public administration defense
and social facilities
Large facilities related to health care education
public administration security law and order
services military barracks
1215 Cultural facilities Arts and cultural facilities (eg museums
libraries theaters) monuments places of
worship
1221 Road network Main road network (consisting of motorways and
other main national links)
1222 Rail network Wide rail segments
1223 Train or ferry stationTrain or ferry stations terminals
1224 Other road and rail associated land
Eg rest areas service stations
123 Port areas See CLC nomenclature illustrated guide
1241 Airport terminals and associated
buildingsAirport terminals and associated buildings
1242 Airport runway and associated
landAirport runway and associated land
131 Mineral extraction
sites
132 Dump sites
133 Construction sites
141 Green urban areas
1421 Sport and leisure greenOther artificial green areas (typically surrounding
sport and leisure facilities) Includes golf courses
1422 Sport and leisure built-up Built-up areas related to sports and leisure
activities (eg stadiums sports halls zoos luna
parks)
1423 Touristic accomodation Hotels and similar accomodations campingtrailer
sites
Predominantly residential areas at different
degrees of horizontal building density High
density areas particularly in the centre of cities
may be characterized by mixed land uses (eg
residential commercial public services)
Level 1 Level 2 Level 3 Level 4
1 Artificial
surfaces
11 Urban fabric
124 Airports
12 Industrial
commercial and
transport units
121 Industrial or
commercial units
122 Road and rail
networks and
associated land
See CLC nomenclature illustrated guide
14 Artificial non-
agricultural
vegetaged areas
13 Mine dump and
construction sites
112
Presence in CLC-R v2 to be determined
Present in CLC-R v2
Present in CLC-R v1
No further level 4 expected
142 Sport and leisure
facilities
Discontinuous urban
fabric
29
Annex 3 Classification of economic activities (NACE rev 2)
A Agriculture forestry and fishing
B-E Industry
F Construction
G-J Wholesale and retail trade transport accommodation and food service activities information and communication
K-N Financial and insurance activities real estate activities professional scientific and technical activities administrative and support service ahellip
O-U Public administration and defence compulsory social security education human health and social work activities arts entertainment and recreationhellip
A Agriculture forestry and fishing
BDE Mining and quarrying electricity gas steam and air conditioning supply water supply sewarage waste management and remediation activities
C Manufacturing
F Construction
GHI Wholesale and retail trade transport and storage accomodation and food service activities
J Information and communication
K Financial and insurance activities
L Real estate
MN Professional scientific and technical activities administrative and support service activities
OPQ Public administration defence education human health and social work activities
RSTU Arts entertainment and recreation other service activities activities of household and extra-territorial organizations and bodies
A Agriculture forestry and fishing
B Mining and quarrying
C Manufacturing
D Electricity gas steam and air conditioning supply
E Water supply sewerage waste management and remediation activities
F Construction
G Wholesale and retail trade repair of motor vehicles and motorcycles
H Transportation and storage
I Accommodation and food service activities
J Information and communication
K Financial and insurance activities
L Real estate activities
M Professional scientific and technical activities
N Administrative and support service activities
O Public administration and defence compulsory social security
P Education
Q Human health and social work activities
R Arts entertainment and recreation
S Other service activities
T Activities of households as employers u0ndifferentiated goods- and services-producing activities of households for own use
U Activities of extraterritorial organisations and bodies
6 sectors
11 sectors
21 sectors
30
Annex 4 Short description of the CLC Refined 2012 (v10)
Prepared by Filipe Batista e Silva and Konstantin Rosina
Document version November 2016
Introduction
The CORINE Land Cover (CLC) is a European land useland cover (LULC) mapping project
initiated in the mid-1980rsquos The first inventory was released for the reference year 1990
and subsequent updates have been produced for the reference years 2000 2006 and
20126 The CLC is produced under the coordination of the European Environment Agency
(EEA) using a common LULC nomenclature mapping specifications and methodologies
meant to ensure a high degree of comparability across time and countries covered thus
making it a reference and widely used data source for LULC information in Europe
CLC however is characterized by a relatively coarse minimum mapping unit (MMU) of 25
hectares for all LULC categories which is a limiting factor for applications requiring a finer
detection of LULC patterns Another key limitation particularly for applications related to
urban areas population and economic activity concerns the low thematic resolution for
artificial LULC classes The European Commission Joint Research Centre (JRC) has been
engaged in developing and implementing a methodology to address the above-mentioned
limitations of CLC so to release an enhanced European LULC map labelled ldquoCLC refinedrdquo
(CLC-R) This work is conducted by JRCrsquos own initiative as an element of its work
programme
As its name indicates the CLC-R 2012 (v10) is an enriched version of CLC 2012 with a
significantly higher spatial resolution of 1 hectare for artificial LULC categories and at least
5 hectares for non-artificial ones The methodology is based on the integration of LULC-
relevant information from multiple CLC 2012-compatible geodata sources (particularly the
Copernicus ldquoHigh Resolution Layersrdquo amongst others) A forthcoming version of CLC-R
2012 (v20) expected by mid-2017 will address the improvement of the thematic detail
of CLC 2012 namely by breaking down CLCrsquos LULC category ldquo121 ndash Industrial or
commercial sitesrdquo into various sub-classes linked to specific socio-economic sectors The
work herein referred follows and expands upon previous experience of refining the CLC
20067
The remainder of the document covers the main objectives concerning the production of
CLC-R 2012 its main characteristics input data and methodological steps A more
thorough description of the methodology is under preparation and will be published as a
JRC Technical Report
Objectives
The main objective set for CLC-R 2012 (v10) was the increase of CLCrsquos spatial resolution
(ie reduction of the minimum mapping unit) while preserving the thematic detail and
definitions of CLC Another objective was to attain a more detailed and consistent
6 For more info on CLC family of products httplandcopernicuseupan-europeancorine-land-cover 7 Batista e Silva F Lavalle C Koomen E (2013) A procedure to obtain a refined European land usecover map
Journal of Land Use Science 8(3) 255-283
31
classification of the 11X - Urban fabric classes using an unambiguous quantitative
approach to identify urban fabric of different densities
The immediate usage of the CLC-R 2012 within the JRC is twofold
- To be used as base map in LUISArsquos territorial modelling platform8
- To be used as input to the ENACT JRC exploratory project aiming at the
enhancement of activity and population mapping
The CLC 2012 refined (v10) can in addition be used for a wide range of other purposes
and applications within the JRC and elsewhere
Main characteristics of CLC-R 2012
Spatial resolution Minimum mapping unit of ~5 hectares (1 ha for artificial surfaces and
for all LULC classes in areas covered by the Urban Atlas dataset ndash European Functional
Urban Areas (FUAs) above 50000 inhabitants) Width of linear features of ~20 m Cell size
= 100 x 100 metres
Thematic resolution Same as in CLC 2012 with the following additional LULC classes 410
- Inland wetlands (a union of 411 - Inland marshes and 412 - Peatbogs) 113 - Urban
fabric low density (10-30 built-up) 114 - Urban fabric very low density and isolated
(lt10 built-up) 143 - Leisure and touristic built-up
Geographical coverage EU28 + EFTA + Western Balkans + Turkey including Islands
Azores Canary Islands Madeira Ceuta and Melilla and excluding French overseas
territories
Reference year 2012
File format Unsigned 8-bit raster file (available as GeoTIFF and File GeoDatabase Raster
Dataset)
Input Data
The CLC-R 2012 (v10) is a composite map whereby information from multiple geodata
sources has been integrated with the original CLC 2012 in a sequential order following
certain rules and criteria (see methodology section below) Input data sources have been
harvested from and selected based upon the compliance with following criteria
Compatibility with CLCrsquos LULC nomenclature (LULC class definitions)
Reference year 2012 +- 2
Higher spatial resolution than CLC 2012
Pan-European geographical coverage
Preferably free open and documented data
The input data sources are listed below
CLC products CLC 2012 v 185 CLC Changes 2006-2012 and CLC Changes 2000-
2006
8 For more info on LUISA territorial modelling httpseceuropaeujrcenluisa
32
Copernicus high resolution (HR) layers 2012 HR layer Forest type + Tree cover
density HR layer Permanent water bodies HR layer Wetlands
TomTom Multinet 2014 Land Use layer + Built-up layer
JRCrsquos European Settlement Map (ESM) (10m version aggregated to 100 m
reference grid)
Urban Atlas 2012 All available FUAs by October 2016 (580)
OpenStretMap (OSM) and TomTom Multinet 2014 as source of road network data
Methodology
The methodology consisted of a sequential integration of LULC information from multiple
geodata sources into the original CLC 2012 map At each step of the sequence specific
input data layers were used to recode the grid cells with which they overlaid spatially
following pre-established decision rules Each step typically deals with the integration of
one particular data input from the above mentioned sources
The order of the sequence is determined by the degree of spatial detail and accuracy of
the data source at hand (the more detailed and accurate the later in the sequence) or by
other logical considerations (eg linear features are added later in the process due to less
strict MMU) Each step is automatized as a separate GIS tool The table below describes
the main steps of the workflow
Step Input data
source Description of procedure
Affected
LULC classes
1 CLC change maps Selected CLC change patches that were not included into CLC2012 map due to generalization rules are
added
All
2 Copernicus High resolution layers
A threshold of 50 is applied to the continuous pixel values (ie the respective class must cover the majority of pixel to be considered) A MMU of 5 contiguous pixels is applied
31X 41 51X
3
TomTom Multinet
2014 ndash Land Use
layer
Land use information from TomTom are added A look-up table is used to establish the relationship between the TomTom and CLC nomenclatures Vector polygons are rasterized using Maximum
Combined Area criterion Applied MMU = 1 pixel ie individual pixels are included
121 122
123 124
141 142
4 European Settlement Map
First a 100 m raster coincident with EEA reference grid is derived from the original 10 m version Pixels overlapping non-residential artificial classes are excluded as are the pixels under minimum building density threshold (empirically derived value of 5)
Applied MMU = 1 pixel ie individual pixels are included
11X
5 Urban Atlas 2012 Vector polygons are rasterized using Maximum Combined Area criterion a decision matrix (original CLC class vs urban atlas class) is used to establish
All
33
the final classification of overlapping pixels Applied
MMU = 1 pixel ie individual pixels are included
6 European Settlement Map
The general 11X class lsquourban fabricrsquo is differentiated into 4 classes according to the underlying building density (based on ESM data) ndash 111 - dense 112 -
medium density 113 - low density 114 - very low density or scattered built-up
11X
7
HR layer Permanent water bodies + OSM and TomTom Multinet 2014 ndash Road networks
Linear features such as rivers and mains roads are included The inclusion of linear features obeys to less restrictive thresholds of within-pixel cover so to preserve as much as possible the spatial contiguity
of these features (in view of their distinct function and importance in structuring and fragmenting the territory) However within artificial areas linear
features are included only when the percentage covered is larger than that of building cover
122 51X
8 European Settlement Map
Built-up areas in the class 142 - Sport and leisure
facilities are extracted as a separate class 143 - Leisure and touristic built-up
142 143
9 TomTom Multinet 2014 ndash Built-up layer
Areas pertaining to Local Administrative Units (LAU2) for which the amount of built-up is significantly lower than expected (given an empirical
relationship between size of the population and urban fabric surface) are refined by adding built-up areas from the TomTom built-up layer Added built-up areas are coded as 114 - very low density or isolated built-up
114
34
Nomenclature
Value Label
111 Urban fabric dense (gt 50 built-up)
112 Urban fabric medium density (30-50 built-up)
113 Urban fabric low density (10-30 built-up)
114 Urban fabric very low density and isolated (lt10 built-up)
121 Industrial or commercial units
122 Road and rail networks and associated land
123 Port areas
124 Airports
131 Mineral extraction sites
132 Dump sites
133 Construction sites
141 Green urban areas
142 Sport and leisure facilities
143 Leisure and touristic built-up
211 Non-irrigated arable land
212 Permanently irrigated land
213 Rice fields
221 Vineyards
222 Fruit trees and berry plantations
223 Olive groves
231 Pastures
241 Annual crops associated with permanent crops
242 Complex cultivation patterns
243 Land principally occupied by agriculture with significant areas of natural vegetation
244 Agro-forestry areas
311 Broad-leaved forest
312 Coniferous forest
313 Mixed forest
321 Natural grasslands
322 Moors and heathland
323 Sclerophyllous vegetation
324 Transitional woodland-shrub
331 Beaches dunes sands
332 Bare rocks
333 Sparsely vegetated areas
334 Burnt areas
335 Glaciers and perpetual snow
410 Inland wetlands
421 Salt marshes
422 Salines
423 Intertidal flats
511 Water courses
512 Water bodies
521 Coastal lagoons
522 Estuaries
523 Sea and ocean
New or redefined classes
35
For illustration purposes the figures below show the differences between the original CLC
2012 (top) and CLC-R 2012 (v10) (bottom) for the area surrounding the city of Turin
Italy
36
Annex 5 List of land use and activity data sources
Data source name Type Reference
date
Description
content
Use in ENACT
Bookingcom Web-service 2016 Location of hotels To reveal locations of
probable tourist
presence (night-time)
Copernicus High
resolution layers
Open public 2012 Spatial raster layers
describing forests
wetlands and water
bodies
Spatial refinement of
CLC
CORINE Land
Cover
Open public 2012 Land usecover map
with 44 classes
Base map for activity
mapping
European
Pollutant Release
and Transfer
Register (EPRTR)
Open public Location of polluting
industries and waste
treatment plants
Thematic refinement of
CLC
European
Settlement Map
Open public 2012 Density of built-up Spatial refinement of
CLC
EuroRegionalMap Proprietary Location of activities
(points of interest)
Thematic refinement of
CLC
National land use
maps
Public or
proprietary
2007-2012 Detailed land use maps
for the following
countriesregions
Portugal Spain
Wallonia Lombardia
The Netherlands
Provide training and
test subsets for the
thematic refinement of
CLC
OpenStreetMap Open VGI 2016 Location of activities
(points of interest)
Thematic refinement of
CLC
PLATTS Proprietary Location of power
plants
Thematic refinement of
CLC
TomTom Proprietary 2013 Location of activities
(land use polygons and
points of interest)
Road and rail
networks
Spatial and thematic
refinement of CLC
TripAdvisorcom Web-service 2016 Location of hotels
restaurants and
tourist attractions
To reveal locations of
probable tourist
presence (day- and
night-time)
Urban Atlas Open public 2012 Land use maps for
European Functional
Urban Areas
Spatial refinement of
CLC
Europe Direct is a service to help you find answers
to your questions about the European Union
Freephone number ()
00 800 6 7 8 9 10 11 () The information given is free as are most calls (though some operators phone boxes or hotels may
charge you)
More information on the European Union is available on the internet (httpeuropaeu)
HOW TO OBTAIN EU PUBLICATIONS
Free publications
bull one copy
via EU Bookshop (httpbookshopeuropaeu)
bull more than one copy or postersmaps
from the European Unionrsquos representations (httpeceuropaeurepresent_enhtm) from the delegations in non-EU countries (httpeeaseuropaeudelegationsindex_enhtm)
by contacting the Europe Direct service (httpeuropaeueuropedirectindex_enhtm) or calling 00 800 6 7 8 9 10 11 (freephone number from anywhere in the EU) () () The information given is free as are most calls (though some operators phone boxes or hotels may charge you)
Priced publications
bull via EU Bookshop (httpbookshopeuropaeu)
LF-N
A-2
8335-E
N-N
doi102791056071
ISBN 978-92-79-64588-4

3
1 Introduction
ENACT (ldquoENhancing ACTivity and population mappingrdquo) is an Exploratory Research Project
awarded in 2015 by the JRC Scientific Committee following a selection procedure It has
a duration of 2 years (2016-2017) and involves three units at the JRC
- JRCB3 Territorial Development
- JRCB6 Digital Economy and
- JRCE1 Disaster Risk Management
ENACT fulfils the overall requirements of the 2015 call for Exploratory Research Projects
at the JRC a) it is an innovative project with ambitious goals b) links multiple units and
directorates within the JRC and c) builds new scientific competences for future policy
demands not necessarily linked to existing policy support Additionally the expected
outputs in terms of intermediate and final produced geo-datasets are expected to be useful
to other activities at the JRC namely for the territorial modelling community dealing with
issues such as transport land use regional economy etc and for disaster risk assessment
and management
The project has been granted dedicated human resources both from existing personnel
(partially dedicated to ENACT) and new recruits (ie three new recruits one for each unit
involved fully dedicated to ENACT) The project officially kicked-off in January 2016 The
first recruit joined unit JRCB3 on the 1st of August 2016 A second recruit joined unit
JRCE1 on the 1st of November 2016 and third recruit is expected to join unit JRCB6 in
2017 Therefore for most of 2016 the project ran understaffed with impact on the
schedule Despite these limitations significant progress has been accomplished throughout
2016
In this projectrsquos interim report we make an account of the state of the work conducted so
far with highlight to the following tasks literature review (chapter 2) activity mapping
and collection of population statistics at regional level (chapter 4) A thorough description
of the project (objectives product specifications workflow and schedule) is provided in
chapter 3 The report concludes with a discussion of the main risks and challenges identified
for the remainder of the project A number of relevant annexes complement the
information provided throughout the report
4
2 Background and state-of-the-art
The JRC has a long and recognized experience in population mapping and modelling Since
the early 1990rsquos it has contributed to revolutionize the way population is represented and
mapped at European level From the early works of Gallego and Peedell (2001) to most
recently Gallego et al (2011) and Batista e Silva et al (2013a) methods to map population
have been experimented and refined allowing the creation and update of maps
representing residential population across Europe Thanks to these early efforts
rudimentary ndash and to large extent ineffective ndash maps showing population density per
administrative unit have been replaced by more realistic and useful depictions of population
distribution at regular grid cell level typically with a 100x100 meters resolution and usually
referred to as lsquopopulation gridsrsquo The data structure and high resolution of population grids
allowed wider integration with other datasets in Geographical Information Systems (GIS)
and thus have become indispensable datasets among both social and environmental
researchers and spatial planners
The main principle underlying the construction of such maps relies on the combination of
two inputs population counts usually available per administrative units or census zones
and a covariate of population distribution at higher spatial resolution for example
residential areas extracted from land use maps building footprints impervious surfaces
road network or even night-time lights from remote sensing imagery (for an extensive
review of population estimation methods using GIS and Remote Sensing see Wu et al
2005) Using similar approaches population estimates for the Urban Atlas polygons1 have
also been created at the JRC at the request of DG REGIO (Batista e Silva et al 2013b
Batista e Silva and Poelman 2016) In addition the JRC has achieved to model future
population distributions at European level under different scenarios using the LUISA
territorial modelling platform given demographic projections within-region migration and
local potential for urbanization (Batista e Silva et al 2013c Lavalle et al 2016)
Despite the many improvements introduced by different researchers over the years
European population grids are ndash still nowadays ndash essentially static maps of lsquoresidential
populationrsquo Residential population refers to the number of people who declare to reside in
a given location As such when mapping residential population we are essentially mapping
the distribution of population during the night time assuming that most people stay in
their declared places of residence during the night for shelter and rest and excluding the
fraction of people who work outside their residences during night time Maps of residential
population have developed quicker due to easier access to data all European National
Statistical Institutes (NSI) at least once every 10 years count systematically the number
of residents per census zone
Residential population grid maps although sufficient for a range of purposes describe only
a fraction of reality The spatial distribution of people during the daytime or where people
stay in different seasons is practically unknown for any spatial scale Yet such information
is essential to an all range of applications (Martin et al 2010) The location of population
during the day is determined by the location of economic social and leisure facilities which
pull population off their residences driving commuting flows and other forms of daily trips
Daytime population distribution thus varies greatly from night-time distribution Contrary
to night-time population ndash which as already mentioned can be straightforwardly inferred
1 Urban Atlas httplandcopernicuseulocalurban-atlasurban-atlas-2012
5
by official statistics on residential population ndash it is much more challenging to infer daytime
population distribution
Addressing the needs of emergency response compatible day- and night-time population
grids have been produced in the mid-2000s for the USA (McPherson et al 2004 Bhaduri
et al 2007) In Europe such datasets have been mostly lacking with only a few countries
systematically collecting base data and modelling population distribution on the daily cycle
(eg Ahola et al 2007) More recent research (Martin et al 2015 Martin et al 2010
Aubrecht et al 2014 Smith et al 2016) has been increasing the resolution of the temporal
component andor including a seasonal dimension for limited regional areas by mining
conventional data Other authors have explored the contribution of non-conventional data
such as mobile phone activity records (Deville et al 2014 Tatem et al 2014) or
lsquogeotweetsrsquo (Patel el al 2016) for population mapping in selected countries a task which
is not without shortcomings and challenges A relatively straightforward approach was
proposed to estimate day- and night-time population distribution at high resolution for the
cities in Urban Atlas (Freire et al 2015) yet its quality depends largely on that of ancillary
datasets and availability of local parameters and its accuracy is still uncertain
The challenges posed by spatiotemporal mapping and modelling of population distribution
cannot be addressed effectively by conventional data sources alone (eg official statistics
and reference land use datasets) Significant advances in this field can only be attained if
data from conventional data sources are combined with data from emerging non-
conventional data sources in a coherent methodological framework Non-conventional data
sources may include volunteered geographical information (Goodchild 2007) web-based
social networks (Aubrecht et al 2016) thematic proprietary databases mobile phone
operator data or even navigation systems
Data mining from such (big) data sources is becoming a common task in many geospatial
applications Craglia and Granell (2014) reviewed a range of projects leveraging citizen
science or crowd sourcing in the area of environmental monitoring and smart cities
application There are several projects that demonstrate the benefits of combining official
and non-official sources These include for example the GEO-Wiki project focusing on global
land cover validated by local people in a game-inspired apps and its urban application
Cities Geo-wiki2 whose aim is to map the physical geography of all major cities in the world
to link to weather and climate models Another approach to augment local land use and
building use databases with crowd-sourced information is documented by Spyratos et al
(2014) who used data from lsquoFoursquarersquo to monitor the dynamic changes in building use
in commercial areas Other studies have also shown that thematic geospatial layers can be
obtained from disparate data sources and integrated with existing land use maps for
improved detail (Batista e Silva et al 2013d Jiang et al 2015) One of the most promising
data sources to estimate population density comes from mobile network operators Several
studies have documented the importance and usefulness of this data source (see for
example Steenbrugger et al 2014 and Deville et al 2014) but one key problem remains
data access which is normally negotiated with the data providers by individual researchers
for specific projects
Until a few years ago population grids were almost unknown to most researchers even in
domains with a strong spatial dimension But population grids gained momentum very
rapidly and have become mainstream input for many analyses Eurostat which was
initially reluctant to publish population figures using non-conventional zoning systems
6
kicked-off the GEOSTAT project in 20102 to promote the production dissemination and use
of lsquogriddedrsquo population among NSIs But despite all the referred advances Europe is still
lacking a wall-to-wall spatiotemporal model of population distribution Given its experience
in population mapping and big data mining as well as its fast track connection to Eurostat
and NSIs the JRC through the ENACT project is in good position to expand upon the state
of the art and fill the existing gaps in population mapping
Box 1 below summarizes the main challenges associated with spatiotemporal population
mapping
Box 1 Why mapping spatiotemporal population is a big challenge
Fast population dynamics People commute travel and migrate faster than ever
before
Multifaceted concept While during the night most of us are lsquoresident
populationrsquo during the day our (multiple) occupations
relate to the (multiple) locations of probable presence
Data availability issues No official statistical sources exist Daytime population
needs to be inferred from multiple indirect and perhaps
new data sources
State-of-the-art Few case studies often incomparable due to the use
different methodologies and input data of different
nature3
2 GEOSTAT initiative httpeceuropaeueurostatwebgiscogisco-activitiesintegrating-statistics-
geospatial-informationgeostat-initiative 3 See Annex 1 for an overview of previous efforts in spatiotemporal population modelling using conventional
data sources
7
3 Project description
31 ENACT in a nutshell
Population is a crucial variable for the social sciences the geosciences and for policy
support in many domains Yet our knowledge of its spatial distribution is still nowadays
very incomplete Population is a temporally dynamic variable with major shifts in its
distribution occurring in daily and seasonal cycles resulting in rapidly changing densities
Spatially detailed representations of residential population exist at EU level since several
years While these maps can be used as proxy for night-time population distribution the
distribution of population for other time frames is practically unknown at almost every
spatial scale Consequently all applied sciences and policy support that require spatially
detailed information on population distribution are based on only a fractional and static
representation of reality Overcoming this large knowledge gap is the main goal of the
ENACT exploratory research project
Several methodological challenges and data limitations have hindered progress in this field
in the past This project aims at addressing the challenges that are required to obtain (1)
the amount of people per type of activity per time-frame and per region and (2) their
likely location at a high spatial resolution The first element requires regional data on
residents employees per sector of activity students and tourists which can be derived
mostly from official sources The second element requires spatial data on the location of
activities (eg manufacturing retail health education leisuretourism) which will be
sought from various conventional (eg remote sensing imagery land use maps) and
unconventional data sources (eg volunteered geographical information large proprietary
geo-databases and web-services) The final challenge is to validate the produced multi-
temporal population distribution grid maps ENACTrsquos output will be compared against
reference data from independent sources such as multi-temporal population grids derived
from mobile phone operator data or other sources (eg produced by other researchers)
and micro-data from National Statistical Institutes (NSIs) on location of employment
Ultimately this project aims at developing and implementing a consistent and validated
methodology to produce multi-temporal (ie including daily and seasonal variations)
population distribution grids for Europe Such datasets will expand the knowledge base of
spatiotemporal population patterns across the continent Moreover multi-temporal
population grids can be a useful and straightforward (ie easy to integrate) input to several
models developed and run at the JRC particularly transport land use economic and
environmental models and exposure to hazards with potential positive impact on the
reliability of assessments
In addition to fostering a range of applications across Europe the forthcoming public
dissemination of ENACTrsquos final outputs may increase awareness among national authorities
on the importance of collecting good quality data on population and location of activities
8
Box 2 ENACTrsquos methodology in brief
The following questions define the main methodological aspects that need to be
addressed by ENACT in order to produce multi-temporal population grids for Europe
Question 1a How many people are inside and outside their residences during
the day in each region
Action To estimate total population per type of main activity per NUTS3 region
How By assembling official data from Eurostat on the no of workers per sector of
economic activity no students per main educational levels no of tourists and
number of inactive population (and thus likely to be at home during the day) per
region
Question 1b What is the seasonal variation of total present population in each
region
Action Seasonal variation of total present population in a region is mostly due to
touristic flows Therefore inbound and outbound tourist flows of each region per
season (or per month) must be taken into account by ENACT
How By first downscaling total yearly nights-spent per NUTS2 to NUTS3 using the
no of beds per NUTS3 Then breaking down the NUTS3 yearly nights-spent per
month using as proxy monthly flight traffic information from Eurostat Monthly
nights-spent per region can then be easily converted to average no of tourists
present in a given month by dividing total nights-spent in a month by the total no of
days comprised in that month Finally the number of tourists present in given a
region in a given month are removed from their likely regions of origin
Question 2 Where do people spend their time during the day and night
Action There is no one-stop shop for such multi-sector highly detailed locations of
activities ENACT needs to resort to various sources proprietary and open-source
conventional and non-conventional Specific population sub-groups then need to be
allocated to locations of probable presence
How By extracting relevant activity-location data from multiple sources namely
conventional (eg LULC maps remote sensing) volunteered geographic information
(eg OpenStreetMap) web-based services and proprietary sources (eg TomTom
PLATTS GISCO-EuroGeographics etc) At night-time residents will be located to
residential areas and tourists to touristic accommodation facilities At daytime the
various population sub-groups (eg students workers per sector of activity tourists)
will be allocated to the relevant activity types based on a probability matrix
Question 3 How accurate are ENACTrsquos multi-temporal population grid maps
Action To compare ENACTrsquos outputs with other reference data
How By resorting in particular to emerging population density grid maps derived
from mobile phone operator data but also to existing employment grids produced by
some NSIs Comparing ENACTrsquos grids with grids from other researchers is an
additional option
9
32 Specific objectives of ENACT
The ultimate objectivesoutputs of ENACT are as follows
mdash In terms of data production
To produce a set of multi-temporal population grid maps that take into account the
main seasonal and daily variations of population consistent with the most recent
census data (2011) and covering the largest possible number of EU28 countries
ENACT aims at least 6 population grid maps covering 3 main seasons of the year
(summer winter springautumn) for both night- and daytime
mdash In terms of dissemination of methods and results
To write a scientific paper summarizing the methodology and results and submit it
to a high-impact geographical science journal
To disseminate the final multi-temporal population grids following the INSPIRE
directive standards using JRC web channels
To fulfil the above objectives the following intermediate objectivesoutputs of ENACT are
expected
To review the most recent and significant scientific literature on daytime (or multi-
temporal) population mapping
To build a database of population stocks at regional level (NUTS23) with no of
residents employed population per main sector of activity nr of students nr of
tourists and inactive population The database must have a temporal dimension
(seasonal or monthly)
To build a geodatabase with land use and activity information at the highest possible
thematic and spatial resolution by assembling data from both conventional and non-
conventional sources
To produce an enhanced version of the CORINE Land Cover Map 2012 with
improved spatial resolution (minimum mapping unit of 1 hectare instead of 25) and
thematic resolution (further breakdown for specific CLCrsquos LULC classes)
To compare ENACTrsquos multi-temporal population grids with other independent
sources namely multi-temporal population grids derived from mobile phone
operator data or other sources (eg produced by other researchers) and micro-
data from National Statistical Institutes (NSIs) on location of employment4
33 Main specifications of output datasets
As per the above objectives two sets of data will be produced (a) geodatabase with land
use and activity information and (b) multi-temporal population grid maps The former item
comprises individual datasets with location of specific activities plus an overarching land-
use map herein referred to as CLC-R 2012 CLC-R 2012 is a refined version of CLC 2012
with increased spatial and thematic resolution and built by integrating geodata from
multiple sources (see Annex 4) Because CLC-R contains the location of many types of
activities it will be the backbone for the subsequent production of the multi-temporal
population grid maps
4 The comparison exercise however may only be feasible for selected regions or countries in Europe
depending on the amount of reference data the project is able to collect and handle
10
Table 1 summarizes the main specifications (spatial coverage spatial thematic and
temporal resolutions reference dates) of the two sets of data Figure 1 shows the area of
interest of ENACT
The multi-temporal population grid maps have a more limited spatial coverage than the
CLC-R because they require as input statistical data which is not fully available from
Eurostat for countries outside EU28 The spatial resolution is also somewhat more limited
for the final multi-temporal population grid maps due to the inability to validate these maps
at a resolution below 1 Km The temporal resolution is yet to be defined but ENACT aims
at least 6 maps (summer winter springautumn x day- and night-time) The possibility to
have higher temporal resolution (eg 24 maps each month x day- and night-time) is
currently under consideration depending on whether we will be able to break down yearly
tourist stocks per month
Table 1 Main expected specifications of output datasets
Land use and activity data
(CLC-R)
Multi-temporal population grid
maps
Spatial coverage EU28 + EFTA + Balkan countries
+ Turkey (see figure 1)
EU28 (see figure 1)
Spatial resolution 100 m 100 m (production) 1 Km
(dissemination)
Temporal resolution Single year Monthly or seasonal x day- and
night-time
Thematic resolution ~ 10 separate land use
categories relevant for
population mapping
(see Annex 2)
Population per various sub-groups
(residents employees per sector
of activity students tourists
inactive)
Reference date 2012 2011
11
Figure 1 Area of interest of ENACT Legend Green area of interest for the multi-temporal
population grids (EU28) Yellow area of interest for land use and activity data Grey outside area
of interest
34 Workflow and schedule
The main phases and tasks of the project are mapped in the Gantt chart of Figure 2 with
an approximate schedule of the work The herein project planning is a revision of the
original schedule included in the project proposal It has a slightly revised arrangement of
the main phases and divides each of the 6 mains phases into sub-activities or tasks The
green bars correspond to the originally scheduled duration of each task The grey bars
correspond to the revised duration For many tasks the duration was prolonged for
additional months as the project ran significantly understaffed for most of 2016 The
flowchart in Figure 3 shows how the main phases of the project (in square brackets) are
interconnected
The first crucial phase of the project (lsquoPreparationrsquo) paves the way for a structured and
solid kick-off It includes a literature review of the most recent and relevant work in the
field as well as an inventory of the data needs and potential data sources In addition
linkages between the nomenclatures used in the various data sources will be established
using the NACE rev2 as pivotal nomenclature
The second phase (lsquoRegional flows and stocks of peoplersquo) includes the collection of
statistical data primarily from official sources (Eurostat and NSIs) The statistical data will
be worked in order to produce seasonal or monthly regional balances of various population
sub-groups namely residents workers per 6 sectors of economic activity students
tourist and inactive population
12
The third phase (lsquoActivity mappingrsquo) goes in parallel with the second phase and consists
of collecting land use and activity location data from all available data sources These data
will be combined to improve both the spatial and thematic resolutions of CLC 2012 and
thus generate the lsquoCLC-Rrsquo The CLC-R will be the base map for the allocation of population
sub-groups in different land use and activity categories for different time-frames (seasons
or months and night-time and daytime) The spatial allocation or disaggregation of
population will be carried in the fourth phase of the project (lsquoModelling spatiotemporal
population distributionrsquo)
In the fifth phase of the project (lsquoValidationrsquo) a comparison will be made between ENACTrsquos
main outputs (ie multi-temporal population grid maps) and reference data from
independent sources namely multi-temporal population grids derived from mobile phone
operator data or other sources (eg produced by other researchers) and micro-data from
National Statistical Institutes (NSIs) on location of employment With the comparison
exercise we expect to assess the validity of ENACTrsquos outputs Although the ENACTrsquos
outputs may not be fully comparable with the independent sources used in the validation
(eg due to differences in total estimated population within a given spatial unit of analysis)
appropriate indicators will be established to check the degree of agreement in terms of
relative difference of population between various time frames (eg night-time vs daytime
or seasonmonth lsquoArsquo vs seasonmonth lsquoBrsquo) The comparison exercise may only be feasible
for selected regions or countries in Europe depending on the amount of reference data the
project is able to collect and handle The validation is indispensable for the lsquoReporting and
disseminationrsquo of ENACTrsquos outputs (phase 6 of the project)
Figure 2 Schedule of main phases and tasks and units involved
1 2 3 4 5 6 7 8 9 10 11 12 1 2 3 4 5 6 7 8 9 10 11 12
11 Literature review B3 B6 E1
12 Assessment of data needs and
sourcesB3 B6 E1
13 Harmonization of data
nomenclaturesB3
21 Collect population employment
tourism and students statisticsB3
22 Seasonal or monthly regional
population balancesE1 B3
31 Collect geo-referenced land use
and activity dataB3
32 Spatial refinement of CLC2012 B3
33 Thematic enhacement of CLC2012 B3
E1 B3
51 Collect reference data (NSIs and
mobile phone operator data)B6
52 Carry validation exercise B6 E1 B3
61 Interim report B3 B6 E1
62 ER workshop presentation B3 B6 E1
64 Preparation of peer-reviewed paper B3 E1 B6
65 Public dissemination of GIS layers B3 E1 B6
4 Modelling spatiotemporal population distribution
Time bar main tasks and units involved
2016 2017
2 Regional flows
and stocks of
people
3 Activity
mapping
Tasks
5 Validation
6 Reporting and
dissemination
Phase
1 Preparation
13
Figure 3 Workflow and interlinkages between the projectrsquos main phases
14
4 State of the work
So far we have mostly focused on phases 1 2 and 3 of the project although some
preparatory tasks for the subsequent phases have also initiated Below we list and describe
the main tasks completed on-going and forthcoming
Table 2 State of the work
Phasetask Description Actors Depen-
dencies Status
1 Preparation
11 Literature
review
lsquoFirst roundrsquo of literature review of multi-temporal population
mapping to steer the kick-off of the project lsquoSecond roundrsquo
complementary literature review to done by the time of the writing
of the final paper
B3 B6
E1 None
lsquoFirst
roundrsquo of
review
complete
See
summary
in chapter
2 of the
herein
report +
annex 1
12 Assessment of
data needs and
sources
List of potentially useful sources of geographical and statistical data
to be used in different stages of the project
B3 B6
E1 11
Complete
See annex
5
13 Harmonization
of data
nomenclatures
Check data nomenclatures and classifications from the different
sources of data useful to the project Make the necessary
correspondences between classifications
B3 12 Complete
2 Regional flows and stocks of people
21 Collect
population
employment
tourism and
students statistics
Collection of raw statistical data from Eurostat on number of
residents employees per sector of economic activity students per
main educational levels number of nights-spent by tourists per
NUTS23 and flight data per airport unemployment rates
B3 12
On-going
(close to
completio
n)
22 Seasonal or
monthly regions
population
balances
Production of seasonal or monthly tables of population balances per
NUTS3 and per the following population categories resident
population employees (per sector of activity) students (per main
educational levels) tourists and non-active population taking into
account outbound tourism and to avoid double counting of
population
E1 B3 21
On-going
(just
initiated)
3 Activity mapping
31 Collect geo-
referenced land
use and activity
data
Collection and preparation of available data on land use and
activities locations from multiple sources (openproprietary
conventionalnon-conventional)
B3 12 Complete
32 Spatial
refinement of CLC
2012
Improvement of the spatial resolution of CLC 2012 Reduction of
minimum mapping unit (MMU) from 25 ha to 1 ha for all lsquoartificial
surfacesrsquo group of LULC classes See Annex 4 for a more complete
description
B3 31 Complete
33 Thematic
refinement of CLC
2012
Improvement of the thematic resolution of CLC 2012 Add additional
breakdown (lsquolevel 4rsquo) to some lsquoartificial surfacesrsquo LULC classes B3 31 32 On-going
15
4 Modelling spatiotemporal population distribution
Modelling
spatiotemporal
population
distribution
Downscaling of multi-temporal population balances per NUTS3 (task
22) to grid cell level based on the location of land uses and
activities
E1 B3 2 3
On-going
First
prototype
scripts
under
constructi
on
5 Validation
51 Collect
reference data
(NSIs and mobile
phone operator
data)
Establish methods to estimate population density distribution from
network-based mobile phone data1 Obtain data on population
densities derived from mobile phone operator data (MPOD) The
sample should ideally include more than one European
regioncountry and have both daily and seasonal resolution Obtain
employment grids for a sample of European regionscountries
B6 12
On-going
Data for
Belgium
collected
(see figure
4)
52 Carry
validation
exercise
Define a methodology for the validation exercise Preparation of
MPOD for the comparison with ENACTrsquos multi-temporal population
grids Construct indicators of agreement between the reference grids
and ENACTrsquos multi-temporal population grids
B6 E1
B3 41 51
To be
initiated
6 Reporting and dissemination
61 Interim report Interim report describing the projectrsquos objectives and progress of the
work
B3 B6
E1 na Complete
62 Exploratory
research
workshop
presentation
Oral presentation of the projectrsquos progress to the JRC Scientific
Committee
B3 B6
E1 na
To be
scheduled
63 Preparation of
peer-reviewed
paper
Scientific paper describing the newly produced datasets B3 B6
E1 4 5
To be
initiated
64 Public
dissemination of
GIS layers
Public dissemination of GIS layers possibly using JRC web channels B3 B6
E1 4 5
To be
initiated
Notes 1 Published journal article Estimating population density distribution from network-based mobile phone datardquo PUBSY JRC96568
Figure 4 Population density in 8102015 derived from mobile phone operator data (Proximus) in Belgium at 1 km resolution
16
41 Participation in events
The ENACT project has already been presented in the following occasionseventsworking
groups
10-12 November 2015 European Forum for Geography and Statistics (EFGS) 2015
Conference Vienna Austria
Presentation by Filipe Batista e Silva titled rdquoThe ENACT project Towards
spatiotemporal population mappingrdquo
12 February 2016 1st JRC-Eurostat workshop on Big Data Ispra Italy
Presentation by Filipe Batista e Silva titled rdquoThe ENACT project Towards
spatiotemporal population mappingrdquo
1-2 September 2016 JRC Big data for science and policy workshop Ispra Italy
Presentation by Filipe Batista e Silva titled rdquoBig data for rsquoEnhancing
activity and population mappingrsquordquo
22 November 2016 ERSAREGIOUCL joint international workshop rdquoHow can
regional policy benefit from Big Datardquo Louvain-la-Neuve Belgium
Presentation by Filipe Batista e Silva titled rdquoSpatiotemporal population
mapping in Europerdquo
Participation in the work of the European Statistical System Big data Task Force
chaired by ESTAT which is the forum in which collaboration with statistical agencies
and some mobile phone operators takes place that can assist in the validation of
the ENACT outputs (Massimo Craglia)
Participation in collaborative work between ESTAT the Belgian Statistical agency
and Proximus mobile phone operator5 (Massimo Craglia)
5 See description here
httpeconomiefgovbefrbinariesCarrefour_economie_2016_10_tcm326-280315pdf pages 38-53
17
5 Conclusions main risks and challenges ahead
The work is progressing well given the stated limitations (project running considerably
understaffed for most of 2016) Nonetheless significant progress has been made (see
summary in chapter 4) As main milestones achieved we highlight the conclusion of the
spatial refinement of CLC-R 2012 and the collection of most data inputs necessary for the
detailed mapping of activities and construction of regional population balances
At project proposal stage we had identified the following main risks
1 The collection of land-use relevant VGI has not been assessed at EU scale addressing
redundancy between data sources and assessing data quality (ie completeness
consistency updatehellip) at EU level are key challenges
2 The accuracy levels of the resulting population grids will determine the appropriate
spatial resolution of the final layers for public dissemination A low spatial resolution
(eg cell size gt 1 Km) can limit the range of potential applications
3 The delivery schedule and sample size of the mobile phone data are not fully known at
this stage
4 Potential delays in the production of the CLC 2012 for some countries could lead to
gaps in the spatial coverage of the CLC-R 2012
Risks 2 and 3 remain open at the current stage of the project Risk 1 will be address by
applying Machine Learning methods to classify CLC-R polygons into a more detailed a set
of discrete LULC classes Risk 4 is now obsolete CLC 2012 has been completed and is
available at the Copernicus Land Monitoring Service website The spatial refinement of CLC
2012 has been already accomplished for the entire extent of the CLC mapped area The
thematic refinement of CLC is on-going and progressing as expected so far
However as the work progressed we identified additional challenges
mdash Related to the construction of NUTS3 population balance tables
Tourism and student data only available at NUTS2 for some countries ndash downscaling
to NUTS3 possibly using proxies
Breakdown of yearly NUTS3 tourists per seasonmonth necessary Method based
on using monthly flight traffic as proxy still under testing phase
Workers in one NUTS3 region can be resident in another NUTS3 region (commuting
between NUTS3) Commuting data between municipalities or even NUTS3 seems to
be completely inexistent at EU-level Pragmatic assumptions might be necessary
Statistics for activeinactive population and unemployment available only at NUTS2
Downscaling to NUTS3 might be necessary using proxies available at NUTS3 (eg
total population and population per age-groups)
Inbound tourists in one NUTS3 have other NUTS3 as regions of origin which need
to be identified Method still to be defined
Construction of NUTS3 consistent population balance tables that avoid double
counting of total population
mdash Concerning the disaggregation of population stocks from regional to pixel level
The relationship between certain population sub-groups (eg employees per sector
of economic activity or tourists) and the land uses is of rsquoone-to-manyrsquo In other
words a population category can occur in more than one land use type This will
inevitably call for additional parametrization of the downscaling algorithms possibly
18
using probability matrices defining the probability of land use class holding
population from the various sub-groups
mdash Related to the use of lsquoBig Datarsquo sources
Extractionminingscrapping of data from the web is sometimes challenging (a
dedicated procedure needs to be constructed for each website)
The big data sources screened for the ENACT project are mostly proprietary with
strict terms and conditions of use
Dialogue with individual data providers would be required to gain legal access
Quality of data unknown difficult to measure accuracy and completeness of
bottom-up generated data
Methodological challenges making sense out of the multiple big data sources for
our specific needs
19
References
Ahola T Virrantaus K Krisp JM and Hunter GJ (2007) A spatio‐temporal population model
to support risk assessment and damage analysis for decision‐making International
Journal of Geographical Information Science 21(8) 935-953
Aubrecht C Oumlzceylan Aubrecht D Ungar JK et al (2016) VGDI - Advancing the Concept
Volunteered Geo-Dynamic Information and its Benefits for Population Dynamics
Modeling Transactions in GIS
Aubrecht C Steinnocher K and Huber H (2014) DynaPop - Population distribution dynamics
as basis for social impact evaluation in crisis management In S R Hiltz et al (eds)
Proceedings of ISCRAM 2014 - 11th Int Conf on Information Systems for Crisis
Response and Management University Park PA USA
Batista e Silva F and Poelman H (2016) Mapping population density in Functional Urban
Areas - A method to downscale population statistics to Urban Atlas polygons JRC
Technical Report no EUR 28194 EN doi10279106831
Batista e Silva F Gallego J Lavalle C (2013a) A high-resolution population grid map for
Europe Journal of Maps 9(1) 16-28
Batista e Silva F Koomen E Diogo V et al (2014) Estimating demand for industrial and
commercial land use given economic forecasts PLOS ONE 9 e91991
Batista e Silva F Lavalle C Jacobs-Crisioni C et al (2013c) Direct and indirect land use
impacts of the EU cohesion policy Assessment with the Land Use Modelling Platform
JRC scientific and policy report 26460 Luxembourg Publications office of the European
Union
Batista e Silva F Lavalle C Koomen C (2013d) A procedure to obtain a refined European
land usecover map Journal of Land Use Science 8(3) 255-283
Batista e Silva F Poelman H Martens V Lavalle C (2013b) Population Estimation for the
Urban Atlas Polygons JRC Technical Report 26437 Luxembourg Publications office of
the European Union
Bhaduri B Bright E Coleman P and Urban M (2007) LandScan USA a high-resolution
geospatial and temporal modeling approach for population distribution and dynamics
GeoJournal 69 103-117
Craglia M and Granell C (2014) Citizen Science and Smart Cities JRC Technical Report
26652 Publications Office Luxembourg
Craglia M and Shanley L (2015) Data democracy - increased supply of geospatial
information and expanded participatory processes in the production of data
International Journal of Digital Earth
Craglia M Ostermann F and Spinsanti L (2012) Digital Earth from vision to practice making
sense of citizen-generated content International Journal of Digital Earth 5(5) 398-416
Deville P Linard C Martin S et al (2014) Dynamic population mapping using mobile phone
data Proceedings National Academies of Science 111(45) 15888-15893
Freire S and Aubrecht C (2012) Integrating population dynamics into mapping human
exposure to seismic hazard Natural Hazards amp Earth Systems Sciences 12(11) 3533-
3543
20
Freire S Aubrecht C and Wegscheider S (2013) Advancing tsunami risk assessment by
improving spatio-temporal population exposure and evacuation modeling Natural
Hazards 681311-1324
Freire S Florczyk A and Ferri A (2015) Modeling Day- and Nighttime Population Exposure
at High Resolution Application to Volcanic Risk Assessment in Campi Flegrei In Palen
Buumlscher Comes and Hughes (eds) Proceedings of the ISCRAM 2015 Conference
Kristiansand May 24-27 2015
Gallego FJ and Peedell S (2001) Using Corine Land Cover to map population density In
European Environment Agency ldquoTowards agri-environmental indicators Integrating
statistical and administrative data with land cover informationrdquo Copenhagen pp 94ndash
105
Gallego FJ Batista F Rocha C and Mubareka S (2011) Disaggregating population density
of the European Union with CORINE Land Cover International Journal of Geographical
Information Science 25(12) 2051ndash2069
Goodchild MF (2007) Citizens as sensors the world of volunteered geography GeoJournal
69 (4) 211ndash221
Goodchild MF Guo H Annoni A et al (2012) Next Generation Digital Earth Proceedings of
the National Academies of Science 109(28) 11088ndash11094
Jiang S Alves A Rodrigues F et al (2015) Mining point-of-interest data from social
networks for urban land use classification and disaggregation Computers Environment
and Urban Systems In press
Lavalle C Baranzelli C Batista e Silva F et al (2011) A high resolution land usecover
modelling framework for Europe ICCSA 2011 Part I LNCS 6782 60ndash75
Lavalle C Batista e Silva F Baranzelli C et al (2016) Land Use and Scenario Modeling for
Integrated Sustainability Assessment in J Feranec et al (eds) European Landscape
Dynamics CORINE Land Cover Data CRC Press - Taylor amp Francis Group pp 237-262
Martin D Cockings S and Leung S (2010) Progress report 24-hour gridded population
models Proceedings of European Forum for Geostatistics 2010 Tallinn Estonia
Martin D Cockings S and Leung S (2015) Developing a Flexible Framework for
Spatiotemporal Population Modeling Annals of the Association of American
Geographers 105(4) 754ndash772
McPherson TN and Brown MJ (2004) Estimating daytime and nighttime population
distributions in US cities for emergency response activities In Symposium on Planning
Nowcasting and Forecasting in the Urban Zone 84th AMS Annual Meeting AMS Seattle
2004
Patel NN Stevens FR Huang Z et al (2016) Improving Large Area Population Mapping
Using Geotweet Densities Transactions in GIS
Pesaresi M and Ehrlich D (2009) A methodology to quantify built-up structures from optical
VHR imagery In Gamba P and Herold M (eds) Global Mapping of Human Settlement
Experiences Datasets and Prospects Boca Raton FL USA CRC Press ch 3 pp 27ndash
58
Pesaresi M Guo H Blaes X et al (2013) A Global Human Settlement Layer from optical
HRVHR RS data Concept and first results IEEE J Sel Topics Appl Earth Observ
Remote Sens 6(5) 2102-2131
21
Smith A Martin D and Cockings S (2016) Spatio-Temporal Population Modelling for
Enhanced Assessment of Urban Exposure to Flood Risk Applied Spatial Analysis and
Policy 9(2) 145-163
Smith A Newing A Quinn N et al (2015) Assessing the impact of seasonal population
fluctuation on regional flood risk management ISPRS International Journal of Geo-
Information 4(3) 1118-1141
Spyratos S Lutz M and Pantisano F (2014) Characteristics of Citizen-contributed
Geographic Information in Huerta Schade Granell (eds) Connecting a Digital Europe
through Location and Place Proceedings of the AGILE 2014 International Conference on
Geographic Information Science Castellon Spain
Steenbrugger J Tranos E and Nijkamp P (2014) Data from Mobile phone operators A tool
for smarter cities Telecommunications Policy 39(3-4) 335-346
Tatem AJ Huang Z Narib C et al (2014) Integrating rapid risk mapping and mobile phone
call 545 record data for strategic malaria elimination planning Malaria journal 13(52)
Wu SS Qiu X and Wang L (2005) Population estimation methods in GIS and remote
sensing A review GIScience and Remote Sensing 42(1) 80ndash96
22
List of abbreviations and definitions
CLC CORINE Land Cover
CLC-R CORINE Land Cover ndash Refined
EC European Commission
EFTA European Free Trade Association
EPRTR European Pollutant Release and Transfer Register
ESM European Settlement Map
GIS Geographical Information Systems
JRC Joint Research Centre
LULC Land useland cover
MMU Minimum Mapping Unit
MPOD Mobile Phone Operator Data
NACE Nomenclature Statistique des activiteacutes eacuteconomiques dans la Communauteacute
europeacuteenne
NSI National Statistical Institute
NUTS Nomenclature of Territorial Units for Statistics
OSM OpenStreetMap
VGI Volunteered Geographic Information
23
List of figures
Figure 1 Area of interest of ENACT 11
Figure 2 Schedule of main phases and tasks and units involved 12
Figure 3 Workflow and interlinkages between the projectrsquos main phases 13
Figure 4 Population density in 8102015 derived from mobile phone operator data
(Proximus) in Belgium at 1 km resolution 15
24
List of boxes
Box 1 Why mapping spatiotemporal population is a big challenge 6
Box 2 ENACTrsquos methodology in brief 8
25
List of tables
Table 1 Main expected specifications of output datasets 10
Table 2 State of the work 14
26
Annexes
Annex 1 Literature review
The table below provides an overview of previous efforts in spatiotemporal population
modelling using mostly conventional data sources (ie excluding studies using mobile
phone data social media and other lsquobig datarsquo sources)
Publication
(Authors
and year)
Main application
objective
Temporal
resolution
Spatial
resolution Study area
Proxies for
population
allocation
Method
McPherson
amp Brown
2004
Emergency
response
(manmade disaster
- release of
hazardous
material)
Night-time
Daytime 250 m USA
StreetMap USA
ESRIGDT 1998
NAVTEC Premium
Streets Data State
Business Directory
Night-time population
disaggregation of
census data based on
road network Daytime
population worker
population
disaggregated based
on State Business
Directory + residual
residential population
Ahola et al
2007
Risk assessment
and damage
analysis (fire and
rescue services)
14 time
periods
Vector
based
(building
level)
Helsinki
(centre)
Finland
Buildings Enterprise
and agency data
related to buildings
Person traffic data
Shopping centres
Kindergartens
Schools Central
traffic buildings
Disaggregation into
point locations using a
matrix of weights (per
population subgroup
and time period)
includes expert
knowledge based
weights
Bhaduri et
al 2007
Enhancing the
temporal resolution
of population
distribution data in
the US (general
purpose)
Night-time
Daytime
3 arc
seconds
(~90 m)
USA
Roads Railroads
Airports Large Area
Landmarks Water
Recreation Areas
Retail Centers
National Land Cover
Data Elevation
Data Education
Employment Jails
and prisons Aerial
imagery
Disaggregation into
cells based on
modelled cumulative
weights Methodology
includes extensive
manual checking and
refinement
Aubrecht et
al 2014
Social impact
evaluation in crisis
management
Quasi
continuous
(1 hour
step)
100 m Baden Austria
Land use Land
cover (national data
CORINE Urban
Atlas) Street
network Building
layer
DynaPop model ndash
three components of
population (Home
Commuting Work)
disaggregated from
census zone level to
grids using a set of
spatial and temporal
weights
Freire et al
2015
Assessment of
human exposure to
volcanic hazard
Night-time
Daytime 50 m Naples Italy
Urban Atlas
European settlement
map LandScan
Census tracts
Night-time population
disaggregation of
census data based on
land use Daytime
population derived
using commuting
ratios + estimated
27
residual residential
population
Martin et al
2015
Proposal and
implementation of
a flexible
framework for
spatiotemporal
population
modeling
Quasi
continuous
(15 min
step)
200 m Southampton
UK
Residential locations
Prisons Care
homes Workplaces
Schools
Universities
Hospitals Roads
SurfaceBuilder 247 ndash
variable kernel density
estimation several
ageactivity based
population subgroups
are redistributed
across space subject
to a series of weights
constraints and
temporal profiles
Smith et al
2015
Assessment of
human exposure to
flood risk in a
coastal touristic
region
Quasi
continuous
(1 h step)
100 m St Austell area
UK
Centroids
representing
residential locations
Centroids
representing places
of work study
leisure healthcare
and retail Roads
Smith et al
2016
Assessment of
urban exposure to
flood risk
Quasi
continuous
(2 h step)
200 m Southampton
UK
28
Annex 2 CLC-R nomenclature for lsquoArtificial surfacesrsquo
Brief description examples
111 Continuous urban
fabric
1111 Dense urban fabric
1121 Medium density urban fabric
1122 Low density urban fabric
1123 Very low density or isolated urban
fabric
1211 Industry Manufacturing facilities refineries large farm
buildings
1212 Energy production water supply
waste management
Power plants (non-renewable and renewable)
water supply waste management and treatment
plants
1213 Commerce and private services Wholesale retail and business areas office
buildings exposition sites research facilities
food and beverage services (eg bars and
restaurants)
1214 Public administration defense
and social facilities
Large facilities related to health care education
public administration security law and order
services military barracks
1215 Cultural facilities Arts and cultural facilities (eg museums
libraries theaters) monuments places of
worship
1221 Road network Main road network (consisting of motorways and
other main national links)
1222 Rail network Wide rail segments
1223 Train or ferry stationTrain or ferry stations terminals
1224 Other road and rail associated land
Eg rest areas service stations
123 Port areas See CLC nomenclature illustrated guide
1241 Airport terminals and associated
buildingsAirport terminals and associated buildings
1242 Airport runway and associated
landAirport runway and associated land
131 Mineral extraction
sites
132 Dump sites
133 Construction sites
141 Green urban areas
1421 Sport and leisure greenOther artificial green areas (typically surrounding
sport and leisure facilities) Includes golf courses
1422 Sport and leisure built-up Built-up areas related to sports and leisure
activities (eg stadiums sports halls zoos luna
parks)
1423 Touristic accomodation Hotels and similar accomodations campingtrailer
sites
Predominantly residential areas at different
degrees of horizontal building density High
density areas particularly in the centre of cities
may be characterized by mixed land uses (eg
residential commercial public services)
Level 1 Level 2 Level 3 Level 4
1 Artificial
surfaces
11 Urban fabric
124 Airports
12 Industrial
commercial and
transport units
121 Industrial or
commercial units
122 Road and rail
networks and
associated land
See CLC nomenclature illustrated guide
14 Artificial non-
agricultural
vegetaged areas
13 Mine dump and
construction sites
112
Presence in CLC-R v2 to be determined
Present in CLC-R v2
Present in CLC-R v1
No further level 4 expected
142 Sport and leisure
facilities
Discontinuous urban
fabric
29
Annex 3 Classification of economic activities (NACE rev 2)
A Agriculture forestry and fishing
B-E Industry
F Construction
G-J Wholesale and retail trade transport accommodation and food service activities information and communication
K-N Financial and insurance activities real estate activities professional scientific and technical activities administrative and support service ahellip
O-U Public administration and defence compulsory social security education human health and social work activities arts entertainment and recreationhellip
A Agriculture forestry and fishing
BDE Mining and quarrying electricity gas steam and air conditioning supply water supply sewarage waste management and remediation activities
C Manufacturing
F Construction
GHI Wholesale and retail trade transport and storage accomodation and food service activities
J Information and communication
K Financial and insurance activities
L Real estate
MN Professional scientific and technical activities administrative and support service activities
OPQ Public administration defence education human health and social work activities
RSTU Arts entertainment and recreation other service activities activities of household and extra-territorial organizations and bodies
A Agriculture forestry and fishing
B Mining and quarrying
C Manufacturing
D Electricity gas steam and air conditioning supply
E Water supply sewerage waste management and remediation activities
F Construction
G Wholesale and retail trade repair of motor vehicles and motorcycles
H Transportation and storage
I Accommodation and food service activities
J Information and communication
K Financial and insurance activities
L Real estate activities
M Professional scientific and technical activities
N Administrative and support service activities
O Public administration and defence compulsory social security
P Education
Q Human health and social work activities
R Arts entertainment and recreation
S Other service activities
T Activities of households as employers u0ndifferentiated goods- and services-producing activities of households for own use
U Activities of extraterritorial organisations and bodies
6 sectors
11 sectors
21 sectors
30
Annex 4 Short description of the CLC Refined 2012 (v10)
Prepared by Filipe Batista e Silva and Konstantin Rosina
Document version November 2016
Introduction
The CORINE Land Cover (CLC) is a European land useland cover (LULC) mapping project
initiated in the mid-1980rsquos The first inventory was released for the reference year 1990
and subsequent updates have been produced for the reference years 2000 2006 and
20126 The CLC is produced under the coordination of the European Environment Agency
(EEA) using a common LULC nomenclature mapping specifications and methodologies
meant to ensure a high degree of comparability across time and countries covered thus
making it a reference and widely used data source for LULC information in Europe
CLC however is characterized by a relatively coarse minimum mapping unit (MMU) of 25
hectares for all LULC categories which is a limiting factor for applications requiring a finer
detection of LULC patterns Another key limitation particularly for applications related to
urban areas population and economic activity concerns the low thematic resolution for
artificial LULC classes The European Commission Joint Research Centre (JRC) has been
engaged in developing and implementing a methodology to address the above-mentioned
limitations of CLC so to release an enhanced European LULC map labelled ldquoCLC refinedrdquo
(CLC-R) This work is conducted by JRCrsquos own initiative as an element of its work
programme
As its name indicates the CLC-R 2012 (v10) is an enriched version of CLC 2012 with a
significantly higher spatial resolution of 1 hectare for artificial LULC categories and at least
5 hectares for non-artificial ones The methodology is based on the integration of LULC-
relevant information from multiple CLC 2012-compatible geodata sources (particularly the
Copernicus ldquoHigh Resolution Layersrdquo amongst others) A forthcoming version of CLC-R
2012 (v20) expected by mid-2017 will address the improvement of the thematic detail
of CLC 2012 namely by breaking down CLCrsquos LULC category ldquo121 ndash Industrial or
commercial sitesrdquo into various sub-classes linked to specific socio-economic sectors The
work herein referred follows and expands upon previous experience of refining the CLC
20067
The remainder of the document covers the main objectives concerning the production of
CLC-R 2012 its main characteristics input data and methodological steps A more
thorough description of the methodology is under preparation and will be published as a
JRC Technical Report
Objectives
The main objective set for CLC-R 2012 (v10) was the increase of CLCrsquos spatial resolution
(ie reduction of the minimum mapping unit) while preserving the thematic detail and
definitions of CLC Another objective was to attain a more detailed and consistent
6 For more info on CLC family of products httplandcopernicuseupan-europeancorine-land-cover 7 Batista e Silva F Lavalle C Koomen E (2013) A procedure to obtain a refined European land usecover map
Journal of Land Use Science 8(3) 255-283
31
classification of the 11X - Urban fabric classes using an unambiguous quantitative
approach to identify urban fabric of different densities
The immediate usage of the CLC-R 2012 within the JRC is twofold
- To be used as base map in LUISArsquos territorial modelling platform8
- To be used as input to the ENACT JRC exploratory project aiming at the
enhancement of activity and population mapping
The CLC 2012 refined (v10) can in addition be used for a wide range of other purposes
and applications within the JRC and elsewhere
Main characteristics of CLC-R 2012
Spatial resolution Minimum mapping unit of ~5 hectares (1 ha for artificial surfaces and
for all LULC classes in areas covered by the Urban Atlas dataset ndash European Functional
Urban Areas (FUAs) above 50000 inhabitants) Width of linear features of ~20 m Cell size
= 100 x 100 metres
Thematic resolution Same as in CLC 2012 with the following additional LULC classes 410
- Inland wetlands (a union of 411 - Inland marshes and 412 - Peatbogs) 113 - Urban
fabric low density (10-30 built-up) 114 - Urban fabric very low density and isolated
(lt10 built-up) 143 - Leisure and touristic built-up
Geographical coverage EU28 + EFTA + Western Balkans + Turkey including Islands
Azores Canary Islands Madeira Ceuta and Melilla and excluding French overseas
territories
Reference year 2012
File format Unsigned 8-bit raster file (available as GeoTIFF and File GeoDatabase Raster
Dataset)
Input Data
The CLC-R 2012 (v10) is a composite map whereby information from multiple geodata
sources has been integrated with the original CLC 2012 in a sequential order following
certain rules and criteria (see methodology section below) Input data sources have been
harvested from and selected based upon the compliance with following criteria
Compatibility with CLCrsquos LULC nomenclature (LULC class definitions)
Reference year 2012 +- 2
Higher spatial resolution than CLC 2012
Pan-European geographical coverage
Preferably free open and documented data
The input data sources are listed below
CLC products CLC 2012 v 185 CLC Changes 2006-2012 and CLC Changes 2000-
2006
8 For more info on LUISA territorial modelling httpseceuropaeujrcenluisa
32
Copernicus high resolution (HR) layers 2012 HR layer Forest type + Tree cover
density HR layer Permanent water bodies HR layer Wetlands
TomTom Multinet 2014 Land Use layer + Built-up layer
JRCrsquos European Settlement Map (ESM) (10m version aggregated to 100 m
reference grid)
Urban Atlas 2012 All available FUAs by October 2016 (580)
OpenStretMap (OSM) and TomTom Multinet 2014 as source of road network data
Methodology
The methodology consisted of a sequential integration of LULC information from multiple
geodata sources into the original CLC 2012 map At each step of the sequence specific
input data layers were used to recode the grid cells with which they overlaid spatially
following pre-established decision rules Each step typically deals with the integration of
one particular data input from the above mentioned sources
The order of the sequence is determined by the degree of spatial detail and accuracy of
the data source at hand (the more detailed and accurate the later in the sequence) or by
other logical considerations (eg linear features are added later in the process due to less
strict MMU) Each step is automatized as a separate GIS tool The table below describes
the main steps of the workflow
Step Input data
source Description of procedure
Affected
LULC classes
1 CLC change maps Selected CLC change patches that were not included into CLC2012 map due to generalization rules are
added
All
2 Copernicus High resolution layers
A threshold of 50 is applied to the continuous pixel values (ie the respective class must cover the majority of pixel to be considered) A MMU of 5 contiguous pixels is applied
31X 41 51X
3
TomTom Multinet
2014 ndash Land Use
layer
Land use information from TomTom are added A look-up table is used to establish the relationship between the TomTom and CLC nomenclatures Vector polygons are rasterized using Maximum
Combined Area criterion Applied MMU = 1 pixel ie individual pixels are included
121 122
123 124
141 142
4 European Settlement Map
First a 100 m raster coincident with EEA reference grid is derived from the original 10 m version Pixels overlapping non-residential artificial classes are excluded as are the pixels under minimum building density threshold (empirically derived value of 5)
Applied MMU = 1 pixel ie individual pixels are included
11X
5 Urban Atlas 2012 Vector polygons are rasterized using Maximum Combined Area criterion a decision matrix (original CLC class vs urban atlas class) is used to establish
All
33
the final classification of overlapping pixels Applied
MMU = 1 pixel ie individual pixels are included
6 European Settlement Map
The general 11X class lsquourban fabricrsquo is differentiated into 4 classes according to the underlying building density (based on ESM data) ndash 111 - dense 112 -
medium density 113 - low density 114 - very low density or scattered built-up
11X
7
HR layer Permanent water bodies + OSM and TomTom Multinet 2014 ndash Road networks
Linear features such as rivers and mains roads are included The inclusion of linear features obeys to less restrictive thresholds of within-pixel cover so to preserve as much as possible the spatial contiguity
of these features (in view of their distinct function and importance in structuring and fragmenting the territory) However within artificial areas linear
features are included only when the percentage covered is larger than that of building cover
122 51X
8 European Settlement Map
Built-up areas in the class 142 - Sport and leisure
facilities are extracted as a separate class 143 - Leisure and touristic built-up
142 143
9 TomTom Multinet 2014 ndash Built-up layer
Areas pertaining to Local Administrative Units (LAU2) for which the amount of built-up is significantly lower than expected (given an empirical
relationship between size of the population and urban fabric surface) are refined by adding built-up areas from the TomTom built-up layer Added built-up areas are coded as 114 - very low density or isolated built-up
114
34
Nomenclature
Value Label
111 Urban fabric dense (gt 50 built-up)
112 Urban fabric medium density (30-50 built-up)
113 Urban fabric low density (10-30 built-up)
114 Urban fabric very low density and isolated (lt10 built-up)
121 Industrial or commercial units
122 Road and rail networks and associated land
123 Port areas
124 Airports
131 Mineral extraction sites
132 Dump sites
133 Construction sites
141 Green urban areas
142 Sport and leisure facilities
143 Leisure and touristic built-up
211 Non-irrigated arable land
212 Permanently irrigated land
213 Rice fields
221 Vineyards
222 Fruit trees and berry plantations
223 Olive groves
231 Pastures
241 Annual crops associated with permanent crops
242 Complex cultivation patterns
243 Land principally occupied by agriculture with significant areas of natural vegetation
244 Agro-forestry areas
311 Broad-leaved forest
312 Coniferous forest
313 Mixed forest
321 Natural grasslands
322 Moors and heathland
323 Sclerophyllous vegetation
324 Transitional woodland-shrub
331 Beaches dunes sands
332 Bare rocks
333 Sparsely vegetated areas
334 Burnt areas
335 Glaciers and perpetual snow
410 Inland wetlands
421 Salt marshes
422 Salines
423 Intertidal flats
511 Water courses
512 Water bodies
521 Coastal lagoons
522 Estuaries
523 Sea and ocean
New or redefined classes
35
For illustration purposes the figures below show the differences between the original CLC
2012 (top) and CLC-R 2012 (v10) (bottom) for the area surrounding the city of Turin
Italy
36
Annex 5 List of land use and activity data sources
Data source name Type Reference
date
Description
content
Use in ENACT
Bookingcom Web-service 2016 Location of hotels To reveal locations of
probable tourist
presence (night-time)
Copernicus High
resolution layers
Open public 2012 Spatial raster layers
describing forests
wetlands and water
bodies
Spatial refinement of
CLC
CORINE Land
Cover
Open public 2012 Land usecover map
with 44 classes
Base map for activity
mapping
European
Pollutant Release
and Transfer
Register (EPRTR)
Open public Location of polluting
industries and waste
treatment plants
Thematic refinement of
CLC
European
Settlement Map
Open public 2012 Density of built-up Spatial refinement of
CLC
EuroRegionalMap Proprietary Location of activities
(points of interest)
Thematic refinement of
CLC
National land use
maps
Public or
proprietary
2007-2012 Detailed land use maps
for the following
countriesregions
Portugal Spain
Wallonia Lombardia
The Netherlands
Provide training and
test subsets for the
thematic refinement of
CLC
OpenStreetMap Open VGI 2016 Location of activities
(points of interest)
Thematic refinement of
CLC
PLATTS Proprietary Location of power
plants
Thematic refinement of
CLC
TomTom Proprietary 2013 Location of activities
(land use polygons and
points of interest)
Road and rail
networks
Spatial and thematic
refinement of CLC
TripAdvisorcom Web-service 2016 Location of hotels
restaurants and
tourist attractions
To reveal locations of
probable tourist
presence (day- and
night-time)
Urban Atlas Open public 2012 Land use maps for
European Functional
Urban Areas
Spatial refinement of
CLC
Europe Direct is a service to help you find answers
to your questions about the European Union
Freephone number ()
00 800 6 7 8 9 10 11 () The information given is free as are most calls (though some operators phone boxes or hotels may
charge you)
More information on the European Union is available on the internet (httpeuropaeu)
HOW TO OBTAIN EU PUBLICATIONS
Free publications
bull one copy
via EU Bookshop (httpbookshopeuropaeu)
bull more than one copy or postersmaps
from the European Unionrsquos representations (httpeceuropaeurepresent_enhtm) from the delegations in non-EU countries (httpeeaseuropaeudelegationsindex_enhtm)
by contacting the Europe Direct service (httpeuropaeueuropedirectindex_enhtm) or calling 00 800 6 7 8 9 10 11 (freephone number from anywhere in the EU) () () The information given is free as are most calls (though some operators phone boxes or hotels may charge you)
Priced publications
bull via EU Bookshop (httpbookshopeuropaeu)
LF-N
A-2
8335-E
N-N
doi102791056071
ISBN 978-92-79-64588-4

5
by official statistics on residential population ndash it is much more challenging to infer daytime
population distribution
Addressing the needs of emergency response compatible day- and night-time population
grids have been produced in the mid-2000s for the USA (McPherson et al 2004 Bhaduri
et al 2007) In Europe such datasets have been mostly lacking with only a few countries
systematically collecting base data and modelling population distribution on the daily cycle
(eg Ahola et al 2007) More recent research (Martin et al 2015 Martin et al 2010
Aubrecht et al 2014 Smith et al 2016) has been increasing the resolution of the temporal
component andor including a seasonal dimension for limited regional areas by mining
conventional data Other authors have explored the contribution of non-conventional data
such as mobile phone activity records (Deville et al 2014 Tatem et al 2014) or
lsquogeotweetsrsquo (Patel el al 2016) for population mapping in selected countries a task which
is not without shortcomings and challenges A relatively straightforward approach was
proposed to estimate day- and night-time population distribution at high resolution for the
cities in Urban Atlas (Freire et al 2015) yet its quality depends largely on that of ancillary
datasets and availability of local parameters and its accuracy is still uncertain
The challenges posed by spatiotemporal mapping and modelling of population distribution
cannot be addressed effectively by conventional data sources alone (eg official statistics
and reference land use datasets) Significant advances in this field can only be attained if
data from conventional data sources are combined with data from emerging non-
conventional data sources in a coherent methodological framework Non-conventional data
sources may include volunteered geographical information (Goodchild 2007) web-based
social networks (Aubrecht et al 2016) thematic proprietary databases mobile phone
operator data or even navigation systems
Data mining from such (big) data sources is becoming a common task in many geospatial
applications Craglia and Granell (2014) reviewed a range of projects leveraging citizen
science or crowd sourcing in the area of environmental monitoring and smart cities
application There are several projects that demonstrate the benefits of combining official
and non-official sources These include for example the GEO-Wiki project focusing on global
land cover validated by local people in a game-inspired apps and its urban application
Cities Geo-wiki2 whose aim is to map the physical geography of all major cities in the world
to link to weather and climate models Another approach to augment local land use and
building use databases with crowd-sourced information is documented by Spyratos et al
(2014) who used data from lsquoFoursquarersquo to monitor the dynamic changes in building use
in commercial areas Other studies have also shown that thematic geospatial layers can be
obtained from disparate data sources and integrated with existing land use maps for
improved detail (Batista e Silva et al 2013d Jiang et al 2015) One of the most promising
data sources to estimate population density comes from mobile network operators Several
studies have documented the importance and usefulness of this data source (see for
example Steenbrugger et al 2014 and Deville et al 2014) but one key problem remains
data access which is normally negotiated with the data providers by individual researchers
for specific projects
Until a few years ago population grids were almost unknown to most researchers even in
domains with a strong spatial dimension But population grids gained momentum very
rapidly and have become mainstream input for many analyses Eurostat which was
initially reluctant to publish population figures using non-conventional zoning systems
6
kicked-off the GEOSTAT project in 20102 to promote the production dissemination and use
of lsquogriddedrsquo population among NSIs But despite all the referred advances Europe is still
lacking a wall-to-wall spatiotemporal model of population distribution Given its experience
in population mapping and big data mining as well as its fast track connection to Eurostat
and NSIs the JRC through the ENACT project is in good position to expand upon the state
of the art and fill the existing gaps in population mapping
Box 1 below summarizes the main challenges associated with spatiotemporal population
mapping
Box 1 Why mapping spatiotemporal population is a big challenge
Fast population dynamics People commute travel and migrate faster than ever
before
Multifaceted concept While during the night most of us are lsquoresident
populationrsquo during the day our (multiple) occupations
relate to the (multiple) locations of probable presence
Data availability issues No official statistical sources exist Daytime population
needs to be inferred from multiple indirect and perhaps
new data sources
State-of-the-art Few case studies often incomparable due to the use
different methodologies and input data of different
nature3
2 GEOSTAT initiative httpeceuropaeueurostatwebgiscogisco-activitiesintegrating-statistics-
geospatial-informationgeostat-initiative 3 See Annex 1 for an overview of previous efforts in spatiotemporal population modelling using conventional
data sources
7
3 Project description
31 ENACT in a nutshell
Population is a crucial variable for the social sciences the geosciences and for policy
support in many domains Yet our knowledge of its spatial distribution is still nowadays
very incomplete Population is a temporally dynamic variable with major shifts in its
distribution occurring in daily and seasonal cycles resulting in rapidly changing densities
Spatially detailed representations of residential population exist at EU level since several
years While these maps can be used as proxy for night-time population distribution the
distribution of population for other time frames is practically unknown at almost every
spatial scale Consequently all applied sciences and policy support that require spatially
detailed information on population distribution are based on only a fractional and static
representation of reality Overcoming this large knowledge gap is the main goal of the
ENACT exploratory research project
Several methodological challenges and data limitations have hindered progress in this field
in the past This project aims at addressing the challenges that are required to obtain (1)
the amount of people per type of activity per time-frame and per region and (2) their
likely location at a high spatial resolution The first element requires regional data on
residents employees per sector of activity students and tourists which can be derived
mostly from official sources The second element requires spatial data on the location of
activities (eg manufacturing retail health education leisuretourism) which will be
sought from various conventional (eg remote sensing imagery land use maps) and
unconventional data sources (eg volunteered geographical information large proprietary
geo-databases and web-services) The final challenge is to validate the produced multi-
temporal population distribution grid maps ENACTrsquos output will be compared against
reference data from independent sources such as multi-temporal population grids derived
from mobile phone operator data or other sources (eg produced by other researchers)
and micro-data from National Statistical Institutes (NSIs) on location of employment
Ultimately this project aims at developing and implementing a consistent and validated
methodology to produce multi-temporal (ie including daily and seasonal variations)
population distribution grids for Europe Such datasets will expand the knowledge base of
spatiotemporal population patterns across the continent Moreover multi-temporal
population grids can be a useful and straightforward (ie easy to integrate) input to several
models developed and run at the JRC particularly transport land use economic and
environmental models and exposure to hazards with potential positive impact on the
reliability of assessments
In addition to fostering a range of applications across Europe the forthcoming public
dissemination of ENACTrsquos final outputs may increase awareness among national authorities
on the importance of collecting good quality data on population and location of activities
8
Box 2 ENACTrsquos methodology in brief
The following questions define the main methodological aspects that need to be
addressed by ENACT in order to produce multi-temporal population grids for Europe
Question 1a How many people are inside and outside their residences during
the day in each region
Action To estimate total population per type of main activity per NUTS3 region
How By assembling official data from Eurostat on the no of workers per sector of
economic activity no students per main educational levels no of tourists and
number of inactive population (and thus likely to be at home during the day) per
region
Question 1b What is the seasonal variation of total present population in each
region
Action Seasonal variation of total present population in a region is mostly due to
touristic flows Therefore inbound and outbound tourist flows of each region per
season (or per month) must be taken into account by ENACT
How By first downscaling total yearly nights-spent per NUTS2 to NUTS3 using the
no of beds per NUTS3 Then breaking down the NUTS3 yearly nights-spent per
month using as proxy monthly flight traffic information from Eurostat Monthly
nights-spent per region can then be easily converted to average no of tourists
present in a given month by dividing total nights-spent in a month by the total no of
days comprised in that month Finally the number of tourists present in given a
region in a given month are removed from their likely regions of origin
Question 2 Where do people spend their time during the day and night
Action There is no one-stop shop for such multi-sector highly detailed locations of
activities ENACT needs to resort to various sources proprietary and open-source
conventional and non-conventional Specific population sub-groups then need to be
allocated to locations of probable presence
How By extracting relevant activity-location data from multiple sources namely
conventional (eg LULC maps remote sensing) volunteered geographic information
(eg OpenStreetMap) web-based services and proprietary sources (eg TomTom
PLATTS GISCO-EuroGeographics etc) At night-time residents will be located to
residential areas and tourists to touristic accommodation facilities At daytime the
various population sub-groups (eg students workers per sector of activity tourists)
will be allocated to the relevant activity types based on a probability matrix
Question 3 How accurate are ENACTrsquos multi-temporal population grid maps
Action To compare ENACTrsquos outputs with other reference data
How By resorting in particular to emerging population density grid maps derived
from mobile phone operator data but also to existing employment grids produced by
some NSIs Comparing ENACTrsquos grids with grids from other researchers is an
additional option
9
32 Specific objectives of ENACT
The ultimate objectivesoutputs of ENACT are as follows
mdash In terms of data production
To produce a set of multi-temporal population grid maps that take into account the
main seasonal and daily variations of population consistent with the most recent
census data (2011) and covering the largest possible number of EU28 countries
ENACT aims at least 6 population grid maps covering 3 main seasons of the year
(summer winter springautumn) for both night- and daytime
mdash In terms of dissemination of methods and results
To write a scientific paper summarizing the methodology and results and submit it
to a high-impact geographical science journal
To disseminate the final multi-temporal population grids following the INSPIRE
directive standards using JRC web channels
To fulfil the above objectives the following intermediate objectivesoutputs of ENACT are
expected
To review the most recent and significant scientific literature on daytime (or multi-
temporal) population mapping
To build a database of population stocks at regional level (NUTS23) with no of
residents employed population per main sector of activity nr of students nr of
tourists and inactive population The database must have a temporal dimension
(seasonal or monthly)
To build a geodatabase with land use and activity information at the highest possible
thematic and spatial resolution by assembling data from both conventional and non-
conventional sources
To produce an enhanced version of the CORINE Land Cover Map 2012 with
improved spatial resolution (minimum mapping unit of 1 hectare instead of 25) and
thematic resolution (further breakdown for specific CLCrsquos LULC classes)
To compare ENACTrsquos multi-temporal population grids with other independent
sources namely multi-temporal population grids derived from mobile phone
operator data or other sources (eg produced by other researchers) and micro-
data from National Statistical Institutes (NSIs) on location of employment4
33 Main specifications of output datasets
As per the above objectives two sets of data will be produced (a) geodatabase with land
use and activity information and (b) multi-temporal population grid maps The former item
comprises individual datasets with location of specific activities plus an overarching land-
use map herein referred to as CLC-R 2012 CLC-R 2012 is a refined version of CLC 2012
with increased spatial and thematic resolution and built by integrating geodata from
multiple sources (see Annex 4) Because CLC-R contains the location of many types of
activities it will be the backbone for the subsequent production of the multi-temporal
population grid maps
4 The comparison exercise however may only be feasible for selected regions or countries in Europe
depending on the amount of reference data the project is able to collect and handle
10
Table 1 summarizes the main specifications (spatial coverage spatial thematic and
temporal resolutions reference dates) of the two sets of data Figure 1 shows the area of
interest of ENACT
The multi-temporal population grid maps have a more limited spatial coverage than the
CLC-R because they require as input statistical data which is not fully available from
Eurostat for countries outside EU28 The spatial resolution is also somewhat more limited
for the final multi-temporal population grid maps due to the inability to validate these maps
at a resolution below 1 Km The temporal resolution is yet to be defined but ENACT aims
at least 6 maps (summer winter springautumn x day- and night-time) The possibility to
have higher temporal resolution (eg 24 maps each month x day- and night-time) is
currently under consideration depending on whether we will be able to break down yearly
tourist stocks per month
Table 1 Main expected specifications of output datasets
Land use and activity data
(CLC-R)
Multi-temporal population grid
maps
Spatial coverage EU28 + EFTA + Balkan countries
+ Turkey (see figure 1)
EU28 (see figure 1)
Spatial resolution 100 m 100 m (production) 1 Km
(dissemination)
Temporal resolution Single year Monthly or seasonal x day- and
night-time
Thematic resolution ~ 10 separate land use
categories relevant for
population mapping
(see Annex 2)
Population per various sub-groups
(residents employees per sector
of activity students tourists
inactive)
Reference date 2012 2011
11
Figure 1 Area of interest of ENACT Legend Green area of interest for the multi-temporal
population grids (EU28) Yellow area of interest for land use and activity data Grey outside area
of interest
34 Workflow and schedule
The main phases and tasks of the project are mapped in the Gantt chart of Figure 2 with
an approximate schedule of the work The herein project planning is a revision of the
original schedule included in the project proposal It has a slightly revised arrangement of
the main phases and divides each of the 6 mains phases into sub-activities or tasks The
green bars correspond to the originally scheduled duration of each task The grey bars
correspond to the revised duration For many tasks the duration was prolonged for
additional months as the project ran significantly understaffed for most of 2016 The
flowchart in Figure 3 shows how the main phases of the project (in square brackets) are
interconnected
The first crucial phase of the project (lsquoPreparationrsquo) paves the way for a structured and
solid kick-off It includes a literature review of the most recent and relevant work in the
field as well as an inventory of the data needs and potential data sources In addition
linkages between the nomenclatures used in the various data sources will be established
using the NACE rev2 as pivotal nomenclature
The second phase (lsquoRegional flows and stocks of peoplersquo) includes the collection of
statistical data primarily from official sources (Eurostat and NSIs) The statistical data will
be worked in order to produce seasonal or monthly regional balances of various population
sub-groups namely residents workers per 6 sectors of economic activity students
tourist and inactive population
12
The third phase (lsquoActivity mappingrsquo) goes in parallel with the second phase and consists
of collecting land use and activity location data from all available data sources These data
will be combined to improve both the spatial and thematic resolutions of CLC 2012 and
thus generate the lsquoCLC-Rrsquo The CLC-R will be the base map for the allocation of population
sub-groups in different land use and activity categories for different time-frames (seasons
or months and night-time and daytime) The spatial allocation or disaggregation of
population will be carried in the fourth phase of the project (lsquoModelling spatiotemporal
population distributionrsquo)
In the fifth phase of the project (lsquoValidationrsquo) a comparison will be made between ENACTrsquos
main outputs (ie multi-temporal population grid maps) and reference data from
independent sources namely multi-temporal population grids derived from mobile phone
operator data or other sources (eg produced by other researchers) and micro-data from
National Statistical Institutes (NSIs) on location of employment With the comparison
exercise we expect to assess the validity of ENACTrsquos outputs Although the ENACTrsquos
outputs may not be fully comparable with the independent sources used in the validation
(eg due to differences in total estimated population within a given spatial unit of analysis)
appropriate indicators will be established to check the degree of agreement in terms of
relative difference of population between various time frames (eg night-time vs daytime
or seasonmonth lsquoArsquo vs seasonmonth lsquoBrsquo) The comparison exercise may only be feasible
for selected regions or countries in Europe depending on the amount of reference data the
project is able to collect and handle The validation is indispensable for the lsquoReporting and
disseminationrsquo of ENACTrsquos outputs (phase 6 of the project)
Figure 2 Schedule of main phases and tasks and units involved
1 2 3 4 5 6 7 8 9 10 11 12 1 2 3 4 5 6 7 8 9 10 11 12
11 Literature review B3 B6 E1
12 Assessment of data needs and
sourcesB3 B6 E1
13 Harmonization of data
nomenclaturesB3
21 Collect population employment
tourism and students statisticsB3
22 Seasonal or monthly regional
population balancesE1 B3
31 Collect geo-referenced land use
and activity dataB3
32 Spatial refinement of CLC2012 B3
33 Thematic enhacement of CLC2012 B3
E1 B3
51 Collect reference data (NSIs and
mobile phone operator data)B6
52 Carry validation exercise B6 E1 B3
61 Interim report B3 B6 E1
62 ER workshop presentation B3 B6 E1
64 Preparation of peer-reviewed paper B3 E1 B6
65 Public dissemination of GIS layers B3 E1 B6
4 Modelling spatiotemporal population distribution
Time bar main tasks and units involved
2016 2017
2 Regional flows
and stocks of
people
3 Activity
mapping
Tasks
5 Validation
6 Reporting and
dissemination
Phase
1 Preparation
13
Figure 3 Workflow and interlinkages between the projectrsquos main phases
14
4 State of the work
So far we have mostly focused on phases 1 2 and 3 of the project although some
preparatory tasks for the subsequent phases have also initiated Below we list and describe
the main tasks completed on-going and forthcoming
Table 2 State of the work
Phasetask Description Actors Depen-
dencies Status
1 Preparation
11 Literature
review
lsquoFirst roundrsquo of literature review of multi-temporal population
mapping to steer the kick-off of the project lsquoSecond roundrsquo
complementary literature review to done by the time of the writing
of the final paper
B3 B6
E1 None
lsquoFirst
roundrsquo of
review
complete
See
summary
in chapter
2 of the
herein
report +
annex 1
12 Assessment of
data needs and
sources
List of potentially useful sources of geographical and statistical data
to be used in different stages of the project
B3 B6
E1 11
Complete
See annex
5
13 Harmonization
of data
nomenclatures
Check data nomenclatures and classifications from the different
sources of data useful to the project Make the necessary
correspondences between classifications
B3 12 Complete
2 Regional flows and stocks of people
21 Collect
population
employment
tourism and
students statistics
Collection of raw statistical data from Eurostat on number of
residents employees per sector of economic activity students per
main educational levels number of nights-spent by tourists per
NUTS23 and flight data per airport unemployment rates
B3 12
On-going
(close to
completio
n)
22 Seasonal or
monthly regions
population
balances
Production of seasonal or monthly tables of population balances per
NUTS3 and per the following population categories resident
population employees (per sector of activity) students (per main
educational levels) tourists and non-active population taking into
account outbound tourism and to avoid double counting of
population
E1 B3 21
On-going
(just
initiated)
3 Activity mapping
31 Collect geo-
referenced land
use and activity
data
Collection and preparation of available data on land use and
activities locations from multiple sources (openproprietary
conventionalnon-conventional)
B3 12 Complete
32 Spatial
refinement of CLC
2012
Improvement of the spatial resolution of CLC 2012 Reduction of
minimum mapping unit (MMU) from 25 ha to 1 ha for all lsquoartificial
surfacesrsquo group of LULC classes See Annex 4 for a more complete
description
B3 31 Complete
33 Thematic
refinement of CLC
2012
Improvement of the thematic resolution of CLC 2012 Add additional
breakdown (lsquolevel 4rsquo) to some lsquoartificial surfacesrsquo LULC classes B3 31 32 On-going
15
4 Modelling spatiotemporal population distribution
Modelling
spatiotemporal
population
distribution
Downscaling of multi-temporal population balances per NUTS3 (task
22) to grid cell level based on the location of land uses and
activities
E1 B3 2 3
On-going
First
prototype
scripts
under
constructi
on
5 Validation
51 Collect
reference data
(NSIs and mobile
phone operator
data)
Establish methods to estimate population density distribution from
network-based mobile phone data1 Obtain data on population
densities derived from mobile phone operator data (MPOD) The
sample should ideally include more than one European
regioncountry and have both daily and seasonal resolution Obtain
employment grids for a sample of European regionscountries
B6 12
On-going
Data for
Belgium
collected
(see figure
4)
52 Carry
validation
exercise
Define a methodology for the validation exercise Preparation of
MPOD for the comparison with ENACTrsquos multi-temporal population
grids Construct indicators of agreement between the reference grids
and ENACTrsquos multi-temporal population grids
B6 E1
B3 41 51
To be
initiated
6 Reporting and dissemination
61 Interim report Interim report describing the projectrsquos objectives and progress of the
work
B3 B6
E1 na Complete
62 Exploratory
research
workshop
presentation
Oral presentation of the projectrsquos progress to the JRC Scientific
Committee
B3 B6
E1 na
To be
scheduled
63 Preparation of
peer-reviewed
paper
Scientific paper describing the newly produced datasets B3 B6
E1 4 5
To be
initiated
64 Public
dissemination of
GIS layers
Public dissemination of GIS layers possibly using JRC web channels B3 B6
E1 4 5
To be
initiated
Notes 1 Published journal article Estimating population density distribution from network-based mobile phone datardquo PUBSY JRC96568
Figure 4 Population density in 8102015 derived from mobile phone operator data (Proximus) in Belgium at 1 km resolution
16
41 Participation in events
The ENACT project has already been presented in the following occasionseventsworking
groups
10-12 November 2015 European Forum for Geography and Statistics (EFGS) 2015
Conference Vienna Austria
Presentation by Filipe Batista e Silva titled rdquoThe ENACT project Towards
spatiotemporal population mappingrdquo
12 February 2016 1st JRC-Eurostat workshop on Big Data Ispra Italy
Presentation by Filipe Batista e Silva titled rdquoThe ENACT project Towards
spatiotemporal population mappingrdquo
1-2 September 2016 JRC Big data for science and policy workshop Ispra Italy
Presentation by Filipe Batista e Silva titled rdquoBig data for rsquoEnhancing
activity and population mappingrsquordquo
22 November 2016 ERSAREGIOUCL joint international workshop rdquoHow can
regional policy benefit from Big Datardquo Louvain-la-Neuve Belgium
Presentation by Filipe Batista e Silva titled rdquoSpatiotemporal population
mapping in Europerdquo
Participation in the work of the European Statistical System Big data Task Force
chaired by ESTAT which is the forum in which collaboration with statistical agencies
and some mobile phone operators takes place that can assist in the validation of
the ENACT outputs (Massimo Craglia)
Participation in collaborative work between ESTAT the Belgian Statistical agency
and Proximus mobile phone operator5 (Massimo Craglia)
5 See description here
httpeconomiefgovbefrbinariesCarrefour_economie_2016_10_tcm326-280315pdf pages 38-53
17
5 Conclusions main risks and challenges ahead
The work is progressing well given the stated limitations (project running considerably
understaffed for most of 2016) Nonetheless significant progress has been made (see
summary in chapter 4) As main milestones achieved we highlight the conclusion of the
spatial refinement of CLC-R 2012 and the collection of most data inputs necessary for the
detailed mapping of activities and construction of regional population balances
At project proposal stage we had identified the following main risks
1 The collection of land-use relevant VGI has not been assessed at EU scale addressing
redundancy between data sources and assessing data quality (ie completeness
consistency updatehellip) at EU level are key challenges
2 The accuracy levels of the resulting population grids will determine the appropriate
spatial resolution of the final layers for public dissemination A low spatial resolution
(eg cell size gt 1 Km) can limit the range of potential applications
3 The delivery schedule and sample size of the mobile phone data are not fully known at
this stage
4 Potential delays in the production of the CLC 2012 for some countries could lead to
gaps in the spatial coverage of the CLC-R 2012
Risks 2 and 3 remain open at the current stage of the project Risk 1 will be address by
applying Machine Learning methods to classify CLC-R polygons into a more detailed a set
of discrete LULC classes Risk 4 is now obsolete CLC 2012 has been completed and is
available at the Copernicus Land Monitoring Service website The spatial refinement of CLC
2012 has been already accomplished for the entire extent of the CLC mapped area The
thematic refinement of CLC is on-going and progressing as expected so far
However as the work progressed we identified additional challenges
mdash Related to the construction of NUTS3 population balance tables
Tourism and student data only available at NUTS2 for some countries ndash downscaling
to NUTS3 possibly using proxies
Breakdown of yearly NUTS3 tourists per seasonmonth necessary Method based
on using monthly flight traffic as proxy still under testing phase
Workers in one NUTS3 region can be resident in another NUTS3 region (commuting
between NUTS3) Commuting data between municipalities or even NUTS3 seems to
be completely inexistent at EU-level Pragmatic assumptions might be necessary
Statistics for activeinactive population and unemployment available only at NUTS2
Downscaling to NUTS3 might be necessary using proxies available at NUTS3 (eg
total population and population per age-groups)
Inbound tourists in one NUTS3 have other NUTS3 as regions of origin which need
to be identified Method still to be defined
Construction of NUTS3 consistent population balance tables that avoid double
counting of total population
mdash Concerning the disaggregation of population stocks from regional to pixel level
The relationship between certain population sub-groups (eg employees per sector
of economic activity or tourists) and the land uses is of rsquoone-to-manyrsquo In other
words a population category can occur in more than one land use type This will
inevitably call for additional parametrization of the downscaling algorithms possibly
18
using probability matrices defining the probability of land use class holding
population from the various sub-groups
mdash Related to the use of lsquoBig Datarsquo sources
Extractionminingscrapping of data from the web is sometimes challenging (a
dedicated procedure needs to be constructed for each website)
The big data sources screened for the ENACT project are mostly proprietary with
strict terms and conditions of use
Dialogue with individual data providers would be required to gain legal access
Quality of data unknown difficult to measure accuracy and completeness of
bottom-up generated data
Methodological challenges making sense out of the multiple big data sources for
our specific needs
19
References
Ahola T Virrantaus K Krisp JM and Hunter GJ (2007) A spatio‐temporal population model
to support risk assessment and damage analysis for decision‐making International
Journal of Geographical Information Science 21(8) 935-953
Aubrecht C Oumlzceylan Aubrecht D Ungar JK et al (2016) VGDI - Advancing the Concept
Volunteered Geo-Dynamic Information and its Benefits for Population Dynamics
Modeling Transactions in GIS
Aubrecht C Steinnocher K and Huber H (2014) DynaPop - Population distribution dynamics
as basis for social impact evaluation in crisis management In S R Hiltz et al (eds)
Proceedings of ISCRAM 2014 - 11th Int Conf on Information Systems for Crisis
Response and Management University Park PA USA
Batista e Silva F and Poelman H (2016) Mapping population density in Functional Urban
Areas - A method to downscale population statistics to Urban Atlas polygons JRC
Technical Report no EUR 28194 EN doi10279106831
Batista e Silva F Gallego J Lavalle C (2013a) A high-resolution population grid map for
Europe Journal of Maps 9(1) 16-28
Batista e Silva F Koomen E Diogo V et al (2014) Estimating demand for industrial and
commercial land use given economic forecasts PLOS ONE 9 e91991
Batista e Silva F Lavalle C Jacobs-Crisioni C et al (2013c) Direct and indirect land use
impacts of the EU cohesion policy Assessment with the Land Use Modelling Platform
JRC scientific and policy report 26460 Luxembourg Publications office of the European
Union
Batista e Silva F Lavalle C Koomen C (2013d) A procedure to obtain a refined European
land usecover map Journal of Land Use Science 8(3) 255-283
Batista e Silva F Poelman H Martens V Lavalle C (2013b) Population Estimation for the
Urban Atlas Polygons JRC Technical Report 26437 Luxembourg Publications office of
the European Union
Bhaduri B Bright E Coleman P and Urban M (2007) LandScan USA a high-resolution
geospatial and temporal modeling approach for population distribution and dynamics
GeoJournal 69 103-117
Craglia M and Granell C (2014) Citizen Science and Smart Cities JRC Technical Report
26652 Publications Office Luxembourg
Craglia M and Shanley L (2015) Data democracy - increased supply of geospatial
information and expanded participatory processes in the production of data
International Journal of Digital Earth
Craglia M Ostermann F and Spinsanti L (2012) Digital Earth from vision to practice making
sense of citizen-generated content International Journal of Digital Earth 5(5) 398-416
Deville P Linard C Martin S et al (2014) Dynamic population mapping using mobile phone
data Proceedings National Academies of Science 111(45) 15888-15893
Freire S and Aubrecht C (2012) Integrating population dynamics into mapping human
exposure to seismic hazard Natural Hazards amp Earth Systems Sciences 12(11) 3533-
3543
20
Freire S Aubrecht C and Wegscheider S (2013) Advancing tsunami risk assessment by
improving spatio-temporal population exposure and evacuation modeling Natural
Hazards 681311-1324
Freire S Florczyk A and Ferri A (2015) Modeling Day- and Nighttime Population Exposure
at High Resolution Application to Volcanic Risk Assessment in Campi Flegrei In Palen
Buumlscher Comes and Hughes (eds) Proceedings of the ISCRAM 2015 Conference
Kristiansand May 24-27 2015
Gallego FJ and Peedell S (2001) Using Corine Land Cover to map population density In
European Environment Agency ldquoTowards agri-environmental indicators Integrating
statistical and administrative data with land cover informationrdquo Copenhagen pp 94ndash
105
Gallego FJ Batista F Rocha C and Mubareka S (2011) Disaggregating population density
of the European Union with CORINE Land Cover International Journal of Geographical
Information Science 25(12) 2051ndash2069
Goodchild MF (2007) Citizens as sensors the world of volunteered geography GeoJournal
69 (4) 211ndash221
Goodchild MF Guo H Annoni A et al (2012) Next Generation Digital Earth Proceedings of
the National Academies of Science 109(28) 11088ndash11094
Jiang S Alves A Rodrigues F et al (2015) Mining point-of-interest data from social
networks for urban land use classification and disaggregation Computers Environment
and Urban Systems In press
Lavalle C Baranzelli C Batista e Silva F et al (2011) A high resolution land usecover
modelling framework for Europe ICCSA 2011 Part I LNCS 6782 60ndash75
Lavalle C Batista e Silva F Baranzelli C et al (2016) Land Use and Scenario Modeling for
Integrated Sustainability Assessment in J Feranec et al (eds) European Landscape
Dynamics CORINE Land Cover Data CRC Press - Taylor amp Francis Group pp 237-262
Martin D Cockings S and Leung S (2010) Progress report 24-hour gridded population
models Proceedings of European Forum for Geostatistics 2010 Tallinn Estonia
Martin D Cockings S and Leung S (2015) Developing a Flexible Framework for
Spatiotemporal Population Modeling Annals of the Association of American
Geographers 105(4) 754ndash772
McPherson TN and Brown MJ (2004) Estimating daytime and nighttime population
distributions in US cities for emergency response activities In Symposium on Planning
Nowcasting and Forecasting in the Urban Zone 84th AMS Annual Meeting AMS Seattle
2004
Patel NN Stevens FR Huang Z et al (2016) Improving Large Area Population Mapping
Using Geotweet Densities Transactions in GIS
Pesaresi M and Ehrlich D (2009) A methodology to quantify built-up structures from optical
VHR imagery In Gamba P and Herold M (eds) Global Mapping of Human Settlement
Experiences Datasets and Prospects Boca Raton FL USA CRC Press ch 3 pp 27ndash
58
Pesaresi M Guo H Blaes X et al (2013) A Global Human Settlement Layer from optical
HRVHR RS data Concept and first results IEEE J Sel Topics Appl Earth Observ
Remote Sens 6(5) 2102-2131
21
Smith A Martin D and Cockings S (2016) Spatio-Temporal Population Modelling for
Enhanced Assessment of Urban Exposure to Flood Risk Applied Spatial Analysis and
Policy 9(2) 145-163
Smith A Newing A Quinn N et al (2015) Assessing the impact of seasonal population
fluctuation on regional flood risk management ISPRS International Journal of Geo-
Information 4(3) 1118-1141
Spyratos S Lutz M and Pantisano F (2014) Characteristics of Citizen-contributed
Geographic Information in Huerta Schade Granell (eds) Connecting a Digital Europe
through Location and Place Proceedings of the AGILE 2014 International Conference on
Geographic Information Science Castellon Spain
Steenbrugger J Tranos E and Nijkamp P (2014) Data from Mobile phone operators A tool
for smarter cities Telecommunications Policy 39(3-4) 335-346
Tatem AJ Huang Z Narib C et al (2014) Integrating rapid risk mapping and mobile phone
call 545 record data for strategic malaria elimination planning Malaria journal 13(52)
Wu SS Qiu X and Wang L (2005) Population estimation methods in GIS and remote
sensing A review GIScience and Remote Sensing 42(1) 80ndash96
22
List of abbreviations and definitions
CLC CORINE Land Cover
CLC-R CORINE Land Cover ndash Refined
EC European Commission
EFTA European Free Trade Association
EPRTR European Pollutant Release and Transfer Register
ESM European Settlement Map
GIS Geographical Information Systems
JRC Joint Research Centre
LULC Land useland cover
MMU Minimum Mapping Unit
MPOD Mobile Phone Operator Data
NACE Nomenclature Statistique des activiteacutes eacuteconomiques dans la Communauteacute
europeacuteenne
NSI National Statistical Institute
NUTS Nomenclature of Territorial Units for Statistics
OSM OpenStreetMap
VGI Volunteered Geographic Information
23
List of figures
Figure 1 Area of interest of ENACT 11
Figure 2 Schedule of main phases and tasks and units involved 12
Figure 3 Workflow and interlinkages between the projectrsquos main phases 13
Figure 4 Population density in 8102015 derived from mobile phone operator data
(Proximus) in Belgium at 1 km resolution 15
24
List of boxes
Box 1 Why mapping spatiotemporal population is a big challenge 6
Box 2 ENACTrsquos methodology in brief 8
25
List of tables
Table 1 Main expected specifications of output datasets 10
Table 2 State of the work 14
26
Annexes
Annex 1 Literature review
The table below provides an overview of previous efforts in spatiotemporal population
modelling using mostly conventional data sources (ie excluding studies using mobile
phone data social media and other lsquobig datarsquo sources)
Publication
(Authors
and year)
Main application
objective
Temporal
resolution
Spatial
resolution Study area
Proxies for
population
allocation
Method
McPherson
amp Brown
2004
Emergency
response
(manmade disaster
- release of
hazardous
material)
Night-time
Daytime 250 m USA
StreetMap USA
ESRIGDT 1998
NAVTEC Premium
Streets Data State
Business Directory
Night-time population
disaggregation of
census data based on
road network Daytime
population worker
population
disaggregated based
on State Business
Directory + residual
residential population
Ahola et al
2007
Risk assessment
and damage
analysis (fire and
rescue services)
14 time
periods
Vector
based
(building
level)
Helsinki
(centre)
Finland
Buildings Enterprise
and agency data
related to buildings
Person traffic data
Shopping centres
Kindergartens
Schools Central
traffic buildings
Disaggregation into
point locations using a
matrix of weights (per
population subgroup
and time period)
includes expert
knowledge based
weights
Bhaduri et
al 2007
Enhancing the
temporal resolution
of population
distribution data in
the US (general
purpose)
Night-time
Daytime
3 arc
seconds
(~90 m)
USA
Roads Railroads
Airports Large Area
Landmarks Water
Recreation Areas
Retail Centers
National Land Cover
Data Elevation
Data Education
Employment Jails
and prisons Aerial
imagery
Disaggregation into
cells based on
modelled cumulative
weights Methodology
includes extensive
manual checking and
refinement
Aubrecht et
al 2014
Social impact
evaluation in crisis
management
Quasi
continuous
(1 hour
step)
100 m Baden Austria
Land use Land
cover (national data
CORINE Urban
Atlas) Street
network Building
layer
DynaPop model ndash
three components of
population (Home
Commuting Work)
disaggregated from
census zone level to
grids using a set of
spatial and temporal
weights
Freire et al
2015
Assessment of
human exposure to
volcanic hazard
Night-time
Daytime 50 m Naples Italy
Urban Atlas
European settlement
map LandScan
Census tracts
Night-time population
disaggregation of
census data based on
land use Daytime
population derived
using commuting
ratios + estimated
27
residual residential
population
Martin et al
2015
Proposal and
implementation of
a flexible
framework for
spatiotemporal
population
modeling
Quasi
continuous
(15 min
step)
200 m Southampton
UK
Residential locations
Prisons Care
homes Workplaces
Schools
Universities
Hospitals Roads
SurfaceBuilder 247 ndash
variable kernel density
estimation several
ageactivity based
population subgroups
are redistributed
across space subject
to a series of weights
constraints and
temporal profiles
Smith et al
2015
Assessment of
human exposure to
flood risk in a
coastal touristic
region
Quasi
continuous
(1 h step)
100 m St Austell area
UK
Centroids
representing
residential locations
Centroids
representing places
of work study
leisure healthcare
and retail Roads
Smith et al
2016
Assessment of
urban exposure to
flood risk
Quasi
continuous
(2 h step)
200 m Southampton
UK
28
Annex 2 CLC-R nomenclature for lsquoArtificial surfacesrsquo
Brief description examples
111 Continuous urban
fabric
1111 Dense urban fabric
1121 Medium density urban fabric
1122 Low density urban fabric
1123 Very low density or isolated urban
fabric
1211 Industry Manufacturing facilities refineries large farm
buildings
1212 Energy production water supply
waste management
Power plants (non-renewable and renewable)
water supply waste management and treatment
plants
1213 Commerce and private services Wholesale retail and business areas office
buildings exposition sites research facilities
food and beverage services (eg bars and
restaurants)
1214 Public administration defense
and social facilities
Large facilities related to health care education
public administration security law and order
services military barracks
1215 Cultural facilities Arts and cultural facilities (eg museums
libraries theaters) monuments places of
worship
1221 Road network Main road network (consisting of motorways and
other main national links)
1222 Rail network Wide rail segments
1223 Train or ferry stationTrain or ferry stations terminals
1224 Other road and rail associated land
Eg rest areas service stations
123 Port areas See CLC nomenclature illustrated guide
1241 Airport terminals and associated
buildingsAirport terminals and associated buildings
1242 Airport runway and associated
landAirport runway and associated land
131 Mineral extraction
sites
132 Dump sites
133 Construction sites
141 Green urban areas
1421 Sport and leisure greenOther artificial green areas (typically surrounding
sport and leisure facilities) Includes golf courses
1422 Sport and leisure built-up Built-up areas related to sports and leisure
activities (eg stadiums sports halls zoos luna
parks)
1423 Touristic accomodation Hotels and similar accomodations campingtrailer
sites
Predominantly residential areas at different
degrees of horizontal building density High
density areas particularly in the centre of cities
may be characterized by mixed land uses (eg
residential commercial public services)
Level 1 Level 2 Level 3 Level 4
1 Artificial
surfaces
11 Urban fabric
124 Airports
12 Industrial
commercial and
transport units
121 Industrial or
commercial units
122 Road and rail
networks and
associated land
See CLC nomenclature illustrated guide
14 Artificial non-
agricultural
vegetaged areas
13 Mine dump and
construction sites
112
Presence in CLC-R v2 to be determined
Present in CLC-R v2
Present in CLC-R v1
No further level 4 expected
142 Sport and leisure
facilities
Discontinuous urban
fabric
29
Annex 3 Classification of economic activities (NACE rev 2)
A Agriculture forestry and fishing
B-E Industry
F Construction
G-J Wholesale and retail trade transport accommodation and food service activities information and communication
K-N Financial and insurance activities real estate activities professional scientific and technical activities administrative and support service ahellip
O-U Public administration and defence compulsory social security education human health and social work activities arts entertainment and recreationhellip
A Agriculture forestry and fishing
BDE Mining and quarrying electricity gas steam and air conditioning supply water supply sewarage waste management and remediation activities
C Manufacturing
F Construction
GHI Wholesale and retail trade transport and storage accomodation and food service activities
J Information and communication
K Financial and insurance activities
L Real estate
MN Professional scientific and technical activities administrative and support service activities
OPQ Public administration defence education human health and social work activities
RSTU Arts entertainment and recreation other service activities activities of household and extra-territorial organizations and bodies
A Agriculture forestry and fishing
B Mining and quarrying
C Manufacturing
D Electricity gas steam and air conditioning supply
E Water supply sewerage waste management and remediation activities
F Construction
G Wholesale and retail trade repair of motor vehicles and motorcycles
H Transportation and storage
I Accommodation and food service activities
J Information and communication
K Financial and insurance activities
L Real estate activities
M Professional scientific and technical activities
N Administrative and support service activities
O Public administration and defence compulsory social security
P Education
Q Human health and social work activities
R Arts entertainment and recreation
S Other service activities
T Activities of households as employers u0ndifferentiated goods- and services-producing activities of households for own use
U Activities of extraterritorial organisations and bodies
6 sectors
11 sectors
21 sectors
30
Annex 4 Short description of the CLC Refined 2012 (v10)
Prepared by Filipe Batista e Silva and Konstantin Rosina
Document version November 2016
Introduction
The CORINE Land Cover (CLC) is a European land useland cover (LULC) mapping project
initiated in the mid-1980rsquos The first inventory was released for the reference year 1990
and subsequent updates have been produced for the reference years 2000 2006 and
20126 The CLC is produced under the coordination of the European Environment Agency
(EEA) using a common LULC nomenclature mapping specifications and methodologies
meant to ensure a high degree of comparability across time and countries covered thus
making it a reference and widely used data source for LULC information in Europe
CLC however is characterized by a relatively coarse minimum mapping unit (MMU) of 25
hectares for all LULC categories which is a limiting factor for applications requiring a finer
detection of LULC patterns Another key limitation particularly for applications related to
urban areas population and economic activity concerns the low thematic resolution for
artificial LULC classes The European Commission Joint Research Centre (JRC) has been
engaged in developing and implementing a methodology to address the above-mentioned
limitations of CLC so to release an enhanced European LULC map labelled ldquoCLC refinedrdquo
(CLC-R) This work is conducted by JRCrsquos own initiative as an element of its work
programme
As its name indicates the CLC-R 2012 (v10) is an enriched version of CLC 2012 with a
significantly higher spatial resolution of 1 hectare for artificial LULC categories and at least
5 hectares for non-artificial ones The methodology is based on the integration of LULC-
relevant information from multiple CLC 2012-compatible geodata sources (particularly the
Copernicus ldquoHigh Resolution Layersrdquo amongst others) A forthcoming version of CLC-R
2012 (v20) expected by mid-2017 will address the improvement of the thematic detail
of CLC 2012 namely by breaking down CLCrsquos LULC category ldquo121 ndash Industrial or
commercial sitesrdquo into various sub-classes linked to specific socio-economic sectors The
work herein referred follows and expands upon previous experience of refining the CLC
20067
The remainder of the document covers the main objectives concerning the production of
CLC-R 2012 its main characteristics input data and methodological steps A more
thorough description of the methodology is under preparation and will be published as a
JRC Technical Report
Objectives
The main objective set for CLC-R 2012 (v10) was the increase of CLCrsquos spatial resolution
(ie reduction of the minimum mapping unit) while preserving the thematic detail and
definitions of CLC Another objective was to attain a more detailed and consistent
6 For more info on CLC family of products httplandcopernicuseupan-europeancorine-land-cover 7 Batista e Silva F Lavalle C Koomen E (2013) A procedure to obtain a refined European land usecover map
Journal of Land Use Science 8(3) 255-283
31
classification of the 11X - Urban fabric classes using an unambiguous quantitative
approach to identify urban fabric of different densities
The immediate usage of the CLC-R 2012 within the JRC is twofold
- To be used as base map in LUISArsquos territorial modelling platform8
- To be used as input to the ENACT JRC exploratory project aiming at the
enhancement of activity and population mapping
The CLC 2012 refined (v10) can in addition be used for a wide range of other purposes
and applications within the JRC and elsewhere
Main characteristics of CLC-R 2012
Spatial resolution Minimum mapping unit of ~5 hectares (1 ha for artificial surfaces and
for all LULC classes in areas covered by the Urban Atlas dataset ndash European Functional
Urban Areas (FUAs) above 50000 inhabitants) Width of linear features of ~20 m Cell size
= 100 x 100 metres
Thematic resolution Same as in CLC 2012 with the following additional LULC classes 410
- Inland wetlands (a union of 411 - Inland marshes and 412 - Peatbogs) 113 - Urban
fabric low density (10-30 built-up) 114 - Urban fabric very low density and isolated
(lt10 built-up) 143 - Leisure and touristic built-up
Geographical coverage EU28 + EFTA + Western Balkans + Turkey including Islands
Azores Canary Islands Madeira Ceuta and Melilla and excluding French overseas
territories
Reference year 2012
File format Unsigned 8-bit raster file (available as GeoTIFF and File GeoDatabase Raster
Dataset)
Input Data
The CLC-R 2012 (v10) is a composite map whereby information from multiple geodata
sources has been integrated with the original CLC 2012 in a sequential order following
certain rules and criteria (see methodology section below) Input data sources have been
harvested from and selected based upon the compliance with following criteria
Compatibility with CLCrsquos LULC nomenclature (LULC class definitions)
Reference year 2012 +- 2
Higher spatial resolution than CLC 2012
Pan-European geographical coverage
Preferably free open and documented data
The input data sources are listed below
CLC products CLC 2012 v 185 CLC Changes 2006-2012 and CLC Changes 2000-
2006
8 For more info on LUISA territorial modelling httpseceuropaeujrcenluisa
32
Copernicus high resolution (HR) layers 2012 HR layer Forest type + Tree cover
density HR layer Permanent water bodies HR layer Wetlands
TomTom Multinet 2014 Land Use layer + Built-up layer
JRCrsquos European Settlement Map (ESM) (10m version aggregated to 100 m
reference grid)
Urban Atlas 2012 All available FUAs by October 2016 (580)
OpenStretMap (OSM) and TomTom Multinet 2014 as source of road network data
Methodology
The methodology consisted of a sequential integration of LULC information from multiple
geodata sources into the original CLC 2012 map At each step of the sequence specific
input data layers were used to recode the grid cells with which they overlaid spatially
following pre-established decision rules Each step typically deals with the integration of
one particular data input from the above mentioned sources
The order of the sequence is determined by the degree of spatial detail and accuracy of
the data source at hand (the more detailed and accurate the later in the sequence) or by
other logical considerations (eg linear features are added later in the process due to less
strict MMU) Each step is automatized as a separate GIS tool The table below describes
the main steps of the workflow
Step Input data
source Description of procedure
Affected
LULC classes
1 CLC change maps Selected CLC change patches that were not included into CLC2012 map due to generalization rules are
added
All
2 Copernicus High resolution layers
A threshold of 50 is applied to the continuous pixel values (ie the respective class must cover the majority of pixel to be considered) A MMU of 5 contiguous pixels is applied
31X 41 51X
3
TomTom Multinet
2014 ndash Land Use
layer
Land use information from TomTom are added A look-up table is used to establish the relationship between the TomTom and CLC nomenclatures Vector polygons are rasterized using Maximum
Combined Area criterion Applied MMU = 1 pixel ie individual pixels are included
121 122
123 124
141 142
4 European Settlement Map
First a 100 m raster coincident with EEA reference grid is derived from the original 10 m version Pixels overlapping non-residential artificial classes are excluded as are the pixels under minimum building density threshold (empirically derived value of 5)
Applied MMU = 1 pixel ie individual pixels are included
11X
5 Urban Atlas 2012 Vector polygons are rasterized using Maximum Combined Area criterion a decision matrix (original CLC class vs urban atlas class) is used to establish
All
33
the final classification of overlapping pixels Applied
MMU = 1 pixel ie individual pixels are included
6 European Settlement Map
The general 11X class lsquourban fabricrsquo is differentiated into 4 classes according to the underlying building density (based on ESM data) ndash 111 - dense 112 -
medium density 113 - low density 114 - very low density or scattered built-up
11X
7
HR layer Permanent water bodies + OSM and TomTom Multinet 2014 ndash Road networks
Linear features such as rivers and mains roads are included The inclusion of linear features obeys to less restrictive thresholds of within-pixel cover so to preserve as much as possible the spatial contiguity
of these features (in view of their distinct function and importance in structuring and fragmenting the territory) However within artificial areas linear
features are included only when the percentage covered is larger than that of building cover
122 51X
8 European Settlement Map
Built-up areas in the class 142 - Sport and leisure
facilities are extracted as a separate class 143 - Leisure and touristic built-up
142 143
9 TomTom Multinet 2014 ndash Built-up layer
Areas pertaining to Local Administrative Units (LAU2) for which the amount of built-up is significantly lower than expected (given an empirical
relationship between size of the population and urban fabric surface) are refined by adding built-up areas from the TomTom built-up layer Added built-up areas are coded as 114 - very low density or isolated built-up
114
34
Nomenclature
Value Label
111 Urban fabric dense (gt 50 built-up)
112 Urban fabric medium density (30-50 built-up)
113 Urban fabric low density (10-30 built-up)
114 Urban fabric very low density and isolated (lt10 built-up)
121 Industrial or commercial units
122 Road and rail networks and associated land
123 Port areas
124 Airports
131 Mineral extraction sites
132 Dump sites
133 Construction sites
141 Green urban areas
142 Sport and leisure facilities
143 Leisure and touristic built-up
211 Non-irrigated arable land
212 Permanently irrigated land
213 Rice fields
221 Vineyards
222 Fruit trees and berry plantations
223 Olive groves
231 Pastures
241 Annual crops associated with permanent crops
242 Complex cultivation patterns
243 Land principally occupied by agriculture with significant areas of natural vegetation
244 Agro-forestry areas
311 Broad-leaved forest
312 Coniferous forest
313 Mixed forest
321 Natural grasslands
322 Moors and heathland
323 Sclerophyllous vegetation
324 Transitional woodland-shrub
331 Beaches dunes sands
332 Bare rocks
333 Sparsely vegetated areas
334 Burnt areas
335 Glaciers and perpetual snow
410 Inland wetlands
421 Salt marshes
422 Salines
423 Intertidal flats
511 Water courses
512 Water bodies
521 Coastal lagoons
522 Estuaries
523 Sea and ocean
New or redefined classes
35
For illustration purposes the figures below show the differences between the original CLC
2012 (top) and CLC-R 2012 (v10) (bottom) for the area surrounding the city of Turin
Italy
36
Annex 5 List of land use and activity data sources
Data source name Type Reference
date
Description
content
Use in ENACT
Bookingcom Web-service 2016 Location of hotels To reveal locations of
probable tourist
presence (night-time)
Copernicus High
resolution layers
Open public 2012 Spatial raster layers
describing forests
wetlands and water
bodies
Spatial refinement of
CLC
CORINE Land
Cover
Open public 2012 Land usecover map
with 44 classes
Base map for activity
mapping
European
Pollutant Release
and Transfer
Register (EPRTR)
Open public Location of polluting
industries and waste
treatment plants
Thematic refinement of
CLC
European
Settlement Map
Open public 2012 Density of built-up Spatial refinement of
CLC
EuroRegionalMap Proprietary Location of activities
(points of interest)
Thematic refinement of
CLC
National land use
maps
Public or
proprietary
2007-2012 Detailed land use maps
for the following
countriesregions
Portugal Spain
Wallonia Lombardia
The Netherlands
Provide training and
test subsets for the
thematic refinement of
CLC
OpenStreetMap Open VGI 2016 Location of activities
(points of interest)
Thematic refinement of
CLC
PLATTS Proprietary Location of power
plants
Thematic refinement of
CLC
TomTom Proprietary 2013 Location of activities
(land use polygons and
points of interest)
Road and rail
networks
Spatial and thematic
refinement of CLC
TripAdvisorcom Web-service 2016 Location of hotels
restaurants and
tourist attractions
To reveal locations of
probable tourist
presence (day- and
night-time)
Urban Atlas Open public 2012 Land use maps for
European Functional
Urban Areas
Spatial refinement of
CLC
Europe Direct is a service to help you find answers
to your questions about the European Union
Freephone number ()
00 800 6 7 8 9 10 11 () The information given is free as are most calls (though some operators phone boxes or hotels may
charge you)
More information on the European Union is available on the internet (httpeuropaeu)
HOW TO OBTAIN EU PUBLICATIONS
Free publications
bull one copy
via EU Bookshop (httpbookshopeuropaeu)
bull more than one copy or postersmaps
from the European Unionrsquos representations (httpeceuropaeurepresent_enhtm) from the delegations in non-EU countries (httpeeaseuropaeudelegationsindex_enhtm)
by contacting the Europe Direct service (httpeuropaeueuropedirectindex_enhtm) or calling 00 800 6 7 8 9 10 11 (freephone number from anywhere in the EU) () () The information given is free as are most calls (though some operators phone boxes or hotels may charge you)
Priced publications
bull via EU Bookshop (httpbookshopeuropaeu)
LF-N
A-2
8335-E
N-N
doi102791056071
ISBN 978-92-79-64588-4

7
3 Project description
31 ENACT in a nutshell
Population is a crucial variable for the social sciences the geosciences and for policy
support in many domains Yet our knowledge of its spatial distribution is still nowadays
very incomplete Population is a temporally dynamic variable with major shifts in its
distribution occurring in daily and seasonal cycles resulting in rapidly changing densities
Spatially detailed representations of residential population exist at EU level since several
years While these maps can be used as proxy for night-time population distribution the
distribution of population for other time frames is practically unknown at almost every
spatial scale Consequently all applied sciences and policy support that require spatially
detailed information on population distribution are based on only a fractional and static
representation of reality Overcoming this large knowledge gap is the main goal of the
ENACT exploratory research project
Several methodological challenges and data limitations have hindered progress in this field
in the past This project aims at addressing the challenges that are required to obtain (1)
the amount of people per type of activity per time-frame and per region and (2) their
likely location at a high spatial resolution The first element requires regional data on
residents employees per sector of activity students and tourists which can be derived
mostly from official sources The second element requires spatial data on the location of
activities (eg manufacturing retail health education leisuretourism) which will be
sought from various conventional (eg remote sensing imagery land use maps) and
unconventional data sources (eg volunteered geographical information large proprietary
geo-databases and web-services) The final challenge is to validate the produced multi-
temporal population distribution grid maps ENACTrsquos output will be compared against
reference data from independent sources such as multi-temporal population grids derived
from mobile phone operator data or other sources (eg produced by other researchers)
and micro-data from National Statistical Institutes (NSIs) on location of employment
Ultimately this project aims at developing and implementing a consistent and validated
methodology to produce multi-temporal (ie including daily and seasonal variations)
population distribution grids for Europe Such datasets will expand the knowledge base of
spatiotemporal population patterns across the continent Moreover multi-temporal
population grids can be a useful and straightforward (ie easy to integrate) input to several
models developed and run at the JRC particularly transport land use economic and
environmental models and exposure to hazards with potential positive impact on the
reliability of assessments
In addition to fostering a range of applications across Europe the forthcoming public
dissemination of ENACTrsquos final outputs may increase awareness among national authorities
on the importance of collecting good quality data on population and location of activities
8
Box 2 ENACTrsquos methodology in brief
The following questions define the main methodological aspects that need to be
addressed by ENACT in order to produce multi-temporal population grids for Europe
Question 1a How many people are inside and outside their residences during
the day in each region
Action To estimate total population per type of main activity per NUTS3 region
How By assembling official data from Eurostat on the no of workers per sector of
economic activity no students per main educational levels no of tourists and
number of inactive population (and thus likely to be at home during the day) per
region
Question 1b What is the seasonal variation of total present population in each
region
Action Seasonal variation of total present population in a region is mostly due to
touristic flows Therefore inbound and outbound tourist flows of each region per
season (or per month) must be taken into account by ENACT
How By first downscaling total yearly nights-spent per NUTS2 to NUTS3 using the
no of beds per NUTS3 Then breaking down the NUTS3 yearly nights-spent per
month using as proxy monthly flight traffic information from Eurostat Monthly
nights-spent per region can then be easily converted to average no of tourists
present in a given month by dividing total nights-spent in a month by the total no of
days comprised in that month Finally the number of tourists present in given a
region in a given month are removed from their likely regions of origin
Question 2 Where do people spend their time during the day and night
Action There is no one-stop shop for such multi-sector highly detailed locations of
activities ENACT needs to resort to various sources proprietary and open-source
conventional and non-conventional Specific population sub-groups then need to be
allocated to locations of probable presence
How By extracting relevant activity-location data from multiple sources namely
conventional (eg LULC maps remote sensing) volunteered geographic information
(eg OpenStreetMap) web-based services and proprietary sources (eg TomTom
PLATTS GISCO-EuroGeographics etc) At night-time residents will be located to
residential areas and tourists to touristic accommodation facilities At daytime the
various population sub-groups (eg students workers per sector of activity tourists)
will be allocated to the relevant activity types based on a probability matrix
Question 3 How accurate are ENACTrsquos multi-temporal population grid maps
Action To compare ENACTrsquos outputs with other reference data
How By resorting in particular to emerging population density grid maps derived
from mobile phone operator data but also to existing employment grids produced by
some NSIs Comparing ENACTrsquos grids with grids from other researchers is an
additional option
9
32 Specific objectives of ENACT
The ultimate objectivesoutputs of ENACT are as follows
mdash In terms of data production
To produce a set of multi-temporal population grid maps that take into account the
main seasonal and daily variations of population consistent with the most recent
census data (2011) and covering the largest possible number of EU28 countries
ENACT aims at least 6 population grid maps covering 3 main seasons of the year
(summer winter springautumn) for both night- and daytime
mdash In terms of dissemination of methods and results
To write a scientific paper summarizing the methodology and results and submit it
to a high-impact geographical science journal
To disseminate the final multi-temporal population grids following the INSPIRE
directive standards using JRC web channels
To fulfil the above objectives the following intermediate objectivesoutputs of ENACT are
expected
To review the most recent and significant scientific literature on daytime (or multi-
temporal) population mapping
To build a database of population stocks at regional level (NUTS23) with no of
residents employed population per main sector of activity nr of students nr of
tourists and inactive population The database must have a temporal dimension
(seasonal or monthly)
To build a geodatabase with land use and activity information at the highest possible
thematic and spatial resolution by assembling data from both conventional and non-
conventional sources
To produce an enhanced version of the CORINE Land Cover Map 2012 with
improved spatial resolution (minimum mapping unit of 1 hectare instead of 25) and
thematic resolution (further breakdown for specific CLCrsquos LULC classes)
To compare ENACTrsquos multi-temporal population grids with other independent
sources namely multi-temporal population grids derived from mobile phone
operator data or other sources (eg produced by other researchers) and micro-
data from National Statistical Institutes (NSIs) on location of employment4
33 Main specifications of output datasets
As per the above objectives two sets of data will be produced (a) geodatabase with land
use and activity information and (b) multi-temporal population grid maps The former item
comprises individual datasets with location of specific activities plus an overarching land-
use map herein referred to as CLC-R 2012 CLC-R 2012 is a refined version of CLC 2012
with increased spatial and thematic resolution and built by integrating geodata from
multiple sources (see Annex 4) Because CLC-R contains the location of many types of
activities it will be the backbone for the subsequent production of the multi-temporal
population grid maps
4 The comparison exercise however may only be feasible for selected regions or countries in Europe
depending on the amount of reference data the project is able to collect and handle
10
Table 1 summarizes the main specifications (spatial coverage spatial thematic and
temporal resolutions reference dates) of the two sets of data Figure 1 shows the area of
interest of ENACT
The multi-temporal population grid maps have a more limited spatial coverage than the
CLC-R because they require as input statistical data which is not fully available from
Eurostat for countries outside EU28 The spatial resolution is also somewhat more limited
for the final multi-temporal population grid maps due to the inability to validate these maps
at a resolution below 1 Km The temporal resolution is yet to be defined but ENACT aims
at least 6 maps (summer winter springautumn x day- and night-time) The possibility to
have higher temporal resolution (eg 24 maps each month x day- and night-time) is
currently under consideration depending on whether we will be able to break down yearly
tourist stocks per month
Table 1 Main expected specifications of output datasets
Land use and activity data
(CLC-R)
Multi-temporal population grid
maps
Spatial coverage EU28 + EFTA + Balkan countries
+ Turkey (see figure 1)
EU28 (see figure 1)
Spatial resolution 100 m 100 m (production) 1 Km
(dissemination)
Temporal resolution Single year Monthly or seasonal x day- and
night-time
Thematic resolution ~ 10 separate land use
categories relevant for
population mapping
(see Annex 2)
Population per various sub-groups
(residents employees per sector
of activity students tourists
inactive)
Reference date 2012 2011
11
Figure 1 Area of interest of ENACT Legend Green area of interest for the multi-temporal
population grids (EU28) Yellow area of interest for land use and activity data Grey outside area
of interest
34 Workflow and schedule
The main phases and tasks of the project are mapped in the Gantt chart of Figure 2 with
an approximate schedule of the work The herein project planning is a revision of the
original schedule included in the project proposal It has a slightly revised arrangement of
the main phases and divides each of the 6 mains phases into sub-activities or tasks The
green bars correspond to the originally scheduled duration of each task The grey bars
correspond to the revised duration For many tasks the duration was prolonged for
additional months as the project ran significantly understaffed for most of 2016 The
flowchart in Figure 3 shows how the main phases of the project (in square brackets) are
interconnected
The first crucial phase of the project (lsquoPreparationrsquo) paves the way for a structured and
solid kick-off It includes a literature review of the most recent and relevant work in the
field as well as an inventory of the data needs and potential data sources In addition
linkages between the nomenclatures used in the various data sources will be established
using the NACE rev2 as pivotal nomenclature
The second phase (lsquoRegional flows and stocks of peoplersquo) includes the collection of
statistical data primarily from official sources (Eurostat and NSIs) The statistical data will
be worked in order to produce seasonal or monthly regional balances of various population
sub-groups namely residents workers per 6 sectors of economic activity students
tourist and inactive population
12
The third phase (lsquoActivity mappingrsquo) goes in parallel with the second phase and consists
of collecting land use and activity location data from all available data sources These data
will be combined to improve both the spatial and thematic resolutions of CLC 2012 and
thus generate the lsquoCLC-Rrsquo The CLC-R will be the base map for the allocation of population
sub-groups in different land use and activity categories for different time-frames (seasons
or months and night-time and daytime) The spatial allocation or disaggregation of
population will be carried in the fourth phase of the project (lsquoModelling spatiotemporal
population distributionrsquo)
In the fifth phase of the project (lsquoValidationrsquo) a comparison will be made between ENACTrsquos
main outputs (ie multi-temporal population grid maps) and reference data from
independent sources namely multi-temporal population grids derived from mobile phone
operator data or other sources (eg produced by other researchers) and micro-data from
National Statistical Institutes (NSIs) on location of employment With the comparison
exercise we expect to assess the validity of ENACTrsquos outputs Although the ENACTrsquos
outputs may not be fully comparable with the independent sources used in the validation
(eg due to differences in total estimated population within a given spatial unit of analysis)
appropriate indicators will be established to check the degree of agreement in terms of
relative difference of population between various time frames (eg night-time vs daytime
or seasonmonth lsquoArsquo vs seasonmonth lsquoBrsquo) The comparison exercise may only be feasible
for selected regions or countries in Europe depending on the amount of reference data the
project is able to collect and handle The validation is indispensable for the lsquoReporting and
disseminationrsquo of ENACTrsquos outputs (phase 6 of the project)
Figure 2 Schedule of main phases and tasks and units involved
1 2 3 4 5 6 7 8 9 10 11 12 1 2 3 4 5 6 7 8 9 10 11 12
11 Literature review B3 B6 E1
12 Assessment of data needs and
sourcesB3 B6 E1
13 Harmonization of data
nomenclaturesB3
21 Collect population employment
tourism and students statisticsB3
22 Seasonal or monthly regional
population balancesE1 B3
31 Collect geo-referenced land use
and activity dataB3
32 Spatial refinement of CLC2012 B3
33 Thematic enhacement of CLC2012 B3
E1 B3
51 Collect reference data (NSIs and
mobile phone operator data)B6
52 Carry validation exercise B6 E1 B3
61 Interim report B3 B6 E1
62 ER workshop presentation B3 B6 E1
64 Preparation of peer-reviewed paper B3 E1 B6
65 Public dissemination of GIS layers B3 E1 B6
4 Modelling spatiotemporal population distribution
Time bar main tasks and units involved
2016 2017
2 Regional flows
and stocks of
people
3 Activity
mapping
Tasks
5 Validation
6 Reporting and
dissemination
Phase
1 Preparation
13
Figure 3 Workflow and interlinkages between the projectrsquos main phases
14
4 State of the work
So far we have mostly focused on phases 1 2 and 3 of the project although some
preparatory tasks for the subsequent phases have also initiated Below we list and describe
the main tasks completed on-going and forthcoming
Table 2 State of the work
Phasetask Description Actors Depen-
dencies Status
1 Preparation
11 Literature
review
lsquoFirst roundrsquo of literature review of multi-temporal population
mapping to steer the kick-off of the project lsquoSecond roundrsquo
complementary literature review to done by the time of the writing
of the final paper
B3 B6
E1 None
lsquoFirst
roundrsquo of
review
complete
See
summary
in chapter
2 of the
herein
report +
annex 1
12 Assessment of
data needs and
sources
List of potentially useful sources of geographical and statistical data
to be used in different stages of the project
B3 B6
E1 11
Complete
See annex
5
13 Harmonization
of data
nomenclatures
Check data nomenclatures and classifications from the different
sources of data useful to the project Make the necessary
correspondences between classifications
B3 12 Complete
2 Regional flows and stocks of people
21 Collect
population
employment
tourism and
students statistics
Collection of raw statistical data from Eurostat on number of
residents employees per sector of economic activity students per
main educational levels number of nights-spent by tourists per
NUTS23 and flight data per airport unemployment rates
B3 12
On-going
(close to
completio
n)
22 Seasonal or
monthly regions
population
balances
Production of seasonal or monthly tables of population balances per
NUTS3 and per the following population categories resident
population employees (per sector of activity) students (per main
educational levels) tourists and non-active population taking into
account outbound tourism and to avoid double counting of
population
E1 B3 21
On-going
(just
initiated)
3 Activity mapping
31 Collect geo-
referenced land
use and activity
data
Collection and preparation of available data on land use and
activities locations from multiple sources (openproprietary
conventionalnon-conventional)
B3 12 Complete
32 Spatial
refinement of CLC
2012
Improvement of the spatial resolution of CLC 2012 Reduction of
minimum mapping unit (MMU) from 25 ha to 1 ha for all lsquoartificial
surfacesrsquo group of LULC classes See Annex 4 for a more complete
description
B3 31 Complete
33 Thematic
refinement of CLC
2012
Improvement of the thematic resolution of CLC 2012 Add additional
breakdown (lsquolevel 4rsquo) to some lsquoartificial surfacesrsquo LULC classes B3 31 32 On-going
15
4 Modelling spatiotemporal population distribution
Modelling
spatiotemporal
population
distribution
Downscaling of multi-temporal population balances per NUTS3 (task
22) to grid cell level based on the location of land uses and
activities
E1 B3 2 3
On-going
First
prototype
scripts
under
constructi
on
5 Validation
51 Collect
reference data
(NSIs and mobile
phone operator
data)
Establish methods to estimate population density distribution from
network-based mobile phone data1 Obtain data on population
densities derived from mobile phone operator data (MPOD) The
sample should ideally include more than one European
regioncountry and have both daily and seasonal resolution Obtain
employment grids for a sample of European regionscountries
B6 12
On-going
Data for
Belgium
collected
(see figure
4)
52 Carry
validation
exercise
Define a methodology for the validation exercise Preparation of
MPOD for the comparison with ENACTrsquos multi-temporal population
grids Construct indicators of agreement between the reference grids
and ENACTrsquos multi-temporal population grids
B6 E1
B3 41 51
To be
initiated
6 Reporting and dissemination
61 Interim report Interim report describing the projectrsquos objectives and progress of the
work
B3 B6
E1 na Complete
62 Exploratory
research
workshop
presentation
Oral presentation of the projectrsquos progress to the JRC Scientific
Committee
B3 B6
E1 na
To be
scheduled
63 Preparation of
peer-reviewed
paper
Scientific paper describing the newly produced datasets B3 B6
E1 4 5
To be
initiated
64 Public
dissemination of
GIS layers
Public dissemination of GIS layers possibly using JRC web channels B3 B6
E1 4 5
To be
initiated
Notes 1 Published journal article Estimating population density distribution from network-based mobile phone datardquo PUBSY JRC96568
Figure 4 Population density in 8102015 derived from mobile phone operator data (Proximus) in Belgium at 1 km resolution
16
41 Participation in events
The ENACT project has already been presented in the following occasionseventsworking
groups
10-12 November 2015 European Forum for Geography and Statistics (EFGS) 2015
Conference Vienna Austria
Presentation by Filipe Batista e Silva titled rdquoThe ENACT project Towards
spatiotemporal population mappingrdquo
12 February 2016 1st JRC-Eurostat workshop on Big Data Ispra Italy
Presentation by Filipe Batista e Silva titled rdquoThe ENACT project Towards
spatiotemporal population mappingrdquo
1-2 September 2016 JRC Big data for science and policy workshop Ispra Italy
Presentation by Filipe Batista e Silva titled rdquoBig data for rsquoEnhancing
activity and population mappingrsquordquo
22 November 2016 ERSAREGIOUCL joint international workshop rdquoHow can
regional policy benefit from Big Datardquo Louvain-la-Neuve Belgium
Presentation by Filipe Batista e Silva titled rdquoSpatiotemporal population
mapping in Europerdquo
Participation in the work of the European Statistical System Big data Task Force
chaired by ESTAT which is the forum in which collaboration with statistical agencies
and some mobile phone operators takes place that can assist in the validation of
the ENACT outputs (Massimo Craglia)
Participation in collaborative work between ESTAT the Belgian Statistical agency
and Proximus mobile phone operator5 (Massimo Craglia)
5 See description here
httpeconomiefgovbefrbinariesCarrefour_economie_2016_10_tcm326-280315pdf pages 38-53
17
5 Conclusions main risks and challenges ahead
The work is progressing well given the stated limitations (project running considerably
understaffed for most of 2016) Nonetheless significant progress has been made (see
summary in chapter 4) As main milestones achieved we highlight the conclusion of the
spatial refinement of CLC-R 2012 and the collection of most data inputs necessary for the
detailed mapping of activities and construction of regional population balances
At project proposal stage we had identified the following main risks
1 The collection of land-use relevant VGI has not been assessed at EU scale addressing
redundancy between data sources and assessing data quality (ie completeness
consistency updatehellip) at EU level are key challenges
2 The accuracy levels of the resulting population grids will determine the appropriate
spatial resolution of the final layers for public dissemination A low spatial resolution
(eg cell size gt 1 Km) can limit the range of potential applications
3 The delivery schedule and sample size of the mobile phone data are not fully known at
this stage
4 Potential delays in the production of the CLC 2012 for some countries could lead to
gaps in the spatial coverage of the CLC-R 2012
Risks 2 and 3 remain open at the current stage of the project Risk 1 will be address by
applying Machine Learning methods to classify CLC-R polygons into a more detailed a set
of discrete LULC classes Risk 4 is now obsolete CLC 2012 has been completed and is
available at the Copernicus Land Monitoring Service website The spatial refinement of CLC
2012 has been already accomplished for the entire extent of the CLC mapped area The
thematic refinement of CLC is on-going and progressing as expected so far
However as the work progressed we identified additional challenges
mdash Related to the construction of NUTS3 population balance tables
Tourism and student data only available at NUTS2 for some countries ndash downscaling
to NUTS3 possibly using proxies
Breakdown of yearly NUTS3 tourists per seasonmonth necessary Method based
on using monthly flight traffic as proxy still under testing phase
Workers in one NUTS3 region can be resident in another NUTS3 region (commuting
between NUTS3) Commuting data between municipalities or even NUTS3 seems to
be completely inexistent at EU-level Pragmatic assumptions might be necessary
Statistics for activeinactive population and unemployment available only at NUTS2
Downscaling to NUTS3 might be necessary using proxies available at NUTS3 (eg
total population and population per age-groups)
Inbound tourists in one NUTS3 have other NUTS3 as regions of origin which need
to be identified Method still to be defined
Construction of NUTS3 consistent population balance tables that avoid double
counting of total population
mdash Concerning the disaggregation of population stocks from regional to pixel level
The relationship between certain population sub-groups (eg employees per sector
of economic activity or tourists) and the land uses is of rsquoone-to-manyrsquo In other
words a population category can occur in more than one land use type This will
inevitably call for additional parametrization of the downscaling algorithms possibly
18
using probability matrices defining the probability of land use class holding
population from the various sub-groups
mdash Related to the use of lsquoBig Datarsquo sources
Extractionminingscrapping of data from the web is sometimes challenging (a
dedicated procedure needs to be constructed for each website)
The big data sources screened for the ENACT project are mostly proprietary with
strict terms and conditions of use
Dialogue with individual data providers would be required to gain legal access
Quality of data unknown difficult to measure accuracy and completeness of
bottom-up generated data
Methodological challenges making sense out of the multiple big data sources for
our specific needs
19
References
Ahola T Virrantaus K Krisp JM and Hunter GJ (2007) A spatio‐temporal population model
to support risk assessment and damage analysis for decision‐making International
Journal of Geographical Information Science 21(8) 935-953
Aubrecht C Oumlzceylan Aubrecht D Ungar JK et al (2016) VGDI - Advancing the Concept
Volunteered Geo-Dynamic Information and its Benefits for Population Dynamics
Modeling Transactions in GIS
Aubrecht C Steinnocher K and Huber H (2014) DynaPop - Population distribution dynamics
as basis for social impact evaluation in crisis management In S R Hiltz et al (eds)
Proceedings of ISCRAM 2014 - 11th Int Conf on Information Systems for Crisis
Response and Management University Park PA USA
Batista e Silva F and Poelman H (2016) Mapping population density in Functional Urban
Areas - A method to downscale population statistics to Urban Atlas polygons JRC
Technical Report no EUR 28194 EN doi10279106831
Batista e Silva F Gallego J Lavalle C (2013a) A high-resolution population grid map for
Europe Journal of Maps 9(1) 16-28
Batista e Silva F Koomen E Diogo V et al (2014) Estimating demand for industrial and
commercial land use given economic forecasts PLOS ONE 9 e91991
Batista e Silva F Lavalle C Jacobs-Crisioni C et al (2013c) Direct and indirect land use
impacts of the EU cohesion policy Assessment with the Land Use Modelling Platform
JRC scientific and policy report 26460 Luxembourg Publications office of the European
Union
Batista e Silva F Lavalle C Koomen C (2013d) A procedure to obtain a refined European
land usecover map Journal of Land Use Science 8(3) 255-283
Batista e Silva F Poelman H Martens V Lavalle C (2013b) Population Estimation for the
Urban Atlas Polygons JRC Technical Report 26437 Luxembourg Publications office of
the European Union
Bhaduri B Bright E Coleman P and Urban M (2007) LandScan USA a high-resolution
geospatial and temporal modeling approach for population distribution and dynamics
GeoJournal 69 103-117
Craglia M and Granell C (2014) Citizen Science and Smart Cities JRC Technical Report
26652 Publications Office Luxembourg
Craglia M and Shanley L (2015) Data democracy - increased supply of geospatial
information and expanded participatory processes in the production of data
International Journal of Digital Earth
Craglia M Ostermann F and Spinsanti L (2012) Digital Earth from vision to practice making
sense of citizen-generated content International Journal of Digital Earth 5(5) 398-416
Deville P Linard C Martin S et al (2014) Dynamic population mapping using mobile phone
data Proceedings National Academies of Science 111(45) 15888-15893
Freire S and Aubrecht C (2012) Integrating population dynamics into mapping human
exposure to seismic hazard Natural Hazards amp Earth Systems Sciences 12(11) 3533-
3543
20
Freire S Aubrecht C and Wegscheider S (2013) Advancing tsunami risk assessment by
improving spatio-temporal population exposure and evacuation modeling Natural
Hazards 681311-1324
Freire S Florczyk A and Ferri A (2015) Modeling Day- and Nighttime Population Exposure
at High Resolution Application to Volcanic Risk Assessment in Campi Flegrei In Palen
Buumlscher Comes and Hughes (eds) Proceedings of the ISCRAM 2015 Conference
Kristiansand May 24-27 2015
Gallego FJ and Peedell S (2001) Using Corine Land Cover to map population density In
European Environment Agency ldquoTowards agri-environmental indicators Integrating
statistical and administrative data with land cover informationrdquo Copenhagen pp 94ndash
105
Gallego FJ Batista F Rocha C and Mubareka S (2011) Disaggregating population density
of the European Union with CORINE Land Cover International Journal of Geographical
Information Science 25(12) 2051ndash2069
Goodchild MF (2007) Citizens as sensors the world of volunteered geography GeoJournal
69 (4) 211ndash221
Goodchild MF Guo H Annoni A et al (2012) Next Generation Digital Earth Proceedings of
the National Academies of Science 109(28) 11088ndash11094
Jiang S Alves A Rodrigues F et al (2015) Mining point-of-interest data from social
networks for urban land use classification and disaggregation Computers Environment
and Urban Systems In press
Lavalle C Baranzelli C Batista e Silva F et al (2011) A high resolution land usecover
modelling framework for Europe ICCSA 2011 Part I LNCS 6782 60ndash75
Lavalle C Batista e Silva F Baranzelli C et al (2016) Land Use and Scenario Modeling for
Integrated Sustainability Assessment in J Feranec et al (eds) European Landscape
Dynamics CORINE Land Cover Data CRC Press - Taylor amp Francis Group pp 237-262
Martin D Cockings S and Leung S (2010) Progress report 24-hour gridded population
models Proceedings of European Forum for Geostatistics 2010 Tallinn Estonia
Martin D Cockings S and Leung S (2015) Developing a Flexible Framework for
Spatiotemporal Population Modeling Annals of the Association of American
Geographers 105(4) 754ndash772
McPherson TN and Brown MJ (2004) Estimating daytime and nighttime population
distributions in US cities for emergency response activities In Symposium on Planning
Nowcasting and Forecasting in the Urban Zone 84th AMS Annual Meeting AMS Seattle
2004
Patel NN Stevens FR Huang Z et al (2016) Improving Large Area Population Mapping
Using Geotweet Densities Transactions in GIS
Pesaresi M and Ehrlich D (2009) A methodology to quantify built-up structures from optical
VHR imagery In Gamba P and Herold M (eds) Global Mapping of Human Settlement
Experiences Datasets and Prospects Boca Raton FL USA CRC Press ch 3 pp 27ndash
58
Pesaresi M Guo H Blaes X et al (2013) A Global Human Settlement Layer from optical
HRVHR RS data Concept and first results IEEE J Sel Topics Appl Earth Observ
Remote Sens 6(5) 2102-2131
21
Smith A Martin D and Cockings S (2016) Spatio-Temporal Population Modelling for
Enhanced Assessment of Urban Exposure to Flood Risk Applied Spatial Analysis and
Policy 9(2) 145-163
Smith A Newing A Quinn N et al (2015) Assessing the impact of seasonal population
fluctuation on regional flood risk management ISPRS International Journal of Geo-
Information 4(3) 1118-1141
Spyratos S Lutz M and Pantisano F (2014) Characteristics of Citizen-contributed
Geographic Information in Huerta Schade Granell (eds) Connecting a Digital Europe
through Location and Place Proceedings of the AGILE 2014 International Conference on
Geographic Information Science Castellon Spain
Steenbrugger J Tranos E and Nijkamp P (2014) Data from Mobile phone operators A tool
for smarter cities Telecommunications Policy 39(3-4) 335-346
Tatem AJ Huang Z Narib C et al (2014) Integrating rapid risk mapping and mobile phone
call 545 record data for strategic malaria elimination planning Malaria journal 13(52)
Wu SS Qiu X and Wang L (2005) Population estimation methods in GIS and remote
sensing A review GIScience and Remote Sensing 42(1) 80ndash96
22
List of abbreviations and definitions
CLC CORINE Land Cover
CLC-R CORINE Land Cover ndash Refined
EC European Commission
EFTA European Free Trade Association
EPRTR European Pollutant Release and Transfer Register
ESM European Settlement Map
GIS Geographical Information Systems
JRC Joint Research Centre
LULC Land useland cover
MMU Minimum Mapping Unit
MPOD Mobile Phone Operator Data
NACE Nomenclature Statistique des activiteacutes eacuteconomiques dans la Communauteacute
europeacuteenne
NSI National Statistical Institute
NUTS Nomenclature of Territorial Units for Statistics
OSM OpenStreetMap
VGI Volunteered Geographic Information
23
List of figures
Figure 1 Area of interest of ENACT 11
Figure 2 Schedule of main phases and tasks and units involved 12
Figure 3 Workflow and interlinkages between the projectrsquos main phases 13
Figure 4 Population density in 8102015 derived from mobile phone operator data
(Proximus) in Belgium at 1 km resolution 15
24
List of boxes
Box 1 Why mapping spatiotemporal population is a big challenge 6
Box 2 ENACTrsquos methodology in brief 8
25
List of tables
Table 1 Main expected specifications of output datasets 10
Table 2 State of the work 14
26
Annexes
Annex 1 Literature review
The table below provides an overview of previous efforts in spatiotemporal population
modelling using mostly conventional data sources (ie excluding studies using mobile
phone data social media and other lsquobig datarsquo sources)
Publication
(Authors
and year)
Main application
objective
Temporal
resolution
Spatial
resolution Study area
Proxies for
population
allocation
Method
McPherson
amp Brown
2004
Emergency
response
(manmade disaster
- release of
hazardous
material)
Night-time
Daytime 250 m USA
StreetMap USA
ESRIGDT 1998
NAVTEC Premium
Streets Data State
Business Directory
Night-time population
disaggregation of
census data based on
road network Daytime
population worker
population
disaggregated based
on State Business
Directory + residual
residential population
Ahola et al
2007
Risk assessment
and damage
analysis (fire and
rescue services)
14 time
periods
Vector
based
(building
level)
Helsinki
(centre)
Finland
Buildings Enterprise
and agency data
related to buildings
Person traffic data
Shopping centres
Kindergartens
Schools Central
traffic buildings
Disaggregation into
point locations using a
matrix of weights (per
population subgroup
and time period)
includes expert
knowledge based
weights
Bhaduri et
al 2007
Enhancing the
temporal resolution
of population
distribution data in
the US (general
purpose)
Night-time
Daytime
3 arc
seconds
(~90 m)
USA
Roads Railroads
Airports Large Area
Landmarks Water
Recreation Areas
Retail Centers
National Land Cover
Data Elevation
Data Education
Employment Jails
and prisons Aerial
imagery
Disaggregation into
cells based on
modelled cumulative
weights Methodology
includes extensive
manual checking and
refinement
Aubrecht et
al 2014
Social impact
evaluation in crisis
management
Quasi
continuous
(1 hour
step)
100 m Baden Austria
Land use Land
cover (national data
CORINE Urban
Atlas) Street
network Building
layer
DynaPop model ndash
three components of
population (Home
Commuting Work)
disaggregated from
census zone level to
grids using a set of
spatial and temporal
weights
Freire et al
2015
Assessment of
human exposure to
volcanic hazard
Night-time
Daytime 50 m Naples Italy
Urban Atlas
European settlement
map LandScan
Census tracts
Night-time population
disaggregation of
census data based on
land use Daytime
population derived
using commuting
ratios + estimated
27
residual residential
population
Martin et al
2015
Proposal and
implementation of
a flexible
framework for
spatiotemporal
population
modeling
Quasi
continuous
(15 min
step)
200 m Southampton
UK
Residential locations
Prisons Care
homes Workplaces
Schools
Universities
Hospitals Roads
SurfaceBuilder 247 ndash
variable kernel density
estimation several
ageactivity based
population subgroups
are redistributed
across space subject
to a series of weights
constraints and
temporal profiles
Smith et al
2015
Assessment of
human exposure to
flood risk in a
coastal touristic
region
Quasi
continuous
(1 h step)
100 m St Austell area
UK
Centroids
representing
residential locations
Centroids
representing places
of work study
leisure healthcare
and retail Roads
Smith et al
2016
Assessment of
urban exposure to
flood risk
Quasi
continuous
(2 h step)
200 m Southampton
UK
28
Annex 2 CLC-R nomenclature for lsquoArtificial surfacesrsquo
Brief description examples
111 Continuous urban
fabric
1111 Dense urban fabric
1121 Medium density urban fabric
1122 Low density urban fabric
1123 Very low density or isolated urban
fabric
1211 Industry Manufacturing facilities refineries large farm
buildings
1212 Energy production water supply
waste management
Power plants (non-renewable and renewable)
water supply waste management and treatment
plants
1213 Commerce and private services Wholesale retail and business areas office
buildings exposition sites research facilities
food and beverage services (eg bars and
restaurants)
1214 Public administration defense
and social facilities
Large facilities related to health care education
public administration security law and order
services military barracks
1215 Cultural facilities Arts and cultural facilities (eg museums
libraries theaters) monuments places of
worship
1221 Road network Main road network (consisting of motorways and
other main national links)
1222 Rail network Wide rail segments
1223 Train or ferry stationTrain or ferry stations terminals
1224 Other road and rail associated land
Eg rest areas service stations
123 Port areas See CLC nomenclature illustrated guide
1241 Airport terminals and associated
buildingsAirport terminals and associated buildings
1242 Airport runway and associated
landAirport runway and associated land
131 Mineral extraction
sites
132 Dump sites
133 Construction sites
141 Green urban areas
1421 Sport and leisure greenOther artificial green areas (typically surrounding
sport and leisure facilities) Includes golf courses
1422 Sport and leisure built-up Built-up areas related to sports and leisure
activities (eg stadiums sports halls zoos luna
parks)
1423 Touristic accomodation Hotels and similar accomodations campingtrailer
sites
Predominantly residential areas at different
degrees of horizontal building density High
density areas particularly in the centre of cities
may be characterized by mixed land uses (eg
residential commercial public services)
Level 1 Level 2 Level 3 Level 4
1 Artificial
surfaces
11 Urban fabric
124 Airports
12 Industrial
commercial and
transport units
121 Industrial or
commercial units
122 Road and rail
networks and
associated land
See CLC nomenclature illustrated guide
14 Artificial non-
agricultural
vegetaged areas
13 Mine dump and
construction sites
112
Presence in CLC-R v2 to be determined
Present in CLC-R v2
Present in CLC-R v1
No further level 4 expected
142 Sport and leisure
facilities
Discontinuous urban
fabric
29
Annex 3 Classification of economic activities (NACE rev 2)
A Agriculture forestry and fishing
B-E Industry
F Construction
G-J Wholesale and retail trade transport accommodation and food service activities information and communication
K-N Financial and insurance activities real estate activities professional scientific and technical activities administrative and support service ahellip
O-U Public administration and defence compulsory social security education human health and social work activities arts entertainment and recreationhellip
A Agriculture forestry and fishing
BDE Mining and quarrying electricity gas steam and air conditioning supply water supply sewarage waste management and remediation activities
C Manufacturing
F Construction
GHI Wholesale and retail trade transport and storage accomodation and food service activities
J Information and communication
K Financial and insurance activities
L Real estate
MN Professional scientific and technical activities administrative and support service activities
OPQ Public administration defence education human health and social work activities
RSTU Arts entertainment and recreation other service activities activities of household and extra-territorial organizations and bodies
A Agriculture forestry and fishing
B Mining and quarrying
C Manufacturing
D Electricity gas steam and air conditioning supply
E Water supply sewerage waste management and remediation activities
F Construction
G Wholesale and retail trade repair of motor vehicles and motorcycles
H Transportation and storage
I Accommodation and food service activities
J Information and communication
K Financial and insurance activities
L Real estate activities
M Professional scientific and technical activities
N Administrative and support service activities
O Public administration and defence compulsory social security
P Education
Q Human health and social work activities
R Arts entertainment and recreation
S Other service activities
T Activities of households as employers u0ndifferentiated goods- and services-producing activities of households for own use
U Activities of extraterritorial organisations and bodies
6 sectors
11 sectors
21 sectors
30
Annex 4 Short description of the CLC Refined 2012 (v10)
Prepared by Filipe Batista e Silva and Konstantin Rosina
Document version November 2016
Introduction
The CORINE Land Cover (CLC) is a European land useland cover (LULC) mapping project
initiated in the mid-1980rsquos The first inventory was released for the reference year 1990
and subsequent updates have been produced for the reference years 2000 2006 and
20126 The CLC is produced under the coordination of the European Environment Agency
(EEA) using a common LULC nomenclature mapping specifications and methodologies
meant to ensure a high degree of comparability across time and countries covered thus
making it a reference and widely used data source for LULC information in Europe
CLC however is characterized by a relatively coarse minimum mapping unit (MMU) of 25
hectares for all LULC categories which is a limiting factor for applications requiring a finer
detection of LULC patterns Another key limitation particularly for applications related to
urban areas population and economic activity concerns the low thematic resolution for
artificial LULC classes The European Commission Joint Research Centre (JRC) has been
engaged in developing and implementing a methodology to address the above-mentioned
limitations of CLC so to release an enhanced European LULC map labelled ldquoCLC refinedrdquo
(CLC-R) This work is conducted by JRCrsquos own initiative as an element of its work
programme
As its name indicates the CLC-R 2012 (v10) is an enriched version of CLC 2012 with a
significantly higher spatial resolution of 1 hectare for artificial LULC categories and at least
5 hectares for non-artificial ones The methodology is based on the integration of LULC-
relevant information from multiple CLC 2012-compatible geodata sources (particularly the
Copernicus ldquoHigh Resolution Layersrdquo amongst others) A forthcoming version of CLC-R
2012 (v20) expected by mid-2017 will address the improvement of the thematic detail
of CLC 2012 namely by breaking down CLCrsquos LULC category ldquo121 ndash Industrial or
commercial sitesrdquo into various sub-classes linked to specific socio-economic sectors The
work herein referred follows and expands upon previous experience of refining the CLC
20067
The remainder of the document covers the main objectives concerning the production of
CLC-R 2012 its main characteristics input data and methodological steps A more
thorough description of the methodology is under preparation and will be published as a
JRC Technical Report
Objectives
The main objective set for CLC-R 2012 (v10) was the increase of CLCrsquos spatial resolution
(ie reduction of the minimum mapping unit) while preserving the thematic detail and
definitions of CLC Another objective was to attain a more detailed and consistent
6 For more info on CLC family of products httplandcopernicuseupan-europeancorine-land-cover 7 Batista e Silva F Lavalle C Koomen E (2013) A procedure to obtain a refined European land usecover map
Journal of Land Use Science 8(3) 255-283
31
classification of the 11X - Urban fabric classes using an unambiguous quantitative
approach to identify urban fabric of different densities
The immediate usage of the CLC-R 2012 within the JRC is twofold
- To be used as base map in LUISArsquos territorial modelling platform8
- To be used as input to the ENACT JRC exploratory project aiming at the
enhancement of activity and population mapping
The CLC 2012 refined (v10) can in addition be used for a wide range of other purposes
and applications within the JRC and elsewhere
Main characteristics of CLC-R 2012
Spatial resolution Minimum mapping unit of ~5 hectares (1 ha for artificial surfaces and
for all LULC classes in areas covered by the Urban Atlas dataset ndash European Functional
Urban Areas (FUAs) above 50000 inhabitants) Width of linear features of ~20 m Cell size
= 100 x 100 metres
Thematic resolution Same as in CLC 2012 with the following additional LULC classes 410
- Inland wetlands (a union of 411 - Inland marshes and 412 - Peatbogs) 113 - Urban
fabric low density (10-30 built-up) 114 - Urban fabric very low density and isolated
(lt10 built-up) 143 - Leisure and touristic built-up
Geographical coverage EU28 + EFTA + Western Balkans + Turkey including Islands
Azores Canary Islands Madeira Ceuta and Melilla and excluding French overseas
territories
Reference year 2012
File format Unsigned 8-bit raster file (available as GeoTIFF and File GeoDatabase Raster
Dataset)
Input Data
The CLC-R 2012 (v10) is a composite map whereby information from multiple geodata
sources has been integrated with the original CLC 2012 in a sequential order following
certain rules and criteria (see methodology section below) Input data sources have been
harvested from and selected based upon the compliance with following criteria
Compatibility with CLCrsquos LULC nomenclature (LULC class definitions)
Reference year 2012 +- 2
Higher spatial resolution than CLC 2012
Pan-European geographical coverage
Preferably free open and documented data
The input data sources are listed below
CLC products CLC 2012 v 185 CLC Changes 2006-2012 and CLC Changes 2000-
2006
8 For more info on LUISA territorial modelling httpseceuropaeujrcenluisa
32
Copernicus high resolution (HR) layers 2012 HR layer Forest type + Tree cover
density HR layer Permanent water bodies HR layer Wetlands
TomTom Multinet 2014 Land Use layer + Built-up layer
JRCrsquos European Settlement Map (ESM) (10m version aggregated to 100 m
reference grid)
Urban Atlas 2012 All available FUAs by October 2016 (580)
OpenStretMap (OSM) and TomTom Multinet 2014 as source of road network data
Methodology
The methodology consisted of a sequential integration of LULC information from multiple
geodata sources into the original CLC 2012 map At each step of the sequence specific
input data layers were used to recode the grid cells with which they overlaid spatially
following pre-established decision rules Each step typically deals with the integration of
one particular data input from the above mentioned sources
The order of the sequence is determined by the degree of spatial detail and accuracy of
the data source at hand (the more detailed and accurate the later in the sequence) or by
other logical considerations (eg linear features are added later in the process due to less
strict MMU) Each step is automatized as a separate GIS tool The table below describes
the main steps of the workflow
Step Input data
source Description of procedure
Affected
LULC classes
1 CLC change maps Selected CLC change patches that were not included into CLC2012 map due to generalization rules are
added
All
2 Copernicus High resolution layers
A threshold of 50 is applied to the continuous pixel values (ie the respective class must cover the majority of pixel to be considered) A MMU of 5 contiguous pixels is applied
31X 41 51X
3
TomTom Multinet
2014 ndash Land Use
layer
Land use information from TomTom are added A look-up table is used to establish the relationship between the TomTom and CLC nomenclatures Vector polygons are rasterized using Maximum
Combined Area criterion Applied MMU = 1 pixel ie individual pixels are included
121 122
123 124
141 142
4 European Settlement Map
First a 100 m raster coincident with EEA reference grid is derived from the original 10 m version Pixels overlapping non-residential artificial classes are excluded as are the pixels under minimum building density threshold (empirically derived value of 5)
Applied MMU = 1 pixel ie individual pixels are included
11X
5 Urban Atlas 2012 Vector polygons are rasterized using Maximum Combined Area criterion a decision matrix (original CLC class vs urban atlas class) is used to establish
All
33
the final classification of overlapping pixels Applied
MMU = 1 pixel ie individual pixels are included
6 European Settlement Map
The general 11X class lsquourban fabricrsquo is differentiated into 4 classes according to the underlying building density (based on ESM data) ndash 111 - dense 112 -
medium density 113 - low density 114 - very low density or scattered built-up
11X
7
HR layer Permanent water bodies + OSM and TomTom Multinet 2014 ndash Road networks
Linear features such as rivers and mains roads are included The inclusion of linear features obeys to less restrictive thresholds of within-pixel cover so to preserve as much as possible the spatial contiguity
of these features (in view of their distinct function and importance in structuring and fragmenting the territory) However within artificial areas linear
features are included only when the percentage covered is larger than that of building cover
122 51X
8 European Settlement Map
Built-up areas in the class 142 - Sport and leisure
facilities are extracted as a separate class 143 - Leisure and touristic built-up
142 143
9 TomTom Multinet 2014 ndash Built-up layer
Areas pertaining to Local Administrative Units (LAU2) for which the amount of built-up is significantly lower than expected (given an empirical
relationship between size of the population and urban fabric surface) are refined by adding built-up areas from the TomTom built-up layer Added built-up areas are coded as 114 - very low density or isolated built-up
114
34
Nomenclature
Value Label
111 Urban fabric dense (gt 50 built-up)
112 Urban fabric medium density (30-50 built-up)
113 Urban fabric low density (10-30 built-up)
114 Urban fabric very low density and isolated (lt10 built-up)
121 Industrial or commercial units
122 Road and rail networks and associated land
123 Port areas
124 Airports
131 Mineral extraction sites
132 Dump sites
133 Construction sites
141 Green urban areas
142 Sport and leisure facilities
143 Leisure and touristic built-up
211 Non-irrigated arable land
212 Permanently irrigated land
213 Rice fields
221 Vineyards
222 Fruit trees and berry plantations
223 Olive groves
231 Pastures
241 Annual crops associated with permanent crops
242 Complex cultivation patterns
243 Land principally occupied by agriculture with significant areas of natural vegetation
244 Agro-forestry areas
311 Broad-leaved forest
312 Coniferous forest
313 Mixed forest
321 Natural grasslands
322 Moors and heathland
323 Sclerophyllous vegetation
324 Transitional woodland-shrub
331 Beaches dunes sands
332 Bare rocks
333 Sparsely vegetated areas
334 Burnt areas
335 Glaciers and perpetual snow
410 Inland wetlands
421 Salt marshes
422 Salines
423 Intertidal flats
511 Water courses
512 Water bodies
521 Coastal lagoons
522 Estuaries
523 Sea and ocean
New or redefined classes
35
For illustration purposes the figures below show the differences between the original CLC
2012 (top) and CLC-R 2012 (v10) (bottom) for the area surrounding the city of Turin
Italy
36
Annex 5 List of land use and activity data sources
Data source name Type Reference
date
Description
content
Use in ENACT
Bookingcom Web-service 2016 Location of hotels To reveal locations of
probable tourist
presence (night-time)
Copernicus High
resolution layers
Open public 2012 Spatial raster layers
describing forests
wetlands and water
bodies
Spatial refinement of
CLC
CORINE Land
Cover
Open public 2012 Land usecover map
with 44 classes
Base map for activity
mapping
European
Pollutant Release
and Transfer
Register (EPRTR)
Open public Location of polluting
industries and waste
treatment plants
Thematic refinement of
CLC
European
Settlement Map
Open public 2012 Density of built-up Spatial refinement of
CLC
EuroRegionalMap Proprietary Location of activities
(points of interest)
Thematic refinement of
CLC
National land use
maps
Public or
proprietary
2007-2012 Detailed land use maps
for the following
countriesregions
Portugal Spain
Wallonia Lombardia
The Netherlands
Provide training and
test subsets for the
thematic refinement of
CLC
OpenStreetMap Open VGI 2016 Location of activities
(points of interest)
Thematic refinement of
CLC
PLATTS Proprietary Location of power
plants
Thematic refinement of
CLC
TomTom Proprietary 2013 Location of activities
(land use polygons and
points of interest)
Road and rail
networks
Spatial and thematic
refinement of CLC
TripAdvisorcom Web-service 2016 Location of hotels
restaurants and
tourist attractions
To reveal locations of
probable tourist
presence (day- and
night-time)
Urban Atlas Open public 2012 Land use maps for
European Functional
Urban Areas
Spatial refinement of
CLC
Europe Direct is a service to help you find answers
to your questions about the European Union
Freephone number ()
00 800 6 7 8 9 10 11 () The information given is free as are most calls (though some operators phone boxes or hotels may
charge you)
More information on the European Union is available on the internet (httpeuropaeu)
HOW TO OBTAIN EU PUBLICATIONS
Free publications
bull one copy
via EU Bookshop (httpbookshopeuropaeu)
bull more than one copy or postersmaps
from the European Unionrsquos representations (httpeceuropaeurepresent_enhtm) from the delegations in non-EU countries (httpeeaseuropaeudelegationsindex_enhtm)
by contacting the Europe Direct service (httpeuropaeueuropedirectindex_enhtm) or calling 00 800 6 7 8 9 10 11 (freephone number from anywhere in the EU) () () The information given is free as are most calls (though some operators phone boxes or hotels may charge you)
Priced publications
bull via EU Bookshop (httpbookshopeuropaeu)
LF-N
A-2
8335-E
N-N
doi102791056071
ISBN 978-92-79-64588-4
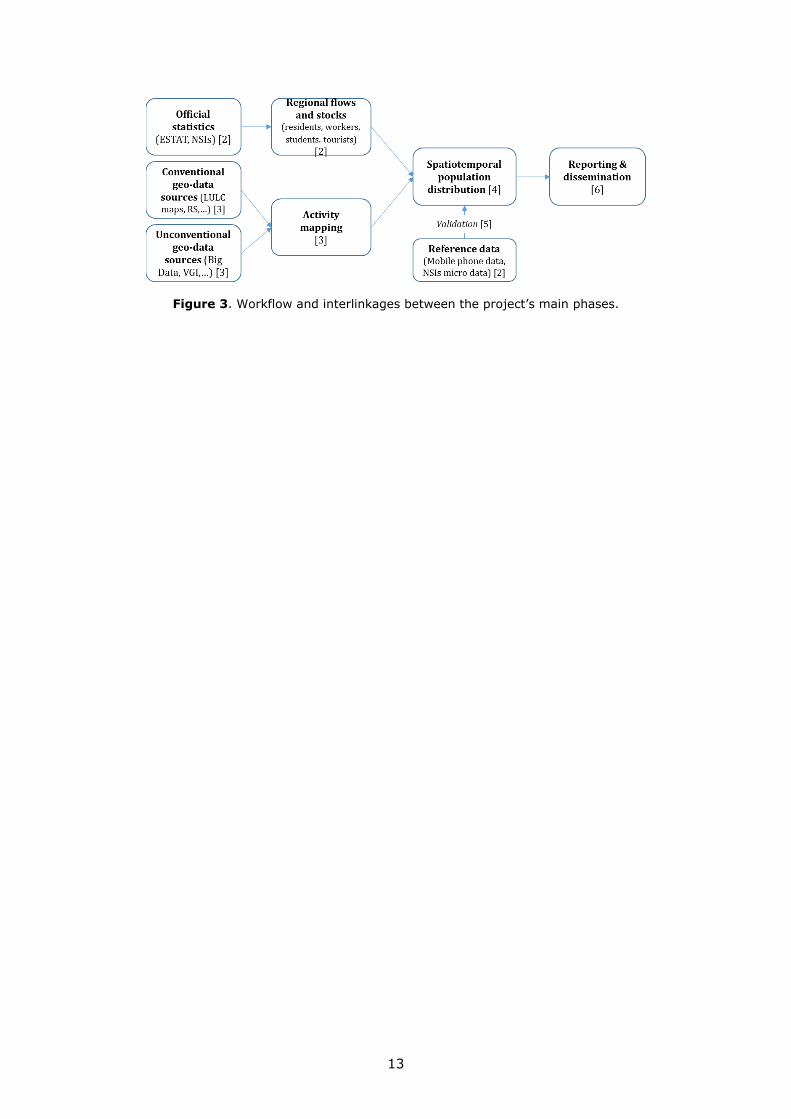
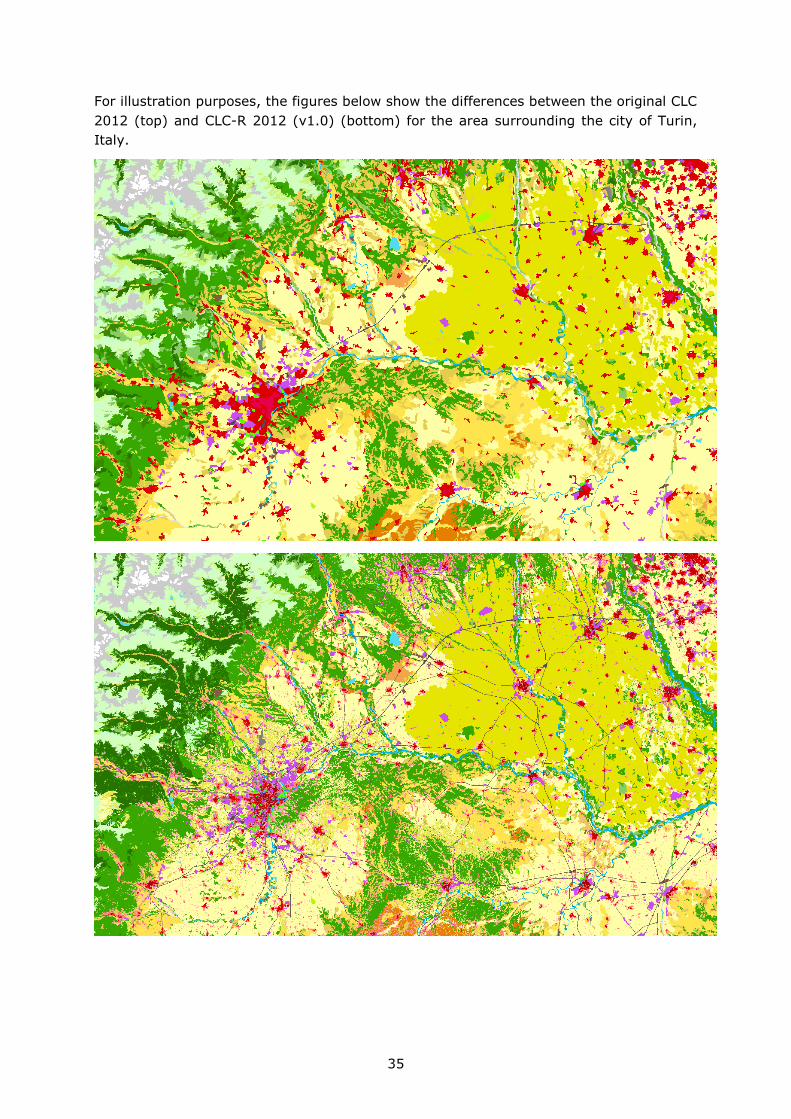

LF-N
A-2
8335-E
N-N
doi102791056071
ISBN 978-92-79-64588-4