Embed Size (px)
Citation preview
Analytical Biochemistry 400 (2010) 19–24
Contents lists available at ScienceDirect
Analytical Biochemistry
journal homepage: www.elsevier .com/locate /yabio
Enhancement on the Europium emission band of Europium chlortetracyclinecomplex in the presence of LDL
Luciane dos Santos Teixeira a, Andréa Nastri Grasso a, Andrea Moreira Monteiro b, A.M. Figueiredo Neto c,Nilson Dias Vieira Jr. a, Magnus Gidlund b, Lilia Coronato Courrol a,d,*
a Centro de Lasers e Aplicações, IPEN/CNEN-SP, Brazilb Instituto de Ciências Biológicas, USP, São Paulo, SP, Brazilc Instituto de Física, USP, São Paulo, SP, Brazild Depto de Ciências Exatas e da Terra–UNIFESP, Diadema/SP, Brazil
a r t i c l e i n f o
Article history:Received 26 August 2009Received in revised form 29 December 2009Accepted 24 January 2010Available online 1 February 2010
Keywords:LDLEuropiumFluorescenceBiosensor
0003-2697/$ - see front matter � 2010 Elsevier Inc. Adoi:10.1016/j.ab.2010.01.030
* Corresponding author. Address: Departamento dUniversidade Federal de São Paulo, UNIFESP, Campu275 Eldorado, CEP 09972-270, Diadema/SP, Brazil. Fa
E-mail address: [email protected] (L.C. Courrol).1 Abbreviations used: CAD, coronary artery disease; C
cline complex; EuTc, europium tetracycline; LDL, low-dcholesterol; MOPS, 3-(N-morpholino)propanesulfonic a
a b s t r a c t
Low-density lipoprotein (LDL) particles are the major cholesterol-carrying lipoprotein in the human cir-culation from the liver to peripheral tissues. High levels of LDL-Cholesterol (LDL-C) are known risk factorfor the development of coronary artery disease (CAD). The most common approach to determine the LDL-C in the clinical laboratory involves the Friedewald formula. However, in certain situations, this approachis inadequate. In this paper we report on the enhancement on the Europium emission band of Europiumchlortetracycline complex (CTEu) in the presence of LDL. The emission intensity at 615 nm of the CTEuincreases with increasing amounts of LDL. This phenomenon allowed us to propose a method to deter-mine the LDL concentration in a sample composed by an aqueous solution of LDL. With this result weobtained LDL calibration curve, LOD (limit of detection) of 0.49 mg/mL and SD (standard deviation) of0.003. We observed that CTEu complex provides a wider dynamic concentration-range for LDL determi-nation than that from Eu–tetracycline previously. The averaged emission lifetimes of the CTEu and CTEuwith LDL (1.5 mg/mL) complexes were measured as 15 and 46 ls, respectively. Study with some metallicinterferents is presented.
� 2010 Elsevier Inc. All rights reserved.
Introduction
Due to the hydrophobic/hydrophilic characteristics of somemolecules like lipids and sterols, essential to the cellular metabo-lism, they are not directly transported by blood in the human cir-culatory system. To overcome this difficulty the organismdeveloped nanoparticles, known as lipoproteins. These particlescan be characterized and classified by their size, density, flotationconstant and electrophoretic mobility. The low-density lipoprotein(LDL)1, which comprises almost spherical particles of about 20 nmdiameter, is the main carrier of cholesterol from the liver to the bodytissues. The structure of the LDL has two well-defined regions, a coreand a surface layer [1]. The outer shell is composed by phospholip-ids, unesterified cholesterol and the apolipoprotein B-100, whichacts as a ligand for cell membrane receptors. The inner core is
ll rights reserved.
e Ciências Exatas e da Terra,s Diadema, Rua Arthur Ridel,x: +55 11 3133 9374.
TEu, europium chlorotetracy-ensity lipoprotein; LDL-C, LDLcid.
composed, mainly, by cholesterol esters and triglycerides [2]. Studieshave demonstrated that the LDL retention in the extracellular matrixof the arterial wall triggers a cascade the pro-atherogenic events,such as LDL oxidation [3,4]. In addition, these studies have shownthat oxidation of human LDL is involved in the development and pro-gression of atherosclerosis plaque. The rupture the atheroscleroticplaque causes exposure of blood to procoagulant material and, con-sequently, immediate and massive thrombosis. This process leads toserious or fatal cardiovascular events, including myocardial infarc-tion and ischemic strokes [5].
According to the American Heart Association, normal levels oftotal cholesterol are below of 200 mg/dL, while concentrationsabove of 240 mg/dL are high-risk factors for coronary artery dis-ease (CAD) [6]. A high level of LDL-Cholesterol (LDL-C) (130 mg/dLand above) reflects an increased risk of CAD. Therefore, the concen-tration of LDL-C has become one of the main parameters to bedetermined in routine clinical diagnosis for therapeutic goals.
A number of tools are available to assess the concentration ofLDL-C in the human blood [7]. Measurement of LDL-C requires sep-arating LDL particles in serum from other lipoprotein, followed bymeasuring the cholesterol amount in the LDL fraction. Because thecomplexity of the method, however, it is not suitable for use in the
20 LDL quantification by Europium Chlortetracycline / L.d.S. Teixeira et al. / Anal. Biochem. 400 (2010) 19–24
routine clinical laboratory or even in most research laboratory.Thus, the most used lipid profile assay does not quantify theLDL-C concentration directly but, instead, estimates it by usingthe Friedewald formula [5,8]. This is done, indirectly, through themeasurement of the amount of total cholesterol, triglyceridesand the high-density lipoprotein (HDL) in the plasma. Despitethe Friedewald formula provides a reasonable quantification ofthe LDL-C in most situations, there are several limitations to thismethod [8]. Most notably samples must be obtained after 12–14 h fast. Moreover, LDL levels cannot be calculated if the concen-tration of triglyceride in the plasma is higher than 4.52 mmol/L(equivalent to 400 mg/dL). Still, for LDL concentration levels from2.5 to 4.5 mmol/L, this formula is considered to be inaccurate[2,9]. Moreover, some authors have demonstrated that this for-mula cannot be used in patients with diabetes mellitus, and pa-tients with liver or kidney disease [10].
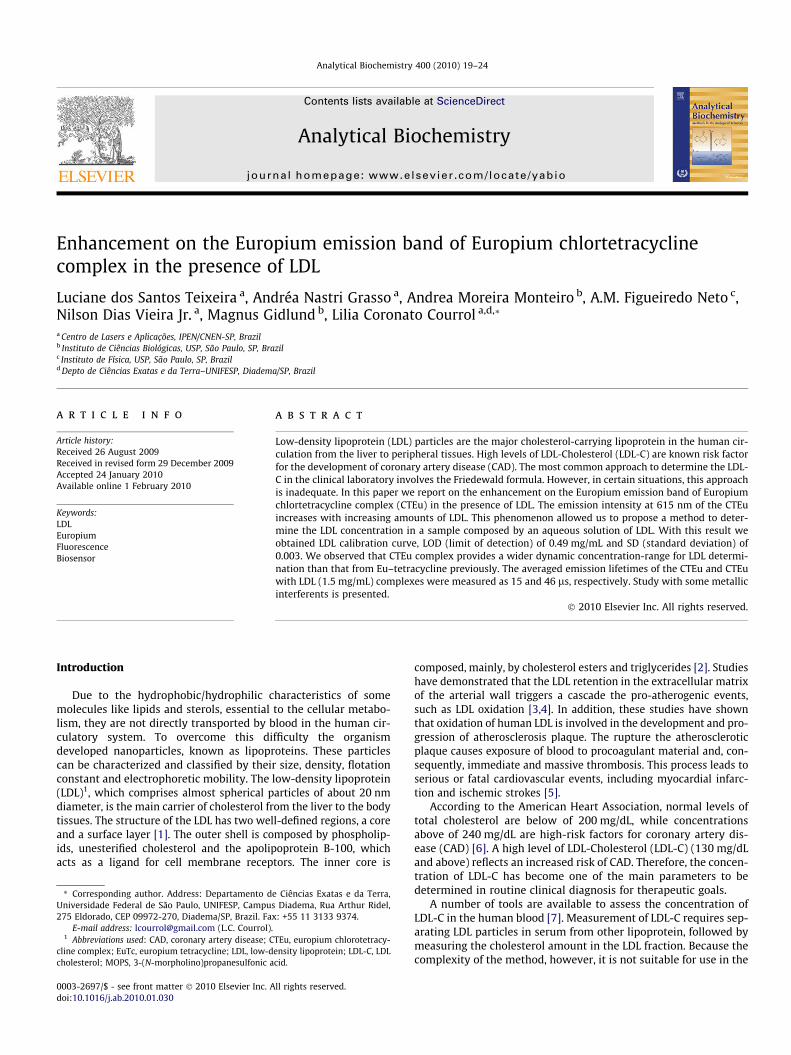
Chlortetracycline is a member of the tetracycline group ofbroad-spectrum antimicrobial drugs used to treat bacterial infec-tions in animals, and was the first tetracycline to be discovered[11–13]. Tetracycline and Chlortetracycline molecules, shown inFig. 1, comprise a linear fused tetracyclic nucleus (rings designatedby A–D). The tetracyclines are strong chelating agents. Chelationsites include the b-diketone (positions 11 and 12) and the enol(positions 1 and 3) and carboxamide (position 2) groups of the Aring [14]. Europium trivalent ions can form complexes with tetra-cyclines [15–21]. When Europium tetracycline is excited in awavelength resonant with the tetracyclines absorption band, Euro-pium ion luminescence is observed. This is due to the ligand broadabsorption and an antenna-effect [18] that transfers the absorbedenergy to the Europium through an intramolecular process. Theion luminescence may be enhanced by the isolation that the ligandprovides from the water molecules, preventing energy transfer tothem. The Europium–tetracycline complex (TcEu) has an absorp-tion band at 400 nm, emission around 615 nm and a largeStokes-Shift (approximately 210 nm) [22–24]. It was shown thatthe Europium luminescence of Europium–tetracycline (EuTc) com-plex increases in the presence of LDL [18,25–27]. This increase wasassociated to the capability of EuTc to displace water moleculesfrom the Europium neighborhood. These characteristics make thecomplex highly sensitive and specific for determining the LDL con-centration in a sample. In this paper we study another member oftetracyclines family, the chlortetracycline, complexed with Euro-pium, verifying the possibility to use this complex to quantifythe LDL in a sample. The presence of some metallic species in thesamples, sometimes present in the plasma, was also investigated.
Materials and methods
Isolation of LDL
Blood was drawn from healthy fasting (12 h) normolipidemicblood-donor volunteers, and plasma was obtained after centrifuga-tion at 1000g and at 4 �C, during 15 min. Thereafter were addedbenzamidine (2 mM), gentamicin (0.5%), chloramphenicol
Fig. 1. Tetracycline (a) and chlo
(0.25%), phenyl-methyl-sulfonyl-fluoride (PMSF) (0.5 mM), andaprotinin (0.1 unit/mL). LDL (1.006 < d < 1.063 mg/mL) was iso-lated by sequential ultracentrifugation, as described by Havelet al. [28] at 100,000g, at 4 �C, using a 75 Ti rotor (Beckman Instru-ments), and thereafter dialyzed at 4 �C against phosphate bufferedsaline (PBS) pH 7.4, with 0.01% ethylenediaminetetraacetic acid(EDTA). The LDL was sterilized via filtration through a 0.22 lm-pore filter (Milipore – German). The lipoprotein concentrationwas quantified using the BCA kit (PIERCE) using bovine serum(BSA) as standard.
Europium chlortetracycline solutions
The Europium chlortetracycline (CTEu) complexes were pre-pared starting from inorganic salts with analytical purity, from Sig-ma Aldrich and Molecular Probe. All solutions were prepared in10 mmol/L 3-(N-Morpholino) propanesulfonic acid (MOPS, fromCarl Roth) buffer, at pH = 6.9. The tetracycline hydrochlorides usedare from Sigma–Aldrich. The prepared solutions were:
Solution I: Buffer solution: 2.09 g of MOPS in 1000 mL distillatedwater (pH was adjusted to 6.9).
Solution II: To prepare different molar-rate solutions werenecessary:
� 21 lmol L�1 Eu3+ solution; 0.0079 g of EuCl3�6H2O in10 mL ofsolution I.
� 31.5 lmol L�1 Eu3+ solution; 0.0115 g of EuCl3�6H2O in 10 mL ofsolution I.
� 42 lmol L�1 Eu3+ solution; 0.0154 g of EuCl3�6H2O in 10 mL ofsolution I.
� 52.5 lmol L�1 Eu3+ solution; 0.0192 g of EuCl3�6H2O in 10 mL ofsolution I.
� 63 lmol L�1 Eu3+ solution; 0.0231 g of EuCl3�6H2O in 10 mL ofsolution I.
� 73.5 lmol L�1 Eu3+ solution; 0.0269 g of EuCl3�6H2O in 10 mL ofsolution I.
� 84 lmol L�1 Eu3+ solution; 0.0307 g of EuCl3�6H2O in 10 mL ofsolution I.
Solution III: 21 lmol L�1 of chlortetracycline in 10 mL of solu-tion I.
Solution IV: CTEu: Mix of 10 mL of Solution II with 10 mL of solu-tion III, and MOPS to complete 100 mL.
Solution VI: CTEu-LDL: 1 mL of solution IV and 10 lL of LDL.
Optical characterization
The absorption spectra of all samples were measured in thewavelength range 200–500 nm, at room temperature, using a Var-ian Cary 17D Spectrometer. The emission spectra were obtained byexciting the samples, placed inside a 1 mm optical-path cuvette.The emission spectra were obtained by exciting the samples(placed in a 1 mm optical-path cuvette) with a 150 W Xe lamp,at 405 nm. The emission spectra of the samples were analyzedwith a 0.5 m monochromator (Spex) and a PMT detector. The signal
rtetracycline (b) molecules.

a
LDL quantification by Europium Chlortetracycline / L.d.S. Teixeira et al. / Anal. Biochem. 400 (2010) 19–24 21
was amplified with an EG&G 7220 lock-in and processed by a com-puter. The relative errors in the measurements are estimated to be<5%. The emission lifetime of the samples were analyzed with a Jo-bin Yvon, Fluorolog 3, from Horiba. All measurements were madeat room temperature.
To study the effect of the presence of metallic-species in thesamples, CTEu:LDL(2 mg/dL) solutions were mixed with aqueousstandards of Cu, Co, Mn,Zn, Mg, Fe, Ca, Ni, Al and Ag, at concentra-tions usually found in the plasma [29–31]. The light intensitiesmeasured were normalized as a function of the CTEu:LDL emissionlight intensity.
b
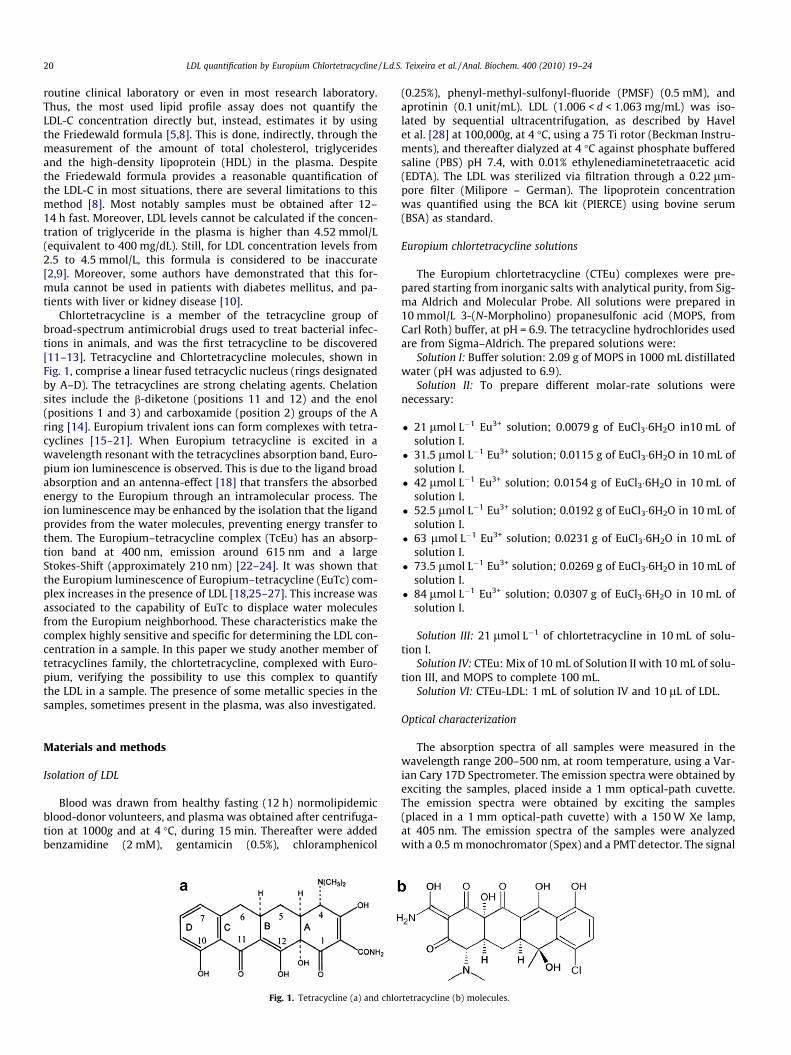
Fig. 3. (a) Europium emission spectra for different molar ratios of CTEu complex.(b) Europium emission intensity as a function of Eu:CT molar ratio.
a
b
Results and discussions
The absorption spectra results obtained with solutions I–IV areshown in Fig. 2. It can be observed that solutions I and II do notpresent absorption bands in the visible region. Solution III (i.e.,chlortetracycline solution) presents absorption bands at 230, 276and 370 nm. In the case of solutions IV (i.e., chlortetracycline Euro-pium–CTEu solutions) prepared by fixing the chlortetracyclineconcentration (21 lmol L�1) and varying the Europium concentra-tion from 21 to 84 lmol L�1, we verified a shift of the chlortetracy-cline absorption bands to 239 and 401 nm, indicating thecomplexation of Europium ions by chlortetracycline. Solutionswith molar ratios of 2.0 Eu:1.0 CT and 1.5 Eu:1.0 CT presented anincrease of the absorption band intensity when compared to thosefrom other molar-ratio solutions.
The Europium emission spectra (sample excited with light of401 nm) showed that solutions with 1.0 Eu:1.0 CT molar ratios pre-sented the highest emission intensities (Fig. 3). Probably, higherEuropium-concentrated samples present strong auto-absorptionprocess, which masks the emission intensity profile. So, it is moreconvenient to use the molar ratio 1.0 Eu:1.0 CT.
The same study was performed with solutions where 1.75 mg/mLof LDL were added. A remarkable increase in the emission intensitywas observed with all the solutions (Fig. 4). However, solution withmolar ratio 1.5 Eu:1.0 CT presented the higher emission intensityand this molar ratio was used in our next experiments.
Fig. 5 shows the Europium emission spectra of CTEu complex inthe presence of different concentrations of LDL. The integratedareas below the fluorescence spectra bands were calculated and
Fig. 2. Absorption spectra of Europium solution (dashed curve), MOPS solution(thin continuous line), chlortetracycline solution (white circles) and CTEu solutionsin different molar, 1 Eu:1 CT; 1.5 Eu:1.0 CT; 2 Eu:1.0 CT; 2.5 Eu:1.0 CT; 3 Eu:1.0 CT;3.5 Eu:1.0 CT; 4 Eu:1.0 CT ratios (thick continuous lines).
Fig. 4. (a) Europium emission spectra for different molar ratios of CTEu complex,with LDL (1.75 mg/mL). (b) Europium emission intensity as a function of Eu:CTmolar ratio.
plotted as a function of the LDL concentrations, resulting in the cal-ibration curve shown in Fig. 6. The data (the integrated area – S – asa function of the LDL concentration – cLDL) showed a linear depen-dence S = a + b � cLDL. The linear coefficient (a = 0.017 ± 0.002) rep-resents the background of the experiment. The angular coefficient bwas found to be (0.0184 ± 0.0006 mL/mg). The LDL concentration(cLDL in mg/mL) of unknown samples may be calculated from thisequation since the value of the integrated area is experimentallydetermined. For these results it was possible to obtain the LOD(limit of detection) of 0.49 mg/mL and the SD (standard deviation)of 0.003.
In a previous work [32] we reported on the enhancement of theemission band in EuTc + LDL samples. Comparing those resultswith our present results, where the EuTc is substituted by theCTEu, we note that, despite the CTEu presents a less intense emis-sion signal, the differences between the emission spectra with and

Fig. 5. CTEu:LDL emission spectra as a function of the LDL concentration.
Fig. 6. CTEu:LDL calibration curve. Integrated area of the emission spectra as afunction of the LDL concentration. The solid line corresponds to a linear fit to theexperimental data.
Fig. 7. Europium emission lifetime measurement with and without the presence ofLDL.
22 LDL quantification by Europium Chlortetracycline / L.d.S. Teixeira et al. / Anal. Biochem. 400 (2010) 19–24
without the LDL are more evident. Moreover, the dynamic range inthe case of CTEu complex is bigger than that for EuTc. In the BCAkit, typically used to quantify LDL, individual proteins differ in theircolor responses, and this factor must be considered during proteinanalysis. In addition temperature, detergents, salts and variousbuffer components may affect the assay. For this reason we canconsider the CTEu:LDL method an alternative way to quantifyLDL-C.
Table 1Europium lifetime emission parameters obtained with the CTEu and CTEu:LDL solutions.
CTEuy = A1 � exp (�x/t1) + A2 � exp (�x/t2) + y0
Adj. R-square 1
Value Standard error
y0 86 10A1 2270 206t1 (ms) 0.050 0.003A2 84082 254t2 (ms) 1000 E�5 7 E�5
Lifetime sav ¼P
iAis2
iPiAisi¼ 15 l s
A study with some possible interferents, eventually present inactual solutions (e.g., contaminants) was also done and the resultsare shown in Table 1. We observe the decrease in the luminescenceintensity of the CTEu:LDL complex in aqueous solution with thepresence of Cu2+, Fe3+, Zn2+ and Co2. The luminescence of theCTEu:LDL complex is not affected by the presence of Mn2+ in con-centrations up to 0.2 lM, while Mg2+ and Al3+ have a weak effecton it.
Fig. 7 shows the Europium emission lifetime with and withoutthe presence of LDL in CTEu solutions. Generally, complex systemshave multiple fluorescent species, and hence, the fluorescenceintensity decay cannot be fitted to a single exponential function.This is the case of CTEu complex with and without the LDL. Oneneeds to use a multi-exponential function and, in that case, thefluorescence intensity decay equation becomes:
y ¼ y0 þ A1eð�t=s1Þ þ A2eð�t=s2Þ; ð1Þ
where Ai and si are the ith pre-exponential factor (amplitude) andthe lifetime in the multi-exponential decay, respectively. In the caseof multi-exponential decays, the average lifetime, which is propor-tional to the total area under the fluorescence decay curve, is de-fined by:
sav ¼P
iAis2iP
iAisið2Þ
The parameters obtained by fitting Eq. (1) to the decay curve ofCTEu:LDL solution are given in Table 2. The average lifetimes of thesamples are 15 and 46 ls for CTEu and CTEu with LDL (1.5 mg/mL),
CTEu:LDL (1.5 mg/mL)y = A1 � exp (�x/t1) + A2 � exp (�x/t2) + y0
Adj. R-square 0.99994
Value Standard error
y0 634 79A1 25174 997t1(ms) 0.06 0.002A2 61890 706t2(ms) 100 E�4 4 E�4
Lifetime sav ¼P
iAis2
iPiAisi¼ 46 l s
Table 2The luminescence of the CTEu:LDL(2 mg/mL) complex in the presence of interferents.
Complexes Emission intensityat 617 nm
I(EuCTc + LDL int.)/I(EuCTc + LDL)
EuCTc:LDL + (0.1 lM) Ni 7.80 E6 1.11EuCTc:LDL + (10 lg/L) Ag 7.70 E6 1.09EuCTc:LDL + (12 lM) Al 7.63 E6 1.09EuCTc:LDL (1.12 lM) Ca 7.35 E6 1.05EuCTc:LDL(1.5–2 mEq/L) Mg 7.15 E6 1.02EuCTc:LDL 7.00 E6 1.00EuCTc:LDL + (0.2 lM) Mn 7.01 E6 1.00EuCTc:LDL + (0.1 lM) Co 7.06 E6 1.00EuCTc:LDL + (20 lM) Zn 6.93 E6 0.99EuCTc:LDL + (60 lg/dL) Fe 6.57 E6 0.93EuCTc:LDL + (70 lg/dL) Cu 4.32 E6 0.62
LDL quantification by Europium Chlortetracycline / L.d.S. Teixeira et al. / Anal. Biochem. 400 (2010) 19–24 23
respectively. These results show that the fluorescence of theCTEu:LDL systems is less quenched by molecular oxygen than theCTEu complex.
Europium ions can occupy different sites in the chlortetracy-cline molecule. Europium emission present a long decay ratiowhen is located in the sites better blinded from water molecules.If Europium ions are in sites more exposed to energy transfer towater molecules, they have smaller decay time. For this reasonCTEu complex lifetime is well described by a two-exponential fit-ting-function. It is reasonable to assume that, when the complexis in the presence of LDL, some water molecules in the neighbor-hood of them are removed to form the hydration layer aroundthe lipoproteins. This process causes an increase of the amplitudeof the slower component (A1), and a decrease of the amplitude ofthe faster component (A2). This result may indicate that the sitethat initially has more probability to transfer energy to water mol-ecules was blinded by the LDL.
To explain the Europium emission enhancement of CTEu in thepresence of LDL, we suggest that water molecules in the solutioncontaining LDL are grouped around the polar hydroxyl groups ofthe LDL particles, isolating Europium ions connected to tetracy-cline molecules. With less water molecules in the vicinity of Euro-pium ions, the energy transfer to water molecules is minimized,and the energy is mainly kept in the Eu ions, increasing its lifetimeand luminescence intensity, resulting in a luminescence quantumyield enhancement [31].
Conclusions
A characteristic increase of the Europium emission in CTEucomplexes aqueous solution was observed in the presence of dif-ferent concentrations of LDL. A Job’s plot based determination ofCT:Eu stoichiometry was done and it was found that the solutionwith molar ratio 1.0 CT:1.5 Eu presented the higher emission andthis molar ratio was used in our experiments.
We verified that the CTEu complex emission intensity is smallerthan that of the EuTc complex previously studied. However, thedynamic range in the case of CTEu complex is bigger than that ofthe EuTc. From the calibration curve obtained it was possible tocalculate the LOD (limit of detection) of 0.49 mg/mL and the SD(standard deviation) of 0.003.
The average lifetimes of the CTEu and CTEu with LDL (1.5 mg/mL)complexes are 15 and 46 ls, respectively. These results show thatthe fluorescence of the CTEu:LDL systems is less quenched bymolecular oxygen than that from the CTEu complex.
We observed a decrease in the luminescence intensity of theCTEu:LDL complex in aqueous solution with the presence of Cu2+,Fe3+, Zn2+ and Co2. The luminescence of the CTEu:LDL complex isnot affected by the presence of Mn2+, while Mg2+ and Al3+ have aweak effect on it.
Acknowledgments
This study was supported by a grant from State of São Paulo Re-search Foundation (FAPESP), National Institute of Science andTechnology of Complex Fluids (INCT-FCx) and National Counselof Technological and Scientific Development (CNPq).
References
[1] S.L. Gomez, R.F. Turchiello, M.C. Jurado, P. Boschcov, M. Gidlund, A.M.F. Neto,Characterization of native and oxidized human low-density lipoproteins by theZ-scan technique, Chemistry and Physics of Lipids 132 (2004) 185–195.
[2] T. Hevonoja, M.O. Pentikainen, M.T. Hyvonen, P.T. Kovanen, M. Ala-Korpela,Structure of low density lipoprotein (LDL) particles: Basis for understandingmolecular changes in modified LDL, Biochimica Et Biophysica Acta: Molecularand Cell Biology of Lipids 1488 (2000) 189–210.
[3] K. Skalen, M. Gustafsson, E.K. Rydberg, L.M. Hulten, O. Wiklund, T.L. Innerarity,J. Boren, Subendothelial retention of atherogenic lipoproteins in earlyatherosclerosis, Nature 417 (2002) 750–754.
[4] J. Fan, H. Sun, M. Shiomi, S. Marcovina, T. Watanabe, Lipoprotein(a) inatherosclerosis: Bystander or actor?, Atherosclerosis Supplements 4 (2003) 268
[5] G.K. Hansson, P. Libby, The immune response in atherosclerosis: a double-edged sword, Nature Reviews Immunology 6 (2006) 508–519.
[6] L. Van Horn, N. Ernst, A summary of the science supporting the new NationalCholesterol Education Program dietary recommendations: What dietitiansshould know, Journal of the American Dietetic Association 101 (2001) 1148–1154.
[7] M. Okazaki, S. Usui, M. Nakamura, S. Yamashita, Evaluation of an HPLC methodfor LDL-cholesterol determination in patients with various lipoproteinabnormalities in comparison with beta-quantification, Clinica Chimica Acta395 (2008) 62–67.
[8] M. Nauck, G.R. Warnick, N. Rifai, Methods for measurement of LDL-cholesterol:A critical assessment of direct measurement by homogeneous assays versuscalculation, Clinical Chemistry 48 (2002) 236–254.
[9] A.D. Sniderman, D. Blank, R. Zakarian, J. Bergeron, J. Frohlich, Triglycerides andsmall dense LDL: the twin Achilles heels of the Friedewald formula, ClinicalBiochemistry 36 (2003) 499–504.
[10] J. Rubiesprat, J.L. Reverter, M. Senti, J. Pedrobotet, I. Salinas, A. Lucas, X. Nogues,A. Sanmarti, Calculated low-density-lipoprotein cholesterol should not beused for management of lipoprotein abnormalities in patients with diabetes-mellitus, Diabetes Care 16 (1993) 1081–1086.
[11] J. Donohue, K.N. Trueblood, M.S. Webster, J.D. Dunitz, Crystal structure ofaureomycin (chlortetracycline) hydrochloride – configuration, bond distancesand conformation, Journal of the American Chemical Society 85 (1963) 851.
[12] H. Welch, About the chemically descriptive generic terms for aureomycin(chlortetracycline) and terramycin (oxytetracycline), Antibiotics andChemotherapy 3 (1953) 659–662.
[13] W. Durckheimer, Tetracyclines – chemistry, biochemistry, and structure-activity relations, Angewandte Chemie: International Edition in English 14(1975) 721–734.
[14] I. Chopra, M. Roberts, Tetracycline antibiotics: Mode of action, applications,molecular biology, and epidemiology of bacterial resistance, Microbiology andMolecular Biology Reviews 65 (2001) 232.
[15] L.Z. Benet, J.E. Goyan, Thermodynamics of chelation by tetracyclines, Journal ofPharmaceutical Sciences 55 (1966) 1184.
[16] C. Coibion, P. Laszlo, Binding of the alkali-metal cations to tetracycline,Biochemical Pharmacology 28 (1979) 1367–1372.
[17] L.C. Courrol, F.R.D. Silva, L. Gomes, N.D. Vieira, Energy transfer study ofEuropium–tetracycline complexes, Journal of Luminescence 122 (2007) 288–290.
[18] L.C. Courrol, R.E. Samad, Applications of Europium tetracycline complex: areview, Current Pharmaceutical Analysis 4 (2008) 238–248.
[19] J. Georges, S. Ghazarian, Study of Europium-sensitized fluorescence oftetracycline in a micellar solution of Triton X-100 by fluorescence andthermal lens spectrometry, Analytica Chimica Acta 276 (1993) 401–409.
[20] L.M. Hirschy, T.F. Vangeel, J.D. Winefordner, R.N. Kelly, S.G. Schulman,Characteristics of the binding of Europium(III) to tetracycline, AnalyticaChimica Acta 166 (1984) 207–219.
[21] P. Izquierdo, A. Gomezhens, D. Perezbendito, Study of the EU(III)–tetracycline–thenoyltrifluoroacetone system by using the stopped-flow mixing technique –determination of tetracycline in serum, Analytica Chimica Acta 292 (1994)133–139.
[22] A. Duerkop, M. Turel, A. Lobnik, O.S. Wolfbeis, Microtiter plate assay forphosphate using a Europium–tetracycline complex as a sensitive luminescentprobe, Analytica Chimica Acta 555 (2006) 292–298.
[23] X.J. Liu, Y.Z. Li, Y.X. Ci, Time-resolved fluorescence studies of the interaction ofthe Eu3+ complexes of tetracycline analogues with DNA, Analytica ChimicaActa 345 (1997) 213–217.
[24] M. Schaferling, O.S. Wolfbeis, Europium tetracycline as a luminescent probefor nucleoside phosphates and its application to the determination of kinaseactivity, Chemistry: A European Journal 13 (2007) 4342–4349.
[25] F.R.D. Silva, A.M. Monteiro, A.M. Figueiredo, M.A. Gidlund, L. Gomes, N.D.Vieira, L.C. Courrol, Optical characterization of Europium tetracycline complex

24 LDL quantification by Europium Chlortetracycline / L.d.S. Teixeira et al. / Anal. Biochem. 400 (2010) 19–24
in the presence of Low Density Lipoprotein and its applications, in: N.U.Wetter, J. Frejlich (Eds.), 6th Ibero-American Meeting on Optics/9th Latin-American Meeting on Optics Lasers and Applications (RIAO/OPTILAS),Campinas, Brazil, 2007, pp. 749–754.
[26] F.R.D. Silva, R.E. Samad, L. Gomes, L.C. Courrol, Enhancement of Europiumemission band of Europium tetracycline complex in the presence ofcholesterol, Journal of Fluorescence 18 (2008) 169–174.
[27] F.R.D. Silva, A.M. Monteiro, A.M.F. Neto, M. Gidlund, N.D. Vieira, L.C. Courrol,Analytical quantification of low-density lipoprotein using Europiumtetracycline indicator, Luminescence 24 (2009) 189–193.
[28] R.J. Havel, H.A. Eder, J.H. Bragdon, Distribution and chemical composition ofultracentrifugally separated lipoproteins in human serum, Journal of ClinicalInvestigation 34 (1955) 1345–1353.
[29] R. Cornelis, Involvement of analytical chemistry in chemical speciation ofmetals in clinical samples, Annals of Clinical and Laboratory Science 26 (1996)252–263.
[30] G. Perrelli, G. Piolatto, Tentative reference values for gold, silver and platinum– literature data-analysis, Science of the Total Environment 120 (1992) 93–96.
[31] F.R. Alderman, H.J. Gitelman, Improved electrothermal determination ofaluminum in serum by atomic-absorption spectroscopy, Clinical Chemistry26 (1980) 258–260.
[32] L.C. Courrol, A.M. Monteiro, F.R.O. Silva, L. Gomes, N.D. Vieira, M.A. Gidlund,A.M.F. Neto, Novel fluorescent probe for low density lipoprotein, based on theenhancement of Europium emission band, Optics Express 15 (2007) 7066–7074.

![Enhancement of Tumor Regression by Coulomb …gold-loaded cells [5,6]. Therapeutic enhancement was be- lieved to have relevance to dose-enhancement effect from burst emission of low-energy](https://img.dokumen.tips/doc/110x75/5fd0b0ef4bf48276a7391d7a/enhancement-of-tumor-regression-by-coulomb-gold-loaded-cells-56-therapeutic.jpg)