Embed Size (px)
Citation preview

Engineering Lipid-stabilized Microbubbles for Magnetic Resonance Imaging guided Focused
Ultrasound Surgery
Jameel Adebayo Feshitan
Submitted in partial fulfillment of the requirements for the degree of
Doctor of Philosophy in the Graduate School of Arts and Sciences
COLUMBIA UNIVERSITY 2012

© 2012 Jameel Adebayo Feshitan
All rights reserved

ABSTRACT
Engineering Lipid-stabilized Microbubbles for Magnetic Resonance Imaging guided Focused Ultrasound Surgery
Jameel Adebayo Feshitan
Lipid-stabilized microbubbles are gas-filled microspheres encapsulated with a
phospholipid monolayer shell. Because of the high echogenicity provided by its highly
compressible gas core, these microbubbles have been adapted as ultrasound contrast agents for a
variety of applications such as contrast-enhanced ultrasonography (CEUS), targeted drug
delivery and metabolic gas transport. Recently, these lipid-stabilized microbubbles have
demonstrated increased potential as theranostic (therapy + diagnostics) agents for non-invasive
surgery with focused ultrasound (FUS). For instance, their implementation has reduced the
acoustic intensity threshold needed to open the blood-brain-barrier (BBB) with FUS, which
potentially allows for the localized delivery of drugs to treat neurodegenerative diseases such as
Alzheimer’s, Parkinson’s and Huntington’s diseases. However, the effectiveness of
microbubbles for this application is dependent on successful microbubble engineering. One
necessary improvement is the development and utilization of monodisperse microbubbles of
varying size classes. Another design improvement is the development of a microbubble construct
whose fragmentation state during or after FUS surgery can be tracked by magnetic resonance
imaging (MRI).
Thus, in this thesis, we describe a method to generate and select lipid-coated gas-filled
microbubbles of specific size fractions based on their migration in a centrifugal field. We also
detail the design and characterization of size-selected lipid-coated microbubbles with shells

containing the magnetic resonance (MR) contrast media Gadolinium (Gd(III)), for utility in both
MR and ultrasound imaging. Initial characterization of the lipid headgroup labeled Gd(III)-
microbubbles by MRI revealed that the Gd(III) relaxivity increased after microbubble
fragmentation into non-gas-containing lipid vesicles. This behavior was explained to stem from
an increase in interaction between water protons and the Gd(III)-bound lipid fragments due to an
increase in lipid headgroup area after microbubble fragmentation. To explore this hypothesis, an
alternative construct consisting of Gd(III) preferentially bound to the protective poly(ethylene
glycol) (PEG) brush of the lipid shell architecture was also designed and compared to the lipid
headgroup-labeled Gd(III) microbubbles. Nuclear magnetic resonance (NMR) analysis revealed
that, in contrast to the headgroup labeled Gd(III) microbubbles, the relaxivity of the PEG-labeled
Gd(III)-microbubbles decreased after microbubble fragmentation. NMR analysis also revealed
an independent concentration-dependent enhancement of the transverse MR signal by virtue of
the microbubble gas core. The results of this study illustrated the roles that Gd(III) placement on
the lipid shell and the presence of the gas core may play on the MR signal when monitoring
Gd(III)-microbubble cavitation during non-invasive surgery with FUS.

i
Table of Contents
Abstract..............................................................................................................................................
Table of Contents..............................................................................................................................i
List of Tables...................................................................................................................................vi
List of Figures................................................................................................................................vii
Acknowledgments.............................................................................................................................x
Chapter 1: Introduction.........................................................................................................................1
1.1. Lipid-shelled Microbubble Structure and Composition..………………………...……………2
1.2. Fabrication Techniques……………………..……………………………………………………..3
1.3. Microbubble Size-dependent Behavior…………………………………………………………..5
1.4. Attempts to Reduce Size Polydispersity………………………………..………………………...7
1.5. Applications of Microbubbles in Focused Ultrasound Surgery....…………………………..9
1.5.1. Focused Ultrasound Surgery with Microbubbles……………………………………..9
1.5.2. Magnetic Resonance Imaging guided Focused Ultrasound Surgery with
Microbubbles………………………………………………………………………..………..…...11
1.5.3. Blood-Brain-Barrier Opening with Focused Ultrasound and Microbubbles……12
1.5.4. The Need for MRI-detectable Microbubbles in MRI-guided Focused Ultrasound
Surgery and Blood-Brain Barrier Opening with Focused Ultrasound………..…………..13
1.6. Gadolinium as an MRI contrast agent…………………………………………………………14
1.6.1. Relaxivity of Gd(III)-based contrast agents…………………………………………..15
1.7. Microbubbles as MRI Contrast Agents…………………..…………………………………….17
1.7.1. Microbubbles as Contrast Agents for T2*-weighted MRI…………………………..17
1.7.2. Microbubbles as Contrast Agents for T1-weighted MRI…………………………....18

ii
1.8. Research Motivations and Specific Aims………………………………………………………18
Chapter 2: Microbubble Size Isolation by Differential Centrifugation……………..………………….21
2.1. Introduction………………………………………………………………………………………..21
2.2. Methods and Materials………………………………………………………………………......25
2.2.1. Materials…………………………………………………………………………………..25
2.2.2. Microbubble Generation………………………………………………………………..26
2.2.3. Microbubble Washing & Lipid Recycling…………………………………………….27
2.2.4. Size and Concentration Measurements………………………………………………..27
2.2.5. Optical Microscopy…………………………………………………………………..….28
2.2.6. Flow Cytometry…………………………………………………………………………..28
2.3. Size Isolation………………………………………………………………………………………29
2.3.1. Isolation of 4-5 µm Diameter Microbubbles…………………………………………31
2.3.2. Isolation of 1-2 µm Diameter Microbubbles…………………………………………32
2.4. Results……………………………………………………………………………………………...32
2.4.1. Polydispersity of Freshly Sonicated Microbubbles………………………………….32
2.4.2. Size Isolation of Microbubbles…………………………………………………………37
2.4.3. Stability of Size-Isolated Microbubbles……………………………………………….44
2.5. Conclusions………………………………………………………………………………………..49
Chapter 3: Theranostic Gd(III)-Lipid Microbubbles for MRI-Guided Focused Ultrasound
Surgery…………………………………………………………………………………………………………...50
3.1. Introduction……………………………………………………………………………………….50
3.2. Materials and Methods………………………………………………………………………......53

iii
3.2.1. Materials…………………………………………………………………………………..53
3.2.2. Microbubble Generation and Size Isolation………………………………………….54
3.2.3. Synthesis of Gd(III)-bound Microbubbles…………………………………………….55
3.2.5. Surface Functionalization with FITC-NHS or DOTA-NHS……………………......56
3.2.6. Complexation of Gd(III) to DOTA on Microbubble Shells…………………………57
3.2.7. Ultrasound Characterization of Gd(III)-bound Microbubbles…………………….58
3.2.8. MRI Characterization of Gd(III)-bound Microbubbles……………………………..58
3.3. Results………………………………………………………………………………………………60
3.3.1. Preparation of Gd(III)-bound Microbubbles……………………………………..….60
3.3.2. Ultrasound Characterization of Gd(III)-microbubbles……………………………..64
3.3.3. MRI Characterization of Gd(III)-microbubbles……………………………………..65
3.3.4. Relaxation Rates of Control Microbubbles and their Fragments…………….…...65
3.3.5. Relaxation Rates of Gd(III)-bound Microbubbles and their Fragments…….……66
3.3.6. Molar Relaxivities of Gd(III)-bound Microbubbles………………………………....69
3.4. Discussion……………………………………………………………………………………………70
3.5. Conclusions………………………………………………………………………………………….74
Chapter 4: Magnetic Resonance Properties of Gd(III)-Bound Lipid-Coated Microbubbles and their
Cavitation Fragments………………………………………………………………………………………….75
4.1. Introduction………………………………………………………………………………………..75
4.2. Materials and Methods…………………………………………………………………………..79
4.2.1. Materials………………………………………………………………………………….79
4.2.2. Microbubble Generation and Size Isolation…………………………………………80

iv
4.2.3. Synthesis of Headgroup-labeled (Gd(III)-PE) and PEG-labeled (Gd(III)-PEG-
PE) Microbubbles……………………………………………………………………………..….81
4.2.4. Characterization of Gd(III)-bound Microbubbles and Cavitation Fragments….83
4.2.5. NMR Characterization of Intact and Fragmented Gd(III)-bound
Microbubbles………………………………………………………………………………………83
4.3. Results and Discussions………………………………………………………………………….84
4.3.1. Preparation of Gd(III)-bound Microbubbles………………………………………..84
4.3.1.1. Headgroup-labeled Microbubbles (Gd(III)-PE)……………………….84
4.3.1.2. PEG-labeled Microbubbles (Gd(III)-PEG-PE)………………………..86
4.3.2. NMR Characterization of Intact and Fragmented Gd(III)-Bound
Microbubbles………………………………………………………………………………………88
4.3.2.1. Control Microbubbles (No Gd(III))………………………………………88
4.3.2.2. Relaxation Rate of Intact and Fragmented Gd(III)-PE
Microbubbles……………………………………………………………………………..89
4.3.2.3. Relaxation Rate of Intact and Fragmented Gd(III)-PEG-PE
Microbubbles……………………………………………………………………………..94
4.4. Conclusions………………………………………………………………………………………..97
Chapter 5: Opening the Blood-Brain Barrier with Gd(III)-bound Lipid-stabilized Microbubbles.
……….……………………………………………………………………………………………………………99
5.1. Introduction………………………………………………………………………………………..99
5.2. Materials and Methods………………………………………………………………………....101
5.3. Results…………………………………………………………………………………………….103

v
5.4. Discussions……………………………………………………………………………………….104
5.5. Conclusions……………………………………………………………………………………....106
Chapter 6: Concluding Remarks and Future Directions…………………..…………………………....107
6.1. Accomplishment of Specific Aims……………………………………………………………..107
6.1.1. Microbubble Size Isolation by differential centrifugation………………………...107
6.1.2. Theranostic Gd(III)-Lipid bound Microbubbles for MRI guided focused
ultrasound surgery………………………………………………………………………………107
6.1.3. Magnetic Resonance Properties of Gd(III)-Bound Lipid-Coated Microbubbles
and their Cavitation Fragments…………………………………………………………….…108
6.1.4. Opening the Blood-Brain Barrier with Gd(III)-bound Lipid-stabilized
Microbubbles…………………………………………………………………………………....109
6.2. Impact on the Field……………………………………………………………………………..109
6.3. Future Directions……………………………………………………………………………….111
References…………...…………………………………………………………………………..113

vi
List of Tables
Table 2.1: 1-2 micron and 4-5 micron microbubble size distribution data………………….......40
Table 2.2: Summary of flow cytometry measurements……………………………………………....44
Table 2.3: Summary of stability of size-isolated microbubble suspensions….…………………...47
Table 3.1: Relaxivity of Intact and Fragmented Gd(III)-bound Microbubbles…………………..70
Table 4.1: Relaxivities (r1 and r2*) of intact and fragmented Gd(III)-PE microbubbles…….....91
Table 4.2: Relaxivities (r1 and r2*) of intact and fragmented Gd(III)-PEG-PE microbubbles…95

vii
List of Figures
Figure 1.1. Cartoon illustrating the microbubble lipid-shelled monolayer……………………........2
Figure 1.2. Representative size distribution of freshly made microbubbles (prepared by
sonication) measured by light obscuration……….……………………………………………………...5
Figure 2.1. Cartoon showing origins of polydispersity during acoustic emulsification……........23
Figure 2.2. Schematic of differential centrifugation for the size isolation of microbubbles…….30
Figure 2.3. Size distributions for freshly sonicated microbubbles…………………………………..33
Figure 2.4. Microscopy images of initial polydisperse and final size-isolated microbubbles…..35
Figure 2.5. Dot plots of side scatter (SSC) versus forward scatter (FSC) for polydisperse and
size-isolated microbubbles as determined by flow cytometry…………………………………….....36
Figure 2.6. Size distributions for initial polydisperse and final size-isolated microbubbles……39
Figure 2.7. Fluorescence intensity and light scattering profiles for microbubble suspensions
after size isolation as determined by flow cytometry………………………………………………….43
Figure 2.8. Stability of size-isolated microbubbles…………………………………………..............46
Figure 3.1. Synthesis of the Gd(III)-DOTA-DSPE microbubble shells using the post-labeling
technique……………………………………………………………………………………………………56
Figure 3.2. Fluorescence microscopy image of 4-5 µm DSPE-coated microbubbles modified with
FITC-NHS using the post-labeling technique………………………………………………...............60

viii
Figure 3.3. Number-weighted size distributions of DSPE microbubbles before and after
conjugation with DOTA-NHS…………………………………………………………………………..62
Figure 3.4. Number-weighted size distributions of microbubbles before and after Gd(III)
chelation…………………………….…………………………………………………………................63
Figure 3.5. Ultrasound images of the mouse kidney before and after bolus injection of 1 x 10⁷
Gd(III)-bound microbubbles…………………………………………………………………………….64
Figure 3.6. Color maps of MRI relaxation time for intact and fragmented microbubble
samples…………………………………………………………………………………………………….67
Figure 3.7. Relaxation rates of intact and fragmented microbubble samples………………......69
Figure 3.8. Cartoon showing proposed mechanism for MRI relaxivity increase with the
cavitation-induced conversion of lipid from the compressed monolayer form on the intact
microbubble to the relaxed bilayer form of the fragments………………………………………….72
Figure 4.1. Schematic of Gd(III)-DOTA conjugation to microbubble shell……………………..82
Figure 4.2. A) Number-weighted size distributions of DSPE microbubbles before and after
conjugation with DOTA-NHS. B) Number-weighted size distributions of lipid-bound DOTA-
microbubbles before and after Gd(III) chelation at 50 oC.…………………………………………86
Figure 4.3. A) Number-weighted size distributions of DSPE/DSPE-PEG 2000 amine
microbubbles before and after conjugation with DOTA-NHS. B) Number-weighted size
distributions of PEG-bound DOTA-microbubbles before and after Gd(III) chelation at
45oC…………………………………………………………………………………………....................88

ix
Figure 4.4: Relaxation rate of control microbubbles (No Gd(III)) versus gas volume
fraction…………………………………………………………………………………………………….89
Figure 4.5: Relaxation rates (R1 and R2*) of intact and fragmented Gd(III)-PE microbubbles
versus Gd(III) concentration…………………………………………………...................................90
Figure 4.6. Schematic demonstrating hypothetical mechanisms governing changes in a) r1 of
Gd(III)-PE microbubbles and b) r2* of Gd(III)-PEG-PE microbubbles…………………………92
Figure 4.7. Relaxation rates (R1 and R2*) of intact and fragmented Gd(III)-PEG-PE
microbubbles versus Gd(III) concentration…………………………………………………............95
Figure 5.1. MRI images of the mouse brain: a) Unperturbed. b) ~40 mins after sonication of the
right hippocampus in the presence of Gd(III)-labeled microbubbles. c) At least 100 mins after
sonication in the presence of Gd(III)-labeled microbubbles and ~60 mins after injection of
Omniscan…………………………………………………………………………………………………104

x
Acknowledgements
I would like to give my sincerest gratitude to my advisor and mentor throughout this dissertation,
Dr. Mark A. Borden. He instilled in me the important concept of critical thinking in scientific
analysis and provided education on the essential skills needed to improve as a research scientist.
Without his patient guidance and support over the years, I would not have the level of confidence
and experience needed to accomplish this enormous task.
I also appreciate the support received from members of Dr. Borden’s Biocolloidal Engineering
lab; Dr. Shashank Sirsi, the lab Guru, who provided not only wisdom in scientific research, but
also served as a paradigm of the excellent work ethic that I needed to follow in order to finish
this dissertation. I would also like to thank fellow colleagues, Dr James Kwan, Dr. Cherry Chen,
Edward Swanson and the members of the Borden lab in Colorado for their input and friendship
over the years.
I am grateful for opportunities provided and financial support received from our collaborator, Dr.
Elisa Konofagou during this dissertation. By working with her research group, I gained exposure
to some of the most promising and developing applications of microbubbles in the medical field.
I would also like to thank the members of the Ultrasound and Elasticity Imaging Laboratory
(UEIL), especially Dr. James Choi and Yao-Sheng Tung for their collaborative efforts over the
years.
I would also like to express my gratitude to the other members of this thesis committee, Dr
Edward Leonard and Dr Jeffrey Koberstein of Chemical Engineering at Columbia University and
Dr. Ponisseril Somasundaran of Earth and Environmental Engineering at Columbia University
for their participation. I particularly recall the words of wisdom by Dr Leonard “Don’t get

xi
thrown off the horse- Look out for the buffalos” which encouraged me to go to Colorado for a
while, and broadened my research exposure.
I am also thankful to the faculty and staff of the Chemical Engineering department at Columbia
University for their help and support over the years.
I am grateful to the staff of the National Institute of Standard and Technology’s (NIST)
Electromagnetics division in Boulder, Colorado for providing facilities needed to help finish this
dissertation. I would particularly like to thank Dr. Mike Boss and Dr. Stephen Russek for their
integral collaborative effort and for the insight provided on some of the key concepts behind
Nuclear Magnetic Resonance theory.
I would especially like to thank my brothers: my elder brother, Fuad for his leadership and
inspiration and my younger brothers, Hamzat and Hameed for their source of motivation and
cheerfulness throughout this dissertation period. I also extend my sincerest gratitude to my
various cousins, aunts and uncles for their support throughout this process. I would also like to
acknowledge the special contributions of my relatives who passed away while I was attaining
this degree, Alhaja Sinata Banire and Alhaja Sidikat Anibaba. They were amongst my greatest
supporters.
Finally, and most importantly, I would like to thank my parents, Wahab and Fausat, for shaping
the man that I am today, and for providing an unlimited source of motivation and
encouragement, especially during the most difficult periods of this dissertation. Your
unconditional love, prayers and support throughout this journey was a key source of inspiration
over this 5-year journey. All praise is to God almighty for this and other blessings on my family.

1
Chapter 1: Introduction
Gas-filled microbubbles are 1 to 100 µm spheres that create a colloidal suspension consisting
of gas globules dispersed in a liquid medium. These microbubbles occur naturally in fresh or
seawater, in the fluid within our bodies, or are synthetically manufactured. Although adaptable
in a wide range of applications, their use in the medical field is currently gaining ground. For
example, microbubbles have been studied as tools for contrast-enhanced ultrasonography
(CEUS), targeted drug/gene delivery and metabolic gas delivery. Another developing medical
application with microbubbles involves their application as theranostic (therapy + diagnostic)
agents for non-invasive surgery using focused ultrasound (FUS). Ultrasound in combination
with microbubble cavitation can focus the mechanical energy to microscale events distributed
throughout the insonified vasculature, resulting in violent or subtle changes to the local
environment. A combination of this effect with the capability of microbubbles to simultaneously
offer contrast enhancement for diagnostic imaging and drug loading, as well as delivering a
payload for targeted therapy, makes for a promising medical tool (Sirsi and Borden 2009).
However, there is still a need to improve the design of microbubbles for their successful
application in FUS surgery. These improvements may include the choice of surfactant shell type,
reducing microbubble size polydispersity, gas choice and the ability to monitor therapy with
techniques like MRI. Although a variety of microbubble shell materials may be selected, lipid-
shelled microbubbles are preferred due to their ultrasound compliance (Bloch, Wan et al. 2004;
Ferrara, Pollard et al. 2007). Thus, in this chapter, we discuss the structure and composition of
lipid-stabilized microbubbles, their fabrication methods, the importance of size monodispersity
and the need for a MRI-detectable microbubble design to aid in tracking of the microbubble or
its lipid shell debris during non-invasive surgery with FUS.

2
1.1. Lipid-shelled Microbubble Structure and Composition
Lipid-shelled microbubbles are typically composed of two key components: the amphiphilic
phospholipid moiety and a poly(ethylene glycol) (PEG) labeled lipid emulsifier or lipopolymer
(Figure 1.1). The inclusion of the PEGylated lipid into the shell improves microbubble stability.
Figure 1.1. Cartoon illustrating the microbubble lipid-shelled monolayer
In a comparable engineering design to long-circulation liposomes, the brush layer of PEG chains
is an important part of the lipid microbubble shell structure because it forms a steric barrier
against coalescence and adsorption of macromolecules to the microbubble surface (Klibanov,
Maruyama et al. 1990; Klibanov 1999). The protective role of PEG is assumed to be due to the
steric hindrance effect of the polymer brush, which forms a semi-impenetrable barrier over part
of the microbubble surface that partly inhibits certain molecules from diffusing into the brush
layer (Needham, Mclntosh et al. 1998).
The main phospholipid component of the shell consists of long hydrophobic fatty acid
tails and a hydrophilic polar headgroup. During microbubble formation, these phospholipids
spontaneously absorb from lipid vesicles in solution such as micelle and liposomes, to form a
highly oriented and densely packed monolayer at the gas–liquid interface, such that their
hydrophobic tail faces the gas and their hydrophilic headgroups faces the aqueous medium.

3
Phospholipids below their main phase transition temperature (Tm), defined as the temperature at
which the membrane transforms from a crystalline state to a liquid crystalline, can achieve lateral
compression within the monolayer plane that results in very low surface tension (Ferrara, Pollard
et al. 2007). The length of the lipid chain is integral to microbubble stability and affects its
mechanical properties. For instance, increasing the length of the lipid chain has been found to
reduce surface tension and increase shell surface viscosity, buckling stability and gas permeation
resistance (Borden and Longo 2002; Kim, Costello et al. 2003; Borden and Longo 2004; Duncan
and Needham 2004; Pu, Borden et al. 2006; Kwan and Borden 2010).
Research has also revealed the complex interaction of the lipid shell constituents
stabilizing the microbubble. Kim et al. (Kim, Costello et al. 2003) revealed the lipid shell to
consist of planar microdomain phases separated by regions of defects. Borden et al. (Borden,
Martinez et al. 2006) later elucidated the nature of the phase separation on the shell. The
microdomains were composed mainly of lecithin and were segregated by grain boundary regions
consisting of a miscible phase rich in other monolayer constituents such as lipopolymers. Both
phases are integral in the stability of lipid-stabilized microbubbles (Pu, Borden et al. 2006; Talu,
Lozano et al. 2006; Ferrara, Pollard et al. 2007).
1.2. Fabrication Techniques
The most common technique for generating high yields of lipid-coated microbubbles is by
mechanical agitation (Feinstein, Shah et al. 1984; Feinstein 2004). This process can be sub-
divided into two techniques, shaking or acoustic emulsification (sonication) at the interface of a
gas and liquid. Both techniques can produce microbubble suspensions rapidly (~10-40 seconds)
with relatively high concentration (109—1010 mL-1) and containing a polydisperse size

4
distribution, ranging between 1-100 microns in diameter. For biomedical applications requiring
small quantities of microbubbles, the shaking method (Unger et al. 1992), allows for on-site
generation of microbubbles by vigorously shaking a serum vial (2 – 3 mL) containing lipid
solution and gas headspace. This technique has been adapted in the development of
commercially available lipid microbubbles such as DefinityTM (Lantheus Medical Imaging,
North Billerica, MA, USA). The advantage of this technique is that the pre-microbubble lipid
solution can be stored, and the microbubble suspension can be later prepared using equipment
such as a dental amalgamator. Alternatively, the sonication technique is generally used for
laboratory applications requiring large volumes of polydisperse microbubbles (figure 1.2). In
this methodology, microbubbles are generated by mechanical perturbation produced by an
ultrasonic probe sonifier (at about 10 kHz), whose tip is placed close to the interface of the lipid
suspension and the overhead gas space. The technique has been improved in recent years. For
instance, Swanson et al. (Swanson, Mohan et al. 2010) adapted the sonication technique to semi-
continuously create lipid-coated oxygen microbubble suspensions at concentrations up to 1010
mL-1 within a few minutes and at volumes up to 1 L.

5
Figure 1.2. Representative size distribution of freshly made microbubbles (prepared by
sonication) measured by light obscuration.
Other more refined techniques have been developed to produce microbubbles. These
include the adaptation of T-junctions (Xu, Nie et al. 2005), flow focusing (Talu, Lozano et al.
2006; Talu, Hettiarachchi et al. 2008), ink-jet printing (Bohmer, Schroeders et al. 2006) and
coaxial electrohydrodynamic atomization (Stride and Edirisinghe 2008). These techniques
mainly make use of microfluidic processing methods to produce microbubbles with narrow size
distributions. However, these methodologies lack the microbubble production capacity when
compared to the sonication method.
1.3. Microbubble Size-dependent behavior
Microbubble size plays a big role on its behavior under ultrasound. For example, Apfel and
Holland (Apfel and Holland 1991) developed a Blake threshold, for the onset of inertial
cavitation of a bubble during pulsed insonation at higher frequencies, by solving mathematical
models of bubble dynamics. Their calculation demonstrated that the Blake mechanism causes
unstable growth of smaller bubbles, while liquid inertia restricts the growth of larger bubbles.
Chomas et al. (Chomas, Dayton et al. 2001) also linked the ultrasound parameters needed to

6
cause bubble fragmentation with bubble size by driving optically observed microbubbles of
different sizes under a range of ultrasound pressures. In their analysis, a fragmentation threshold
was developed to delineate microbubbles that remained intact during ultrasound-induced
cavitation from those that were destroyed.
There is also a size-dependent behavior of microbubbles for diagnostic imaging
applications. In 1933, Minnaert (Minnaert 1933) developed a relationship between acoustic
resonant frequency, f to bubble radius, R in an infinite medium neglecting surface tension and
viscosity.
2
1
3
2
1
=
ργ
πAP
Rf
(1.2)
where γ represents the polytropic coefficient, ρ represents the density of water, and PA represents
ambient pressure. One example of an implication of this relation is that increasing the
microbubble diameter from 1 to 5 microns will change the resonance frequency of an un-
encapsulated microbubble from 4.7 to 0.72 MHz. (Wu and Nyborg 2008). In a related study,
Goertz et al. (Goertz, de Jong et al. 2007) showed that, as predicted by a Rayleigh-Plesset model,
the acoustic response of small (< 2 microns) lipid-coated microbubble led to greater acoustic
attenuation (extinction) at higher frequencies because they were closer to resonance.
. Microbubble size also affects the biodistribution and pharmacodynamics after
intravenous injection, the bioeffects during ultrasound insonification, the gas release profile, and
other related behaviors. For instance, Bouakaz et al. (Bouakaz, de Jong et al. 1998)
demonstrated that microbubbles larger than the lung mean capillary (~5 microns) diameter were
filtered out. Other studies using positron emission tomography have shown that a large portion
of microbubbles accumulate in the spleen via a potential size dependent filtration mechanism

7
(Tartis, Kruse et al. 2008). Clearly, for both diagnostic imaging and therapeutic applications
microbubbles size control is necessary for their successful development as theranostic agents.
1.4. Attempts to Reduce Size Polydispersity
Most commercially available microbubble contrast agents are highly polydisperse in size.
For example, the commercially available lipid-based microbubble, Definity, contains
microbubbles ranging from 1 to 10 microns in diameter, with most of the microbubbles below 2
microns (Goertz, de Jong et al. 2007). The high polydispersity is a consequence of the
emulsification methods (as described in section 1.2) used to generate microbubbles in high
quantity, such as sonication and shaking. In most cases, the size distribution is broad over a
range of sub-micrometer to tens of micrometer in diameter. Consequently, a number of methods
are being developed to improve the control over microbubble size and other characteristics.
These techniques include flow focusing (Talu, Lozano et al. 2006; Talu, Hettiarachchi et al.
2007; Talu, Hettiarachchi et al. 2008), T-junctions (Xu, Nie et al. 2005) and
electrohydrodynamic atomization (Farook, Stride et al. 2007; Farook, Zhang et al. 2007). While
these techniques provide very low polydispersity, they are rather slow at generating
microbubbles. Using flow focusing, for example, requires several hours to produce microbubbles
at sufficient numbers for even a single small-animal trial (∼ 0.1 mL × 109 mL−1). Additionally,
dust particles can plug microchannels, thus requiring fabrication and calibration of a new device.
Although engineering breakthroughs may eventually allow efficient and robust generation of
monodisperse microbubbles via microfluidic strategies, these techniques currently remain
untenable for biomedical studies.

8
Another strategy takes advantage of microbubble buoyancy to isolate monodisperse
microbubble populations. In principle, larger microbubbles are more buoyant and rise faster,
thus allowing separation possible based on different migration rates in a gravitational field.
Kvale et al. (Kvale, Jakobsen et al. 1996) described a model for the size fractionation of air-filled
microbubbles by simple flotation. Microbubbles were injected at the bottom of a stagnant water
column and allowed to rise under normal gravity. The model predicted the size distribution of
microbubbles at certain distances from the bottom of the column as a function of time. The form
of the model was a second-order PDE (equation 1.3) that used Stokes velocity (equation 1.4) to
account for the convective motion of the bulk dispersed phase (liquid moved down the column as
microbubbles moved up) as well as the Stokes-Einstein diffusion constant (equation 1.5) to
account for Brownian (thermal) diffusive motion of the particles.
2
2
x
nD
nu
t
n i
x
ii
i
iB ∂
∂+
∂
∂−=
∂
∂ (1.3)
( )
gRu
u iir
i21
*9
2 ρρ −=
(1.4)
R
kTDiB πµ6
= (1.5)
where uir represents the relative velocity between the microbubble and the fluid, n represents the
number of microbubbles, t represents time, x represents vertical position, Ri represents
microbubble radius, g represents gravity, DiB represents diffusion constant, µ* represents
effective viscosity, ρ – ρ i1 represents the density difference between the bubble and the fluid, R
represents gas constant, T represents ambient fluid temperature and k, represents Boltzmann’s
constant.

9
Wheatley et al. (Wheatley, Forsberg et al. 2006), described a methodology to separate
submicron population of bubbles from larger ones by using predetermined centrifugal speeds.
This centrifugation technique reduced the separation time as compared to the gravity separation
protocol. By adapting these protocols, it is conceivable to develop a technique to select different
microbubble size classes by varying centrifugal speed.
1.5. Applications of Microbubbles in Focused Ultrasound Surgery
1.5.1. Focused Ultrasound Surgery with Microbubbles
Focused ultrasound (FUS) surgery has become a promising medical technique since it
provides a truly non-invasive surgical method without the unwanted side effects associated with
other treatment option like chemotherapy and radiotherapy (Kennedy, ter Haar et al. 2003).
When ultrasonic waves are focused using transducers with spherical geometries, or beam
steering techniques, the ultrasonic waves align to form a focal region a certain distance from the
plane of the transducer leading to localization of the acoustic energy to a target region without
significantly perturbing the surrounding media. The ability of high intensity FUS to induce
lesion formation for non-invasive surgery is based on the observation that above a certain
thermal threshold and sonication time, irreversible cell death occurs through “coagulative
necrosis” (Kennedy, ter Haar et al. 2003). Ultrasound can be used to generate non-thermal
bioeffects like the acoustic cavitation generated by bubbles (Kennedy, ter Haar et al. 2003; Jolesz
and McDannold 2008). At high acoustic intensities, these gas bubbles can form in the focal area
during the rarefaction phase of ultrasound. These inception bubbles oscillate in size or undergo
inertial collapse, causing mechanical stresses and generating temperatures exceeding 2000 K in

10
the microenvironment (Kennedy, ter Haar et al. 2003; Hindley, Gedroyc et al. 2004), which
further aids the therapy.
While heating with inception microbubble cavitation may provide some advantages over
heating alone, it has its disadvantages. For instance, the forces generated from inertial cavitation
from an inception bubble can cause significant tissue damage. Moreover, the uncertainty in
formation and location of inception cavitation may result in tissue damage outside the desired
region of interest. One method to mitigate the potential problems with cavitation-enhanced FUS
is to introduce preformed lipid-stabilized microbubbles into the vasculature (Jolesz and
McDannold 2008). Since these microbubbles, are already commercially available as ultrasound
contrast agents, they can substantially reduce the threshold for inertial cavitation and further
reduce the acoustic power requirements needed to ablate tissue. These preformed microbubbles
have been demonstrated in animals to aid lesion formation through non-thermal mechanisms.
For example, Fujishiro et al. (Fujishiro, Mitsumori et al. 1998) demonstrated an increase
ultrasound-induced heating efficiency of a 2 centimeter beef tissue phantom with the
administration of air-filled protein shelled microbubbles. In a related study, Miller et al. (Miller
and Gies 1998) demonstrated the importance of microbubble persistence in their efficacy for
ultrasound-induced cavitation. Generally, perflourocarbon-containing microbubbles were
reported to be more effective in inducing hemolysis in the canine blood than air-containing
microbubbles. Mcdonnald et al. (McDannold, Vykhodtseva et al. 2006) showed that, upon
administration of protein-shelled microbubbles (Optison, GE Healthcare, Milwaukee, WI), lesion
formation in the rabbit brain could be attained a temperature below the threshold for thermal
damage. Finally, in a study comparing different microbubbles shell architectures, Takegami et
al. (Takegami, Kaneko et al. 2005) demonstrated that lipid-shelled microbubbles (MRX-133,

11
ImaRX, Tuscon, Arizona) were more efficient in inducing lesions in the rabbit liver than protein-
shelled counterparts. Clearly, varying parameters in microbubble design such as the choice of
shell, gas-type and size are important considerations in the development of microbubbles for
non-invasive surgery with FUS.
1.5.2. Magnetic Resonance Imaging (MRI)-guided Focused Ultrasound Surgery with
Microbubbles
Another important consideration in the clinical application of FUS surgery is the ability to
monitor treatment accurately. In modern practice this is achieved by either using real-time
ultrasound (Madersbacher, Kratzik et al. 1994; Wu, Chen et al. 2001), or MRI (Cline, Schenck et
al. 1992; Hynynen, Darkazanli et al. 1993; Cline, Hynynen et al. 1995; Hynynen, Freund et al.
1996). The advantage in using MRI to guide FUS therapy is the capability of producing better
image quality and the ability to monitor changes in temperature. This treatment is called MRI-
guided focused ultrasound surgery (MRIgFUS). In this method, the target region is initially
identified with “sublesioning” ultrasound exposures (Jolesz and McDannold 2008).
Subsequently, the local rise in temperature is used to validate the position of the ultrasound focus
before higher intensity pulses are used for the actual treatment. The Exablate 2000 is an example
MRIgFUS device, developed by Insightec Ltd, that is currently FDA approved to treat uterine
fibroids, a benign tumor found in the uterus. This device allows the operator to monitor and treat
the tumor in real time via a thermal feedback control loop. McDannold et al. (McDannold,
Vykhodtseva et al. 2006) demonstrated that the initiation and level of lesion formation in rabbits,
created using the combination of FUS and an ultrasound contrast agent (Optison), correlated with
temperature contours observed in MR thermometry. Moreover, the study revealed that the

12
administration of the microbubbles reduced the acoustic threshold needed to produce the lesions
by 91 % as compared to without microbubbles. While MRIgFUS is currently under
development to treat a variety of other diseases found in the liver, uterus, kidney and bone, one
of the most ideal applications is to treat diseases found in the brain (Jolesz and McDannold
2008).
1.5.3. Blood-Brain-Barrier Opening with Focused Ultrasound and Microbubbles
A method that allows non-invasive and efficient delivery of drugs to anatomically desired
regions of the brain currently does not exist. The key challenge in this development is severe
limitation imposed by action of the blood-brain-barrier (BBB). In general, the BBB is a
permeability barrier that prevents most large compounds (> 400 Da) from crossing into the
interstitial space of the brain (Pardridge 2005). Thus, it serves as a major bottleneck for drug
delivery to the brain to treat neurodegenerative diseases such as Parkinson’s, Huntington’s and
Alzheimer’s, as most effective drugs are larger than the BBB size cut-off. While other invasive
or non-localized strategies are under development to overcome the BBB, FUS with pre-
administered microbubbles represents one of the only non-invasive and localized methodologies
available (Choi, Pernot et al. 2007). The intravenous addition of microbubble before sonication
has improved safety of FUS-induced BBB opening since it is not associated with significant
neuronal damage. BBB opening with FUS and microbubbles relies mainly on non-thermal
mechanical perturbation mechanisms caused by the interaction of the microbubbles with
ultrasound as opposed to the predominantly thermal effects used to induce tissue ablation in
MRIgFUS. Furthermore, the BBB disruption is reversible since it recovers within a few hours.
The presence of the microbubbles in the blood supply also offers the advantage of reduction in

13
the acoustic driving pressure needed for non-thermal cell disruption. Hynyen et al. (Hynynen,
McDannold et al. 2001) demonstrated that FUS sonication in the presence of pre-injected
Optison microbubbles temporarily opens the BBB in rabbits at acoustic intensity levels lower
than that required for thermal ablation. Choi et al. (Choi, Pernot et al. 2007) further demonstrated
the non-invasive, localized and transient opening of the BBB in mice at lower acoustic driving
pressures, with the administration of the lipid-stabilized microbubble Definity.
1.5.4. The Need for MRI-detectable Microbubbles in MRI-guided Focused Ultrasound
Surgery and Blood-Brain Barrier Opening with Focused Ultrasound
Until now, the microbubble sizes used for FUS-induced BBB opening were generally
polydisperse in nature (Figure 1.2), similar to those formed by sonication or shaking, thus
resulting in the unknown dependence of bubble size on FUS-induced BBB opening.
Additionally, owing to the different cavitation modes of microbubbles during FUS sonications,
the state of the microbubble construct during or after therapy is not known. Providing solutions
to these problems begins with proper microbubble engineering. For instance, the dependence of
microbubble size on BBB opening may be elucidated by developing and testing the effects of
different-sized monodisperse microbubbles. The monodisperse microbubbles size classes could
be prepared using the centrifugation technique proposed in section 1.4. Furthermore, the
question of how to track the microbubble fragmentation state during or after FUS-induced BBB
opening or MRIgFUS may be answered by taking advantage of the techniques used to determine
the opening and closing of the BBB. In most BBB opening studies, this involves monitoring MR
signal intensity changes after administration of MRI contrast media, typically Gadolinium
Gd(III) based (Hynynen, McDannold et al. 2001; Choi, Pernot et al. 2007). With an open BBB,

14
the injection of the MRI contrast media after microbubble-mediated BBB opening results in
enhancement in the MRI signal intensity in the sonicated region. This is because these Gd(III)
molecules are able to diffuse into the extracellular space, previously unreachable when the BBB
is closed. One may gain insight on the final state of the lipid-stabilized microbubble by
developing a contrast agent that combines both imaging modalities, ultrasound with
microbubbles and MRI with Gd(III). Thus, the development of size-selected microbubbles with
Gd(III) bound lipid shells could be beneficial to advance both MRIgFUS and BBB opening with
FUS. The development of this dual-modal contrast agent may also give information on shell-
associated biodistribution and pharmacokinetics for drug delivery to the brain, since the Gd(III)-
bound lipid shell can serve as a potential drug surrogate. Finally, by monitoring the effect of
microbubble destruction on the MRI signal, one may conceivably use Gd(III) microbubble
fragmentation as a guide for FUS surgery as opposed to MR thermometry used in MRIgFUS.
1.6. Gadolinium as an MRI contrast agent
Before development of a dual-modal construct for ultrasound and MRI, it is necessary to
understand the functionality of the contrast media conventionally used in MRI. Historically, MRI
contrast agents play a significant role in the development of MRI for medical applications. They
are commonly referred to as T1- or T2-agents based on whether the relative reduction in
relaxation times caused by the agent is larger for the longitudinal (T1) or transverse (T2)
relaxation (Toth, Helm et al. 2002). MR signal intensity increases with increasing 1/T1 (brighter
T1-weighted images) and reduces with increasing 1/T2 (darker T2-weighted images). While a
variety of other contrast agents exist, such as iron-oxide based particles, the most popularly used,
especially for T1-weighted MRI, are derived from stable chelates of Gadolinium (Gd(III)).

15
Gd(III) is the ideal contrast agent because of its slow electron spin relaxation and because its
seven unpaired electrons makes it the most paramagnetic of all the stable metal ions (Caravan,
Ellison et al. 1999; Kubicek and Toth 2009).
1.6.1. Relaxivity of Gd(III) based contrast agents
Solomon, Bloembergen and others (Bloembergen, Purcell et al. 1948; Solomon and
Bloembergen 1956; Bloembergen 1957; Bloembergen and Morgan 1961; Connick and Fiat
1966) provided detailed description of the relaxation of solvent nuclei around a paramagnetic
center. As equation 1.6 below shows, the observed solvent relaxation rate, 1/Ti, obs , is the
summation of the diamagnetic term 1/Ti, d , corresponding to the relaxation rate of the solvent
nuclei without the paramagnetic solute, and a paramagnetic term 1/Ti, p which is the relaxation
rate augmentation caused by the paramagnetic substance:
pidiobsi TTT ,
1
,
1
,
1+= i = 1,2 (1.6)
This paramagnetic contribution is linearly proportional to the concentration of paramagnetic,
[Gd(III)] :
)]([,
1
,
1IIIGdr
TT idiobsi
+= i = 1, 2 (1.7)
where the parameter r i is the longitudinal or transverse proton relaxivity (mM–1s–1), defined as
the efficiency of a paramagnetic substance to enhance the relaxation rate of water protons. As

16
described by Toth et al. (Toth, Helm et al. 2002), the two key contributors to overall
paramagnetic relaxation rate enhancement and/or relaxivity are the inner sphere, due to the
interaction between the Gd(III) electron spins and the water protons in the first coordination
sphere, and the outer sphere contribution, arising from random translational diffusion of bulk
solvent molecules. The total Gd(III) relaxivity is therefore expressed by the equations below.
OSi
ISi
Pi r + r = r , i = 1, 2 (1.8)
OS
pi
IS
pipi TTT
+
=
,
1
,
1
,
1
(1.9)
where r iIS = 1/Ti,p
IS and r iOS = 1/Ti,p
OS and IS and OS stand for inner and outer sphere
respectively. Efforts to improve the relaxivity of contrast agents generally involve increasing the
inner sphere term since the outer sphere contribution can hardly be modified (Toth, Helm et al.
2002). The most important factors governing relaxivity that can be modified are the rotational
correlation time, proton exchange and the hydration number, q (Toth, Helm et al. 2002; Kubicek
and Toth 2009). However, most efforts to improve relaxivity involve increasing the rotational
correlation time by binding Gd(III) to macromolecular compounds like proteins, polymers and
lipids structures (Toth, Helm et al. 2002; Strijkers, Mulder et al. 2005; Hermann, Kotek et al.
2008; Hak, Sanders et al. 2009).

17
1.7. Microbubbles as MRI Contrast Agents
1.7.1. Microbubbles as Contrast Agents for T2*-weighted MRI
Gas-filled microbubbles have been previously adapted mainly as T2* MR contrast agents.
Studies have demonstrated that microbubbles (without attached MRI contrast media) can
enhance T2* shortening (Alexander, McCreery et al. 1996; Wong, Huang et al. 2004; Cheung,
Chow et al. 2009). T2* is the additional enhancement of the transverse magnetization signal
above of baseline provided by T2 and stems from inhomogeneities in the magnetic field.
Previous results have demonstrated this T2* shortening effect to be microbubble concentration-
dependent. Alexander et al. (Alexander, McCreery et al. 1996) reported T2* shortening from 9
different gas-types and the potential to use the gas-volume dependent susceptibility effect as a
pressure sensor for evaluating cardiovascular function. Cheung et al. (Cheung, Chow et al.
2009) reported T2* shortening at 7 T in the rat brain as a function of microbubble volume fraction
for both sulfur hexafluoride and air-filled microbubbles. Wong et al. (Wong, Huang et al. 2004)
used the T2* shortening induced by Optison (GE Healthcare) microbubbles for intravascular
imaging of the rat liver with MRI. Subsequent studies by Chow et al. (Chow, Chan et al.) and
Yang et al. (Yang, Li et al. 2009) demonstrated additional T2* shortening by loading iron oxide
into the shell of polymeric microbubbles (Chow, Chan et al. ; Yang, Li et al. 2009). Finally, Liu
et al. (Liu, Lammers et al. 2011) reported an additional T2* shortening after polymeric
microbubble fragmentation with ultrasound. The additional shortening after microbubble
fragmentation was attributed to greater interaction of water protons with iron oxide in the shell
fragments.

18
1.7.2. Microbubbles as Contrast Agents for T1-weighted MRI
Currently, the adaptation of gas-filled microbubbles for T1-weighted MRI has been limited.
Ao et al. (Ao, Wang et al. 2010) loaded Gd(III) onto the shell of 1.5-µm diameter polymeric
microbubbles and demonstrated T1 shortening as a function Gd(III)-loaded microbubble
concentration. Additionally, Liu et al. (Liu, Lammers et al. 2011) demonstrated that
fragmentation of iron oxide loaded polymer-shelled microbubbles with ultrasound, not only
shortened T2*, but also T1. In another study, Liao et al (Liao, Liu et al. 2012) developed albumin
microbubbles containing a shell surface-conjugated with Gd(III)-DTPA to serve as dual mode
contrast agents for ultrasound and MR imaging. However, the problem with previously designed
MRI contrast media loaded microbubbles for FUS surgery is that shell material has mainly been
polymer or protein based, which is not ideal for FUS surgery due to their stiffness and limited
ultrasound compliance (Bloch, Wan et al. 2004; Ferrara, Pollard et al. 2007; Sirsi and Borden
2009). Adaptation of Gd(III)-loaded lipid-shelled microbubbles may potentially solve this
problem.
1.8. Research Motivations and Specific Aims
Microbubbles are ubiquitous in nature and are important for many industrial and clinical
applications. Over the past several decades, microbubbles have been developed for biomedical
applications such as CEUS, targeted drug delivery and metabolic gas delivery. Due to their high
echogenicity, acoustic response and biocompatibility, lipid-stabilized microbubbles are most
commonly desired for these applications. More recently, these lipid-stabilized microbubbles have
been adapted for non-invasive surgery with FUS. For instance, microbubbles have been
demonstrated to induce the opening of the BBB in vivo in a non-invasive and transient manner,

19
and at a lower acoustic driving pressure than with convention high intensity FUS and inception
microbubbles (Hynynen, McDannold et al. 2001; Choi, Pernot et al. 2007). However, the
microbubbles used in previous studies tended to be highly polydisperse in size, which poses a
problem since their behavior under ultrasound is very size dependent. Thus, in order to
understand the dependence of microbubble size on FUS-induced BBB opening, a technique that
efficiently selects different microbubbles classes is necessary. Additionally, since the
fragmentation state of a microbubble during or after FUS varies depending on microbubble size
and ultrasound driving parameters, a means to detect the final fragmentation state of a
microbubble is desired. To address these issues this research project was proposed to accomplish
to following aims:
Specific Aims:
1. Develop a method to size select different microbubble size classes rapidly and efficiently
with centrifugation.
2. Develop a means to conjugate an MRI contrast agent, Gd(III,) to the shell of the lipid
microbubble architecture without sacrificing microbubble size monodispersity.
3. Characterize the MR behavior of the Gd(III)-bound size-selected lipid-shelled
microbubbles before and after fragmentation with ultrasound.
The following hypotheses were made regarding these specific aims:
1. Microbubbles are large enough such that Brownian forces are neglected during
centrifugal size separation.

20
2. Hydrodynamic interaction of multiple microbubbles during centrifugal separation can be
accounted for by a second order correlation of the effective fluid viscosity.
3. Lipid-shelled microbubbles are robust enough to withstand the centrifugation speeds (up
to 300 times gravity) without significant degradation.
4. Individual Gd(III)-ligand molecules cannot bind to multiple binding sites at the same
time.
5. Post-labeling of the Gd(III)-ligand chelate to the lipid groups on the microbubble is more
efficient and more cost effective than pre-labeling.
6. The heating from Gd(III) ligand chelation reaction does not significantly degrade
microbubble architecture provided it is below the phase transition temperature of the
main lipid headgroup.
7. Fragmentation/destruction of Gd(III)-bound lipid-shelled microbubbles with a
combination of ultrasound and heating above the phase transition temperature of the main
lipid headgroup, will produce a suspension of lipid vesicles.

21
Chapter 2: Microbubble Size Isolation by Differential Centrifugation
2.1. Introduction
Microbubbles are being employed for several biomedical applications, including contrast
enhanced ultrasound (Feinstein 2004; Lindner 2004), drug and gene delivery (Ferrara, Pollard et
al. 2007; Hernot and Klibanov 2008) and metabolic gas delivery (Burkard and Vanliew 1994;
Kheir, Zurakowski et al. 2007). Microbubbles react strongly to ultrasonic pressure waves by
virtue of their compressible gas cores, which resonate at the MHz-frequencies used by current
clinical scanners. Oscillation of the gas core allows re-radiation (backscatter) of ultrasound
energy to the transducer at harmonic frequencies and nonlinear modes, thus providing exquisite
sensitivity in detection with current contrast-enhanced pulse sequences and signal processing
algorithms. Additionally, microbubbles may cavitate stably or inertially to facilitate drug release
(Borden, Kruse et al. 2005; Lum, Borden et al. 2006) and extravascular delivery (Choi, Pernot et
al. 2007; Stieger, Caskey et al. 2007) within the transducer focus.
Current commercially available microbubble formulations are polydisperse in size. In
most cases, the size distribution is broad over a range of submicron to tens of microns in
diameter. This is problematic because microbubble behavior depends very strongly on size. For
example, increasing the microbubble diameter from 1 to 5 µm will change the resonance
frequency of an unencapsulated microbubble from 4.7 to 0.72 MHz (Wu and Nyborg 2008).
Microbubble size also affects the biodistribution and pharmacodynamics after intravenous
injection, the bioeffects during ultrasound insonification, the gas release profile, and other related
behaviors. Clearly, microbubbles of a specific size with low polydispersity are desired for
advanced biomedical applications (Talu, Hettiarachchi et al. 2007).

22
Efforts to engineer monodisperse microbubble suspensions have mainly focused on
microfluidic technologies. These techniques include flow focusing (Talu, Lozano et al. 2006;
Talu, Hettiarachchi et al. 2007; Talu, Hettiarachchi et al. 2008), T-junctions (Xu, Li et al. 2006)
and electrohydrodynamic atomization (Farook, Stride et al. 2007; Farook, Zhang et al. 2007).
While these techniques provide very low polydispersity, they are rather slow at generating
microbubbles (Pancholi, Farook et al. 2008). Using flow focusing, for example, requires several
hours to produce microbubbles at sufficient numbers for even a single small-animal trial (~0.1
mL x 109 mL-1). Additionally, dust particles can plug micro-channels, thus requiring fabrication
and calibration of a new device. While engineering breakthroughs may eventually allow
efficient and robust generation of monodisperse microbubbles via microfluidic strategies, these
techniques currently remain untenable for biomedical studies.
Mechanical agitation has been the main method to create encapsulated microbubbles for
biomedical applications, since their inception by Feinstein et al. (Feinstein, Shah et al. 1984).
Mechanical agitation is a common emulsification procedure in which a hydrophobic phase (i.e.,
gas) is dispersed within an aqueous surfactant solution by disruption of the interface. Acoustic
emulsification (sonication), for example, generates large quantities of microbubbles (100 mL x
1010 mL-1) rapidly and reproducibly within just a few seconds. Shaking a serum vial with a
device similar to a dental amalgamator produces a sufficient dose of microbubbles (2 mL x 1010
mL-1) for a single patient study, at the bedside in under a minute (Unger, Fritz et al. 1999).
While mechanical agitation is highly efficient at generating microbubbles, the size distributions
tend to be highly polydisperse and thus are not optimal for biomedical applications.
The origins of polydispersity in acoustically generated emulsions were elucidated three
decades ago by Li and Fogler (Li and Fogler 1978; Li and Fogler 1978). Emulsification was

23
reported to occur in two stages. Instability at the water surface results in entrainment of drops
(or bubbles) into the aqueous medium, and subsequent cavitation in the medium results in
droplet breakup to a critical size (Figure 2.1).
Figure 2.1. Cartoon showing origins of polydispersity during acoustic emulsification. Initial
bubble entrainment occurs as a capillary instability. Inset shows relevant length scales.
Subsequent cavitation in the suspension (shown as filled circle with propagating waves)
induces breakup of the larger bubbles to a critical diameter, where surface forces and
inertial forces balance. Figure adapted from Li and Fogler (Li and Fogler 1978; Li and
Fogler 1978).
The first stage, entrainment, occurs as the unstable growth and eventual eruption of interfacial
capillary waves produced by sonication. The second stage of acoustic emulsification involves
the continual cavitation-induced breakdown of larger particles as a function of sonication time
until a stable size is reached. The breakdown mechanism depends on the type of deformation

24
and flow pattern around the droplet. The stable size results when surface tension forces balance
the inertial forces on the droplet. Initial and final droplet size is difficult to predict a priori. The
analysis provided by Li and Fogler for liquid droplets points to the origin of polydispersity as a
consequence of multiple mechanisms acting simultaneously on the multi-body system. Given
that emulsion polydispersity is inherent in mechanical agitation processes, it is desirable to find a
means of separating subpopulations of the particles based on size. This will allow improved
microbubble formulations for advanced biomedical applications.
Previous reports have described the use of flotation to isolate subpopulations from
polydisperse microbubble suspensions. In principle, larger microbubbles are more buoyant and
rise faster, thus allowing separation based on different migration rates in a gravitational field.
Kvale et al. described a model for the size fractionation of air-filled microbubbles by simple
flotation (Kvale, Jakobsen et al. 1996). Microbubbles were injected at the bottom of a stagnant
water column and allowed to rise under normal gravity. The model predicted the size
distribution of microbubbles at certain distances from the bottom of the column as a function of
time. The form of the model was a second-order PDE that accounted for the convective motion
of the bulk dispersed phase (liquid moved down the column as microbubbles moved up) as well
as the Brownian (thermal) diffusive motion of the particles. The crowding effect of the
microspheres was accounted for by using a modified version of Einstein’s derivation for the
effective viscosity in a dilute suspension (Batchelor and Green 1972).
Wheatley et al. reported the isolation of submicron bubbles using differential
centrifugation (Wheatley, Forsberg et al. 2006). Isolation was accomplished by flotation at
normal gravity, or centrifugation at a relative centrifugal force (RCF) of 16 or 45 for pre-
determined time intervals. This method allowed isolation of the submicron bubble fractions.

25
The use of centrifugation reduced the flotation time, but led to destabilization of the surfactant-
stabilized microbubbles during subsequent insonification. Microbubbles centrifuged at 45 RCF
for 1 minute were not stable, whereas those spun at 16 RCF for the same time were relatively
stable. Destabilization was attributed to the extra hydrostatic pressure exerted on the
microbubbles, which increased towards the bottom of the column and in proportion to
centrifugation speed. Flotation at normal gravity was more time consuming, but less detrimental
to microbubble stability.
In contrast to surfactant-coated microbubbles, lipid-coated microbubbles have been
shown to be stable after centrifugation up to several hundred RCF (Takalkar, Klibanov et al.
2004; Zhao, Borden et al. 2004). The lipid shell is highly viscous (Kim, Costello et al. 2003) and
relatively impermeable to gases (Borden and Longo 2004). We therefore sought to further
develop the differential centrifugation method of Wheatley et al. (Wheatley, Forsberg et al.
2006), but as a rapid and facile means to isolate sub-populations of lipid-coated microbubbles.
Below, we report on the experimental characterization of the initial polydisperse suspension, the
development of a method to isolate size fractions of interest for biomedical applications, and
characterization of the long-term stability of the isolated fractions.
2.2. Methods and Materials
2.2.1. Materials
All solutions were prepared using filtered, 18MΩ deionized water (Direct-Q, Millipore, Billerica,
MA). All glassware was cleaned with 70 vol% ethyl alcohol solution (Sigma-Aldrich; St. Louis,
MO) and rinsed with deionized water. The gas used to form microbubbles was perfluorobutane

26
(PFB) at 99 wt% purity obtained from FluoroMed (Round Rock, TX). 1,2-distearoyl-sn-glycero-
3-phosphocholine (DSPC) was purchased from Avanti Polar Lipids (Alabaster, AL) and
dissolved in chloroform (Sigma-Aldrich) for storage. Polyoxyethylene-40 stearate (PEG40S)
was obtained from Sigma-Aldrich and dissolved in deionized water. The fluorophore probe 3,3’-
dioctadecyloxacarbocyanine perchlorate (DiO) solution (Invitrogen; Eugene, OR) was used to
label the microbubbles for part of the experiments.
2.2.2. Microbubble Generation
Microbubbles were coated with DSPC and PEG40S at molar ratio of 9:1. The indicated amount
of DSPC was transferred to a separate vial, and the chloroform was evaporated with a steady
nitrogen stream during vortexing for about ten minutes followed by several hours under house
vacuum. 0.01 M phosphate buffered saline (PBS) solution (Sigma-Aldrich) was filtered using
0.2-µm pore size polycarbonate filters (VWR, West Chester, PA). The dried lipid film was then
hydrated with filtered PBS and mixed with PEG40S (25 mg/mL in filtered PBS) to a final
lipid/surfactant concentration of 1.0 mg/mL. The lipid mixture was first sonicated with a 20-kHz
probe (model 250A, Branson Ultrasonics; Danbury, CT) at low power (power setting dialed to
3/10; 3 Watts) in order to heat the pre-microbubble suspension above the main phase transition
temperature of the phospholipid (~55 oC for DSPC) and further disperse the lipid aggregates into
small, unilamellar liposomes (Kim and Franses 2005). PFB gas was introduced by flowing it
over the surface of the lipid suspension. Subsequently, higher power sonication (power setting
dialed to 10/10; 33 Watts) was applied to the suspension for about 10 seconds at the gas-liquid
interface to generate microbubbles. For flow cytometry and fluorescence microscopy

27
experiments, DiO solution (1 mM) was added prior to high-power sonication at an amount of 1
µL DiO solution per mL of lipid mixture.
2.2.3. Microbubble Washing & Lipid Recycling
The microbubble suspension was collected into 30-mL syringes (Tyco Healthcare, Mansfield,
MA), which were used as the flotation columns. Washing and size fractionation by
centrifugation was performed with a bucket-rotor centrifuge (model 5804, Eppendorf, Westbury,
NY), which had a radius of approximately 16 cm from the center to the syringe tip and operated
between 10 and 4500 RPM. Centrifugation (10 minutes, 300 RCF) was performed to collect all
microbubbles from the suspension into a cake resting against the syringe plunger. The remaining
suspension (infranatant), which contained residual lipids and vesicles that did not form part of
the microbubble shells, was recycled to produce the next batch of microbubbles. All resulting
cakes were combined and re-suspended in PBS to improve total yield.
2.2.4. Size and Concentration Measurements
Microbubble size distribution was determined by laser light obscuration and scattering
(Accusizer 780A, NICOMP Particle Sizing Systems, Santa Barbara, CA). 2-µL samples of each
microbubble suspension were diluted into a 30-mL flask under mild mixing during measurement.
Size distribution was also determined using the electrozone sensing method (Coulter Multisizer
III, Beckman Coulter, Opa Locka, Fl). A 4-µL sample of microbubble suspension was diluted
into a 60-mL flask and stirred continuously to prevent flotation-induced error. A 30-µm aperture

28
(size range of 0.6-18 µm) was used for the measurements. All samples were measured at least
three times by either instrument and analyzed for both number- and volume-weighted size
distributions.
2.2.5. Optical Microscopy
Direct visual confirmation of microbubble size was performed 48 hours after the samples were
prepared using an Olympus 1X71 inverted microscope (Olympus; Center Valley, PA). The
microbubble samples were taken directly from the serum vials and imaged at room temperature.
Images were captured in both bright-field and epi-fluorescence modes using a high-resolution
digital camera (Orca HR, Hamamatsu, Japan) and processed with Simple PCI software (C-
Imaging, Cranberry Township, PA). A 40X objective was used to capture the images of size-
isolated microbubbles of 4-5 µm diameter, while a 100X oil-immersion objective was used for
polydispersed microbubbles and size-isolated microbubbles of 1-2 µm diameter. Subsequent
image analysis was done using ImageJ 1.4g (http://rsb.nih.gov/ij/).
2.2.6. Flow Cytometry
A FACScan Cell Analyzer (Becton-Dickinson, Franklin Lakes, NJ) was used to characterize
microbubble fluorescence intensity (FL) and light scattering profiles (FSC and SSC). Voltage
and gain settings for FSC, SSC and FL were adjusted to delineate the microbubble populations
from instrument and sample noise. 10 µL samples were diluted with 3 mL deionized water prior

29
to each measurement. Subsequent data analysis was done using CellQuest Pro (Becton-
Dickinson, Franklin Lakes, NJ).
2.3. Size Isolation
Differential centrifugation was used to isolate size-selected microbubbles based on their
migration in a centrifugal field (Fig. 2.2). The initial microbubble size distribution and
concentration was measured and imported into a spreadsheet (Excel, Microsoft, Bellevue, WA)
in order to determine the number density for each size channel and the total gas volume fraction.
The spreadsheet was used to calculate the relative centrifugal force (RCF) needed for a
microbubble size class to rise through the column of length L for a fixed centrifugation time.
Following Kvale (Kvale, Jakobsen et al. 1996), Stokes’ equation for the rise velocity of a
buoyant particle relative to the bulk fluid under creeping flow conditions was used as follows:
RCFgru ii
i .9
)(2 2
2
12
ηρρ −
= , (2.1)
where subscript i refers to the particle size class, r i is the particle radius and g is the gravitational
force. The effective viscosity, *2η , of the microbubble suspension was calculated using
Batchelor and Greene’s (Batchelo.Gk and Green 1972) correlation for the modified fluid
viscosity:
2
2
2 6.75.21*
Φ+Φ+=ηη
, (2.2)

30
∑=
Φ=ΦdN
ii
1 , (2.3)
where Φ is total the microbubble volume fraction for Nd size classes. Equations 11-13 were used
to calculate the strength of the centrifugal field (in RCF) for a given initial size distribution, time
period and syringe column length. Volume fraction was assumed to be constant over the entire
column, and acceleration/deceleration effects were neglected.
Figure 2.2. Schematic of differential centrifugation for the size isolation of microbubbles.
Following production, microbubbles were collected into 30-mL syringes (L = 8.2 cm) and
washed, as above. Production-washing was repeated 3-5 times, each time saving the
microbubble cake and recycling the lipid infranatant. The cakes were combined and re-dispersed
into 30 mL of filtered PBS. We noted that in order to ensure a high yield, the concentration of
microbubbles after this step should be at least ~1 volume %. The following protocol was then
used to isolate microbubbles of 1-2 µm and 4-5 µm diameter. At least three separate
experimental runs were performed for each isolation, and size distributions were measured at

31
least three times each. A two-tailed parametric unpaired student t-test was used to determine to
significance between the polydispersity indices (PI) of 1-2 µm and 4-5 µm samples versus that of
freshly made samples.
2.3.1. Isolation of 4-5 µm Diameter Microbubbles
Before beginning the isolation process, care was taken to remove large, visible bubbles that may
have formed during production or subsequent handling. Microbubbles of greater than 10-µm
diameter were removed by performing one centrifugation cycle at 30 RCF for 1 min. The
infranatant consisting of less than 10-µm diameter microbubbles was saved and re-dispersed in
30 mL PBS, while the cake was discarded. Next, microbubbles of greater than 6-µm diameter
were removed by performing one centrifugation cycle at 70 RCF for 1 min. The infranatant
consisting of less than 6-µm diameter microbubbles was saved and re-dispersed to 30 mL PBS;
the cake was discarded. Finally, microbubbles of less than 4-µm diameter were removed by
centrifuging at 160 RCF for 1 min. This was repeated about 5-10 times, while each time the
infranatant was discarded and the cake was re-dispersed in filtered PBS. Alternatively, 12-mL
syringes (L = 6.3 cm) were employed and centrifuged at 120 RCF for 1 min to improve yield.
These cycles were repeated until the infranatant was no longer turbid, indicating complete
removal of microbubbles less than 4 µm. The final cake was concentrated to a 1-mL volume of
20 vol% glycerol solution in PBS and stored in a 2-mL scintillation vial with PFB headspace.

32
2.3.2. Isolation of 1-2 µm Diameter Microbubbles
The infranatant collected from the 4-5 micron isolation was centrifuged at 270 RCF for 1 min for
one cycle in order to remove microbubbles of approximately 3-µm diameter and above by
collecting them into the cake. The infranatant consisted mostly of microbubbles 1-2 µm
diameter. The target microbubbles were collected into a concentrated cake by centrifuging at
300 RCF for 10 min. The final cake was re-dispersed to a 1-mL volume of 20 vol% glycerol
solution in PBS and stored in a 2-mL serum vial with PFB headspace.
2.4. Results
2.4.1. Polydispersity of Freshly Sonicated Microbubbles
Preparation of microbubbles by sonication of a 50 mL lipid mixture resulted in a polydisperse
suspension of approximately 109 to 1010 particles mL-1. Particle sizing with the Accusizer and
Multisizer showed a distribution ranging from the lower limit of resolution, ~0.5 µm, to greater
than 15 µm diameter (Fig. 2.3). A significant portion of the freshly generated suspension
contained submicron microbubbles, as previously reported (Borden, Martinez et al. 2006).
Submicron microbubbles also have been observed by static light scattering (Wheatley, Forsberg
et al. 2006) and freeze-fracture transmission electron microscopy (Brancewicz, Rasmussen et al.
2006). For larger microbubbles, the number-weighted distribution tailed off near 6-8 µm
diameter (Fig. 2.3A). The volume-weighted distribution, however, showed a significant
population out to greater than 10 µm diameter (Fig. 2.3B). Microbubbles with larger diameters
tended to skew the volume-weighted size distribution. Median volume-weighted diameters

33
therefore were chosen in order to judge the samples during size isolation, since this gives a more
rigorous indication of the central tendency than arithmetic mean in a skewed distribution.
Figure 2.3. Size distributions for freshly sonicated microbubbles.
Interestingly, the Accusizer consistently measured distinct peaks centered on approximately 1-2,
4-5, 7-8 and 9-11 µm diameter for each batch of lipid-coated microbubbles. These peaks were
evident on the volume-weighted distribution, but they also could be discerned from the number-
weighted distribution. Similar results were reported previously (Borden, Zhang et al. 2008). In
the laboratory, we have observed these peaks for a variety of gas and lipid combinations (data
not shown). We also measured size distribution using a Multisizer III. While the Accusizer

34
measures size based on light obscuration and scattering, the Multisizer utilizes electrical
impedance sensing of the volume of electrolyte displaced by the microbubble as it passes
through an orifice. Interestingly, the multimodal distribution was not observed on the Multisizer,
which gave a broad distribution with a single peak located at ~1 µm for the number-weighted
distribution and ~8 µm for the volume-weighted distribution. From this data, it was unclear
whether the multimodal distribution was real, and could not be resolved by the Multisizer, or if it
was an artifact of the Accusizer. We therefore sought to better characterize the microbubble
distribution.
Microscopy allowed direct visual inspection of individual microbubbles from the suspension.
Bright-field and epi-fluorescence microscopy images are shown in Figure 2.4. In fluorescence
mode, microbubbles appeared as bright rings with dark centers, clearly showing uptake of DiO
into the shell. In bright-field mode, microbubbles appeared as dark spheres with bright centers.
Diffraction rings were particularly prevalent for the smaller microbubbles. This confirmed the
predominance of gas-filled microbubbles in the suspension. Analysis of the bright-field images
using ImageJ indicated that the distribution of the freshly generated microbubbles was
multimodal, with a mean diameter of 4.0 ± 3.0 µm for the image shown in Figure 2.4A.
Flow cytometry was used to further characterize the polydisperse microbubbles (Fig. 2.5).
Forward- (FSC) and side- (SSC) light scattering measurements were taken. Interestingly, a
serpentine shape was observed on the dot plot of FSC versus SSC for the polydisperse
microbubble suspensions, as shown in Figure 2.5A. The serpentine shape appeared to correlate
with the distinct peaks found by the Accusizer, lending more support to the validity of a
multimodal distribution in the freshly generated microbubble suspension.

35
Figure 2.4. Microscopy images of initial polydisperse and final size-isolated microbubbles.
Shown are bright-field images (left) and fluorescence images (right) of the membrane
probe DiO. Arrows point to microstructural features of high probe density. The initial,
polydisperse microbubble suspensions (A, B) are shown for comparison to the isolated 4–5
µm diameter microbubbles (C, D) and 1–2 µm diameter microbubbles (E, F).

36
Figure 2.5. Dot plots of side scatter (SSC) versus forward scatter (FSC) for polydisperse
and size-isolated microbubbles as determined by flow cytometry. (A) shows the serpentine
trend for the initial polydisperse microbubble suspension (cytometer settings: detector P1,
voltage E01, amp 1.98; detector P2, voltage 287, amp 1.49). (B) shows no serpentine trend
for the isolated 4–5 µm microbubbles (cytometer settings: detector P1, voltage E01, amp
2.30; detector P2, voltage 173, amp 2.88).
The origins of polydispersity in the freshly generated suspension of lipid-coated microbubbles
observed here may be explained by the multiple interacting mechanisms occurring during
entrainment and cavitation-induced disintegration, as described above. The fact that the
microbubbles themselves may be oscillating in the acoustic field and may act as cavitation nuclei

37
adds further complexity to analysis. Additionally, the dynamics of lipid adsorption and
spreading and monolayer shell formation are expected to play a role in determining the apparent
surface tension and, for the lipids used here, may be expected to add additional surface viscosity
and elasticity terms. Marangoni effects are expected to play a central role in both entrainment
and cavitation-induced breakdown (Edwards, Brenner et al. 1991). While polydispersity may be
unavoidable, the ability of mechanical agitation to rapidly generate large numbers of
microbubbles brings this technique to the forefront of current microbubble creation methods.
Given the excellent stability of lipid-coated microbubbles and the apparent presence of distinct
peaks in the multimodal distribution, size isolation by differential centrifugation appeared to be a
feasible approach. In what follows, we describe experiments set at isolating narrow distributions
and characterizing their size distribution and long-term stability.
2.4.2. Size Isolation of Microbubbles
Experiments were performed to isolate relevant subpopulations of the multimodal distribution
and reduce polydispersity. Submicron microbubbles were found to be relatively unstable and
therefore were not isolated. Instead, microbubbles in the 1-2 µm and 4-5 µm diameter ranges
were isolated. These ranges are interesting for biomedical applications. While both sizes are
comparable to that of an erythrocyte, they may possibly yield different biodistributions,
resonance frequencies, and acoustically induced bioeffects. In general, the 1-2 µm microbubbles
were approximately 100-fold more abundant than the 4-5 µm microbubbles in the initial
dispersion.

38
Microbubbles in the larger diameter range (4-5 µm) were isolated first, while the smaller
microbubbles were saved for the subsequent isolation of the 1-2 µm fraction. After repeated
centrifugation and re-concentration according to the simple model, microbubbles with diameters
of 4-5 µm were successfully isolated from the initial polydisperse suspension (Fig. 2.6).
Multiple centrifugation steps were needed to expel smaller microbubbles (< 4 µm), which were
more abundant in the initial suspension. The final 4-5 µm microbubble suspension typically had
a total volume of 1 mL with concentration in the order of 108 to 109 mL-1, as determined by the
Accusizer. Table 2.1 summarizes both averaged number-weighted and volume-weighted mean
and median values for each size fraction.

39
Figure 2.6. Size distributions for initial polydisperse and final size-isolated microbubbles.
Shown are isolated subpopulations at the 1–2 µm (A, B) and 4–5 µm (C, D) diameter size
ranges. Comparison of number-weighted (A, C) and volume-weighted (B, D) size
distributions allows inspection of polydispersity. Results are summarized in Table 2.1.

40
Table 2.1: 1-2 micron and 4-5 micron microbubble size distribution data.
Sample Total Concentration
(#/mL)
Number-Weighted Diameter (µm)
Volume-Weighted Diameter (µm)
PI
(Mean ± SD) (Median ± SD) (Mean ± SD) (Median ± SD)
Initial 1.35E+10 2.1 ± 0.5 1.4 ± 0.6 19.4 ± 17.1 19.0 ± 17.3 10.5 ± 10.6 1-2 um Isolated
2.8E+09 1.3 ± 0.2 1.3 ± 0.2 1.8 ± 0.1 1.5 ± 0.2 1.5 ± 0.2
4-5 um Isolated
1.01E+08 2.8 ± 0.2 3.0 ± 0.2 4.2 ± 0.1 4.1 ± 0.1 1.5 ± 0.1
Microbubbles of 1-2 µm diameter were isolated in fewer steps than for the 4-5 µm
microbubbles. For instance, separation of microbubbles less than 2 µm diameter in the
infranatant was typically completed by a single centrifugation step. However, the final step of
concentrating microbubbles greater than 1-µm diameter required substantially higher centrifugal
force than for the 4-5 µm microbubbles, which is consistent with their lower buoyancy. The
final 1-2 µm microbubble suspension typically had a total volume of 1 mL with concentration on
the order of 109 to 1010 mL-1, as determined by the Accusizer.
In order to assess size uniformity, we defined the polydispersity index (PI) as the volume-
weighted mean diameter divided by the number-weighted mean diameter. Table 2.1 gives the
average PI value for the freshly generated microbubbles and the size-isolated microbubbles. The
initial suspension was highly polydisperse, with PI values as high as 18 but no lower than 6. The
PI for the 4-5 µm fraction was only 1.5 ± 0.1 (p < 0.05), while that of the 1-2 µm fraction was
only 1.5 ± 0.2 (p < 0.05).
Bright-field and epi-fluorescence microscopy images provided direct visual confirmation for the
narrow size distribution of size-isolated microbubbles (Fig. 2.4). Analysis of the bright-field
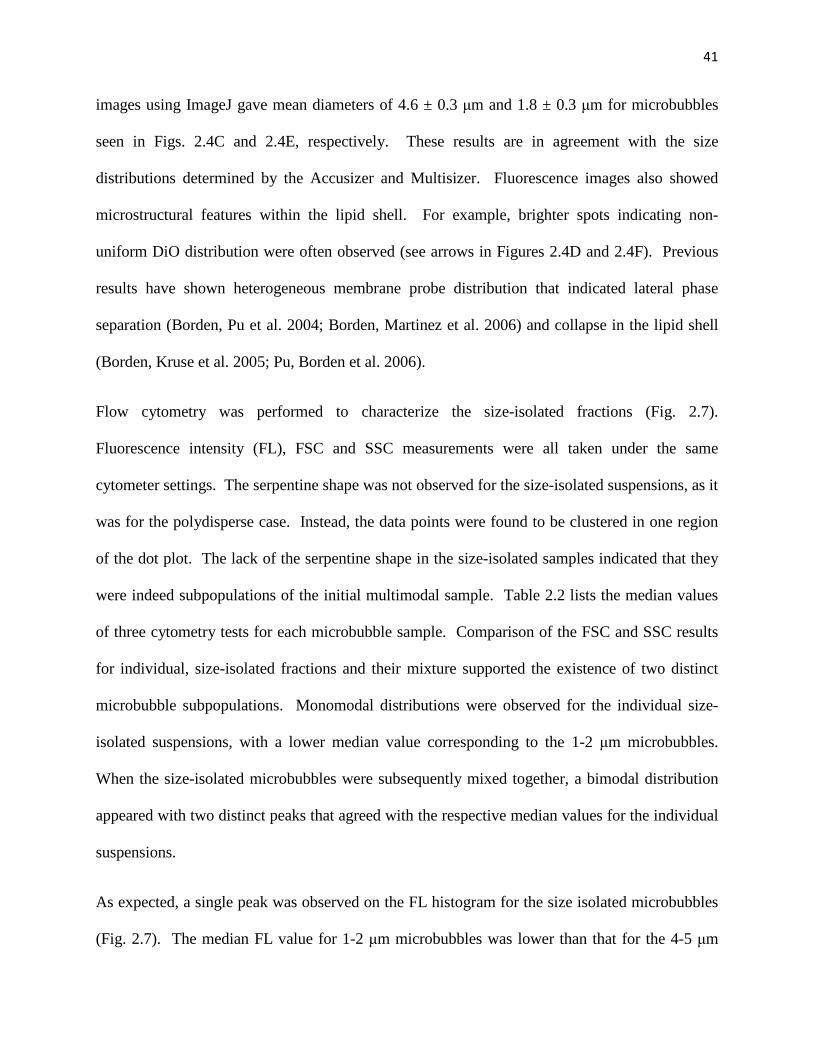
41
images using ImageJ gave mean diameters of 4.6 ± 0.3 µm and 1.8 ± 0.3 µm for microbubbles
seen in Figs. 2.4C and 2.4E, respectively. These results are in agreement with the size
distributions determined by the Accusizer and Multisizer. Fluorescence images also showed
microstructural features within the lipid shell. For example, brighter spots indicating non-
uniform DiO distribution were often observed (see arrows in Figures 2.4D and 2.4F). Previous
results have shown heterogeneous membrane probe distribution that indicated lateral phase
separation (Borden, Pu et al. 2004; Borden, Martinez et al. 2006) and collapse in the lipid shell
(Borden, Kruse et al. 2005; Pu, Borden et al. 2006).
Flow cytometry was performed to characterize the size-isolated fractions (Fig. 2.7).
Fluorescence intensity (FL), FSC and SSC measurements were all taken under the same
cytometer settings. The serpentine shape was not observed for the size-isolated suspensions, as it
was for the polydisperse case. Instead, the data points were found to be clustered in one region
of the dot plot. The lack of the serpentine shape in the size-isolated samples indicated that they
were indeed subpopulations of the initial multimodal sample. Table 2.2 lists the median values
of three cytometry tests for each microbubble sample. Comparison of the FSC and SSC results
for individual, size-isolated fractions and their mixture supported the existence of two distinct
microbubble subpopulations. Monomodal distributions were observed for the individual size-
isolated suspensions, with a lower median value corresponding to the 1-2 µm microbubbles.
When the size-isolated microbubbles were subsequently mixed together, a bimodal distribution
appeared with two distinct peaks that agreed with the respective median values for the individual
suspensions.
As expected, a single peak was observed on the FL histogram for the size isolated microbubbles
(Fig. 2.7). The median FL value for 1-2 µm microbubbles was lower than that for the 4-5 µm

42
microbubbles. Upon mixing, a bimodal distribution was observed with peak median FL values
corresponding to those of the individual suspensions. Assuming that each microbubble is a
perfect sphere and the fraction of fluorophores in the lipid shell is the same for all microbubbles,
regardless of size, the number of fluorophores per microbubble should be directly proportional to
the surface area, or the square of the diameter. This was confirmed when comparing the
averaged FL values versus microbubble squared diameter. The fluorescence intensity value for
the mixture of 1-2 µm and 4-5 µm microbubble samples (775 ± 18) agreed with the average
between the FL values measured for each individual monodisperse suspension (510 ± 16 and
1110 ± 35).

43
Figure 2.7. Fluorescence intensity and light scattering profiles for microbubble suspensions
after size isolation as determined by flow cytometry. Three different tests (fluorescence
intensity FL, forward- (FSC) and side- (SSC) light scattering versus particle count) were
performed for the same sample as represented by each column of plots. Column 1 (A, D, G)
and Column 2 (B, E, H) samples had median volume-weighted diameters of 1.8 and 4.6 µm,
respectively. Column 3 (C, F, I) was a mixture of these two suspensions. Results are
summarized in Table 2.2.

44
Table 2.2: Summary of flow cytometry measurements.
Microbubble Diameter
Fluorescence Intensity
(Median ± SD)
Forward-Light Scattering
(Median ± SD)
Side-Light Scattering
(Median ± SD)
1 - 2 µm 509.54 ± 16.02 137.00 ± 5.29 289.33 ± 4.93
4 - 5 µm 1114.33 ± 35.03 214.33 ± 7.37 417.33 ± 23.50
Mixture 775.17 ± 17.51 193.67 ± 0.58 375.67 ± 1.53
Results from particle sizing, microscopy and flow cytometry showed the ability to isolate distinct
fractions of the microbubbles at the desired size ranges. Next, we determined how stable these
size-isolated suspensions were when stored in the refrigerator. What follows is an analysis of the
shelf-life for size-isolated microbubbles.
2.4.3. Stability of Size-Isolated Microbubbles
For biomedical applications, it is desired that the microbubbles be stable for at least 48
hours at their respective size distributions. A test of microbubble stability was performed using
samples concentrated to 1010 mL-1 for 1-2 µm microbubbles, and 108 mL-1 or 109 mL-1 for 4-5 µm
microbubbles, in a 1-mL volume of 20 vol% glycerol in PBS and stored in a sealed 2-mL serum
vial with PFB headspace (Fig. 2.8). Table 2.3 shows the concentration and PI for the 1-2 and 4-5
µm microbubbles at various time points following size isolation. Both size fractions were stable
over two days. Microscopy after two days storage also indicated the persistence of intact
microbubbles at their isolated size range over this timeframe. However, results indicated that the
microbubbles underwent ripening during longer-term storage. For 1-2 µm microbubbles, the

45
concentration decreased from by an order of magnitude, and PI nearly doubled over a period of
28 days. For 4-5 µm microbubbles at less than 1 vol% encapsulated gas, the concentration
decreased by more than half, and PI nearly doubled over a period of 14 days. Higher
microbubble concentrations provided much greater stability, as seen for the comparison of the 4-
5 µm microbubbles in Fig. 2.8. In general, we found that encapsulated gas fractions greater than
1 vol% were necessary for good stability, particularly when the vial is intermittently opened to
the atmosphere as typically occurs for an in vivo study (data not shown). Interestingly, when
measuring the number-weighted distribution with the Accusizer, the monomodal peak for the 4-5
µm microbubbles changed to a bimodal peak during storage. Figure 2.8C shows that 4-5 µm
microbubbles degraded into 1-2 µm microbubbles as well as larger microbubbles over the test
period. The formation of the larger microbubbles is consistent with Ostwald ripening, in which
small microbubbles shrink at the expense of larger ones (Taylor 1998), as a major factor
affecting microbubble stability.

46
Figure 2.8. Stability of size-isolated microbubbles. Shown are distributions at various time
points for the 1–2 µm (A, B) and 4–5 µm (C, D, E, F) diameter microbubbles. Number-
weighted (A, C, E) and volume-weighted (B, D, F) distributions are shown for inspection of
polydispersity. The suspensions initially were dispersed in 1-mL volume of PBS with 20
vol% glycerol, with a concentration of ∼∼∼∼1010 mL−1 for the 1–2 µm diameter microbubbles
and either <1 vol% (C, D) or >1 vol% (E, F) for the 4–5 µm diameter microbubbles. Each
curve is the average of three experiments with three measurements each. Results are
summarized in Table 2.3.

47
Table 2.3: Summary of stability of size-isolated microbubble suspensions.
Time
Total Concentration
(#/mL)
Volume Fraction (mL/mL)
Number Weighted Diameter (µm)
Volume Weighted Diameter (µm)
PI (Mean ± SD)
(Median ± SD)
(Mean ± SD)
(Median ± SD)
1-2 micron bubble stability
Initial 2.3E+10 ± 1.4E+09 3.7 ± 0.4% 1.3 ± 0.1 1.2 ± 0.1 1.9 ± 0.1 1.8 ± 0.1 1.5 ± 0.1 1 day 8.3E+09 ± 2.9E+09 1.1 ± 0.4% 1.2 ± 0.1 1.2 ± 0.1 1.7 ± 0.1 1.6 ± 0.1 1.4 ± 0.1 7 days 7.6E+09 ± 1.3E+09 1.0 ± 0.2% 1.3 ± 0.1 1.4 ± 0.1 1.8 ± 0.1 1.7 ± 0.1 1.4 ± 0.1 14 days 4.3E+09 ± 4.2E+08 0.79 ± 0.09% 1.4 ± 0.1 1.4 ± 0.1 2.0 ± 0.1 1.7 ± 0.1 1.4 ± 0.1 28 days 1.1E+09 ± 1.3E+08 0.39 ± 0.06% 1.5 ± 0.1 1.4 ± 0.1 4.1 ± 0.1 2.6 ± 0.1 2.8 ± 0.1
4-5 micron bubble stability for suspensions containing less than 1% gas volume
Initial 1.2E+08 ± 2.8E+07 0.34 ± 0.08% 3.2 ± 0.1 3.4 ± 0.1 4.8 ± 0.1 4.5 ± 0.1 1.5 ± 0.1 2 days 1.0E+08 ± 2.5E+06 0.29 ± 0.01% 3.2 ± 0.1 3.4 ± 0.1 4.8 ± 0.1 4.4 ± 0.1 1.5 ± 0.1 7 days 9.6E+07 ± 1.1E+06 0.28 ± 0.03% 3.1 ± 0.1 3.2 ± 0.1 5.3 ± 0.1 4.6 ± 0.1 1.7 ± 0.1 14 days 3.9E+07 ± 8.6E+06 0.15 ± 0.02% 2.8 ± 0.1 2.1 ± 0.1 8.1 ± 0.1 7.6 ± 0.1 3.0 ± 0.1
4-5 micron bubble stability on suspensions containing greater than 1% gas volume
Initial 6.30E+08 ± 2.9E+07 1.9 ± 0.1% 3.3 ± 0.1 3.5 ± 0.1 4.9 ± 0.1 4.3 ± 0.1 1.5 ± 0.1 7 days 5.01E+08 ± 4.6E+07 1.1 ± 0.1% 2.9 ± 0.1 2.9 ± 0.1 4.8 ± 0.3 4.1 ± 0.1 1.6 ± 0.1 28 days 2.98E+08 ± 2.5E+07 1.0 ± 0.2% 3.1 ± 0.1 3.0 ± 0.1 6.2 ± 0.1 6.0 ± 0.1 2.0 ± 0.1

48
The greater stability of 1-2 µm microbubble suspensions versus the 4-5 µm microbubble
suspensions observed here could be explained by the higher concentration of microbubbles,
which itself is a direct result of the more abundant population of the smaller microbubbles. We
found in general that more concentrated suspensions tended to be more stable, regardless of
microbubble size. This presumably was due to a thicker cake coating the top surface that
buffered against film rupture and gas release at the surface (“popping”) that could diminish the
population. However, this does not explain the greater number of 1-2 µm microbubbles in the
initial formulation, nor the observation that the 4-5 µm microbubbles broke down over time into
1-2 µm microbubbles. These two observations clearly point to greater stability for the 1-2 µm
microbubbles in these formulations. The presence of a stable microbubble size is not predicted
by any current theory of microbubble stability. Models that account for microbubble dissolution,
such as Epstein and Plesset’s original formulation (Epstein and Plesset 1950), clearly indicate
that smaller microbubbles should be less stable, due to higher curvature and surface-to-volume
ratio. Yet we observed microbubbles that were more stable at the smaller diameter! This data
correlates well with the stable diameter previously observed during acoustically driven
dissolution (Borden, Kruse et al. 2005; Wrenn 2008), and also the stable diameter reached for
lipid-coated microbubbles made via microfluidics (Talu, Hettiarachchi et al. 2008). However,
submicron bubbles were found to be less stable than 1-2 µm microbubbles, which indicated the
existence of an optimal microbubble size.
What could explain the presence of an optimally stable diameter for these lipid-coated
microbubbles? We speculate that the greater stability is due to microstructural features of the
lipid shell and lipid aggregates present in the continuous phase. Dressaire et al. recently
described the stability of nanopatterned surfactant microbubbles arising from the balance

49
between domain bending and pressure-volume work (i.e., Laplace overpressure) (Dressaire, Bee
et al. 2008). In their analysis, however, size was fixed by the blending conditions. It may be that
size was fixed here by cavitation during acoustic emulsification, according to Li and Fogler’s
analysis (Li and Fogler 1978; Li and Fogler 1978). However, this does not explain the same
stable diameter observed by Talu et al. (Talu, Hettiarachchi et al. 2008) for microbubbles made
by microfluidics, in which no cavitation shock waves were produced, nor does it explain the
stability against acoustically driven dissolution at this size (Borden, Kruse et al. 2005). Future
work on the relationships between lipid nanostructural features and microbubble stability is
clearly warranted to better explain this phenomenon.
2.5. Conclusions
Lipid-coated microbubbles formed by acoustic emulsification were found to be
polydisperse and appeared to be multimodal, with distinct peaks centered near 1-2 and 4-5 µm
diameter. Differential centrifugation was used successfully to isolate narrowly dispersed
fractions at these size ranges. These size ranges are stable over a period of at least two days,
although the 4-5 µm microbubbles were found to disintegrate into 1-2 µm microbubbles after
two weeks. This latter observation indicates a stable diameter in the 1-2 µm range for these
microbubbles, which is supported by observations of microbubbles that underwent acoustically
driven dissolution and those formed by microfluidics. Overall, differential centrifugation
appears to be a useful approach to generate narrow distributions at relevant sizes for biomedical
applications and may lend itself to the study of the surface properties and colloidal behavior of
different microbubble size classes.

50
Chapter 3. Theranostic Gd(III)-Lipid Microbubbles f or MRI-Guided Focused
Ultrasound Surgery
3.1. Introduction
MRI-guided focused ultrasound therapy is a rapidly developing medical technique that
utilizes high intensity focused ultrasound (FUS) to ablate tissue and MRI to monitor the applied
thermal dosage (Cline, Schenck et al. 1992; Hynynen, Darkazanli et al. 1993; Jolesz and
McDannold 2008). MRI-guided FUS therapy is approved by the US Food and Drug
Administration for the treatment of uterine fibroids, and it is currently being developed to treat
liver, bone, prostrate and brain-related diseases (Hudson and Stewart 2008; Jolesz and
McDannold 2008; Jolesz 2009). At high acoustic intensities, gas-filled microbubbles (MBs) may
form and undergo inertial cavitation, producing jets and shockwaves that enhance the heating of
tissue. However, the formation of these inception microbubbles is unpredictable, and their
cavitation can result in tissue damage outside of the desired target region. Pre-formed
microbubbles, which are currently FDA-approved as intravascular contrast agents for
echocardiography, can be used as cavitation nuclei to lower the acoustic intensity threshold
required for tissue ablation with FUS, thereby lowering the thermal buildup in surrounding tissue
(Tran, Seo et al. 2003; Kaneko, Maruyama et al. 2005; Tung, Liu et al. 2006; Yu, Hu et al.
2008). Intravenously administered microbubbles also may be used to enhance vascular
permeability for targeted drug and gene delivery (Unger, Porter et al. 2004; Ferrara, Pollard et al.
2007). For example, microbubbles have been used to lower the acoustic intensity threshold
needed for FUS-induced blood-brain barrier (BBB) opening (Hynynen, McDannold et al. 2001;
Choi, Pernot et al. 2007). For these applications, it would be advantageous to use an MRI-

51
detectable microbubble formulation, which could be used to measure microbubble concentration,
image cavitation events and determine the biodistribution of microbubble shell debris (a potential
surrogate for an attached drug) following FUS. Such microbubbles may also be useful as general
dual modality US/MRI contrast agents.
Previously, microbubbles were demonstrated to enhance the T2*-weighted MRI contrast
in vivo by virtue of the change in magnetic susceptibility at the gas-liquid interface (Wong,
Huang et al. 2004; Cheung, Chow et al. 2009). This negative enhancement was reportedly a
linear function of gas concentration and was further increased in subsequent studies by loading
T2-weighted MRI contrast agents (iron oxide particles) onto the shell of polymeric microbubbles
(Chow, Chan et al. ; Yang, Li et al. 2008; Yang, Li et al. 2009). Recently, Lui et al. (Liu,
Lammers et al. 2011) reported that ultrasonic fragmentation of magnetite-loaded polymeric
microbubbles resulted in greater proton relaxation than for the intact microbubbles. This effect
was attributed to the greater interaction of peripheral water to released iron oxide particles.
These superparamagnetic microbubbles offer significant potential as theranostic agents for MRI-
guided FUS.
An alternative means to produce dual modality US/MRI contrast agents is to load
microbubbles with paramagnetic contrast agents, such as gadolinium ions. Gd(III) enhances the
positive contrast of blood by shortening both the longitudinal and transverse proton relaxation
times, T1 and T2 (Caravan, Ellison et al. 1999; Aime, Botta et al. 2005; Hermann, Kotek et al.
2008). Previously, Gd(III)-DTPA was loaded into the shell of 1.5-µm diameter polymeric
microbubbles (Ao, Wang et al. 2010). The enhancement of the T1-weighted MRI signal was
reportedly a linear function of Gd(III)-DTPA-loaded microbubble concentration. However,
polymeric microbubbles tend to be much stiffer than lipid-coated microbubbles, providing less

52
echogenicity for ultrasound imaging and requiring greater acoustic intensity to induce
microbubble fragmentation and sonoporation for therapy (Hoff, Sontum et al. 2000; Bloch, Wan
et al. 2004).
Lipid-coated microbubbles with Gd(III)-bound shells have not been reported in literature
previously. However, Gd(III)-bound liposomes have been designed and characterized as T1-
weighted MRI contrast agents for applications in cellular and small animal imaging (Ghaghada,
Hawley et al. 2008; Terreno, Castelli et al. 2008; Ghaghada, Ravoori et al. 2009; Hak, Sanders et
al. 2009; Kamaly, Kalber et al. 2010). Liposomes and lipid-coated microbubbles are similar with
respect to their lipid composition and formulation (Ferrara, Borden et al. 2009). The main
difference between the two is that microbubbles consist of a condensed monolayer with a gas
core and are typically a few microns in size, while liposomes consist of a lipid bilayer with an
aqueous core and are usually several hundred nanometers in size. Gd(III) can be loaded into the
liposomal aqueous core and/or conjugated to the lipid polar headgroups in the bilayer
(Ghaghada, Hawley et al. 2008; Ghaghada, Ravoori et al. 2009; Hak, Sanders et al. 2009).
While both strategies were reported to increase the T1-weighted MRI relaxation rate, surface
conjugation resulted in greater relaxation enhancement than encapsulation, owing to greater
access of bulk water protons to the Gd(III) ions (Ghaghada, Ravoori et al. 2009). Owing to the
presence of the gas core and thin monolayer shell, lipid-coated microbubbles can only be
functionalized with Gd(III) ions using a surface conjugation methodology. Since the lipid
coating of microbubble shells self-assembles into liposomal bilayers in the absence of the gas
core, a comparison of the MRI relaxation rates of Gd(III)-bound microbubbles before and after
fragmentation would be necessary.

53
Below, we report the fabrication and characterization of lipid-coated microbubbles that
were surface-conjugated with the paramagnetic MRI contrast agent, Gd(III). Gadolinium was
selected over iron oxide since it works primarily to enhance positive contrast through increasing
longitudinal proton relaxation (Caravan, Ellison et al. 1999). The chelation ligand DOTA was
chosen over DTPA since it forms a more thermodynamically stable complex with Gd(III) (De
Leon-Rodriguez and Kovacs 2008). A stronger chelator is preferred since free Gd(III) ions in
vivo have been associated with nephrogenic systemic fibrosis (Sherry, Caravan et al. 2009).
Additionally, the 4-5 µm microbubble size range was selected because of its increased acoustic
signal and circulation persistence (Sirsi, Feshitan et al. 2010; Streeter, Gessner et al. 2010) and
more effective BBB opening capability compared to polydisperse and smaller size-ranged
microbubbles (Choi, Feshitan et al. ; Tung, Marquet et al. 2011). The resulting microbubbles
were tested for ultrasound contrast in vivo and MRI contrast in vitro. Finally, we report both
longitudinal (R1 = 1/T1) and transverse (R2 = 1/T2) relaxation rates of the Gd(III)-bound
microbubbles before and after they were fragmented into lipid bilayers by sonication.
3.2. Materials and Methods
3.2.1. Materials
All solutions were prepared using filtered, 18 MΩ-cm deionized water (Direct-Q, Millipore,
Billerica, MA). Glassware was cleaned with 70 vol% ethyl alcohol solution (Sigma-Aldrich; St.
Louis, MO) and rinsed with deionized water. The gas used to form microbubbles was
perfluorobutane (PFB) at 99 wt% purity obtained from FluoroMed (Round Rock, TX). 1,2-
distearyol-sn-glycero-3-phosphoethanolamine (DSPE) was purchased from Avanti Polar Lipids

54
(Alabaster, AL). 1,2-distearyol-sn-glycero-3-phosphoethanolamine-N-[methoxy(polyethylene
glycol)2000] (DSPE-PEG(2000)) was obtained from NOF America Corporation (White Plains,
NY). 5/6-carboxyfluorescein succinimidyl ester (FITC-NHS) was purchased from Pierce
(Rockford, IL). 1,4,7,10-Tetraazacyclododecane-1,4,7,10-tetraacetic acid mono(N-
hydroxysuccinimide ester) (DOTA-NHS) was purchased from Macrocyclics (Dallas, TX) and
dissolved in N,N-dimethylformamide (DMF; Sigma-Aldrich) prior to use. Gadolinium (III)
chloride (GdCl3) was purchased from Sigma Aldrich and dissolved in 0.2 M, pH 5.6 acetate
buffer (VWR, Radnor, PA).
3.2.2. Microbubble Generation and Size Isolation
Microbubbles were formulated using a lipid suspension of 90 mol% DSPE and 10 mol% DSPE-
PEG(2000) at 2 mg/mL in 100 mL PBS (pH 7.2; 0.15 M NaCL, 0.2 M phosphate). The solution
was degassed by applying house vacuum with constant stirring. The solution was then preheated
to 80 oC, which is 6 oC above the main phase transition temperature (Tm) of DSPE (Cevc and
Marsh 1985). The lipid mixture was sonicated with a 20-kHz probe (model 250A, Branson
Ultrasonics; Danbury, CT) at low power (3 watts) in order to further disperse the lipid aggregates
into small, unilamellar liposomes. PFB gas was introduced by flowing it over the surface of the
lipid suspension. Higher power sonication (33 watts) was applied to the suspension for about 10
seconds at the gas-liquid interface to generate microbubbles.
The microbubble suspension was collected into 30 mL syringes (Tyco Healthcare, Mansfield,
MA), which were used as the flotation columns. Washing and size-selection by centrifugation
was performed with a bucket-rotor centrifuge (model 5804, Eppendorf, Westbury, NY).

55
Centrifugation at 300 RCF (relative centrifugal force) for 5 min was performed to collect all
microbubbles from the suspension into a cake resting against the syringe plunger. The remaining
suspension (infranatant), which contained residual lipids and vesicles, was recycled to produce
the next batch of microbubbles. All resulting cakes were combined and re-suspended in PBS to
improve total yield.
Microbubble size distribution was determined by laser light obscuration and scattering
(Accusizer 280A, NICOMP Particle Sizing Systems, Santa Barbara, CA). During
measurements, 2 µL samples of each microbubble suspension were diluted into a flask
containing 30 mL of distilled water under mild mixing. All samples were measured in triplicate
and analyzed for both number- and volume-weighted size distributions. The 4-5 µm size class
was isolated as described in chapter 2 and reconstituted in pH 8.5 PBS.
3.2.3. Synthesis of Gd(III)-bound Microbubbles
Microbubbles with Gd(III)-bound shells were fabricated using a post-labeling technique (Chen
and Borden 2010; Chen and Borden 2011). The macrocyclic ligand DOTA-NHS was conjugated
to the amine group of the DSPE in the shell of size-selected microbubbles, followed by chelation
of Gd(III). The NHS ester contains an electrophilic active group that couples rapidly with the
primary amine on DSPE to create a stable amide bond. Figure 3.1 shows a schematic of the
overall conjugation process.

56
Figure 3.1. Synthesis of the Gd(III)-DOTA-DSPE microbubble shells using the post-
labeling technique: (i) 100 M excess DOTA-NHS, pH 8.5; (ii) 20 M excess GdCl3, pH 5.6, T
= 50 or 70 oC; (iii) storage at pH 7.4.
3.2.4. Surface Functionalization with FITC-NHS or DOTA-NHS
Each 4-5 µm microbubble sample was diluted to 2 x 109 MB/mL using pH 8.5 PBS. Following
Chen and Borden, the total amount of available functional lipid groups (DSPE) on the
microbubble surface was calculated assuming that the microbubbles were spherical with an
average molecular area of 0.4 nm2. To test the post-labeling headgroup conjugation method,
FITC-NHS was added to a 100:1 molar ratio of NHS to amine, and the mixture was continually
stirred at room temperature for 2 hours using a benchtop rotary mixer. To chelate Gd(III),
DOTA-NHS was added to a 100:1 molar ratio of NHS to amine, and the suspension was mixed

57
as above. Unreacted FITC-NHS or DOTA-NHS was removed by several cycles of flotation
using 0.2 M, pH 5.6 acetate buffer. The microbubble cake was then analyzed for size with the
Accusizer.
3.2.5. Complexation of Gd(III) to DOTA on Microbubble Shells
Based on the initial concentration and size distribution calculated from the Accusizer, each
sample of DOTA-bound microbubbles was diluted to at least 2 x 109 MB/mL using pH 5.6
acetate buffer. Assuming 100% binding of DOTA to available functional DSPE lipid groups, the
amount of GdCl3 needed for a 20:1 molar ratio of Gd(III) to DOTA was determined and mixed
with the microbubble suspension. The sample mixture was sealed in a 3 mL serum vial then
immersed under continuous stirring in a water bath whose temperature was controlled at 50 oC or
70 oC for 2 hours. After reaction, the sample mixture was cooled to room temperature by
running the vial under cold tap water for 10 min. Excess Gd(III) ions were removed by several
cycles of washing/centrifuging (1 minute, 100 RCF) using pH 5.6 acetate buffer followed by
several cycles of washing/centrifuging using pH 7.4 PBS as solvent medium. The final
microbubble cake was reconstituted to a volume of 1 mL and a concentration of at least 1 x 10⁹
MB/mL using pH 7.4 PBS. The size distribution and concentration of microbubbles after
chelation reaction were determined by the Accusizer. The concentration of Gd(III)-bound to the
microbubble shell was determined by inductively coupled plasma optical emission spectroscopy
(ICP-OES, ACTIVA, HORIBA, Edison, NJ). Destruction/fragmentation of microbubbles in
suspension was accomplished by simultaneous bath sonication and heating to 80 oC for 5 min.

58
3.2.6. Ultrasound Characterization of Gd(III)-bound Microbubbles
All animal experiments were conducted according to the National Institutes of Health guidelines
and approved by the University of Colorado Institutional Animal Care and Use Committee.
Ultrasound imaging was performed using a high-frequency ultrasound scanner (Vevo 2100,
Visualsonics, Toronto, Ontario, Canada) with a MS-250 transducer. Images were acquired using
the contrast mode setting at 18 MHz transmit frequency and 4 % power. The transducer was
positioned at the mouse midsection along the long axis of the kidney. B-mode ultrasound images
were acquired using a field of view of 13 x 16 mm2. Mice were anesthetized with 3 % isoflurane
and tail veins were catheterized for injections, as previously described (Sirsi, Feshitan et al.
2010). A 100-µL bolus (1 x 108 MB/mL) followed by a 15-µL saline flush was injected while
imaging at the maximum frame rate for respiratory gating (~14 frames/second). B-mode images
captured before and after microbubble injection were used to detect signal enhancement using a
background reference subtraction method.
3.2.7. MRI Characterization of Gd(III)-bound Microbubbles
The effect of Gd(III)-bound microbubbles on the T1 and T2 relaxation times was determined
using MRI relaxometry. Intact and fragmented Gd(III)-bound microbubbles were mixed with
saline in four different volume ratios (0, 25, 50 and 100%) creating 200 µL solutions, which were
placed in MR-compatible tubes with an inner diameter of 5 mm. Intact and fragmented 4-5 µm
DOTA-bound microbubbles without Gd(III) binding were used as controls. A 9.4 T vertical
MRI system (Bruker Biospin, Billerica, MA) was used to acquire turbo spin echo (RARE-VTR)
images with variable repetition times (from 300 to 12,500 ms) and multi-slice multi-echo

59
(MSME) images with variable echo times (from 20 to 320 ms) for T1 and T2 mapping,
respectively. This spin-echo sequence reportedly lacks sensitivity to inhomogeneities in the
magnetic field compared to gradient-echo sequences used in susceptibility-weighted imaging of
microbubbles (Berns, Ross et al. 1991; Cheung, Chow et al. 2009). Eight 1.5 mm-thick, axial
slices with a field of view (FOV) of 15×15 mm2 (matrix size: 96×96) covered the entire solution
in each tube. Each slice depicted a slab of all four solutions at a specific height. T1 and T2
relaxation maps of each slice were derived using the Image Processing Toolbox of MATLAB
R2008b (MathWorks Inc., Natick, MA). The first and last slice were not taken into account in
the relaxation measurements, since the MR signal coming from these slices was contaminated by
the void below and over the solution. The pixel-by-pixel estimations were used to generate T1
and T2 maps. Four pre-defined, identical, circular regions of interest (ROI) of 2.35 mm in
diameter were selected on each slice, in order to measure the relaxation rate of each solution
throughout the tube. Each ROI covered a large surface area within the limits of the tube. Six
measurements were made for each tube (from slice 1 to 6) and the mean value yielded the T1 or
T2 relaxation times for each solution. Molar relaxivities (r1 and r2) were calculated from slopes
of regression lines of the plot of R1 and R2 versus Gd(III) concentration. A two-tailed unpaired
student t-test was used to determine the significance between r1 and r2 of fragmented versus
intact samples assuming a Gaussian distribution.

60
3.3. Results
3.3.1. Preparation of Gd(III)-bound Microbubbles
The size isolation protocol yielded 4-5 µm diameter microbubbles at a concentration a least 2 x
109 MB/mL. Figure 3.2 shows visual confirmation of FITC-NHS coupling to the DSPE shell
using epi-fluorescence microscopy. The fluorescence intensity level was not uniform across
individual microbubble, which suggested a heterogeneous coverage of FITC on lipid monolayer.
However, this result confirmed that small molecules (< 1 kDa) could diffuse through the PEG
brush layer to react with the polar lipid headgroups. This is an extension of previous post-
labeling work, which showed reactions occurring on PEG-tethered active groups (Klibanov
2005; Chen and Borden 2010; Chen and Borden 2011), but not with the underlying lipid.
Figure 3.2. Fluorescence microscopy image of 4-5 µµµµm DSPE-coated microbubbles modified
with FITC-NHS using the post-labeling technique. Scale bar represents 10 µµµµm.

61
Figure 3.3 shows the change in size distribution of microbubbles before and after conjugation of
DOTA (at room temperature) to the primary amines on the DSPE shell via NHS coupling. After
DOTA conjugation, microbubble concentration and number-weighted median diameter deviated
by less than 1%. Thus, the DOTA reaction did not appear to increase the lipid headgroup area
sufficiently to affect lipid packing and thereby change microbubble size or stability. We did not
detect Gd(III) binding to DOTA-microbubbles after incubation at room temperature for several
hours (data not shown). The Gd(III)-DOTA complex has been reported to take several days to
complete at room temperature (De Leon-Rodriguez and Kovacs 2008). This is because the rate-
determining step involves the slow, base-assisted rearrangement and deprotonation of an
intermediate before formation of the final complex (Sherry, Caravan et al. 2009). Previous
researchers have completed the Gd(III)-DOTA chelation reaction in 5 min by heating reactants
to 90 oC, or in 20 min by heating to 80 oC (De Leon-Rodriguez and Kovacs 2008). However,
these temperatures are above the main phase transition temperature (Tm) of the lipid component
DSPE (74 oC) and may have resulted in significant microbubble destabilization. We therefore
tested Gd(III) chelation onto microbubbles incubated at 50 oC and 70 oC for 2 hr.

62
Figure 3.3. Number-weighted size distributions of DSPE microbubbles before and after
conjugation with DOTA-NHS.
Figure 3.4 shows the change in size distribution of microbubbles before and after chelation of
Gd(III) under these conditions. After chelation at 50 oC, microbubble concentration decreased
by ~50% while the number-weighted median diameter deviated by less than 1%. After chelation
at 70 oC, however, microbubble concentration decreased by ~65% while the number-weighted
median diameter also decreased by ~30%. From ICP-OES analysis, the Gd(III) chelation on the
microbubble shell occurring at 70 oC and 50 oC was 7.0 x 10⁵ ± 1.6 x 10⁵ (mean ± standard
deviation) and 7.5 x 10⁵ ± 3.0 x 10⁵ ions/µm2, respectively. Therefore, all subsequent chelation
reactions were carried out at 50 oC since the size distribution of microbubbles was maintained at
this temperature without affecting the degree of Gd(III) binding. Under these conditions, the
average Gd(III) loading was 3.6 x 10⁷ ± 1.0 x 10⁷ ions/microbubble. ICP-OES analysis also
determined that negligible amounts of Gd(III) bound to lipid-coated microbubbles without
DOTA (data not shown).

63
Figure 3.4. Number-weighted size distributions of microbubbles before and after Gd(III)
chelation at A) 50 oC and B) 70 oC.
Thus, the post-labeling methodology provided a robust means of generating size-selected, Gd-
DOTA-lipid microbubbles. Previous work showed that small molecules are capable of diffusing
through a PEG overbrush on the microbubble surface to bind to functional groups tethered by
shorter PEG chains (Chen and Borden 2010; Chen and Borden 2011). Here, we showed that the
small molecule DOTA-NHS is capable of diffusing through the PEG brush to bind to a
functional amine on the lipid headgroup. The average molecular area was ~1-2 nm2 per Gd-
DOTA complex. This value was higher than that of the minimum molecular area for a lipid
(~0.4 nm2), indicating that roughly 20-40% of the DSPE was conjugated to Gd-DOTA. This
fraction is similar to previous reports for Gd-DOTA-DSPE liposomes (Hak, Sanders et al. 2009)
and Gd-DTPA bis(stearylamide) liposomes (Ghaghada, Ravoori et al. 2009).

64
3.3.2. Ultrasound Characterization of Gd(III)-microbubbles
Lipid-coated microbubbles labeled with Gd(III) were tested for echogenicity in the mouse kidney
using a preclinical ultrasound scanner. Figure 3.5 shows the B-mode images before and after
microbubble injection. A bolus injection of 1 x 10⁷ Gd(III)-bound microbubbles significantly
increased the fundamental mode backscatter, as was evident by an increase in video intensity and
speckling throughout the kidney region. Higher microbubble doses (e.g., 5 x 10⁸) led to strong
contrast enhancement in the upper portion of the kidney and shadowing in the lower portion
(data not shown). These results show that the Gd(III)-bound microbubbles are highly echogenic
and suitable for contrast-enhanced US imaging.
Figure 3.5. Ultrasound images of the mouse kidney before and after bolus injection of 1 x
107 Gd(III)-bound microbubbles: (Left) pre-injection, (Mi ddle) post-injection, (Right)
contrast enhancement overlay determined using signal subtraction.

65
3.3.3. MRI Characterization of Gd(III)-microbubbles
Figures 3.6a and 3.6b show the T1-weighted and T2-weighted MRI maps of fragmented and
intact Gd(III)-bound and control (DOTA without Gd(III)) microbubbles. Fragmented
microbubbles were produced by the removal of the gas core of intact microbubbles through bath
sonication and heating. The color-coding (from red to blue) indicates a greater relaxation effect
and therefore an MRI signal intensity increase. Figures 3.7a-d show plots of the longitudinal and
transversal relaxation rates (R1 and R2) of intact and fragmented Gd(III)-bound microbubbles as
a function of microbubble concentration, normalized to total Gd(III) concentration using ICP-
OES results, for 4 independent trials. Results also are shown for intact and fragmented control
microbubbles as a function of surface area.
3.3.4. Relaxation Rates of Control Microbubbles and their Fragments
As observed from both the T1- and T2-weighted color-coded MRI maps (Fig. 3.6), the control
microbubbles (DOTA without Gd(III)) produced an MRI signal similar to baseline (saline),
which did not deviate significantly with an increase in microbubble concentration. This is
further evident in the plot of the relaxation rate versus increasing microbubble surface area for
both R1 and R2 (Fig. 3.7a,b). The lack of a significant relaxation effect was found for both intact
and destroyed control microbubbles.
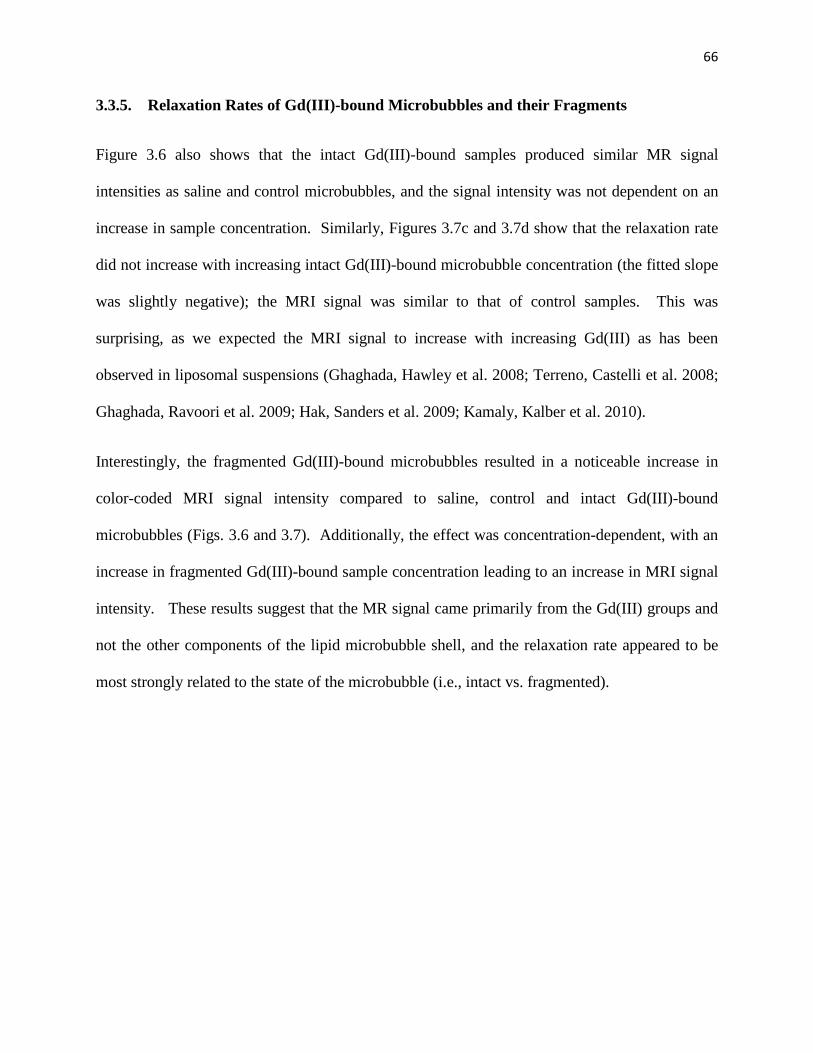
66
3.3.5. Relaxation Rates of Gd(III)-bound Microbubbles and their Fragments
Figure 3.6 also shows that the intact Gd(III)-bound samples produced similar MR signal
intensities as saline and control microbubbles, and the signal intensity was not dependent on an
increase in sample concentration. Similarly, Figures 3.7c and 3.7d show that the relaxation rate
did not increase with increasing intact Gd(III)-bound microbubble concentration (the fitted slope
was slightly negative); the MRI signal was similar to that of control samples. This was
surprising, as we expected the MRI signal to increase with increasing Gd(III) as has been
observed in liposomal suspensions (Ghaghada, Hawley et al. 2008; Terreno, Castelli et al. 2008;
Ghaghada, Ravoori et al. 2009; Hak, Sanders et al. 2009; Kamaly, Kalber et al. 2010).
Interestingly, the fragmented Gd(III)-bound microbubbles resulted in a noticeable increase in
color-coded MRI signal intensity compared to saline, control and intact Gd(III)-bound
microbubbles (Figs. 3.6 and 3.7). Additionally, the effect was concentration-dependent, with an
increase in fragmented Gd(III)-bound sample concentration leading to an increase in MRI signal
intensity. These results suggest that the MR signal came primarily from the Gd(III) groups and
not the other components of the lipid microbubble shell, and the relaxation rate appeared to be
most strongly related to the state of the microbubble (i.e., intact vs. fragmented).

67

68
Figure 3.6. Color maps of MRI relaxation time for intact and fragmented microbubble
samples. Longitudinal relaxation time (A) and transverse relaxation time (B) increases
from blue to red, as shown. Samples are arranged shown: row 1) intact DOTA-bound
control microbubbles; 2) fragmented DOTA-bound control microbubbles; row 3) intact
Gd(III)-bound microbubbles; row 4) fragmented Gd(III)-boun d microbubbles. Students t-
tests showed that, for a given microbubble sample, T1 and T2 were not statistically different
between vertical slices.

69
Figure 3.7. Relaxation rates of intact and fragmented microbubble samples. A) R1 versus
MB surface area; B) R2 versus MB surface area; C) R1 versus Gd(III) concentration; D) R2
versus Gd(III) concentration.
3.3.6. Molar Relaxivities of Gd(III)-bound Microbubbles
Molar relaxivities (mM-1s-1) were calculated from the slopes of the linear trendlines in Figures
3.7c and 3.7d and are shown in Table 3.1. Fragmentation of the intact Gd(III)-bound
microbubble samples led to a 40-fold increase in longitudinal molar relaxivities r1 (p < 0.05) and
a 32-fold increase in transverse molar relaxivities r2 (p < 0.05). Thus, both r1 and r2 for the
fragmented Gd(III)-bound microbubbles were greater than the corresponding values for the

70
intact Gd(III)-bound microbubbles. A potential mechanism for this surprising phenomenon is
discussed below.
Table 3.1: Relaxivity of Intact and Fragmented Gd(III)-bound Microbubbles
r1 (mM-1s-1) r2 (mM-1s-1)
r1/MB
(s-1/MB)
r2/MB
(s-1/MB)
Intact MBs -0.1 ± 0.10 3.8 ± 5.8 -3.6 x 10⁶ 1.4 x 10⁸
Destroyed MBs 4.0 ± 0.4 120.2 ± 17.7 1.4 x 10⁸ 4.3 x 10⁹
3.4. Discussion
The relaxivity values in table 3.1 were determined from the quantifying the relative changes in
signal intensity from MRI images. This relaxivity values do not necessarily represent actual
theoretical values based on relaxation theory. This is because the MRI protocol used is designed
primarily for making qualitative comparisons between images whose quality may change
depending on machine sensitivity. One way to determine accurate values of relaxivity would be
to employ standardized techniques like Nuclear magnetic resonance (NMR) spectroscopy.
Surprisingly, we found that the relaxivity of Gd(III)-lipid monolayer-coated microbubbles
increased significantly after destruction by sonication to form bilayer fragments. One
explanation is that the presence of the microbubble gas core weakened the MRI signal intensity
owing to susceptibility effects. However, the small difference in relaxation rates between intact
and fragmented control microbubbles, and the lack of concentration dependence for these

71
samples (Fig. 3.7), does not support this explanation. We propose an alternative explanation for
this phenomenon based on the difference in bulk water access to the Gd(III)-DOTA-DSPE
complex for microbubbles versus liposomes (Fig. 3.8). Gd(III) is a paramagnetic ion that must
interact with and exchange nearby water protons via its inner core (first hydration layer) in order
to have a measurable effect on relaxivity (Toth, Helm et al. 2002). Intact microbubbles, which
comprise a highly condensed monolayer shell held under compression by Laplace pressure-
driven dissolution (Kim, Costello et al. 2003; Duncan and Needham 2004), may have restricted
access of aqueous protons to the Gd(III) ion. Fragmentation of the microbubble converted the
lipid to a more relaxed liposomal bilayer configuration, which may have allowed for greater
access of water molecules to the Gd(III) complex, thus allowing a greater relaxation
enhancement. The average area per lipid molecule for a fully compressed monolayer may be as
low as 0.32 nm2 (Saad, Policova et al. 2009), which is 25 % less than that for a typical gel-phase
bilayer of 0.48 nm2 (Lewis and Engelman 1983; Israelachvili 1992; Nagle and Tristram-Nagle
2000; Petrache, Dodd et al. 2000). We therefore propose that the tighter lipid packing in the
monolayer configuration silences the relaxation effect by inhibiting water proton exchange
between the Gd(III) complex and the bulk, whereas looser packing in the bilayer configuration
provides sufficient exchange to significantly affect relaxation. This mechanism is supported by
recent results for magnetite-bearing polymeric microbubbles, in which a rise in longitudinal and
transversal relaxivities was found following microbubble destruction and release of the iron
oxide particles (Liu, Lammers et al. 2011).

72
Figure 3.8. Cartoon showing proposed mechanism for MRI relaxivity increase with the
cavitation-induced conversion of lipid from the compressed monolayer form on the intact
microbubble to the relaxed bilayer form of the fragments. The lipid molecular area and
hydrocarbon membrane thickness are estimated to be 0.32 nm2 and 2.2 nm for the
condensed monolayer (Saad, Policova et al. 2009; Israelachvili 2011) and 0.48 nm2 and 2.4
nm for the relaxed, gel-state bilayer (Lewis and Engelman 1983; Nagle and Tristram-Nagle
2000; Petrache, Dodd et al. 2000; Israelachvili 2011). The parameters shown in the
schematic are the outer hydration shell of the Gd(III) ion, OS; the inner hydration shell,
IS; the molecular tumbling time, τR; and the proton exchange rate from the OS to the IS,
kex. It is proposed that the ability of the Gd(III) ion to magnetize bulk water protons, i.e.,
the value of kex, increases as the lipid packing relaxes during the monolayer-to-bilayer
transition.

73
Regardless of the underlying mechanism, this behavior of Gd(III)-bound microbubbles may have
useful implications for MRI-guided FUS therapy. Using the Gd(III)-bound microbubbles
fabricated here, one may envision that microbubble cavitation within the ultrasound focus can be
spatially and temporally controlled in situ via monitoring of the MRI signal increase as the
Gd(III)-DOTA-DSPE is converted from monolayer to bilayer. Cavitation detection during
focused ultrasound surgery may serve as a method to guide and monitor therapeutic effects and
prevent unwanted bioeffects (Farny, Holt et al. 2009; O'Reilly and Hynynen 2010; Hsieh, Smith
et al. 2011). For example, Huang et al. (Huang, Xu et al. 2010) recently proposed to use phase-
change agents, such as perfluorocarbon-liquid emulsion droplets that vaporize upon heating, to
detect the margins of ablation during high-intensity focused ultrasound. Here, we propose an
alternative strategy, in which Gd(III)-lipid microbubbles may serve as both a source and MRI
beacon for acoustic cavitation. Following the proposed mechanism given above, the MRI signal
would increase from baseline tissue contrast to positive contrast, in a dose-dependent manner, as
microbubbles are fragmented. The change in signal intensity would provide a measure of the
microbubble cavitation dose within the region of interest. Thus, the Gd(III)-microbubbles
developed here may serve as a theranostic agent to monitor treatment and minimize the side
effects associated with FUS.

74
3.5. Conclusions
Chelation of the paramagnetic lanthanide Gd(III) to the DOTA ligand on the surface of lipid-
shelled microbubbles was achieved at a reaction temperature of 50 oC without degrading the 4-5
µm microbubble size distribution. The microbubbles were echogenic and provided contrast
during high-frequency ultrasound imaging in vivo. Surprisingly, MRI relaxometry showed that
intact Gd(III)-bound microbubbles did not significantly enhance longitudinal or transverse
proton relaxation. However, the bilayer fragments of Gd(III)-bound microbubbles formed by
cavitation resulted in a significant increase r1 and r2. A mechanism based on bulk water access
to the Gd(III) complex was proposed to explain the increase in MRI signal intensity observed
upon conversion of the condensed monolayer form to the relaxed bilayer form. Gd(III)-bound
microbubbles could find use as cavitation probes for MRI-guided FUS therapy applications.

75
Chapter 4. Magnetic Resonance Properties of Gd(III)-Bound Lipid-Coated
Microbubbles and their Cavitation Fragments
4.1. Introduction
Magnetic resonance imaging guided focused ultrasound surgery (MRIgFUS) is a rapidly
developing medical technique that uses high intensity focused ultrasound to ablate tissue and
magnetic resonance (MR) thermometry to monitor treatment (Cline, Schenck et al. 1992; Jolesz
and Hynynen 2002; Jolesz and McDannold 2008). Formation and transient cavitation of gas-
filled microbubbles nucleated from dissolved gases in tissue and blood plays an integral role in
the efficacy of this therapy (Jolesz and McDannold 2008). However, the nucleation of cavitation
sites is unpredictable and can lead to deleterious effects outside the targeted region. Thus, it is
preferable to use preformed, stabilized microbubbles (1-10 µm diameter) that can interact with
ultrasound waves in a more predictable manner (Jolesz and McDannold 2008). Lipid-coated
microbubbles are currently approved by the U.S. Food and Drug administration (FDA) for
echocardiography and are currently being developed for expanded imaging capabilities (Lindner
2004; Qin, Caskey et al. 2009) and therapeutic applications in drug, gene and gas delivery
(Ferrara, Pollard et al. 2007; Coussios and Roy 2008; Swanson, Mohan et al. 2010; Sirsi,
Hernandez et al. 2012). One potential therapeutic application of microbubbles is the non-
invasive, localized and transient opening of the blood-brain-barrier (BBB) for targeted drug
delivery to the brain. Previously, lipid-coated microbubbles were shown to reduce the acoustic
threshold needed for opening of the BBB in vivo (Choi, Feshitan et al. ; Hynynen, McDannold et
al. 2001; Choi, Pernot et al. 2007; Xie, Boska et al. 2008; Marquet, Tung et al. 2011). In
addition to disrupting vasculature, microbubbles also have been designed to deliver a therapeutic

76
payload (Ferrara, Pollard et al. 2007; Lentacker, De Smedt et al. 2009). However, methods are
unavailable to use MRI for tracking microbubbles and their interactions with ultrasound. It
therefore is desirable to develop MR-detectable microbubbles, so that MRI can be used to
monitor and control not only thermal ablation, but also pharmaceutical delivery.
In chapter 3, the MRI-contrast agent Gd(III)-DOTA was conjugated to the lipid shell of
size-selected gas-filled microbubbles using a post-labeling technique. Gd(III)-DOTA was
conjugated to the primary amine on the headgroup of phosphatidylethanolamine (PE). The effect
of Gd(III)-bound microbubble cavitation on the MR signal (at 9.4 T) was determined by
comparing r1 and r2* of 4-5 micron-sized gas core-containing Gd(III)-bound microbubbles to
those of microbubbles that were fragmented by inertial cavitation into lipid fragments.
Surprisingly, both r1 and r2* increased after the fragmentation of intact Gd(III)-bound
microbubbles. The explanation for this phenomenon was based on the difference in bulk water
access to the lipid headgroup-labeled Gd(III)-complex for microbubbles versus the lipid
fragments. Paramagnetic Gd(III) ions reportedly enhance MR signal by interacting with nearby
water protons (Toth, Helm et al. 2002). Intact microbubbles, which comprise a highly condensed
monolayer shell, may restrict access of aqueous protons to the Gd(III) bound lipid headgroup.
Microbubble fragmentation converts the Gd(III) bound PE monolayer to a more relaxed
liposomal bilayer structure, which may allow for greater access of water molecules to the
Gd(III), increasing R1 and enabling higher signal intensities in T1-weighted images.
One method of testing this hypothesis is to characterize the MR relaxation properties of
intact and fragmented lipid microbubbles comprising a shell with Gd(III) preferentially
conjugated to a long, flexible linker, such as the distal group on the polyethylene glycol (PEG)

77
brush on the lipid monolayer encapsulation. Microbubble (or liposome) design requires the PEG
brush to provide stability against coalescence (or fusion) and to protect against an immunogenic
response in vivo (Allen 1994; Ferrara, Pollard et al. 2007). Although, liposomes with Gd(III)-
labeled lipid headgroups have been designed for cellular and vascular imaging applications
(Strijkers, Mulder et al. 2005; Ghaghada, Ravoori et al. 2009; Hak, Sanders et al. 2009), neither
liposomes nor microbubbles with Gd(III) conjugated to the PEG brush have been documented.
Comparison between the MR signal intensity induced by PEG-labeled Gd(III)-microbubbles and
their liposomal fragments may shed some light into the exchange rate hypothesis that was
originally proposed to explain the behavior of lipid headgroup-labeled Gd(III)-microbubbles
under fragmentation.
The microbubble gas core may also affect longitudinal and transverse relaxation.
Previously, gas-filled microbubbles without Gd(III) reportedly enhanced R2* in a dose-dependent
manner (Alexander, McCreery et al. 1996; Wong, Huang et al. 2004; Cheung, Chow et al. 2009).
R2* is the additional enhancement of the transverse magnetization signal above of baseline R2
that stems from inhomogeneities in the magnetic field. The R2* enhancement produced by the
microbubbles was attributed to the differences in magnetic susceptibility at the gas-liquid
interface, which creates local inhomogeneities in the magnetic field that affect R2* decay. The
equation given below relates the approximate magnetic field perturbation caused by a single,
isolated spherical gas-filled microbubble at a position described by cylindrical coordinates (r, θ)
(Chu, Xu et al. 1990; Xu and Haacke 2006):

78
( ) ( ) ( )1cos3/3/4/),( 23 −∆=∆ θχπθ rRBrB o (4.1)
where ∆B is the magnetic field perturbation, Bo is the static magnetic field vector, ∆χ represents
the magnetic susceptibility difference between gas and liquid and R is the sphere radius. Thus,
the degree of magnetic field perturbation caused by the presence of a single gas bubble during
MR analysis is theoretically dependent on gas volume and the susceptibility differences at the
gas-liquid interface. Alexander et al. (Alexander, McCreery et al. 1996) reported R2*
enhancement from 9 different gas-types and the potential to use the gas-volume dependent
susceptibility effect as a pressure sensor for evaluating cardiovascular function. Cheung et al.
(Cheung, Chow et al. 2009) reported an increase of R2* at 7 T in the rat brain as a function of
microbubble volume fraction for both sulfur hexafluoride and air microbubbles. Wong et al.
(Wong, Huang et al. 2004) used the R2* enhancement induced by Optison (GE Healthcare)
microbubbles for intravascular imaging of the rat liver with MRI. Subsequent studies by Chow
et al. (Chow, Chan et al.) and Yang et al. (Yang, Li et al. 2009) demonstrated additional
enhancement of R2* by loading iron oxide into the shell of polymeric microbubbles (Chow,
Chan et al. ; Yang, Li et al. 2009). Finally, Liu et al. (Liu, Lammers et al. 2011) reported an
additional enhancement of both R1 and R2* after microbubble fragmentation with ultrasound.
The additional MR enhancement after fragmentation was attributed to greater interaction of
water protons with iron oxide in the shell fragments. For lipid microbubbles loaded with
paramagnetic Gd(III), it is desirable to determine the effects the paramagnetic ions and gas core
will have on the MR signal, and ultimately what the implications are for applications in
MRIgFUS.

79
In this report, the effects of microbubble gas core and Gd(III) conjugation on R1 and R2* were
determined quantitatively by NMR. The microbubble shell used in this study is lipid-based
because of the advantages in biocompatibility and ultrasound compliance when compared to
polymeric agents (Bloch, Wan et al. 2004). A post-labeling protocol was used to generate lipid
headgroup-labeled or PEG-labeled Gd(III)-microbubbles, and microbubbles without Gd(III)
conjugated to the shell served as controls. The changes in r1 and r2* of both lipid headgroup-
labeled and PEG-labeled Gd(III)-microbubbles after fragmentation were used to determine the
potential mechanisms responsible for an increase in MR signal of fragmented lipid headgroup-
labeled Gd(III) microbubbles.
4.2. Materials and Methods
4.2.1. Materials
All solutions were prepared using filtered, 18 MΩ cm deionized water (Direct-Q, Millipore,
Billerica, MA). All glassware were cleaned with 70 vol% ethyl alcohol solution (Sigma-Aldrich;
St. Louis, MO) and rinsed with deionized water. The gas used to form microbubbles was
perfluorobutane (PFB) at 99 wt% purity obtained from FluoroMed (Round Rock, TX). 1,2-
distearyol-sn-glycero-3-phosphoethanolamine (DSPE) and 1,2-distearoyl-sn-glycero-3-
phosphoethanolamine-N-[amino(polyethylene glycol)-2000] (DSPE-PEG(2000)-amine) were
purchased from Avanti Polar Lipids (Alabaster, AL). 1,2-distearyol-sn-glycero-3-
phosphoethanolamine-N-[methoxy(polyethylene glycol)5000] (DSPE-PEG(5000)) was obtained
from NOF America Corporation (White Plains, NY). 1,4,7,10-Tetraazacyclododecane-1,4,7,10-
tetraacetic acid mono(N-hydroxysuccinimide ester) (DOTA-NHS) was purchased from

80
Macrocyclics (Dallas, TX) and dissolved in N,N-dimethylformamide (DMF; Sigma-Aldrich)
prior to use. Gadolinium (III) chloride (GdCL3) was purchased from Sigma Aldrich and
dissolved in 0.2 M, pH 5.6 acetate buffer (VWR, Radnor, PA).
4.2.2. Microbubble Generation and Size Isolation
Microbubbles with primary amine lipid groups were formulated using a lipid suspension of 90%
DSPE and 10% DSPE-PEG(5000) at 2 mg/mL in 100 mL PBS (pH 7.2, 0.15 M NaCL, 0.2 M
phosphate). Microbubbles with primary amine PEG groups were formulated using a lipid
suspension of 90% DSPC and 10% DSPE-PEG(2000)-amine at 2 mg/mL in 100 mL PBS. The
lipid DSPC was selected to prevent headgroup conjugation. Each solution was degassed by
applying house vacuum with constant stirring. The DSPE/DSPE-PEG(5000) solution was then
preheated to 6 oC above the main phase transition temperature (Tm = 74 oC) of DSPE (Cevc and
Marsh 1985). Similarly, the DSPC/DSPE-PEG(2000)-amine solution was then preheated to 5 oC
above the main phase transition temperature (Tm = 55 oC) of DSPC.
The lipid mixture was sonicated with a 20-kHz probe (model 250A, Branson Ultrasonics;
Danbury, CT) at low power (3 W) to disperse the lipid aggregates into small, unilamellar
liposomes. PFB gas was introduced by flowing it over the surface of the lipid suspension.
Higher power sonication (33 W) was applied to the suspension for about 10 seconds at the gas-
liquid interface to generate microbubbles. Size distribution of the microbubbles was determined
by laser light obscuration and scattering (Accusizer 780A, NICOMP Particle Sizing Systems,
Santa Barbara, CA). During measurements, 2 µL samples of each microbubble suspension were

81
diluted into a flask containing 30 mL of distilled water under gentle mixing. All samples were
measured in triplicate and analyzed for both number- and volume-weighted size distributions.
The size-selected microbubbles used in this study were 1-2 µm in size since this size range
provided lower buoyancy and, consequently, improved measurement consistency during NMR
data collection as compared to the 4-5 µm bubbles. The 1-2 µm microbubble size distribution
was refined using methods described in chapter 2.
4.2.3. Synthesis of Headgroup-labeled (Gd(III)-PE) and PEG-labeled (Gd(III)-PEG-PE)
Microbubbles
Gd(III)-bound microbubbles shells were fabricated using the post-labeling technique (Figure 4.1)
described in chapter 3. To summarize briefly, during headgroup labeled Gd(III)-microbubble
(Gd(III)-PE) formulation, the macrocyclic ligand DOTA was conjugated via an NHS reaction at
room temperature to the primary amine located on the headgroup of DSPE. Excess DOTA-NHS
ions were removed by several cycles of washing/centrifugation (5 minute, 300 RCF) using pH
5.6 Acetate buffer. The lanthanide Gd(III) was chelated to the DOTA group bound to the lipid
headgroup. The chelation reaction was carried out at 50 oC for 2 hours. Excess Gd(III) ions
were removed by several cycles of washing/centrifugation (5 minute, 300 RCF) using pH 5.6
Acetate buffer followed by several cycles of washing/centrifugation using pH 7.4 PBS.

82
Figure 4.1: Schematic of Gd(III)-DOTA conjugation to microbubble shell. A) Gd(III)-PE.
B) Gd(III)-PEG-PE.
Similarly, PEG-labeled Gd(III) microbubbles (Gd(III)-PEG-PE) were fabricated using the same
post-labeling technique. DOTA was conjugated to the primary amine group located on the distal
end of DSPE-PEG(2000) amine. Excess DOTA-NHS ions were removed by several cycles of
washing/centrifugation (5 minute, 300 RCF) using pH 5.6 Acetate buffer. The lanthanide
Gd(III) was chelated to the DOTA group bound to the PEG-PE group. The chelation reaction
was carried out at 45 oC for 2 hours. Excess Gd(III) ions were removed by several cycles of
washing/centrifugation (5 minute, 300 RCF) using pH 5.6 Acetate buffer followed by several
cycles of washing/centrifugation using pH 7.4 PBS.

83
4.2.4. Characterization of Gd(III)-bound Microbubbles and Cavitation Fragments
Microbubble size distribution and concentration after chelation reaction were determined by
using the Accusizer. The concentration of Gd(III) bound to the microbubble shell was
determined by inductively coupled mass spectroscopy (ICP-MS, Agilent technologies, Santa
Clara, CA). Destruction/fragmentation of Gd(III)-PE and Gd(III)-PEG-PE microbubble
suspensions was accomplished by simultaneous bath sonication and heating to 80 oC and 60 oC
for 10 mins respectively. A Malvern ZetaSizer (Worcestershire, United Kingdom) was used to
determine the size of liposomal fragments.
4.2.5. NMR Characterization of Intact and Fragmented Gd(III)-bound Microbub bles
The effect of the Gd(III)-bound microbubbles on the T1 and T2* relaxation times was determined
using NMR. Intact Gd(III)-PE or Gd(III)-PEG-PE microbubbles suspension at a concentration
of at least 3 x 10¹⁰ mL-1 were mixed with saline in four different volume ratios (25, 50, 75 and
100 %) in a 2 mm outer diameter NMR compatible capillary tube (Wilmad-LabGlass, Vineland,
NJ), which was flame-sealed. The average starting Gd(III) concentration of Gd(III)-PE and
Gd(III)-PEG-PE samples was 0.45 mM and 0.1 mM respectively. Intact and fragmented 1-2 µm
microbubbles without Gd(III) binding were used as controls. End-over-end mixing, performed
five times before each measurement, homogenized the microbubble suspensions and further
mitigated the effects of bubbles rising due to their buoyancy. A 1.5 T vertical NMR
spectroscopy system was used to measure T1 and T2* relaxation times. T1 relaxation times were
determined using an inversion recovery sequence with recovery times ranging from as low as 1

84
ms up to 30 s. T2* relaxation times were determined using a Carr-Purcell-Meiboom-Gill
(CPMG) sequence with a 4 ms intercho time, and a repetition time of at least 5 T1 for each
sample. The T1 and T2* times induced by the intact microbubbles were measured first. Next, the
sealed capillary containing the intact microbubbles was heated and sonicated to produce a
solution of Gd(III)-bound lipid fragments. Fragmentation of Gd(III)-PE and Gd(III)-PEG-PE
microbubbles were accomplished by heating to 80 oC and 60 oC for 10 minutes respectively.
Finally, the T1 and T2* times induced by the fragmented microbubbles were determined. All T1
and T2* measurements were repeated in triplicate. Molar relaxivities (r1 and r2
*) were calculated
from slopes of regression lines of the plot of R1 and R2* versus Gd(III) concentration. A two-
tailed unpaired student t-test was used to determine the significance between r1 and r2* of
fragmented versus intact samples assuming a Gaussian distribution.
4.3. Results and Discussions
4.3.1. Preparation of Gd(III)-bound Microbubbles
4.3.1.1. Headgroup-labeled Microbubbles (Gd(III)-PE)
The size isolation technique produced 1-2 µm diameter microbubbles at a concentration of a
least 1 x 10¹¹ mL-1. Figure 4.2a shows the size distribution of microbubbles before and after
DOTA conjugation to the amine-containing lipid (DSPE) on the monolayer via an NHS-coupling
reaction at room temperature. The average microbubble concentration decreased by
approximately 41 % after DOTA conjugation. Figure 4.2b shows the size distribution of
microbubbles before and after Gd(III) chelation to DOTA bound to the DSPE monolayer at 50
oC. The average microbubble concentration decreased by 54 % after the 2-hour chelation

85
reaction. The mean and median number diameter of microbubbles changed by less than 1%
before and after DOTA conjugation and Gd(III) chelation. This indicated that the post-labeling
strategy to available PE groups reduced microbubble concentration but minimally affected 1-2
micron size monodispersity. The average Gd(III) ions per Gd(III)-PE microbubble determined
by ICP-MS was 7.3 x 10⁶ ± 2.3 x 10⁶ ions/microbubble (1.3 x 10⁶ ± 4.1 x 10⁵ ions/µm2).
Assuming spherical microbubbles with an average molecular area of 0.4 nm2, there was on
average ~64 % of Gd(III)-DOTA binding to available PE groups. Dynamic light scattering
measurements indicated that fragmentation of the Gd(III)-PE microbubbles by heating and bath
sonication resulted in liposomes of size 217 ± 3 nm in diameter.

86
Figure 4.2. A) Number-weighted size distributions of DSPE microbubbles before and after
conjugation with DOTA-NHS. B) Number-weighted size distributions of lipid-bound
DOTA-microbubbles before and after Gd(III) chelation at 50 oC.
4.3.1.2. PEG-labeled Microbubbles (Gd(III)-PEG-PE)
As before, the size isolation technique produced 1-2 µm diameter microbubbles at a
concentration of at least 1 x 10¹¹ mL-1. Figure 4.3a shows the size distribution of microbubbles
before and after DOTA conjugation to the distal end of the amine-containing PEG-PE on the
monolayer via an NHS-coupling reaction at room temperature. The average concentration of 1-2
µm microbubbles decreased by approximately 27 % after DOTA-conjugation. Figure 4.3b

87
shows the size distribution of microbubbles before and after Gd(III) chelation to the DOTA-
bound PEG-PE on the monolayer at 50 oC. The average microbubble concentration decreased by
41 % after the 2-hour chelation. The mean and median number diameter of microbubbles
changed by less than 1 % before and after DOTA conjugation and Gd(III) chelation. This
indicated that the post-labeling strategy to available PEG-PE groups reduced microbubble
concentration but minimally affected 1-2 micron size monodispersity. The average Gd(III) ions
per Gd(III)-PEG-PE microbubble determined by ICP-MS was 6.3 x 10⁵ ± 2.1 x 10⁵
ions/microbubble (1.4 x 10⁵ ± 6.7 x 10⁴ ions/µm2). Again, assuming spherical microbubbles
with an average molecular area of 0.4 nm2, there was on average ~53 % of Gd(III) binding to
available reactive PEG-PE groups. Dynamic light scattering measurements indicated that
fragmentation of Gd(III)-PEG-PE microbubbles by heating and bath sonication resulted in
bimodal lipid fragments of 84 ± 18 nm and 340 ± 61 nm in diameter. This bimodality suggests
that Gd(III)-PEG-PE microbubbles formed a mixture of lipid vesicles such as micelles and
liposomes after fragmentation.
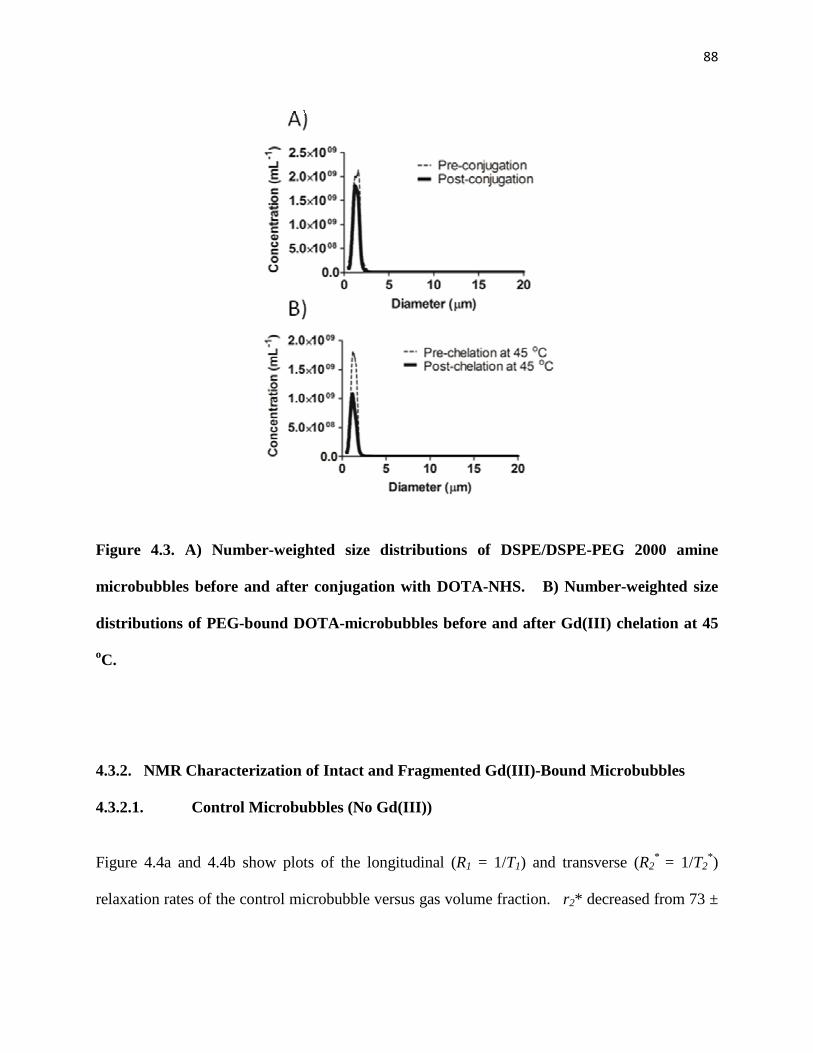
88
Figure 4.3. A) Number-weighted size distributions of DSPE/DSPE-PEG 2000 amine
microbubbles before and after conjugation with DOTA-NHS. B) Number-weighted size
distributions of PEG-bound DOTA-microbubbles before and after Gd(III) chelation at 45
oC.
4.3.2. NMR Characterization of Intact and Fragmented Gd(III)-Bound Microbub bles
4.3.2.1. Control Microbubbles (No Gd(III))
Figure 4.4a and 4.4b show plots of the longitudinal (R1 = 1/T1) and transverse (R2* = 1/T2
*)
relaxation rates of the control microbubble versus gas volume fraction. r2* decreased from 73 ±

89
9.8 to 2.1 ± 0.31 s-1 volume-fraction-1 during microbubble fragmentation. There was no
appreciable change in r1.
Figure 4.4: Relaxation rate of control microbubbles (No Gd(III)) versus gas volume
fraction. A) Longitudinal relaxation rate ( R1). B) Transverse relaxation rate (R2*).
4.3.2.2. Relaxation Rate of Intact and Fragmented Gd(III)-PE Microbubbles
Figure 4.5 shows representative plots of R1 and R2* versus Gd(III) concentration for Gd(III)-PE
microbubbles. R1 and R2* increased in a dose-dependent manner for both the intact and
fragmented microbubbles. Table 4.1 summarizes the calculated r1 and r2* values of the intact

90
and fragmented Gd(III)-PE microbubbles for 3 independent experiments. On average the value
of r1 increased by a factor of 2.4 after microbubble fragmentation (p < 0.05). However, r2*
remained relatively unchanged after microbubble fragmentation (p = 0.9). Therefore,
fragmentation of Gd(III)-PE microbubbles enhanced R1, but only slightly changed R2*.
Figure 4.5: Relaxation rates of intact and fragmented Gd(III)-PE microbubbles versus
Gd(III) concentration. A) Longitudinal relaxation rate ( R1). B) Transverse relaxation rate
(R2*). Figure shown is a representative data set.

91
Table 4.1: Relaxivities (r1 and r2*) of intact and fragmented Gd(III)-PE microbubbles.
Gd(III)-PE
Gd(III) ions/
Microbubble
Intact
r1 (mM-1s-1)
Fragmented
r1 (mM-1s-1)
Intact
r2* (mM-1s-1)
Fragmented
r2* (mM-1s-1)
Trial 1 8.6 x 10⁶ 6.6 ± 0.19 16 ± 0.39 23 ± 1.4 22 ± 2.5 Trial 2 8.7 x 10⁶ 8.8 ± 0.36 26 ± 0.55 37 ± 0.40 37 ± 0.33 Trial 3 4.7 x 10⁶ 7.3 ± 8.1 14 ± 13 43 ± 4.4 41 ± 1.6
Similar to the T1-weighted MRI analysis of 4-5 micron sized Gd(III)-PE microbubbles in
chapter 3, fragmentation of the 1-2 micron sized Gd(III)-PE microbubbles resulted in an increase
in r1. From the control microbubble experiments, it was evident that there is virtually no
contribution to T1 relaxation from either the lipid bilayer or the perfluorobutane gas core. These
results support the hypothesis in chapter 3 of an enhanced exchange rate of protons with Gd(III)
in the relaxed bilayer versus the condensed monolayer.
We suggest that the enhancement in proton exchange occurred as the lipid headgroup
area increased with the transformation from a monolayer to bilayer configuration (figure 4.6A).
Israelachvili provided a simple relation for the optimal headgroup area (ao) in terms of a balance
between the attractive and repulsive intermolecular forces between lipid molecules (Israelachvili
2011):
γK
ao = (4.2)
where K is a constant accounting for steric repulsion in the interfacial region and γ is the
interfacial tension. Based on this simple approximation, the equilibrium headgroup area is
expected to increase ~70% upon going from a gas-water interface (γmonolayer ~ 73 mN/m) to a
bilayer membrane (γbilayer ~ 25 mN/m), assuming that repulsive forces remain unchanged. Such

92
an increase in headgroup area may allow more water molecules to permeate into the headgroup
region and interact with the chelated Gd(III) ions.
Figure 4.6. Schematic demonstrating hypothetical mechanisms governing changes in a) r1
of Gd(III)-PE microbubbles and b) r2* of Gd(III)-PEG-PE microbubbles.
The trend in T2* is different (Figure 4.5B, table 4.1) than T1, as r2
* of the intact and fragmented
Gd(III)-PE microbubbles were similar in magnitude, especially for the first two trials. From
observation of the control microbubbles without Gd(III), it is apparent that the intact
microbubbles provide a ~35-fold greater increase of R2* than the lipid fragments. This result
indicates that the gas core of the Gd(III)-PE microbubbles induces an independent enhancement
of the R2*. This result also corroborates previous reports of an improvement in R2
* using gas-

93
filled microbubbles (without Gd(III))(Chow, Chan et al. ; Alexander, McCreery et al. 1996;
Wong, Huang et al. 2004; Cheung, Chow et al. 2009; Yang, Li et al. 2009; Liu, Lammers et al.
2011). Our results demonstrate that this gas susceptibility behavior affects R2*, but not R1. R1 is
only sensitive to relaxation processes at the proton Larmor frequency (64 MHz at 1.5 T)
(Abragam 1961; Slichter 1990; Levitt 2008), while the R2* signal is sensitive to inhomogeneities
in the magnetic field such as those present at gas-liquid interfaces. Therefore, we propose that
the increase in R2* due to intact Gd(III)-PE microbubbles stems from a combination of a weak
augmentation induced by Gd(III) in the highly-packed lipid monolayer and a susceptibility
enhancement from the gas core. After microbubble fragmentation, the gas-susceptibility
enhancement dissipates, but the remnant lipid fragments (containing no gas) still enhance R2* by
virtue of enhanced proton exchange with Gd(III) in the relaxed lipid bilayer. Observation of the
sample from trial 3, further supports this explanation, as a slightly higher gas-fraction to Gd(III)
ratio, ultimately resulted in intact Gd(III)-PE microbubbles with a slightly larger r2* value than
the lipid fragments. It may be worthwhile to explore the effects of changing the gas composition
of the Gd(III)-PE microbubbles on r2*. The magnetic susceptibility constant of gases varies
depending on whether the gas is diamagnetic or paramagnetic, and although the magnetic
susceptibility of PFB gas has not been reported, the values for diamagnetic gases like Nitrogen
and paramagnetic gases like Oxygen are known (Schenck 1996).

94
4.3.2.3. Relaxation Rate of Intact and Fragmented Gd(III)-PEG-PE Microbubbles
Figure 4.7 shows representative plots of R1 and R2* versus Gd(III) concentration for Gd(III)-
PEG-PE microbubbles. Again, R1 and R2* increased in a dose-dependent manner for both the
intact and fragmented microbubbles. However, the trendlines changed significantly upon
fragmentation in comparison to Gd(III)-PE microbubbles. Table 4.2 summarizes the calculated
values of r1 and r2* of the intact and fragmented Gd(III)-PEG-PE microbubbles for 3 independent
experiments. The calculated r1 values of the Gd(III)-PEG-PE microbubbles decreased on
average by a factor of 2.1 after microbubble fragmentation (p = 0.26). Similarly, r2* decreased
on average by a factor of 8 after fragmentation (p < 0.05). Moreover, the decrease in magnitude
of r2* was about 2 times greater than that of r1. Evidently, fragmentation of Gd(III)-PEG-PE
microbubbles resulted in an overall weakening of both R1 and R2* enhancement.

95
Figure 4.7: Relaxation rates of intact and fragmented Gd(III)-PEG-PE microbubbles
versus Gd(III) concentration. A) Longitudinal relaxation rate (R1). B) Transverse
relaxation rate (R2*). Figure shown is a representative data set.
Table 4.2: Relaxivities (r1 and r2*) of intact and fragmented Gd(III)-PEG-PE microbubbles.
Gd(III)-PEG-PE Gd(III) ions/
Microbubble
Intact
r1 (mM-1s-1)
Fragmented
r1 (mM-1s-1)
Intact
r2*(mM-1s-1)
Fragmented
r2* (mM-1s-1)
Trial 1 5.0 x 10⁵ 18 ± 0.030 14 ± 0.10 190 ± 1.3 36 ± 1.2 Trial 2 8.7 x 10⁵ 14 ± 0.33 4.6 ± 1.3 98 ± 2.9 11 ± 2.9 Trial 3 5.1 x 10⁵ 7.8 ± 9.1 3.7 ± 6.3 210 ± 25 21 ± 3.3

96
We sought to further explore the proton exchange rate mechanism, proposed earlier as the
reason for the increase in r1 for Gd(III)-PE microbubbles, by characterizing the MR signal
induced from a construct consisting of Gd(III) bound to the PEG brush of the lipid microbubble.
PEG is a highly flexible and dynamic molecule under these conditions (Kuhl, Leckband et al.
1994; Kuhl, Majewski et al. 1999; Moore and Kuhl 2006), and therefore the relaxation rate of
terminal Gd(III) groups is expected to be relatively insensitive to changes in packing of the
underlying lipids. Contrary to Gd(III)-PE microbubble behavior, both the r1 and r2* relaxivity of
the Gd(III)-PEG-PE microbubbles dropped in magnitude after microbubble fragmentation.
The decrease in r1 suggests that the underlying mechanism governing changes in r1 after
fragmentation of the Gd(III)-PEG-PE microbubbles is different from that governing the changes
in r1 of Gd(III)-PE microbubbles. With Gd(III) bound to the PEG, the proton exchange
mechanism proposed to govern changes in relaxivity of the Gd(III)-PE microbubbles would be
expected to play a minimal role in the Gd(III)-PEG-PE microbubbles since the effective PEG
molecular area and water access to Gd(III) would remain the same after microbubble
fragmentation. One possible explanation for the decrease in r1 of Gd(III)-PEG-PE microbubbles
is that differences in rotational correlation times between the intact and fragmented complexes
dominates r1 behavior. Relaxation theory predicts that optimization of one or more parameters
governing the inner sphere relaxivity of Gd(III) such as hydration number, electronic relaxation,
proton exchange rate and rotational correlation time, makes the other parameters more limitative
(Toth, Helm et al. 2002). Thus, assuming that the proton exchange mechanism and all other
relaxation parameters remains unchanged, then the differences in rotational correlation times or
between the microbubbles and lipid fragments could dictate the differences in relaxivity from
fragmentation of Gd(III)-PEG-PE microbubbles. The microbubble as the larger sized complex

97
possibly tumbles at a slower rate, leading to larger r1 as compared to the smaller-sized lipid
fragments that tumble at a faster rate. However, further experimentation will be needed to
validate this hypothesis.
The changes in r2* can be attributed primarily to the strong effect the gas creates on the
transverse magnetization signal. As explained above for the Gd(III)-PE microbubbles, the gas
core of the intact Gd(III)-PEG-PE microbubble induces an independent enhancement of R2*.
This is supported by the observation that fragmentation of the Gd(III)-PEG-PE microbubbles
correlated with a significant decrease of R2*. However, unlike the Gd(III)-PE sample, the signal
loss from microbubble fragmentation was not compensated by the presence of the remnant
Gd(III)-PEG-PE lipid fragments. Overall, the lowering of r1 and r2* values from fragmenting
Gd(III)-PEG-PE microbubbles seems to support the hypothesis proposed for the changes in r1 in
the Gd(III)-PE microbubbles. Ultimately, it appears the effect of Gd(III)-bound microbubble
cavitation on the MR signal depends on the placement of the Gd(III) (lipid labeled versus PEG
labeled) on the shell and the presence of the gas core (for T2*). For example, one may monitor
FUS treatment by monitoring cavitation of lipid headgroup-labeled Gd(III)-microbubbles via
changes in T1, or via changes in T2* in the case of PEG-labeled Gd(III)-microbubbles.
4.4. Conclusions
The paramagnetic MRI contrast agent, Gd(III)-DOTA, was conjugated to two different
groups on the lipid monolayer shell of the microbubble: the PE lipid headgroup region or the
distal region of the PEG brush. NMR analysis revealed that the microbubble gas core

98
specifically enhanced R2* in a dose-dependent manner, but not R1. The increase in r1 after
fragmentation of Gd(III)-PE microbubbles suggested that the corresponding expansion of the
lipid headgroup area increased proton exchange with the Gd(III)-bound lipid headgroup and
enhanced R1. However, the decrease in r1 from fragmenting Gd(III)-PEG-PE microbubbles
indicated that a different relaxation mechanism was at play, which was minimally affected by
changes in lipid headgroup area. Therefore, the effect of Gd(III)-bound microbubble cavitation
on the NMR signal depends on the location of Gd(III) on the lipid shell (PEG-labeled or lipid
headgroup-labeled) and the presence of the gas core. These results show how NMR may be used
to provide information on lipid headgroup packing, and they may hold implications for detecting
and monitoring microbubble-assisted MRIgFUS.

99
Chapter 5. Opening the Blood-Brain Barrier with Gd(III)-bound Lipid-
stabilized Microbubbles
5.1. Introduction
One main bottleneck for the treatment of diseases found in the central nervous system is
lack of effective delivery of larger drug compounds to the brain. This restriction is primarily
imposed by action of the brain’s semi-permeable microvasculature known as the blood-brain
barrier (BBB). The BBB generally excludes compounds greater than 400 Da, and thereby
prevents neuropharmaceutical agents, such as inhibitors and antibodies, from reaching their
desired target (Pardridge 2005). Focused ultrasound (FUS) with an intravenous injection of
lipid-stabilized, gas-filled microbubbles has been demonstrated to induce the transient non-
invasive and localized opening of the BBB (Hynynen, McDannold et al. 2005; Choi, Pernot et al.
2007). Subsequent studies have demonstrated a dependence of the acoustic pressure threshold
needed to induce BBB opening on the size range of the microbubbles (Choi, Feshitan et al. 2010;
Tung, Vlachos et al. 2011; Vlachos, Tung et al. 2011). Microbubbles of size class 4-5 and 6-8
micron in diameter induced BBB opening at a peak rarefactional driving pressure of 0.45 MPa,
while 1-2 micron sized microbubbles required a driving pressure of 0.6 MPa. Additional studies
demonstrated the feasibility to open the BBB in non-human primates (Marquet, Tung et al.
2011).
For these applications, it would be advantageous to use a microbubble formulation
detectable by magnetic resonance imaging (MRI), which could be used to measure microbubble
concentration, image cavitation events and determine the biodistribution of microbubble shell
debris during or after FUS. For example, MRI-detectable microbubbles may be useful to

100
monitor FUS treatment, similar to how changes in temperature are used to monitor treatment in
real-time during MRI-guided FUS therapy applications (Cline, Schenck et al. 1992; Cline,
Hynynen et al. 1995; Hynynen, Freund et al. 1996). Alternatively, MRI-detectable microbubbles
could be used to track the deposition profile of microbubble shell material (a potential surrogate
for an attached drug) by scanning the sonicated region after FUS treatment.
In chapter 3 of this thesis, an MRI-detectable microbubble formulation was developed
method by labeling the MRI-contrast agent Gd(III)-DOTA to the lipid shell of size-selected gas-
filled microbubbles. Gd(III)-DOTA was conjugated to the primary amine on the headgroup of
phosphatidylethanolamine (PE). The effect of Gd(III)-bound microbubble cavitation on the MR
signal (at 9.4 T) was determined in vitro by comparing both longitudinal (r1) and transverse (r2)
relaxivity of 4-5 micron-sized gas core-containing Gd(III)-bound microbubbles to those of
microbubbles that were fragmented into lipid shell fragments. Analysis revealed that both r1 and
r2 increased after the fragmentation of intact Gd(III)-bound microbubbles. Additionally, the
Gd(III)-bound microbubbles were also found to be echogenic in vivo during high-frequency
ultrasound imaging of the mouse kidney. The echogenicity indicated that conjugation of the MRI
contrast agent to the microbubble lipid shell did not affect its behavior as an ultrasound contrast
agent.
In another study, Liao et al (Liao, Liu et al. 2012) developed albumin microbubbles
containing a shell surface-conjugated with Gd(III)-DTPA to serve as dual mode contrast agents
for ultrasound and MR imaging. FUS in combination with these Gd(III)-labeled albumin
microbubbles were used to disrupt the BBB and induce intracerebral hemorrhaging at a pressure
range of 0.98 to 1.35 MPa. Additionally, the capability to image the regions of intracerebral

101
hemorrhaging was demonstrated using MRI in combination with the Gd(III)-labeled
microbubbles. However, it is desirable to open the BBB at a safer pressure threshold of 0.45
MPa using the Gd(III)-labeled microbubbles, and then image the sonicated region of the brain
with MRI for the presence of Gd(III)-labeled lipid vesicles. Furthermore, lipid-stabilized
microbubbles are preferred for this purpose due to their higher ultrasound compliance in
comparison to the albumin-shelled counterparts (Sirsi and Borden 2009).
In this chapter, we detail the opening of the BBB using FUS at 1.5 MHz and 0.4 MPa and
4-5 micron lipid-stabilized microbubbles labeled with Gd(III)-DOTA, and the feasibility to use
MRI to image the sonicated region for presence of Gd(III)-labeled lipid vesicles after FUS
treatment. The microbubbles in this study were surface-conjugated with Gd(III)-DOTA since the
ligand DOTA is known to provide a stronger chemical bond with Gd(III) than DTPA, which
reduces the potential for the release of free toxic Gd(III) ions (Sherry, Caravan et al. 2009).
5.2. Materials and methods
Sonication Protocol
All animal procedures were approved by the Columbia University Institutional Animal Care and
Use Committee. The sonication protocol was adapted from the previously reported techniques
(Choi, Pernot et al. 2007; Choi, Feshitan et al. 2010; Vlachos, Tung et al. 2011). A FUS
transducer (frequency: 1.5 MHz) was confocally aligned with a pulse-echodiagnostic transducer
(frequency: 7.5 MHz). A water-filled cone was mounted onto the transducer and attached to a
positioning system (Velmex Inc., Lachine, QC, CAN). The FUS transducer was connected to a

102
matching circuit and driven by a function generator (Agilent, Palo Alto, CA) and a 50-dB power
amplifier (ENI Inc., Rochester, NY). The diagnostic transducer was driven by a pulser-receiver
system (Panametrics, Waltham, MA) connected to a digitizer (Gage Applied Technologies, Inc.,
Lachine, QC, CAN). Pressure measurements of the FUS transducer were made with a needle
hydrophone in a water tank. Each mouse (n = 2, Strain C57BL/6 sex: male) was anesthetized
with isoflurane, placed prone, and immobilized by a stereotaxic apparatus. The mouse hair was
removed, ultrasound-coupling gel was applied on the skin, and a water-filled container sealed at
the bottom was placed on the head. The transducers were submerged in the water and their foci
were positioned to overlap with the right hippocampus of the brain. The left hippocampus was
not targeted and was used as the control. The 4-5 micron lipid-stabilized microbubbles labeled
with Gd(III)-DOTA were fabricated using the post-labeling technique previously described in
chapter 3 and injected intravenously (IV) through the tail vein at a concentration of 107 mL-1
using a 30 G needle. The right hippocampal region of the brain was sonicated 1 min after the
microbubble injection using pulsed FUS (burst rate: 10 Hz; burst cycles: 100; duty cycle:
0.067%; frequency: 1.5 MHz) at a peak-rarefactional pressure of 0.45 MPa for a duration of 60 s.
Previous studies (Choi, Feshitan et al. 2010; Tung, Vlachos et al. 2011) have shown that the safe
acoustic pressure for microbubble-mediated BBB opening lies between 0.30 and 0.45 MPa.
MRI protocol
All the mice were imaged in a vertical bore 9.4 T MRI system (DRX400, Bruker Biospin,
Billerica, MA) following previously developed protocols (Choi, Feshitan et al. 2010; Tung,
Vlachos et al. 2011; Vlachos, Tung et al. 2011). Isoflurane gas (1–2%) was used to anesthetize

103
the mouse during the MRI procedure. A two-dimensional FLASH T1-weighted sequence
(TR/TE = 230/3.3 ms; flip angle: 70o; NEX = 18; scan time: 9 min 56 s, matrix size: 256 x 192;
spatial resolution: 86 x 86 µm2; slice thickness: 500 µm with no interslice gap) was utilized to
image the sonicated hippocampus (Vlachos, Tung et al. 2010; Vlachos, Tung et al. 2011). The
scanning sequence was initially applied ~30 minutes after sonication of the right hippocampus in
the presence of the Gd(III)-bound microbubbles. The presence of Gd(III) on the lipid shell of
microbubbles was qualitatively confirmed by MR imaging of a centrifuge tube containing a 100
µL aliquot of Gd(III) microbubble that were fragmented into constitutive lipid fragments using a
combination of ultrasound and heating (data not shown). A second scan was applied ~50
minutes (~90 mins after sonication) after intraperitoneal injection of 0.30 ml BBB-impermeable,
MRI contrast agent, Omniscan (GE Healthcare, Princeton, NJ), which allowed for sufficient time
for Omniscan to diffuse into the sonicated hippocampus (Choi, Pernot et al. 2007; Choi, Feshitan
et al. 2010). Omniscan (Gd(III)-DTPA-based) is used to confirm BBB opening because it
reduces the longitudinal relaxation time (T1) when released in the extravascular extracellular
space, thus augmenting the local T1-weighted contrast.
5.3. Results
Figure 5.1B shows the image of the mouse brain after sonication of the right hippocampus in the
presence of the Gd(III)-labeled microbubbles. As is evident from the image, there was no
observable increase in T1-weighted contrast in the right (sonicated) hippocampus after FUS
sonication in presence of the Gd(III)-labeled microbubbles. Figure 5.1C shows the image of the
mouse brain after sonication of the right hippocampus in the presence of the Gd(III)-labeled

104
microbubbles followed by intraperitoneal injection of Omniscan. As is evident from the image,
there was a significant increase in T1-contrast in the sonicated region, which provided
confirmation that the BBB was opened. There was no observable increase in contrast in the
control hippocampus in all cases.
Figure 5.1. MRI images of the mouse brain: a) Unperturbed. b) ~40 mins after sonication
of the right hippocampus in the presence of Gd(III)-labeled microbubbles. c) At least 100
mins after sonication in the presence of Gd(III)-labeled microbubbles and ~60 mins after
injection of Omniscan.
5.4. Discussion
FUS in combination with 4-5 micron sized Gd(III)-DOTA-labeled microbubbles was used to
open the BBB in the right hippocampus of the mouse brain at a pressure threshold of 0.45 MPa.
The BBB was confirmed to be opened because of the T1-contrast enhancement in the sonicated

105
region after the injection of Omniscan. This enhancement is attributed to stem from combination
of the intraperitoneal administration of Omniscan and time difference (50 mins) between its
injection and the MRI scan. The intraperitoneal injection method is known to allow for the slow
uptake and diffusion of the contrast media to the sonicated area, which improves the probability
that it is still present at the region of interest during MRI scanning (Choi, Pernot et al. 2007).
This result indicated that the conjugation of the MRI contrast agent to the lipid shell minimally
affected its capability to open the BBB at the safe pressure threshold used in previous studies
(Choi, Feshitan et al. 2010; Tung, Vlachos et al. 2011; Vlachos, Tung et al. 2011).
MRI was used to image the sonicated region for the presence of Gd(III)-labeled vesicles and
to confirm BBB opening. In chapter 3 and 4 of this thesis, the fragmentation of the lipid
headgroup labeled Gd(III) microbubbles into constitutive lipid vesicles resulted in an increase in
longitudinal relaxivity (r1) in vitro. As a result, the presence of Gd(III)-bound lipid shell
fragments at the sonicated hippocampus was expected to produce an increase in the local T1-
weighted MRI contrast; however, there was no observable increase in T1 signal. One hypothesis
for the lack of T1-contrast enhancement in vivo may be due to lengthy time difference (~30 mins)
between sonication in the presence of the intravenously administered Gd(III)-labeled
microbubbles and commencement of MRI scanning. This time difference possibly resulted in
clearance of the Gd(III)-labeled vesicles from the sonicated regions by various mechanisms such
as blood flow. Alternatively, the concentration of the Gd(III) lipid shell that may have been
present at the scanning region may not have been high enough to produce a noticeable increase
in T1-contrast above the baseline level.
One potential method to improve the chances of imaging the presence of Gd(III)-labeled
lipid vesicles at the region of interest is to minimize the timing between FUS application and

106
imaging using real-time MRI guidance similar to that adapted in MRI-guided FUS therapy
devices (Cline, Schenck et al. 1992; Cline, Hynynen et al. 1995; Hynynen, Freund et al. 1996;
Jolesz and McDannold 2008). Alternatively, the Gd(III)-labeled microbubble shell may be
designed to incorporate a targeting peptide that can specifically bind to the BBB receptor and
reduce the possibility of clearance from the region of interest. These and other considerations
may potentially improve the ability to track the fate of the Gd(III)-labeled microbubbles after
FUS treatment in vivo.
5.5. Conclusion
FUS in combination with intravenously injected 4-5 micron lipid-stabilized microbubbles labeled
with Gd(III)-DOTA successfully induced BBB opening at a safe pressure threshold. The
increase in T1-weighted MRI contrast after injection of Omniscan was used to confirm BBB
opening at the sonicated region. The threshold corresponded to that used to open the BBB using
4-5 micron and 6-8 micron sized microbubbles without Gd(III)-DOTA. However, there was no
observable increase in T1-weighted contrast in the sonicated region after FUS application in the
presence of the Gd(III)-labeled microbubbles. In the future, a potential strategy to increase
likelihood of imaging the Gd(III)-labeled shell after FUS sonication may require minimizing the
time difference between FUS treatment and MRI scanning.

107
Chapter 6: Concluding Remarks and Future Directions
6.1. Accomplishment of Specific Aims
6.1.1 Microbubble Size Isolation by differential centrifugation
This study detailed a methodology to generate lipid-coated, perfluorobutane-filled
microbubbles and isolate their size fractions based on migration in a centrifugal field.
Polydispersity of the freshly sonicated suspension was characterized by particle sizing and
counting through light obscuration/scattering and electrical impedance sensing, fluorescence and
bright-field microscopy and flow cytometry. We found that the initial microbubble size
distribution was polydisperse. Smaller microbubbles were more abundant. Differential
centrifugation was used to isolate the 1–2 and 4–5 µm diameter fractions. Isolated microbubbles
were demonstrated to be stable over two days. After two weeks, however, more dilute
suspensions (<1 vol%) were susceptible to Ostwald ripening. For example, 4–5 µm
microbubbles disintegrated into 1–2 µm microbubbles. This latter observation indicated the
existence of an optimally stable diameter in the 1–2 µm range for these lipid-coated
microbubbles. Overall, differential centrifugation provided a rapid and robust means for size
selection and reduced polydispersity of lipid-coated microbubbles.
6.1.2. Theranostic Gd(III)-Lipid Microbubbles for MRI-guided F ocused Ultrasound
Surgery
This study described a technique to synthesize a biomaterial consisting of Gd(III) ions
chelated to lipid-coated, size-selected microbubbles for utility in both magnetic resonance and
ultrasound imaging. The macrocyclic ligand DOTA-NHS was bound to
phosphatidylethanolamine (PE) headgroups on the lipid shell of pre-synthesized microbubbles.

108
Gd(III) was then chelated to DOTA on the microbubble shell. The reaction temperature of 50 oC
was optimized to increase the rate of Gd(III) chelation while maintaining microbubble stability.
The Gd(III)-bound microbubbles were found to be echogenic in vivo during high-frequency
ultrasound imaging of the mouse kidney. The Gd(III)-bound microbubbles also were
characterized by magnetic resonance imaging (MRI) at 9.4 T by a spin-echo technique. This
initial analysis with MRI revealed that Gd(III) relaxivity increased significantly, and in a
concentration-dependent manner, after microbubble fragmentation into non-gas-containing lipid
bilayer remnants. We attributed this behavior to an increase in water proton exchange with the
Gd(III)-labeled lipid fragments caused by an increase in the lipid headgroup area that
accompanied the lipid shell monolayer to bilayer transition.
6.1.3. Magnetic Resonance Properties of Gd(III)-Bound Lipid-Coated Microbubbles and
their Cavitation Fragments
In this study, we sought to explore the mechanism governing the changes in r1 and r2*
after fragmentation of microbubbles consisting of Gd(III) labeled to two different groups on the
lipid monolayer shell: the phosphatidylethanolamine (PE) lipid headgroup region or the distal
region of the polyethylene-glycol (PEG) brush. Nuclear magnetic resonance (NMR) analysis at
1.5 T of the lipid headgroup labeled Gd(III)-microbubbles revealed that r1 increased on average
by a factor of 2.4 after microbubble fragmentation, while r2* was unchanged. Analysis of PEG-
labeled Gd(III)-microbubbles revealed that r1 and r2* decreased on average by a factor of 2.1 and
8 respectively, after microbubble fragmentation. Further analysis revealed that the microbubble
gas core enhanced the transverse MR signal (T2*) in a dose-dependent manner but minimally
affected the longitudinal (T1) signal. These results illustrate how the effect of lipid-stabilized

109
Gd(III)-microbubble cavitation on the MR signal is dependent on the location of Gd(III) on the
lipid shell (lipid headgroup-labeled or PEG-labeled) and the presence of the gas.
6.1.4. Opening the Blood-brain Barrier with Gd(III)-bound Lipid-stabi lized Microbubbles
The aim of this study was to demonstrate the feasibility to safely and non-invasively open the
BBB with Gd(III)-DOTA-labeled lipid-stabilized microbubbles and to determine the potential of
imaging the sonicated region for the presence of lipid shell fragments. The Gd(III)-bound
microbubbles successfully induced BBB opening at a pressure threshold of 0.45 MPa. This
threshold corresponded to that used to open the BBB using 4-5 micron and 6-8 micron sized
microbubbles without Gd(III)-DOTA. The increase in T1-weighted MRI contrast after injection
of Omniscan was used to confirm BBB opening at the sonicated region. There was no
observable increase in T1-weighted contrast in the sonicated region after FUS application in the
presence of the Gd(III)-bound microbubbles.
6.2. Impact on the Field
The differential centrifugation technique developed in this thesis has been useful in
producing the different size classes of microbubbles needed to test the effect of microbubble
monodispersity in CEUS studies. For instance, Sirsi et al. (Sirsi, Feshitan et al.) demonstrated
that 4-5 and 6-8 micron diameter offer increased acoustic signal and circulation persistence in
vivo in comparison to polydisperse and 1-2 micron sized microbubbles, which allowed for much
longer imaging sessions during high-frequency ultrasound imaging. Streeter et al. (Streeter,
Gessner et al. 2010) also demonstrated that larger-sized microbubbles, generated using the

110
differential centrifugation methodology, provided improved CEUS diagnostics of rat tumors in
comparison to polydisperse sizes.
These size-selected microbubbles have also been extensively studied and adapted in
applications involving opening the BBB with FUS. Choi et al. (Choi, Feshitan et al.) was the
first to demonstrate the dependence of microbubble size on BBB opening with FUS. The 4-5
micron sized microbubbles were demonstrated to induce BBB opening in mice at a lower
acoustic threshold than polydisperse and smaller-sized microbubbles. Marquet et al. (Marquet,
Tung et al. 2011) later demonstrated the first successful transcranial BBB opening in non-human
primates using FUS and 4-5 micron size-selected microbubbles. Subsequently, Vlachos et al.
(Vlachos, Tung et al. 2011) studied the permeability of BBB opening in the hippocampus of
mice after the application of FUS at different acoustic pressures and microbubble sizes. Using
dynamic contrast-enhanced MRI, the volume of BBB opening was determined to be proportional
to both acoustic pressure and microbubble diameter. Tung et al. (Tung, Vlachos et al. 2011) later
explored the mechanism of BBB opening by comparing the efficacy of 1-2, 4-5 and 6-8 micron
size-selected classes. It was demonstrated that BBB opens with nonlinear bubble oscillation
when the bubble size is closer to the capillary diameter and with inertial cavitation when it is
much smaller than the capillary diameter. The volume of opening was demonstrated to increase
with both pressure and microbubble diameter. Finally, Samiotaki et al. (Samiotaki, Vlachos et
al. 2012) demonstrated the dependence of the reversibility of BBB opening in mice on the peak-
rarefactional pressure and microbubble size using contrast-enhanced MRI.
The MR behavior of the size-selected lipid-stabilized Gd(III)-bound microbubbles may
ultimately prove to be beneficial in the biomedical field. One proposed application for these
constructs is to provide an alternative means of monitoring FUS surgery i.e. by monitoring

111
microbubble fragmentation state with MRI as opposed to the conventionally method of MR
thermometry. For instance, owing to the observed differences in longitudinal relaxivity between
the intact and fragmented constructs, T1-weighted MRI along with the lipid-headgroup labeled
(Gd(III)-PE) microbubbles can potentially be used to monitor microbubble fragmentation state
during FUS therapy. Alternatively, due to the observed differences in transverse relativity of
intact and fragmented constructs, the PEG labeled Gd(III)-microbubbles and microbubbles
without Gd(III) may provide the option to use the T2*-weighted MRI to monitor microbubble
fragmentation state.
.
6.3. Future Directions
The next step in adapting the size-selection methodology is the development of
continuous size selection process as opposed to the batch system used in this thesis. One
possibility is the design of a continuous-flow centrifugal separator that consists of a process input
(containing the polydisperse suspension), a process output (containing the size-separated
microbubbles) and a recycle stream for added efficiency. This approach may reduce
microbubble separation time and minimize the error associated with operator handling that stems
from the batch separation method.
Additional studies on the parameters affecting the relaxivity of the Gd(III)-bound lipid
microbubbles should also be explored in the future. This includes determining the dependence of
varying microbubble shell parameters and gas composition on the relaxivity of Gd(III)-bound
construct. For instance, microbubbles with a paramagnetic gas composition such as Oxygen may
have different transverse relaxivity from one with a diamagnetic gas composition, such as

112
Nitrogen. Moreover, the effects of changing external parameters such as the magnetic field
strength and local temperature should also be considered in subsequent analysis.
The next step in understanding the behavior of Gd(III)-bound lipid microbubbles in vivo
is to adapt techniques that improve the chances of tracking the Gd(III)-bound shell. In the BBB
opening study performed in chapter 5, the main drawback in detecting the shell fragments at the
sonicated hippocampus was the delay between scanning with MRI and FUS sonications. This
limitation stemmed from the inherent differences in accessibility of both equipments during
experimentation. In order to improve the chances of imaging the shell fragments, it is preferable
to utilize an integrated MRI and FUS device similar to the Exablate 2000 (InSightec, Ltd), which
would reduce the time difference between imaging and FUS sonications.

113
References
Abragam, A. (1961). The principles of nuclear magnetism, Clarendon Press. Aime, S., M. Botta, et al. (2005). "Gd(III)-based contrast agents for MRI." Advances in
Inorganic Chemistry 57: 173-237. Alexander, A. L., T. T. McCreery, et al. (1996). "Microbubbles as novel pressure-sensitive MR
contrast agents." Magnetic Resonance in Medicine 35(6): 801-806. Allen, T. M. (1994). "LONG-CIRCULATING (STERICALLY STABILIZED) LIPOSOMES
FOR TARGETED DRUG-DELIVERY." Trends in Pharmacological Sciences 15(7): 215-220.
Ao, M., Z. G. Wang, et al. (2010). "Gd-DTPA-loaded PLGA microbubbles as both ultrasound
contrast agent and MRI contrast agent-A feasibility research." Journal of Biomedical Materials Research Part B-Applied Biomaterials 93B(2): 551-556.
Apfel, R. E. and C. K. Holland (1991). "GAUGING THE LIKELIHOOD OF CAVITATION
FROM SHORT-PULSE, LOW-DUTY CYCLE DIAGNOSTIC ULTRASOUND." Ultrasound in Medicine and Biology 17(2): 179-185.
Batchelo.Gk and J. T. Green (1972). "DETERMINATION OF BULK STRESS IN A
SUSPENSION OF SPHERICAL-PARTICLES TO ORDER C-2." Journal of Fluid Mechanics 56(DEC12): 401-427.
Batchelor, G. K. and J. T. Green (1972). "DETERMINATION OF BULK STRESS IN A
SUSPENSION OF SPHERICAL-PARTICLES TO ORDER C-2." Journal of Fluid Mechanics 56(DEC12): 401-427.
Berns, D. H., J. S. Ross, et al. (1991). "The spinal vacuum phenomenon - evaluation by gradient
echo MR imaging." Journal of Computer Assisted Tomography 15(2): 233-236. Bloch, S. H., M. Wan, et al. (2004). "Optical observation of lipid- and polymer-shelled
ultrasound microbubble contrast agents." Applied Physics Letters 84(4): 631-633. Bloembergen, N. (1957). "PROTON RELAXATION TIMES IN PARAMAGNETIC
SOLUTIONS." Journal of Chemical Physics 27(2): 572-573. Bloembergen, N. and L. O. Morgan (1961). "PROTON RELAXATION TIMES IN
PARAMAGNETIC SOLUTIONS EFFECTS OF ELECTRON SPIN RELAXATION." Journal of Chemical Physics 34(3): 842-&.
Bloembergen, N., E. M. Purcell, et al. (1948). "RELAXATION EFFECTS IN NUCLEAR
MAGNETIC RESONANCE ABSORPTION." Physical Review 73(7): 679-712.

114
Bohmer, M. R., R. Schroeders, et al. (2006). "Preparation of monodisperse polymer particles and capsules by ink-jet printing." Colloids and Surfaces a-Physicochemical and Engineering Aspects 289(1-3): 96-104.
Borden, M. A., D. E. Kruse, et al. (2005). "Influence of lipid shell physicochemical properties on
ultrasound-induced microbubble destruction." IEEE Transactions on Ultrasonics Ferroelectrics and Frequency Control 52(11): 1992-2002.
Borden, M. A. and M. L. Longo (2002). "Dissolution behavior of lipid monolayer-coated, air-
filled microbubbles: Effect of lipid hydrophobic chain length." Langmuir 18(24): 9225-9233.
Borden, M. A. and M. L. Longo (2004). "Oxygen permeability of fully condensed lipid
monolayers." Journal of Physical Chemistry B 108(19): 6009-6016. Borden, M. A., G. V. Martinez, et al. (2006). "Lateral phase separation in lipid-coated
microbubbles." Langmuir 22(9): 4291-4297. Borden, M. A., G. Pu, et al. (2004). "Surface phase behavior and microstructure of lipid/PEG-
emulsifier monolayer-coated microbubbles." Colloids and Surfaces B-Biointerfaces 35(3-4): 209-223.
Borden, M. A., H. Zhang, et al. (2008). "A stimulus-responsive contrast agent for ultrasound
molecular imaging." Biomaterials 29: 597-606. Bouakaz, A., N. de Jong, et al. (1998). "On the effect of lung filtering and cardiac pressure on the
standard properties of ultrasound contrast agent." Ultrasonics 36(1-5): 703-708. Brancewicz, C., D. H. Rasmussen, et al. (2006). "Hydrophobic gas bubble formation in definity
(R): A freeze fracture electron microscopy study." Journal of Dispersion Science and Technology 27(5): 761-765.
Burkard, M. E. and H. D. Vanliew (1994). "OXYGEN-TRANSPORT TO TISSUE BY
PERSISTENT BUBBLES - THEORY AND SIMULATIONS." Journal of Applied Physiology 77(6): 2874-2878.
Caravan, P., J. J. Ellison, et al. (1999). "Gadolinium(III) chelates as MRI contrast agents:
Structure, dynamics, and applications." Chemical Reviews 99(9): 2293-2352. Cevc, G. and D. Marsh (1985). "HYDRATION OF NONCHARGED LIPID BILAYER-
MEMBRANES - THEORY AND EXPERIMENTS WITH PHOSPHATIDYLETHANOLAMINES." Biophysical Journal 47(1): 21-31.
Chen, C. C. and M. A. Borden (2010). "Ligand conjugation to bimodal poly(ethylene glycol)
brush layers on microbubbles." Langmuir 26(16): 13183-13194.

115
Chen, C. C. and M. A. Borden (2011). "The role of poly(ethylene glycol) brush architecture in complement activation on targeted microbubble surfaces." Biomaterials 32: 6579-6587.
Cheung, J. S., A. M. Chow, et al. (2009). "Microbubbles as a novel contrast agent for brain
MRI." Neuroimage 46(3): 658-664. Choi, J. J., J. A. Feshitan, et al. (2010). "Microbubble-Size Dependence of Focused Ultrasound-
Induced Blood-Brain Barrier Opening in Mice In Vivo." Ieee Transactions on Biomedical Engineering 57(1): 145-154.
Choi, J. J., M. Pernot, et al. (2007). "Noninvasive, transcranial and localized opening of the
blood-brain barrier using focused ultrasound in mice." Ultrasound in Medicine and Biology 33(1): 95-104.
Chomas, J. E., P. Dayton, et al. (2001). "Threshold of fragmentation for ultrasonic contrast
agents." Journal of Biomedical Optics 6(2): 141-150. Chow, A. M., K. W. Y. Chan, et al. "Enhancement of Gas-Filled Microbubble R-2* by Iron
Oxide Nanoparticles for MRI." Magnetic Resonance in Medicine 63(1): 224-229. Chu, S. C. K., Y. Xu, et al. (1990). "BULK MAGNETIC-SUSCEPTIBILITY SHIFTS IN NMR-
STUDIES OF COMPARTMENTALIZED SAMPLES - USE OF PARAMAGNETIC REAGENTS." Magnetic Resonance in Medicine 13(2): 239-262.
Cline, H. E., K. Hynynen, et al. (1995). "FOCUSED US SYSTEM FOR MR IMAGING-
GUIDED TUMOR ABLATION." Radiology 194(3): 731-737. Cline, H. E., J. F. Schenck, et al. (1992). "MR-GUIDED FOCUSED ULTRASOUND
SURGERY." Journal of Computer Assisted Tomography 16(6): 956-965. Connick, R. E. and D. Fiat (1966). "OXYGEN-17 NUCLEAR MAGNETIC RESONANCE
STUDY OF HYDRATION SHELL OF NICKELOUS ION." Journal of Chemical Physics 44(11): 4103-&.
Coussios, C. C. and R. A. Roy (2008). Applications of acoustics and cavitation to noninvasive
therapy and drug delivery. Annual Review of Fluid Mechanics. 40: 395-420. De Leon-Rodriguez, L. M. and Z. Kovacs (2008). "The synthesis and chelation chemistry of
DOTA-peptide conjugates." Bioconjugate Chemistry 19(2): 391-402. Dressaire, E., R. Bee, et al. (2008). "Interfacial polygonal nanopatterning of stable
microbubbles." Science 320(5880): 1198-1201. Duncan, P. B. and D. Needham (2004). "Test of the Epstein-Plesset model for gas microparticle
dissolution in aqueous media: Effect of surface tension and gas undersaturation in solution." Langmuir 20(7): 2567-2578.

116
Edwards, D. A., H. Brenner, et al. (1991). Interfacial transport processes and rheology. Boston,
Butterworth-Heinemann. Epstein, P. S. and M. S. Plesset (1950). "On The Stability Of Gas Bubbles In Liquid-Gas
Solutions." J. Chem. Phys. 18(11): 1505-1509. Farny, C. H., R. G. Holt, et al. (2009). "Temporal and spatial detection of HIFU-induced intertial
and hot-vapor cavitation with a diagnostic ultrasound system." Ultrasound in Medicine and Biology 35(4): 603-615.
Farook, U., E. Stride, et al. (2007). "Microbubbling by co-axial electrohydrodynamic
atomization." Medical & Biological Engineering & Computing 45(8): 781-789. Farook, U., H. B. Zhang, et al. (2007). "Preparation of microbubble suspensions by co-axial
electrohydrodynamic atomization." Medical Engineering & Physics 29(7): 749-754. Feinstein, S. B. (2004). "The powerful microbubble: from bench to bedside, from intravascular
indicator to therapeutic delivery system, and beyond." American Journal of Physiology-Heart and Circulatory Physiology 287(2): H450-H457.
Feinstein, S. B., P. M. Shah, et al. (1984). "MICROBUBBLE DYNAMICS VISUALIZED IN
THE INTACT CAPILLARY CIRCULATION." Journal of the American College of Cardiology 4(3): 595-600.
Ferrara, K., R. Pollard, et al. (2007). "Ultrasound microbubble contrast agents: Fundamentals and
application to gene and drug delivery." Annual Review of Biomedical Engineering 9: 415-447.
Ferrara, K. W., M. A. Borden, et al. (2009). "Lipid-shelled vehicles: engineering for ultrasound
molecular imaging and drug delivery." Acc Chem Res 42(7): 881-892. Ferrara, K. W., R. E. Pollard, et al. (2007). "Ultrasound microbubble contrast agents:
fundamentals and application to drug and gene delivery." Annual Rev. Biomed. Eng. 9: 415-447.
Fujishiro, S., M. Mitsumori, et al. (1998). "Increased heating efficiency of hyperthermia using an
ultrasound contrast agent: a phantom study." International Journal of Hyperthermia 14(5): 495-502.
Ghaghada, K., C. Hawley, et al. (2008). "T1 relaxivity of core-encapsulated gadolinium
liposomal contrast agents - Effect of liposome size and internal gadolinium concentration." Academic Radiology 15(10): 1259-1263.
Ghaghada, K. B., M. Ravoori, et al. (2009). "New dual mode Gadolinium nanoparticle contrast
agent for magnetic resonance imaging." Plos One 4(10).

117
Goertz, D. E., N. de Jong, et al. (2007). "Attenuation and size distribution measurements of
definity (TM) and manipulated definity (TM) populations." Ultrasound in Medicine and Biology 33(9): 1376-1388.
Hak, S., H. Sanders, et al. (2009). "A high relaxivity Gd(III)DOTA-DSPE-based liposomal
contrast agent for magnetic resonance imaging." European Journal of Pharmaceutics and Biopharmaceutics 72(2): 397-404.
Hermann, P., J. Kotek, et al. (2008). "Gadolinium(III) complexes as MRI contrast agents: ligand
design and properties of the complexes." Dalton Transactions(23): 3027-3047. Hernot, S. and A. L. Klibanov (2008). "Microbubbles in ultrasound-triggered drug and gene
delivery." Advanced Drug Delivery Reviews 60(10): 1153-1166. Hindley, J., W. M. Gedroyc, et al. (2004). "MRI guidance of focused ultrasound therapy of
uterine fibroids: Early results." American Journal of Roentgenology 183(6): 1713-1719. Hoff, L., P. C. Sontum, et al. (2000). "Oscillations of polymeric microbubbles: effect of the
encapsulating shell." Journal of the Acoustical Society of America 107(4): 2272-2280. Hsieh, C. Y., P. P. Smith, et al. (2011). "An adaptive spectral estimation technique to detect
cavitation in HIFU with high spatial resolution." Ultrasound in Medicine and Biology 37(7): 1134-1150.
Huang, J. W., J. S. Xu, et al. (2010). "Heat-sensitive microbubbles for intraoperative assessment
of cancer ablation margins." Biomaterials 31(6): 1278-1286. Hudson, S. B. and E. A. Stewart (2008). "Magnetic resonance-guided focused ultrasound
surgery." Clin Obstet Gynecol 51(1): 159-166. Hynynen, K., A. Darkazanli, et al. (1993). "MRI-GUIDED NONINVASIVE ULTRASOUND
SURGERY." Medical Physics 20(1): 107-115. Hynynen, K., W. R. Freund, et al. (1996). "A clinical, noninvasive, MR imaging monitored
ultrasound surgery method." Radiographics 16(1): 185-195. Hynynen, K., N. McDannold, et al. (2005). "Local and reversible blood-brain barrier disruption
by noninvasive focused ultrasound at frequencies suitable for trans-skull sonications." Neuroimage 24(1): 12-20.
Hynynen, K., N. McDannold, et al. (2001). "Noninvasive MR imaging-guided focal opening of
the blood-brain barrier in rabbits." Radiology 220(3): 640-646. Israelachvili, J. (1992). Intermolecular and Surface Forces, Academic Press.

118
Israelachvili, J. N. (2011). Intermolecular and Surface Forces. New York, Academic Press. Jolesz, F. A. (2009). "MRI-Guided Focused Ultrasound Surgery." Annual Review of Medicine
60: 417-430. Jolesz, F. A. and K. Hynynen (2002). "Magnetic resonance image-guided focused ultrasound
surgery." Cancer Journal 8: S100-S112. Jolesz, F. A. and N. McDannold (2008). "Current status and future potential of MRI-guided
focused ultrasound surgery." Journal of Magnetic Resonance Imaging 27(2): 391-399. Kamaly, N., T. Kalber, et al. (2010). "A novel bimodal lipidic contrast agent for cellular
labelling and tumour MRI." Organic & Biomolecular Chemistry 8(1): 201-211. Kaneko, Y., T. Maruyama, et al. (2005). "Use of a microbubble agent to increase the effects of
high intensity focused ultrasound on liver tissue." European Radiology 15(7): 1415-1420. Kennedy, J. E., G. R. ter Haar, et al. (2003). "High intensity focused ultrasound: surgery of the
future?" British Journal of Radiology 76(909): 590-599. Kheir, J. N., D. Zurakowski, et al. (2007). "Novel oxygen-bearing nanoparticles provide dose-
dependent oxygen delivery." Critical Care Medicine 35(12): A16-A16. Kim, D. H., M. J. Costello, et al. (2003). "Mechanical properties and microstructure of
polycrystalline phospholipid monolayer shells: Novel solid microparticles." Langmuir 19(20): 8455-8466.
Kim, S. H. and E. I. Franses (2005). "New protocols for preparing
dipalmitoylphosphatidylcholine dispersions and controlling surface tension and competitive adsorption with albumin at the air/aqueous interface." Colloids and Surfaces B-Biointerfaces 43(3-4): 256-266.
Klibanov, A. L. (1999). "Targeted delivery of gas-filled microspheres, contrast agents for
ultrasound imaging." Advanced Drug Delivery Reviews 37(1-3): 139-157. Klibanov, A. L. (2005). "Ligand-carrying gas-filled microbubbles: Ultrasound contrast agents for
targeted molecular imaging." Bioconjugate Chemistry 16(1): 9-17. Klibanov, A. L., K. Maruyama, et al. (1990). "AMPHIPATHIC POLYETHYLENEGLYCOLS
EFFECTIVELY PROLONG THE CIRCULATION TIME OF LIPOSOMES." Febs Letters 268(1): 235-237.
Kubicek, V. and E. Toth (2009). "DESIGN AND FUNCTION OF METAL COMPLEXES AS
CONTRAST AGENTS IN MRI." Advances in Inorganic Chemistry, Vol 61: Metal Ion Controlled Reactivity 61: 63-129.

119
Kuhl, T. L., D. E. Leckband, et al. (1994). "Modulation of interaction forces between bilayers exposing short-chained ethylene-oxide headgroups." Biophysical Journal 66(5): 1479-1488.
Kuhl, T. L., J. Majewski, et al. (1999). "Packing stress relaxation in polymer-lipid monolayers at
the air-water interface: an X-ray grazing-incidence diffraction and reflectivity study." Journal of the American Chemical Society 121(33): 7682-7688.
Kvale, S., H. A. Jakobsen, et al. (1996). "Size fractionation of gas-filled microspheres by
flotation." Separations Technology 6(4): 219-226. Kwan, J. J. and M. A. Borden (2010). "Microbubble Dissolution in a Multigas Environment."
Langmuir 26(9): 6542-6548. Lentacker, I., S. C. De Smedt, et al. (2009). "Drug loaded microbubble design for ultrasound
triggered delivery." Soft Matter 5(11): 2161-2170. Levitt, M. H. (2008). Spin dynamics: basics of nuclear magnetic resonance, John Wiley & Sons. Lewis, B. A. and D. M. Engelman (1983). "LIPID BILAYER THICKNESS VARIES
LINEARLY WITH ACYL CHAIN-LENGTH IN FLUID PHOSPHATIDYLCHOLINE VESICLES." Journal of Molecular Biology 166(2): 211-217.
Li, M. K. and H. S. Fogler (1978). "ACOUSTIC EMULSIFICATION .1. INSTABILITY OF
OIL-WATER INTERFACE TO FORM INITIAL DROPLETS." Journal of Fluid Mechanics 88(OCT): 499-&.
Li, M. K. and H. S. Fogler (1978). "ACOUSTIC EMULSIFICATION .2. BREAKUP OF
LARGE PRIMARY OIL DROPLETS IN A WATER MEDIUM." Journal of Fluid Mechanics 88(OCT): 513-&.
Liao, A. H., H. L. Liu, et al. (2012). "Paramagnetic perfluorocarbon-filled albumin-(Gd-DTPA)
microbubbles for the induction of focused-ultrasound-induced blood–brain barrier opening and concurrent MR and ultrasound imaging." Physics in Medicine and Biology: 2787–2802.
Lindner, J. R. (2004). "Microbubbles in medical imaging: current applications and future
directions." Nature Rev. Drug Discovery 3(6): 527-532. Liu, Z., T. Lammers, et al. (2011). "Iron oxide nanoparticle-containing microbubble composites
as contrast agents for MR and ultrasound dual-modality imaging." Biomaterials 32(26): 6155-6163.
Lum, A. F. H., M. A. Borden, et al. (2006). "Ultrasound radiation force enables targeted
deposition of model drug carriers loaded on microbubbles." Journal Of Controlled Release 111(1-2): 128-134.

120
Madersbacher, S., C. Kratzik, et al. (1994). "TISSUE ABLATION IN BENIGN PROSTATIC
HYPERPLASIA WITH HIGH-INTENSITY FOCUSED ULTRASOUND." Journal of Urology 152(6): 1956-1960.
Marquet, F., Y. S. Tung, et al. (2011). "Noninvasive, Transient and Selective Blood-Brain
Barrier Opening in Non-Human Primates In Vivo." Plos One 6(7). McDannold, N. J., N. I. Vykhodtseva, et al. (2006). "Microbubble contrast agent with focused
ultrasound to create brain lesions at low power levels: MR imaging and histologic study in rabbits." Radiology 241(1): 95-106.
Miller, D. L. and R. A. Gies (1998). "Enhancement of ultrasonically-induced hemolysis by
perfluorocarbon-based compared to air-based echo-contrast agents." Ultrasound in Medicine and Biology 24(2): 285-292.
Minnaert, M. (1933). "On musical air bubbles and the sounds of running water." Philosophical
Magazine 16(104): 235-248. Moore, N. W. and T. L. Kuhl (2006). "Bimodal polymer mushrooms: compressive forces and
specificity toward receptor surfaces." Langmuir 22(20): 8485-8491. Nagle, J. F. and S. Tristram-Nagle (2000). "Structure of lipid bilayers." Biochimica Et
Biophysica Acta-Reviews on Biomembranes 1469(3): 159-195. Needham, D., T. J. Mclntosh, et al. (1998). Surface Chemistry of the Sterically Stabilized PEG-
Liposome. New York, Marcel Dekker inc. O'Reilly, M. A. and K. Hynynen (2010). "A PVDF Receiver for Ultrasound Monitoring of
Transcranial Focused Ultrasound Therapy." Ieee Transactions on Biomedical Engineering 57(9): 2286-2294.
Pancholi, K. P., U. Farook, et al. (2008). "Novel methods for preparing phospholipid coated
microbubbles." European Biophysics Journal with Biophysics Letters 37(4): 515-520. Pardridge, W. M. (2005). "The blood-brain barrier: bottleneck in brain drug development."
NeuroRx 2(1): 3-14. Petrache, H. I., S. W. Dodd, et al. (2000). "Area per lipid and acyl length distributions in fluid
phosphatidylcholines determined by H-2 NMR spectroscopy." Biophysical Journal 79(6): 3172-3192.
Pu, G., M. A. Borden, et al. (2006). "Collapse and shedding transitions in binary lipid
monolayers coating microbubbles." Langmuir 22(7): 2993-2999.

121
Qin, S. P., C. F. Caskey, et al. (2009). "Ultrasound contrast microbubbles in imaging and therapy: physical principles and engineering." Physics in Medicine and Biology 54(6): R27-R57.
Saad, S. M. I., Z. Policova, et al. (2009). "Mixed DPPC/DPPG Monolayers at Very High Film
Compression." Langmuir 25(18): 10907-10912. Samiotaki, G., F. Vlachos, et al. (2012). "A quantitative pressure and microbubble-size
dependence study of focused ultrasound-induced blood-brain barrier opening reversibility in vivo using MRI." Magnetic Resonance in Medicine 67(3): 769-777.
Schenck, J. F. (1996). "The role of magnetic susceptibility in magnetic resonance imaging: MRI
magnetic compatibility of the first and second kinds." Medical Physics 23(6): 815-850. Sherry, A. D., P. Caravan, et al. (2009). "Primer on Gadolinium Chemistry." Journal of Magnetic
Resonance Imaging 30(6): 1240-1248. Sirsi, S., J. Feshitan, et al. (2010). "Effect of microbubble size on fundamental mode high
frequency imaging in mice." Ultrasound in Medicine and Biology 36(6): 935-948. Sirsi, S. R. and M. A. Borden (2009). "Microbubble compositions, properties and biomedical
applications." Bubble Science, Engineering and Technology 1. Sirsi, S. R., S. L. Hernandez, et al. (2012). "Polyplex-microbubble hybrids for ultrasound-guided
plasmid DNA delivery to solid tumors." Journal of Controlled Release 157(2): 224-234. Slichter, C. P. (1990). Principles of Magnetic Resonance, Springer. Solomon, I. and N. Bloembergen (1956). "NUCLEAR MAGNETIC INTERACTIONS IN THE
HF MOLECULE." Journal of Chemical Physics 25(2): 261-266. Stieger, S. M., C. F. Caskey, et al. (2007). "Enhancement of vascular permeability with low-
frequency contrast-enhanced ultrasound in the chorioallantoic membrane model." Radiology 243(1): 112-121.
Streeter, J. E., R. Gessner, et al. (2010). "Improving Sensitivity in Ultrasound Molecular Imaging
by Tailoring Contrast Agent Size Distribution: In Vivo Studies." Molecular Imaging 9(2): 87-95.
Stride, E. and M. Edirisinghe (2008). "Novel microbubble preparation technologies." Soft Matter
4(12): 2350-2359. Strijkers, G. J., W. J. M. Mulder, et al. (2005). "Relaxivity of liposomal paramagnetic MRI
contrast agents." Magnetic Resonance Materials in Physics Biology and Medicine 18(4): 186-192.

122
Swanson, E. J., V. Mohan, et al. (2010). "Phospholipid-Stabilized Microbubble Foam for Injectable Oxygen Delivery." Langmuir 26(20): 15726-15729.
Takalkar, A. M., A. L. Klibanov, et al. (2004). "Binding and detachment dynamics of
microbubbles targeted to P-selectin under controlled shear flow." Journal of Controlled Release 96(3): 473-482.
Takegami, K., Y. Kaneko, et al. (2005). "Heating and coagulation volume obtained with high-
intensity focused ultrasound therapy: Comparison of perflutren protein-type A microspheres and MRX-133 in rabbits." Radiology 237(1): 132-136.
Talu, E., K. Hettiarachchi, et al. (2008). "Maintaining monodispersity in a microbubble
population formed by flow-focusing." Langmuir 24(5): 1745-1749. Talu, E., K. Hettiarachchi, et al. (2007). "Tailoring the size distribution of ultrasound contrast
agents: Possible method for improving sensitivity in molecular imaging." Molecular Imaging 6(6): 384-392.
Talu, E., M. M. Lozano, et al. (2006). "Long-term stability by lipid coating monodisperse
microbubbles formed by a flow-focusing device." Langmuir 22(23): 9487-9490. Tartis, M. S., D. E. Kruse, et al. (2008). "Dynamic microPET imaging of ultrasound contrast
agents and lipid delivery." Journal of Controlled Release 131(3): 160-166. Taylor, P. (1998). "Ostwald ripening in emulsions." Advances in Colloid and Interface Science
75(2): 107-163. Terreno, E., D. D. Castelli, et al. (2008). "Paramagnetic Liposomes as Innovative Contrast
Agents for Magnetic Resonance (MR) Molecular Imaging Applications." Chemistry & Biodiversity 5(10): 1901-1912.
Toth, E., L. Helm, et al. (2002). "Relaxivity of MRI Contrast Agents." Topics in Current
Chemistry 221: 61-101. Tran, B. C., J. Seo, et al. (2003). "Microbubble-enhanced cavitation for noninvasive ultrasound
surgery." Ieee Transactions on Ultrasonics Ferroelectrics and Frequency Control 50(10): 1296-1304.
Tung, Y. S., H. L. Liu, et al. (2006). "Contrast-agent-enhanced ultrasound thermal ablation."
Ultrasound in Medicine and Biology 32(7): 1103-1110. Tung, Y. S., F. Marquet, et al. (2011). "Feasibility of noninvasive cavitation-guided blood-brain
barrier opening using focused ultrasound and microbubbles in nonhuman primates." Applied Physics Letters 98(16).

123
Tung, Y. S., F. Vlachos, et al. (2011). "The mechanism of interaction between focused ultrasound and microbubbles in blood-brain barrier opening in mice." Journal of the Acoustical Society of America 130(5): 3059-3067.
Unger, E. C., T. A. Fritz, et al. (1999). Methods of preparing gas-filled liposomes. USA, ImaRx
Pharmaceutical Corp. (Tucson, AZ). Unger, E. C., T. Porter, et al. (2004). "Therapeutic applications of lipid-coated microbubbles."
Advanced Drug Delivery Reviews 56(9): 1291-1314. Vlachos, F., Y. S. Tung, et al. (2011). "Permeability Dependence Study of the Focused
Ultrasound-Induced Blood-Brain Barrier Opening at Distinct Pressures and Microbubble Diameters Using DCE-MRI." Magnetic Resonance in Medicine 66(3): 821-830.
Vlachos, F., Y. S. Tung, et al. (2010). "Permeability assessment of the focused ultrasound-
induced blood-brain barrier opening using dynamic contrast-enhanced MRI." Physics in Medicine and Biology 55(18): 5451-5466.
Wheatley, M. A., F. Forsberg, et al. (2006). "Surfactant-stabilized contrast agent on the
nanoscale for diagnostic ultrasound imaging." Ultrasound in Medicine and Biology 32(1): 83-93.
Wong, K. K., I. Huang, et al. (2004). "In vivo study of microbubbles as an MR susceptibility
contrast agent." Magnetic Resonance in Medicine 52(3): 445-452. Wrenn, S. (2008). personal communicaton. Wu, F., W. Z. Chen, et al. (2001). "Pathological changes in human malignant carcinoma treated
with high-intensity focused ultrasound." Ultrasound in Medicine and Biology 27(8): 1099-1106.
Wu, J. and W. L. Nyborg (2008). "Ultrasound, cavitation bubbles and their interaction with
cells." Advanced Drug Delivery Reviews 60(10): 1103-1116. Xie, F., M. D. Boska, et al. (2008). "EFFECTS OF TRANSCRANIAL ULTRASOUND AND
INTRAVENOUS MICROBUBBLES ON BLOOD BRAIN BARRIER PERMEABILITY IN A LARGE ANIMAL MODEL." Ultrasound in Medicine and Biology 34(12): 2028-2034.
Xu, J. H., S. W. Li, et al. (2006). "Controllable gas-liquid phase flow patterns and monodisperse
microbubbles in a microfluidic T-junction device." Applied Physics Letters 88(13). Xu, S. Q., Z. H. Nie, et al. (2005). "Generation of monodisperse particles by using microfluidics:
Control over size, shape, and composition." Angewandte Chemie-International Edition 44(5): 724-728.

124
Xu, Y. B. and E. M. Haacke (2006). "The role of voxel aspect ratio in determining apparent vascular phase behavior in susceptibility weighted imaging." Magnetic Resonance Imaging 24(2): 155-160.
Yang, F., L. Li, et al. (2008). "Superparamagnetic nanoparticle-inclusion microbubbles for
ultrasound contrast agents." Physics in Medicine and Biology 53(21): 6129-6141. Yang, F., Y. X. Li, et al. (2009). "Superparamagnetic iron oxide nanoparticle-embedded
encapsulated microbubbles as dual contrast agents of magnetic resonance and ultrasound imaging." Biomaterials 30(23-24): 3882-3890.
Yu, T. H., D. R. Hu, et al. (2008). "Microbubbles improve the ablation efficiency of
extracorporeal high intensity focused ultrasound against kidney tissues." World Journal of Urology 26(6): 631-636.
Zhao, S., M. A. Borden, et al. (2004). "Radiation-force assisted targeting facilitates ultrasonic
molecular imaging." Molecular Imaging 3(3): 135-148.