Embed Size (px)
Citation preview

United States Department of Agriculture
Forest Service
Engineering Staff
Washington, D.C.
Engineering Field Notes Engineering Technical Information System
Awards for 1982 Field Notes Articles
Little Joe Road Surfacing Study
Survey Economics
Volume 15 April-June
1983
"Two-Rule" Method of Aligning Bridge Abutments & Piers
Embankment Dam Overtopping Project
Use of Precast Concrete Ramp Planks for Low-Water Crossings
Automated Special Project Specifications

8 Engineering Field Notes Administrative Distribution
• Professional Development
• Management
• Data Retrieval
This publication is an administrative document that was developed for the guidance of employees of the Forest Ser-vice- U.S. Department of Agriculture, its contractors, and its cooperating Federal and State Government Agencies. The text in the publication represents the personal opinions of the respective authors. This information has not been approved for distribution to the public, and must not be construed as recom-mended or approved policy, procedures, or mandatory instruc-tions,except by Forest Service Manual references.
The Forest Service- U.S. Department of Agriculture assumes no responsibility for the interpretation or application of this in-formation by other than its own employees. The use of trade names and identification of firms or corporations is for the con-venience of the reader; such use does not constitute an official endorsement or approval by the United States Government of any product or service to the exclusion of others that may be suitable.
This information is the sole property of the Government, with unlimited rights in the usage thereof, and cannot be copyrighted by private parties.
Please direct any comments or recommendations about this publication to the following address:
FOREST SERVICE-USDA Engineering Staff-Washington Office Att: G.L. Rome, Editor (Room 1112 RP/E) P.O. Box 2417-Washington, D.C. 20013
Telephone: Area Code 703-235-8198
Awards for 1982 Field Notes Articles
The rating for the 1982 Field Notes articles is complete, and we have identified the following winners:
Author
James Bassel Civil Engineer, SDEDC
Carl Cain Civil Engineer, R-l
and James Langdon Civil Engineer, R-l
George Lippert Civil Engineer, WO-E
Title
"Use of Mobile Hammermill for Inplace Processing of Oversize Rock"
)
"A Guide for Determining Minimum Road Width on Curves for Single-Lane Forest Roads"
"Some Considerations in Using Wood for Energy"
To determine the award-winning authors, a point value was assigned which reflected your rating for each article:
First choice--3points Second choice--2 points Third choice--l point
congratulations to the winners! The papers have been processed, and the checks were mailed to the respective offices.
In spite of their heavy workloads and slim staffing, all authors made the time to write good articles~ Field Notes readers extend their thanks. All the readers who submitted rating sheets showed that the authors' efforts are appreciated in the field.
We are now well into 1983; submit YOUR article for the next Field Notes Articles Awards. Explain to others how YOU found a better way to perform a difficult task, or why YOU found a particular experience challenging and valuable. (Or, explain at home why you didn't have a chance for an extra $100 this year!)
1


PROJECT VARIABLES
Little Joe Road Surfacing Study
Steve Monlux Materials Engineer Region 1
When designing the thickness of aggregate road surfaces, it is important to estimate aggregate surface loss and the degree of subgrade contami-nation. The latest draft version of Chapter 50 (FSH 7709.11) suggests using local information about aggregate surface loss whenever possible. Although this study was originally undertaken to obtain data about materials for a bituminous pavement thickness design, the materials data should be valuable for making estimates of aggregate loss for projects that have similar characteristics.
The Little Joe Road is located on the Lolo National Forest in western Montana. The IS-mile, two-lane road begins near St. Regis at an elevation of 2,700 feet and ends on the ldaho border at 5,800 feet • The road was constructed in 1973 and 1974, and 9 inches of dense graded aggregate surfacing was placed on it in the fall of 1976. Road grades average 4 percent, with some half-mile segments approaching 7 percent. Superelevations vary considerably along the road and have been reconstructed out of aggregate surfacing in some locations.
Normally, the traffic distribution on the road is 80 percent light vehicles and 20 percent logging trucks. These trucks haul approximately 22 million board feet (mmbf) of timber over the road each year. Although the road was designed for a speed of 45 miles per hour, loaded logging trucks drive portions of the road at speeds exceeding 55 miles per hour. Annual precipitation in the area ranges from 35 to 80 inches; about 60 percent of this amount usually is in the form of snowfall. Snow is generally plowed through November, and load restric-tions have been imposed during spring breakup.
The aggregate surface is usually bladed 3 times per year, and dust abatement material has been applied
3

FIELD MEASUREMENTS
AGGREGATE TESTING DATA
CONCLUSIONS
on an average of 1-1/2 times per year. From 1976 through 1981, annual dust abatement was done with either clarified dust oil (D04) or lignin sulfonate. Because of sharp decreases in timber haul, no dust abatement was done in 1982.
Subgrade materials are GM (silty gravel) with 15 to 40 percent minus #200. Seven subgrade samples were taken in 1982, and lab CBR values ranged from 9.5 to 24.0 (AASHTO T193--95 percent of T99). Aggregate thickness designs according to the Pavement Design and Management System indicate that there is considerable life remaining in the existing surfacing thickness. This is confirmed by visual observation.
The existing aggregate surface was profiled before digging a trench across the road. Another profile was taken of the subgrade surface after the trench had been dug. Surfacing thicknesses, super-elevations, and rutting of the subgrade and aggregate were determined from survey data. The results are shown in table 1.
Aggregate samples were split down in the field and then tested in the laboratory. Test results for the 1 inch minus aggregate are shown in table 2 for the original crushed material and also for samples taken from the roadway during the 1982 field investigatio
Aggregate Surfacing Loss. The weighted average loss figures shown in table 1 are considerably different for the three separate segments. Segment I had the greatest surfacing loss because vehicle spee~s are greatest and dust abatement is the least successful.
Surfacing Loss = (9 in-5.8 in) 7 113.7 mmbf = 0.028 in/mmbf = 0.28 in/IO mmbf = 1 in/35.5 mmbf
Segment II has the least surfacing loss as a result of slow vehicle speeds and moderate grades. Loss of fines by dusting is probably not significant.
Surfacing Loss = (9 in-7.33 in) 7 113.7 mmbf = 0.015 in/mmbf = 0.147 in/IO mmbf = 1 in/68 mmbf
Segment III had a significant loss mostly because of snowplowing, surface erosion caused by snowmelt, and
4

Table l.--Field measurements.
Aggregate Thickness (Inches) Rutting TemE1ate
Segment and We~ghted (Inches) crown Super Shoulders Station Minimum Maximum Averagea Average b subgrade Aggregate (Inches) (Percent) (Feet)
I 14+00 8.25 12.00 8.50
} 1 0 2.5 3.5 4&4
38+75 ....... 0.00 7.00 4.25 1 0 2.0 4.5 1&2 55+50 5.50 9.75 6.50 5.80 1 1 5.0 0.5 1&2 78+00 1.00 8.25 5.00 2 0 3.0 0.5 4&5
102+00 3.00 9.00 5.50 1 0 0.0 4.5 3&2 134+50 4.75 8.00 5.00 1 0 5.0 6.5 2&2
II 565+00 7.25 9.25 8.00 } 1 0 3.5 1.5 3&6 571+50 4.75 9.00 6.00 7.33 2 0 9.5 6.0 5&2 583+25 7.00 9.00 8.00 1 0 0.0 0.0 2&3
III 807+50 0.00 7.00 4.25 ) 1 0 0.0 6.0 2&2 814+00 7.00 9.75 8.50 6.07 0 0 1.5 1.0 822+00 5.75 8.50 6.00 2 1 3.0 4.5 826+00 0.00 9.75 4.75 1 0 0.0 6.5 2&12
aThe "average" is based on the existing cross-sectional area of aggregate occupying the original specified surfacing width.
bThe "weighted average" considers the amount of road length each thickness represents.

Table 2.--Aggregate test data.
Test Results
1976 Average
1982 Average · .... By Station
14+00 · .... 38+75 · .... 55+50 · . . . . 78+00 · . . . .
102+00 · . . . . 134+50 · .... 565+00 · . . . . 571+50 · .... 583+25 · . . . . 807+50 · . . . . 814+00 · . . . . 822+00 · .... 826+00 · ....
Sieve Analysis Aggregate Quality % Pass % Pass T176 T96 T210 %
#4 #200 SE LAA Dc Df Fracture
40 9.5 21 73 69 68
51.2 14.8 30 18 75 65 77
51 14.3 48 16.3 53 14.8 52 13.5 48 13.3 29 17.5 74 59 80 52 13.4 52 14.7 51 14.3 31 18.2 76 68 80 49 13.9 53 14.9 51 16.2 31 18.1 74 69 70 52 15.2 54 17.7
more surface raveling resulting from sharp curves. Dust abatement is very effective because of a short season and low vehicle speeds on steep grades.
Surfacing Loss = (9 in-6.07 in) f 113.7 mmbf = 0.026 in/mmbf = 0.258 in/l0 mmbf = 1 in/38.8 mmbf
The accuracy of these surfacing loss figures is directly dependent on the accuracy of the original thickness, which is probably within + 1/2 inch of the 9 inches specified in the original contract.
Degree of Subgrade Contamination. Aggregate test results show that about 10 percent minus #4 and 5 percent minus #200 were added to the surfacing material. This additional material is believed to have come from road shoulders and ditch lines during blading operations. This theory is reinforced by the fact that, just after laying the aggregate, Forest personnel commented that the aggregate did
6
RECOMMENDATIONS
not have enough binder (minus #4 sieve material) to prevent raveling.
Selecting the appropriate aggregate surfacing loss figure requires considerable judgment in evalu-ating project variables. Under ideal project circumstances, loss may be as low as 0.15 inches per 10 mmbf. Normally, a loss of 0.30 inches per 10 mmbf would be appropriate for projects that require dust abatement, utilize good quality dense graded crushed aggregate, and are driven at speeds below 25 miles per hour.
Subgrade contamination of aggregate surfacing does not appear to be a problem for the materials studied. Subgrade contamination could be a problem where subgrade soils have low strengths, high fines contents, high moisture contents, or inadequate aggregate thicknesses. Geotextiles may be used as an effective separating layer between weak subgrade materials and aggregate. Also, some subgrade soils may be chemically stabilized, which will prevent subgrade materials from weakening the aggregate layer. Increasing the "binder" in aggregate surfacing during maintenance operations is a high-risk operation because it is difficult to control the nature and extent of material added. The strength of any aggregate surfacing is significantly reduced if the minus #200 exceeds 20 percent by weight. There is no sUbstitute for specifying the most desirable gradation in the crushing contract.
The data presented in this report may help in estimating aggregate surface loss, provided personnel thoroughly evaluate project variables. However, as the draft Chapter 50 points out, there is no sUbstitute for using local information on aggregate surface loss that has occurred on existing projects.
7


Survey Economics
Tom Grabinski civil Engineer Gallatin National Forest Region 1
A program has been written to help give engineering crew supervisors estimates of the lodging, driving, and labor costs for alternative approaches to a particular survey project. The program is based on one written by Earl R. Williams of the Deerlodge National Forest in 1971 for a Monroe 1765 program-able calculator. With the programing assistance of Bob Fallang, Gallatin National Forest, we rewrote the program for the Hewlett Packard system.
This program calculates some basic answers to a problem where answers to similar questions in the past were best guesses based on the experience of supervisors. Some survey projects are located such that the answers to "stay-out/driving" questions are obvious. However, there are many projects where there may be multiple ways of completing the project and where it is not immediately evident whether the crew should drive daily or stay out or where they should stay. Comparing these various alternatives is not easy when done by hand or when estimated from experience. The program is only a tool to help crew supervisors make sound economic decisions. There are other factors in the project assignment, such as weather and crew morale, that need to be taken into account before the assignment is completed.
The input factors for a job are easily obtained. When input into this program, they are combined to give four answers: (1) weeks to complete~ (2) cost per week~ (3) total cost~ and (4) total miles driven.
The program was written for use with an HP 41CV with the HP 82143A thermal printer. The program has been put on magnetic cards, and the program will operate as written without the thermal printer plugged into the calculator. In this case, the answers will be stored in registers--38 (weeks to complete), 43 (weekly job cost), 44 (total job cost), and 45 (total miles driven)--instead of being printed out •
9

The PROGRAM
When the program is finished, the calculator will display "NON-EXISTENT"; however, all calculations are done and stored correctly. The loop options to input a different work week or lodging location also are not available to the user without the printer.
The objective of the program is to find a least cost/work year equivalent solution for each engineering survey.
There are 17 input factors that are known or can be easily obtained.
(1) Survey project length in miles.
(2)** Distance from official station to motel or camp in miles (one way).
(3)** Distance from motel or camp to job in miles (one way).
(4) Distance from end of road to midpoint of project in walking miles.
(5) Daily work hours (greater than 8 hours).
(6)* Work days per week.
(7)* Daily work hours paid at standard hourly rates.
(8) Production rate in feet per hour (actual production when working).
(9) Labor cost for entire crew in dollars per hour.
(10) Number of crewmembers.
(11)** Travel speed from official station to camp in miles per hour.
(12)** Travel speed from camp to job in miles per hour.
(13)** Lodging cost per day for each crewmember in dollars.
(14)** Per diem or subsistence cost per day for each Crewmember in dollars.
(15)** Fixed cost in dollars (trailer move, campground fee, etc.).
10

LOOP OPERATIONS
(16) Vehicle F.O.R. cost per month in dollars.
( 17) Vehicle mileage cost per mile in dollars per mile.
This program is designed to allow two different sets of variables to be changed by way of loop options in order to help select the best combination of crew time and cost. One set of variables that can be changed is (5) work hours per day, (6) days per week, and (7) standard rate work hours, which are marked with an asterisk (*) above. These variables can be changed by responding "Yes" (Y) when the calculator asks "NEW WEEK?" The second set of variables corresponds to lodging costs and is entered when the calculator asks "NEW LODGE?" Because a change in lodging locations almost always changes the distance traveled, the distance and travel speed inputs also can be changed to accommodate this. The second set of variables that may be modified is identified by a double asterisk (**). This second set can be changed only after changing or reentering the "NEW WEEK?" variables. As shown in instructions in figure 1, the program will prompt the user to enter the proper data.
For the program to calculate the correct costs and mileage for a situation of driving daily from the official station to the job, the second distance (3) (CP-Job) must be entered as 0.00 miles. If you have a trailer at the beginning of your job, you must insert some number greater than 0.00 miles (minimum of 0.01 miles) for the distance from camp to job (3) (CP-Job) •
This program does not include the survey supplies used and equipment amortization in the cost, although it can be included in the fixed cost input (15). Because this program is intended only for relative analyses of alternatives for a specific project, it can be assumed that such fixed costs would remain constant regardless of how the project is completed; therefore, it is not necessary to include these or other fixed costs.
The daily hours paid at the standard hourly rate are included as a reference item in output. No calculation is performed based on this item.
Another assumption made is that the project (job beginning) is beyond the camp/motel. If the project is between the official station and the camp/motel, the total miles driven may be incorrect because on
11

1. KEY XEQ ALPHA SIZE ALPHA. PROGRAM WILL PROMPT SIZE ___ KEY 050. THIS STEP IS NECESSARY ONLY IF THE CALCULATOR IS SIZED FOR A SMALLER PROGRAM.
2. TURN PRINTER ON. SET PRINTER MODE TO MAN. KEY XEQ ALPHA CREW ALPHA EXECUTES PROGRAM.
3. AFTER THE TONE AND DISPLAY THE PROGRAM WILL PROMPT FOR THE INPUT VARIABLES. FOLLOW EACH INPUT WITH THE ~ KEY TO PROCEED TO THE NEXT.
1. 2. 3. 4. 5. 6. 7. 8. 9.
10. 11. 12. 13. 14. 15. 16. 17.
PROJECT LENGTH IN .. DISTANCE IN MILES = DISTANCE IN MILES
DISTANCE IN MILES DAILY WORK HOURS
MILES FROM OFFICIAL STATION TO CAMP OR MOTEL FROM CAMP OR MOTEL TO THE JOB FROM THE END OF ROAD TO THE JOB MIDPOINT
PROJLN OS-CP CP-JOB EOR-MP HR/DAY .. DAY/WK .. WRKDAY =
DAYS WORKED PER WEEK (4 OR 5 DAYS) WORK HOURS PER DAY AT STANDARD PAY RATE (REFERENCE ONLY; 8. 9. OR 10 HRS.)
PRD/HR ACTUAL PRODUCTION PER HOUR ON THE JOB IN FEET PER HOUR CR$/HR .. LABOR COST PER CREW PER HOUR AT STANDARD RATE (HOURLY COST TO
GOVERNMENT) CRNO? .. NUMBER OF PEOPLE ON THE CREW SPD-CP SPEED IN MPH FROM OFFICIAL STATION TO CAMP OR MOTEL SPD-JB .. SPEED IN MPH FROM CAMP OR MOTEL TO THE JOB LODGE$ = LODGING COST/DAY/EACH CREWMEMBER PRDS8$ PER DIEM OR SUBSISTENCE COST/DAY/CREWMEMBER FIXED$ ANY FIXED JOB COST (TRAILER MOVE. ETC.) VEHFOR .. VEHICLE F.O.R. COST PER MONTH IN $/MONTH VEHMI$ VEHICLE MILEAGE CHARGE PER MILE IN $/MILE
4. THE PRINTER WILL PRINT THE INPUT NAME FOLLOWED BY THE INPUT VALUE AT THE END.
5.
WKS/JOB = XXXX.XX WKLY$ = XXXXX.XX J08$ = XXXXXX.XX TOTMILES .. xxxxx
(WEEKS TO COMPLETE THE JOB) (WEEKLY COST OF THE JOB) (TOTAL JOB COST FOR CREW) (TOTAL MILES DRIVEN)
THE CALCULATOR WILL DISPLAY NEW WEEK? (YOU MUST ANSWER THIS QUESTION). ANSWER r FOR YES. OR N FOR NO. KEY~. IF THE ANSWER TO STEP 7 WILL BE Y YOU MUST ANSWER Y FOR STEP 5.
6. IF YOU ANSWER N TO STEP 5. NEW JOB WILL BE DISPLAYED. ANSWER Y FOR YES. KEY ~ AND PROGRAM WILL START AGAIN AT STEP 3. ANSWER N FOR NO. KEY ~ AND PROGRAM WILL BE OVER.
7. THE CALCULATOR WILL DISPLAY NEW LODGE? - ANSWER r FOR YES OR N FOR NO--KEY ~.
THE CALCULATOR WILL THEN PROMPT FOR THE NEW INPUTS REQUIRED IN THE SAME MANNER AS STEP 3.
THE PRINTOUT FOR NEW WEEK AND NEW LODGE WILL BE SIMILAR TO STEP 4 EXCEPT ONLY THE ~ INPUTS WILL BE SHOWN.
PROGRAM LIMITATIONS
A. IF THE CREW IS DRIVING TO THE JOB FROM THE OFFICIAL STATION. CP-JOB AND SPD-JB MUST BE ENTERED AS ZERO (0.0).
B. IF YOU HAVE A CAMP. YOU MUST INPUT A VALUE OTHER THAN ZERO FOR CP-JOB AND SPD-JOB (SUGGESTION: USE 0.01 AND 2.5 MPH IF THE CAMP IS AT THE EOR).
C. Do NOT TOUCH THE PRGM SWITCH.
Figure l.--Program instructions for survey economics using HP 41C~
12

CONCLUSIONS
the last day of work the crew may not normally go back to the camp/motel and then to the official station. This will also affect the cost to do the project.
The input data for three alternatives for a survey are presented in figure 2. The alternatives are working from a motel near the job, moving a trailer to a camp near the job, and driving daily from the official site to the job. These were evaluated using the program. The answers are presented in the first three columns of figure 3. The following conclusions are easily drawn from the printouts:
Least Weeks/Job - Trailer Option Least Weekly Cost - Drive Daily Option Least Job Cost - Trailer Option Least Total Miles - Trailer Option
Therefore, the most economic option is to move the trailer to the job site. This option was further evaluated for differing work schedules:
Basic Option 10 hrs/day, 4 days per week
Choice 1. 11 hrs/day, 4 days per week (4 OT hrs/week)
2. 12 hrs/day, 4 days per week (8 OT hrs/week)
3. 8 hrs/day, 5 days per week (normal)
4. 10 hrs/day, 5 days per week (lOOT hrs/week)
From these we can see that the following is the most economic survey: move trailer to site; work 10 hours per day, 4 days per week (if overtime money is authorized) •
The reduction when comparing the trailer option to the motel option is as follows:
Crew weeks Job cost Total Miles
0.75 2,072.79 495
Man-Year Equivalence Savings 8.9 days
The definition of the input regist~rs are shown in figure 4, the equation in figure 5, and the detail of the program steps in figure 6 •
13

SURVEY ECONOMICS DATA INPUT
PROJECT' . INPUT MOTEL' TRAILER/CAMP DRIVE DAILY
PROJLN 0) 6.5 6.5 6.5
OS-CP (2) 50.00 60.00 60.00
CP-JOB (3) 10 0.01 0.00
EOR-MP (4) 4.5 4.5 4.5
HR/DAY (5) 10 10 10
DAYIWK (6) 4 4 4
WRK/DAY (7) 10 10 10
PRD/HR (8) 250 250 250
CR$/HR (9) 17.91 17.91 17.91
CR NO? (10) 3 3 3
SPD-CP (11) 55 50 50
SPD-JB (2) 25 2.5 0.00
LODGE $(3) 21 0 0
PRDSB$ (14) 12 12 0
FIXED $(5) 0.00 175.00 0.00
VEH FOR(16) 138.00 138.00 138.00
VEHM1 $(17) .22 .22 .22
Figure 2.--Input data sheet.
14
MADE BY CHECKED-=B=-Y,-------
REMARKS/CONCLUSIONS
1-GS5 AND 2-GS4
COST TO MOVE TRAILER TO SITE
GSA LEASE FOR 4x4 CARRYALL
GSA MILEAGE

-
DRIVE DAILY No OVERTI"E
R~ 1 = ·Pf~L· J~~~" Re2= 6.Se R03= -OS-Cpo R84: 6U~r.
~~e~,= • C;; - ~IOB" Reb= 8.e6 P07= -EJHI\P' Ref:= 4.5t
f: 1 ~= -PRI:lHP.' Rlt.= 256.8e F:17= "CR$/liP" t:la: j 7 .91 F: 19= • C~:iiD"!" R2~= 3.ee,
~'22= 50.ee RZ3: 'SPD-JE:" .'24= e,ee R25= • LOIiGH· R2E·= e.€f R27= 'PRDSBs' ~~2~;= e. 8t1 ~'2S= "nXErr' R3e= e.0f. F.3:: ·VEHFORr. ~:i2= 13B. se: f:33= ·~EHr:t·
R1!9= -H~/D~i'"
F.l€-: 16.8r. Pl;= -DP';;W(" ~1~'= 4.80 F.:B= -WF.KD':;Y' 't14= 1~.86 W~'~;i JOf;:8. 75 ---I-MK"-'I'$=S£t7.09 JOBs=; ,4!Z.e:·-r 70T!I!!LES=4 .. 28e.-r-
-.- --DRIVE DAILY
1 HR O-T /DAY R89= -fiR/DP',.. F.ig: 11.90 R 11 = -DH'r' lWf~" Fit: 4.£1e R13= -WRKDPY" ~14= le.se WKS lJOE;= 7 • ~e --~ AWL ~'$:954. 5S JO~:$ =6, E.Bl. SE. - f-TOT"ILES=3~ 36e ......... SUY AT MOTEL
No OVERTI"E
R22= 55.6B R23= -SPD-JS' R2.!= 25.S£; R2S= 'LODG[$:" R2f= 2L8e F.27= -PRDSBf" R2B= 12.813 ~:29= -nXEII$' R313= 6.ee R09: "HR..'DH\" R10: le.@0 Rl1= -BAY/WK" P'12= 4.813 F13= -WRrDAY' R14= Ie.ee wrsl J3B=6. 7: --+-WKLY$=1,127.5~
JOB$=7,611.24 -f-T(iT~ILES=l ,2!5.-f-
Figure 3.--Survey economics example.
15
-Su Y AT MOTE L 1 HR O-T/DAY
Re9= -HR irip.~'· R10= 11. e~ Rl1= ·Dgi'/W!~r.
~12= 4.96 f:13= ·.~:KDPY· ~14= Ie.ae WKS! JOB=S. 75 --+-WKLY$=1123S.e5 JOBS=7.1~:.5.: -I-
TOT~ILES=1,8Z5.-1-
TRAILER AT SITE No OVERTI"E
Rt13= '"Of:-C.:::1: ~.~,= tIe. ef; Res: • CP-JOc' ~:9f·: e.L
~:23= aJSPIt-.JE·" R24= 2.se P.2~= cLOnGES"·· R2E.= t.es R27= • PRIIS8S' R28= 12.ee F.29= 'nXEii~'
1;3B=- 175.9l'
R09: -H~'/Dg'y'''
RIfe: le.8(; Rl1= -D~'(fj,W"
1(12= 4. fie f13= 'WRKDiW" F.14= Ie.Sr. WKS/~I[iB=6.ee --t-WKL 'r'$=893. 91 JOE:s=5, 536.45---1-TOTMILES=72e.---t-
-
TRAILER AT SITE 1 HR O-T/DAY
1;'13: lLef; Ri 1= ·IIPY/Io!~"
~12= 4.ee R14= 1t-St wrs/ ..I0B=5. 25 --+-WKLYI=1!96~.:3~ JOBs:5,432. ;::--+-TOnI! LES=£3f..--4-TRAILER AT SITE
2 HRS O-TIDAY RlJ,= 'Hj;/IH~'-;'
Rlll= 12.ee Rl1= 'NIY/IoW' 1<12: 4.ee 1<13= 'WRKDH~"
1<14= le.se WK~'/JOB=4. se--+-WI(L'I'S=1 .. 108.S:; JOEs:5. 164.73 - "-TOTf! I LES=54e.---I-
TRAILER AT SITE STANDARD WEEK
Rle: Eo fir RU= 'D;':'·j'.iJ,l:'
R13= "IoIRKIij7iY' Ri4: Lee WI(L YS=93£ .• ] S .J08t=6 I 915. 5~---ITOT~ILES:.Bf~ ,--+-TRAILER AT SITE
2 HR O-T /DAY
~~11: aliH1/itH:".: R12= 5~0f R13= 'WRfng,;,' Pia: f;.ee WKS.iOE;=4.Se ---+-"It .. V$= i. ,eo;. t;4 JOBs:5} 958. 2 ~ --4-TOT"r~EE:=576. ---+-

SURVEY ECONOMICS REGISTER
2 INPUT VARIABLES
L = PROJECT LENGTH
4 Ll = DISTANCE OFFICIAL STATION TO CAMP OR MOTEL
6 L2 = DISTANCE CAMP OR MOTEL TO JOB
8 L3 = DISTANCE END OF ROAD TO JOB MIDPOINT (WALKING MILES)
10 Dl = DAILY WORK HOURS
12 D2 = DAYS PER WEEK
14 D3 = HOURS PER DAY PAID AT STANDARD RATE
16 P = PRODUCTION RATE - FEET PER HOUR
18 R = LABOR COST - DOLLARS PER HOUR FOR ENTIRE CREW
20 C = NUMBER OF CREW MEMBERS
22 Tl = TRAVEL SPEED OFFICIAL STATION TO CAMP - MPH
24 T2 = TRAVEL SPEED CAMP OR MOTEL TO JOB - MPH
26 SI = LODGING COST PER DAY FOR EACH CREWMEMBER
28 S2 = PER DIEM OR SUBSISTANCE COST PER DAY EACH
30 S3 = FIXED COST - TRAILER MOVE, ETC.
32 Ml = VEHICLE F.O.R. PER MONTH
34 M2 = VEHICLE MILEAGE COST PER MILE
Figure 4.--Survey economics input variables.
16
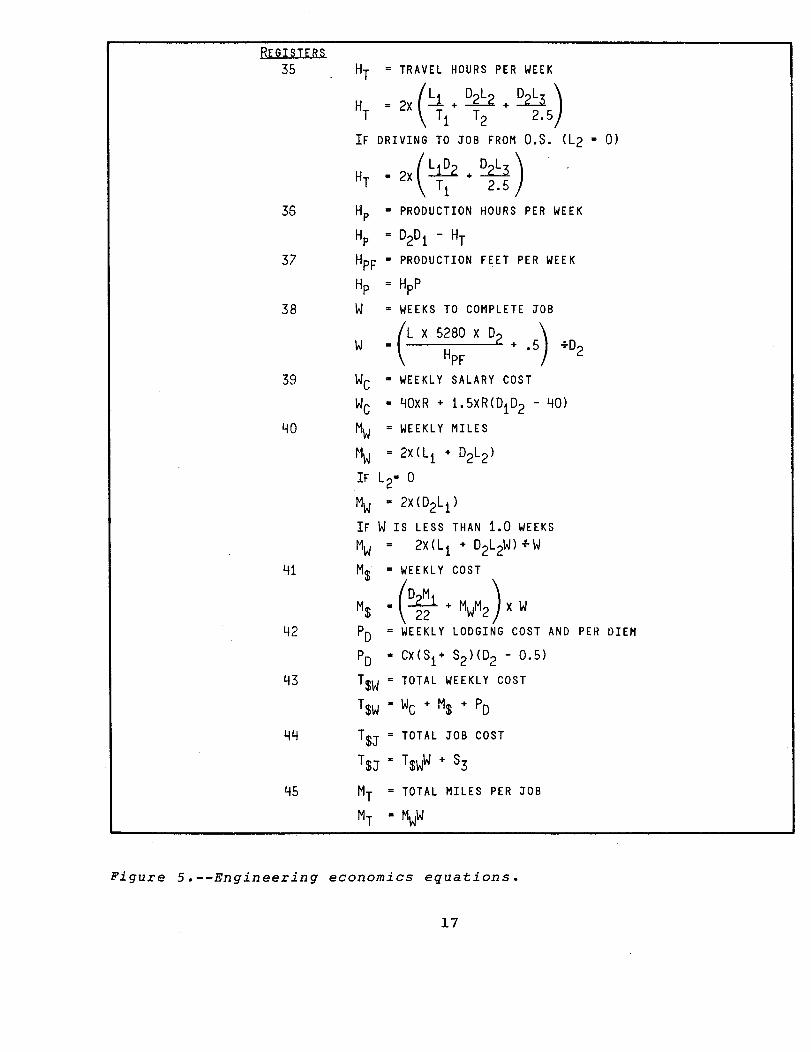
REGI STE RS 35
36
37
38
HT TRAVEL HOURS PER WEEK
= 2x (!:.t + ~ + ~ ) HT T1 T2 2.5 IF DRIVING TO JOB FROM O.S. (L2 = 0)
= (~+ TI) HT 2x T1 2.5
Hp R PRODUCTION HOURS PER WEEK
Hp = 0201 - HT HpF R PRODUCTION FEET PER WEEK
Hp = HpP W = WEEKS TO COMPLETE JOB
W (L X 5280 X 02 ).
= HpF +.5 ~02
39 We = WEEKLY SALARY COST
We = 40xR + 1.5XR(01 02 - 40)
40 MW = WEEKLY MILES
MW = 2X(L1 + 02L2)
IF L2= 0
MW = 2x (02L1 ) IF W IS LESS THAN 1.0 WEEKS MW 2X(L1 + 02L2W)-!oW M$ = WEEKLY COST
M$ • (D~:L MwH2) x W
41
42 Po = WEEKLY LODGING COST AND PER DIEM
PD = eX(S1+ S2)(D2 - 0.5)
43 T$W = TOTAL WEEKLY COST
T$W = We + M$ + Po
44 T$J TOTAL JOB COST
T $J .. T $wW + S3
45 MT = TOTAL MILES PER JOB
MT = MWW
Figure 5.--Engineering economics equations.
17
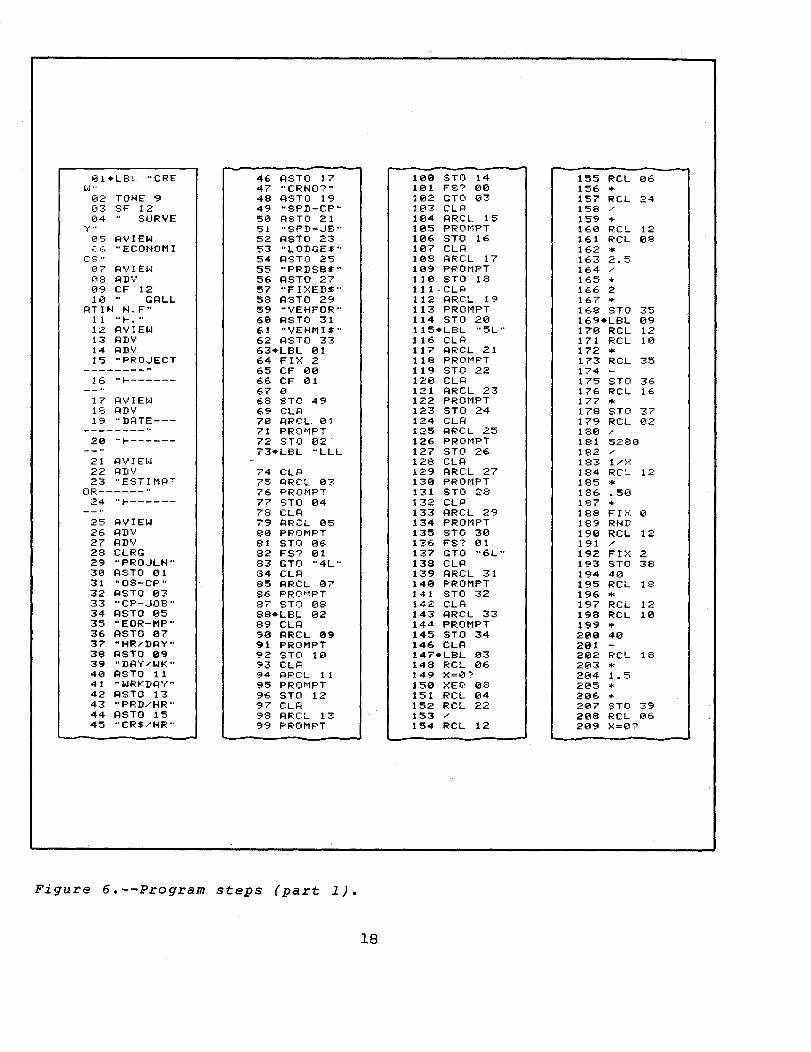
131*LBL "CRE 46 ASTO 17 lee STO 14 155 RCL 136 L-J" 47 "CRNO?" 101 FS? e0 156 * 132 TONE 9 48 ASTO 19 le2 GTO e3 157 RCL 24
03 SF 12 49 "SPD-CP" le3 CLR 158 --04 " SURVE 50 RSTO 21 104 ARCL 15 159 + 'y''' 51 "SPD-JB" 105 PROMPT 1613 RCL 12
05 AVIEW 52 ASTO 23 106 STO 16 161 RCL 08 L-~' "EeONOMI 53 "LODGE$" 107 CLR 162 * CS" 54 AS TO 25 108 ARCL 17 163 2 .. 5 07 RV! E~J 55 "PRDSB$" 109 PROt1PT 164 ./
08 RDV 56 ASTO 27 110 STO 18 165 + 139 CF 12 57 "FI:>{EDS" 111.CLR 166 2 10 " GRLL 58 ASTO 29 112 ARCL 19 167 * RTIN N.F" 59 "VEHFOR" 113 PROMPT 168 STO 35 1 1 "I-. " 60 AS TO 31 114 STO 20 169.LBL 09 12 AVIEW 61 "VEHMI$" 115.LBL "5L" 170 RCL 12 13 AD\! 62 ASTO 33 116 CLR 171 RCL 10 14 ADV 63·LBL 01 117 ARCL 21 172 * 15 "PROJECT 64 F I >{ 2 118 PROt1PT 173 RCL .,."'" _ • .,J
--------- 65 CF 1313 119 STO 22 174 -16 "1------- 66 CF 01 120 CLR 175 STO 36
67 0 121 ARCL 23 176 RCL IE. 17 RVIE~J 68 STC 49 122 PROMPT 177 ,., 18 RD ... 69 CLR 123 STO 24 178 STO 37 19 "D;::tTE--- 70 RRCL 01 124 CLR 179 RCL 132 --______ 0. 71 PROt1PT 125 I=!RCL 25 180 ./
20 "1------- 72 STO 132 126 PRO~lPT 181 5280 73*LBL "LLL 127 STO 26 182 /
21 RVIEL·j 128 CLR 183 1/::-:: 22 RIIV 74 CU=l 129 RRCL 27 184 RCc.. 12 23 "EST!MA' 75 QRCL 03 130 PROt1PT 185 ,.,
OR------" 76 PROMPT 131 STO 28 18G .50 24 "1------- 77 STO 04 132 CLR 187 +
78 CLR 133 ARCL 29 188 FIl': 0 25 RVIEW 79 RRCL 05 134 PROMPT 189 RND 26 RD\, 80 PROMPT 135 STO 30 190 RCL 12 27 ADV 81 STO 136 136 FS? 01 191 / 28 CLRG 82 FS? 01 137 GTO "6L" 192 FP: 2 29 "PROJLN" 83 GTO "4L" 138 CLI=! 193 STO 38 30 ASTO 131 34 CLR 139 ARCL 31 194 4e 31 "OS-CP" 85 ARCL 07 1413 PROMPT 195 RCL 18 32 ASTO 03 86 PRO"lPT 141 STO 32 196 * 33 "CP-JOS" 87 STO 138 142 CLI=! 197 RCL 12 34 I=!STO 05 88.LSL 02 143 RRCL 33 198 RCL 10 35 "EOR-MP" 89 CLA 144 PROMPT 199 *' 36 ASTO 07 90 ARCL 09 145 STO 34 21210 40 37 "HR/DAY" 91 PROMPT 146 CLI=! 201 -38 ASTO 09 92 STO 113 147·LBL 03 202 RCL 18 39 "DAV--WK" 93 CLR 148 RCL 06 203 *' 40 AS TO 11 94 RF:CL 11 149 X=0? 204 1.5 41 "WRKDI=!',,, 95 PROMPT 150 XE(;! 08 205 *' 42 ASTO 13 96 STO 12 151 RCL 04 206 + 43 "PRD--HR" 97 CLR 152 RCL 22 21217 STO 39 44 RSTO 15 98 I=!RCL 13 153 / 21218 RCL 06 45 "CRS/HR" 99 PROMPT 154 RCL 12 209 X=0?
Figure 6.--Program steps (part 1).
18

2113 XEC! 1=1 265 GTO €I? 315 STOP :::69.LBL "LL" 211 • 99 266 1.008 316.LBL 04 370 SF 01 212 RCL 38 267 PRREG:X: 317 SF 130 371 50 213 X>"i~? 268 15.034 318 50 372 STO 49 214 ;',EO "CC" 269 PRREGX 319 RCL 49 3..,. .... - . ~ GTO "LLL 215 RCL 04 2712' ADV 320 X=Y? 216 RCL 12 271 GTO 07 321 CF 01 374.LBL ··4!...·· 217 RCL 06 272.LBL 10 322 XEQ "L 375 GTO "5L" 218 '" 273 3.006 323 GTO 02 376*LBL "6L" 219 RCL 38 274 PRREG>( 324*LBL 138 377 RTN 220 '" 275 21.13313 325 RCL 04 378 • Et-;:;:'. 221 + 276 PRREGX 326 RCL 12 222 2 277*LBL 07 327 '" 223 '" 278 9.1314 328 RCL 22 224 RCL 38 279 PRREGX 329 /
225 ..... 2813 ··I.WS/JOB 3313 RCL 12 226 STO 413 - 331 RCL 138 227*LBL B 281 ARCL 38 332 '" 228 RCL 34 282 I=IVIEW 333 2.5 229 '" 283 "WKLY$=" 334 /
230 RCL 32 284 I=IRCL 43 335 + 231 22 285 I=IVIEW 336 2 232 ./ 286 "JOB$=" 337 '" 233 RCi... 12 287 I=IRCL 44 338 STO 35 234 '" 288 I=IVIEW 339 GTO 09 235 + 289 FIX 13 3413*LBL R 236 -:;TO 41 290 "TOTMILE 341 RCL 12 237 F.:C~ 12 S=" 342 RCL 134 238 r . '-' 291 ARCL 45 343 '" 23'3 - 292 RVIEW 344 2 2413 RCL 28 293 FIX 2 345 '" 241 RCL 26 294 RDV 346 STO 40 242 + 295 ADV 347 GTO B 243 '" 296 •. y •. 348*LBL "CC" 244 F.:CL 20 297 RSTO Y 349 RCL 04 245 :+: 298 RON 3513 RCL 12 246 8TO 42 299 "NEW WEE 351 RCL 136 247 RCL 39 K?" 352 '" 248 RCL 41 31313 PROMPT 353 + 249 + 301 RSTO X 354 2 250 ReL 42 3132 ROFF 355 '" 251 + 303 X=-)'? 356 STO 413 252 STO 43 394 GTO 04 357 GTO B 253 RCL 38 3135 •• y .. 358*LBL "L" 254 '" 3136 RSTO Y 359 "y" 255 RCL 313 3137 RON 360 RSTD Y 256 + 308 "NEW JOB 3':·1 RON 257 STO 44 ?. 362 -NEW LOD 258 RCL 38 30S PRO~lPT GE?" 259 F.:CL 413 310 I=ISTO X 363 PROMPT 260 '" 311 1=1 OFF 364 I=ISTO X 261 STO 45 312 ;':=Y? 365 I=IOFF 262 Fe··..,
~ . 01 313 GTO -eRE 3E·6 X='/? 263 GTO 10 ~l " 367 GTO "LL" 264 FC'~ ~ , 013 314·L8L 05 368 RT~l
Figure 6.--Program steps (part 2).
19


"Two-Rule" Method of Aligning Bridge Abutments & Piers
Allan A. Johnson Supervisory Civil Engineer Nicolet National Forest Region 9
The Forest Service often is required to check or to provide the correct alignment and location of poured concrete bridge abutments and piers. The following description, in conjunction with figure 1, illus-trates a fast and accurate method to accomplish this task.
Step 1. While shooting line for abutment A footing (or anytime before form work for the abutment A wall precludes seeing through on reference line A), mark accurately with a crow's foot the location of reference line A on the footing or on some other convenient place.
Step 2. When alignment is needed for forming or checking the abutment A wall, set up a transit at location B. Location B is established by "eyeballing" along the formwork so that you clear the formwork and whalers on your offset line. with a little practice, this becomes quite easy. Lay two engineer's rulers perpendicular to reference line A with the zero end at the crow's foot marks.
Step 3. After the transit is leveled, adjust the horizontal azimuth by trial and error until the reading is identical on both engineer's rulers. In the figure 1 example, this reading is 1.50 feet. You have now established a line parallel to reference line A.
Step 4. You can now check or establish true alignment anywhere on abutment A. For example, to check the alignment of the wall's outside edge, we calculate that it is 0.69 feet from the offset line to the outside of the 3/4-inch form plywood. Hold an engineer's rule against the outside of the form plywood. If the transit man reads 0.69 feet, the wall is exactly on line. If it does not read 0.69 feet, the form bracing can be loosened and adjusted
21

by the contractor to bring the forms to correct alignment. To make sure your readings are correct, the rodman should "rock" the ruler in a horizontal direction, and then take the lowest reading. Use the horizontal crosshair to ensure that the ruler is level in the other direction.
The method described above has been developed and used on actual bridge construction projects, and it has worked very well. As the height of abutments and piers increases, this method is increasingly helpful. With high walls and piers, you can seldom see through on the reference lines when forms are in place, thus increasing the chance for an error by a contractor plumbing up from footings.
22

ENGINEER'S_ RULER
READING 1.50' ON RULER
I. 50' <F=SET TO REF. LINE A - .81' ~ 0.69' READING TO OUTSIDE OF
FORM PL Y'M:>OD
/'
ENGINEER'S_ RULER
READING Lsd ON RULER
t
~
0.69--1
I I I I ! I
TRANSIT~ LOCATlON~
B
A
I
TACK IN HUB
I CROW'S FOOT
ABUTMENT A WALL
r--
3/4"
ABUTMENT A FOOTING
FORM PLYWOOD
10- 1
9" 9'
1\ I CROWS FOOT SCRATCHED IN FOOTING CONCRETE
Q:J TACK IN HUB
'
REFERENCE LINE A PREVIOUSLY ESTABLISHED DURING BRIDGE STAKE OUT
A
Figure l.---Two-rule- alignment method.
23


BACKGROUND
Embankment Dam Overtopping Project
Sam Fischer Water Resources Engineer Washington Office
The Forest Service has signed an agreement with the Federal Highway Administration (FHWA) to participate in a study to determine rates of failure of earth embankments resulting from flood overtopping.
In response to the Dam Safety Act of 1972, the Army Corps of Engineers, the Forest Service, other Federal agencies, and States evaluated the safety of approximately 9,000 dams in the United States between 1977 and 1981. Of the more than 2,900 dams found to be "unsafe," a large percentage were so designated because of inadequate spillways or outlet capacities.
During preparation of the Corps of Engineers' "Recommended Guidelines for Safety Inspections of Dams," it was recognized that the hydrologic criteria and assumptions were conservative with regard to the resistance of earth embankment dams to erosion when overtopped. However, there were little data available to refine these criteria and assumptions.
Because of the large number of embankment dams on National Forest System lands, the Forest Service was particularly interested in finding ways to make dams "safe"--that is, so they would not fail catastrophically--without facing the high costs of major spillways or dam reconstruction. There is some evidence that an embankment dam can withstand overtopping for some time before failing. The Soil Conservation Service, for example, has reports on 11 dams that have been overtopped without failing. One, a 45-foot high structure, was overtopped with 2.5 feet of water for approximately 1.5 hours and suffered only minor damage. If a reasonable method could be found to determine and extend this apparently inherent capability of an embankment dam to withstand some overtopping, it seemed that a significant amount of money could be saved.
25

PROJECT GOALS & OBJECTIVES
The PROJECT
The Forest Service's fiscal year 1983 budget included $85,000 in funding for a cooperative project to be undertaken with another agency. Initially there was a problem when other "dam" agencies that previously had expressed interest in a cooperative venture were unable to participate because of funding cutbacks. Through a series of coincidences, however, the Forest Service learned that the FHWA had just started a $375,000, 3-year project entitled "A Methodology for Estimating Embankment Damage Due to Flood Overtopping." Subsequently it was learned that this project was similar to the one planned by the Forest Service, that the overtopping tests the Forest Service wanted would add to the data the FHWA wanted and vice versa, and that the FHWA was willing to add the dam overtopping tests to their project.
The study has two main objectives:
(1) To develop a method for predicting embankment damage and rates of failure resulting from flood overtopping.
(2) To determine if cost-effective protective techniques are available for extending the life of an embankment during flood overtopping.
The Forest Service goal is to provide data and methods, which would be used in risk-based analyses of dams currently classified as unsafe because of inadequate spillway capacity, as possible alternatives to reconstruction of the spillways or dams.
Simons, Li and Associates, Incorporated, of Fort Collins, colorado, is undertaking the project. The full-scale embankment overtopping tests will be conducted at the Engineering Research Center outdoor testing facilities at Colorado State University. The following is a summary of the work to be performed for the FHWA and the Forest Service:
(1) Analyze literature to derive coefficients for a soil detachment rate equation and develop a tentative procedure to apply the equation to the embankment damage problem.
(2) Analyze literature to identify and evaluate low-cost protective techniques or devices for prolonging the life of an embankment during overtopping.
26

(3) construct a 6-foot high embankment and an open-bottom portable flume to conduct the overtopping tests. Three soil types will be used.
(4) Conduct 66 hydraulic test runs (50 FHWA, 16 Forest Service) with varying side slope, slope vegetation or protection, overtopping depth, overtopping duration, and tailwater for each soil type.
(5) Develop a procedure for estimating embankment damage and rate of failure resulting from flood overtopping that can be incorporated into risk-based analysis for stream crossings and embankment dams.
The project is scheduled to be completed and the results to be available in the fall of 1985.
27


- -,----
Figure 1.--Precast concrete ramp planks, installed •
Use of Precast Concrete Ramp Planks for Low-Water Crossings
Ron McNemar Civil Engineer Daniel Boone National Forest Region 8
For the past several years, the Daniel Boone National Forest has used standard bolted connection concrete boat ramp planks with a precast cutoff wall for low-water crossings. Their performance has been excellent, including installations across silty, boggy bottoms (see figure 1).
Each concrete plank is 14 feet long, 16 inches wide, and 5-1/2 inches deep and weighs about 1,300 pounds. The planks are bolted together by means of two steel straps, predrilled for 3/4-inch bolts. The straps are cast in the concrete during fabrication. A downstream cutoff wall normally is necessary, and precast concrete blocks with lifting eyes can be used for this purpose.
29

w o
TOP V1EW
EJ LIFTING EVE
CUTOFF WALL DETA1L (NO SCALE)
IS"
1/2" x 1-1/2" x 22" GALVANIZED STEEL
r--3' 5-112" ~14
~D=;(t1 ~ • N "-rl ,
llA I -?:::JI I
T
BROOM FINISH 3/4" DIA.
.......... ~.....----\---
r-0'5-1I2"TO'5" O'S-1I2"-t-0 '4"
7'1" ~14 3'1-112"-1 rq"
~ II CONCRETE PLANK
TOP V1EW SCALE 1" = 1'0"
SEE NOTE A •
~,. lQ'O"
~
'" ~ RE~~RS 1/2" X 1-1/2" x 22" GALVANIZED STEEL DETAIL A (2 PER PLANK)
SlDE V1EW SCALE I' = 1'0"
H-~---·--t-~-l--·-- , ~-~~~~---t-or-t-~-~--~~~----~-----,~~~-
0'1" 1+-------1'4"---'---..-
~--------1'S·--------~
1+----------1'10"----------+1
PLANK DETAIL (NO seAl E)
SEE NOTE B.
Figure 2.--Construction detail of precast concrete ramp planks (part 1) •
w .......
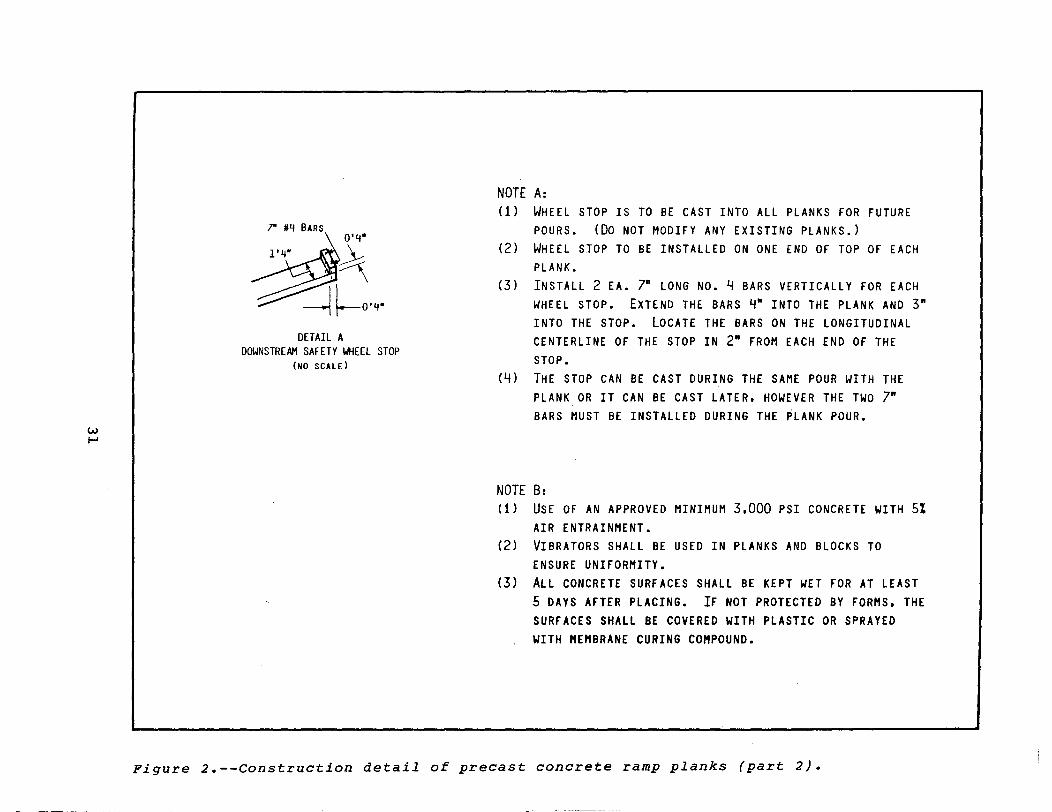
r #4 BARS
NOTE A: (1) WHEEL STOP IS TO BE CAST INTO ALL PLANKS FOR FUTURE
POURS. (Do NOT MODIFY ANY EXISTING PLANKS.) (2) WHEEL STOP TO BE INSTALLED ON ONE END OF TOP OF EACH
PLANK. (3) INSTALL 2 EA. 7ft LONG No.4 BARS VERTICALLY FOR EACH
WHEEL STOP. EXTEND THE BARS 4ft INTO THE PLANK AND 3ft INTO THE STOP. LOCATE THE BARS ON THE LONGITUDINAL
DETAIL A CENTERLINE OF THE STOP IN 2" FROM EACH END OF THE DOWNSTREAM SAFETY WHEEL STOP
(NO SCALE) (4 )
STOP. THE STOP CAN BE CAST DURING THE SAME POUR WITH THE PLANK OR IT CAN BE CAST LATER. HOWEVER THE TWO 7" BARS MUST BE INSTALLED DURING THE PLANK POUR.
NOTE B: (1) USE OF AN APPROVED MINIMUM 3.000 PSI CONCRETE WITH 5%
AIR ENTRAINMENT. (2) VIBRATORS SHALL BE USED IN PLANKS AND BLOCKS TO
ENSURE UNIFORMITY. (3) ALL CONCRETE SURFACES SHALL BE KEPT WET FOR AT LEAST
5 DAYS AFTER PLACING. IF NOT PROTECTED BY FORMS. THE SURFACES SHALL BE COVERED WITH PLASTIC OR SPRAYED WITH MEMBRANE CURING COMPOUND.
Figure 2.--Construction detail of precast concrete ramp planks (part 2).

W IV
PI ~~ ~~ ~ ~ ~~ & • o ..... ;. ;;...
hi t:~ ~~ =:::: =:
SLOPE· -15%
---.c:l[W--;X = ~/{f
BANK-----i (LENGTH "A" SEE PLAN
AND PROFILE SHEET)
DIRECTION OF FLOW 0'4" 1'4" ... r ,..,,..,,..,,..,,,..,-1 t j r-
I-- - f - 1-- "-. - ~ - I-- I-- - - -- 1-- - -- f-- - ~-
- ~- _.- I-- --- - ,- I-- f-
-- t::=_~,-===ccc
PLAN SCALE 0.3" • 1'0"
SLOPE • 0% SLOPE • + 15% D~A
~J~ ~~f=---_~ STTREAMBED f4------BANK-----.!
(LENGTH "B" SEE PLAN (LENGTH "A" SEE PLAN·
I""
AND PROFILE SHEET) AND PROFILE SHEET)
CENTERLINE PROFILE SCALE 0.3" • 1'0"
I- 14 '0"
!!:.::+7fil#tibi!j SLOPE. -3%
DIRECTION OF FLOW
TYPICAL CROSS SECTION SCALE 0.3" • 1'0"
STREAMBED
lliti'mmillm// CUTOFF WALL
-
Figure 3.=-Assembly detail of precast concrete ramp planks (part 1).
ct ROAD

CONCRETE
51S- x 2-114-GAl VANIZED BOLT HEX HEAD AND NUT REQUIRED
PLANK DETAIL OF CONNECTION SCALE 1- • 1'0-
#4 REBARS
NOTE A: (1) THE CONCRETE PLANKS AND CUTOFF WALL SHALL BE PRECAST
CONCRETE. 3.000 PSI. AND SHALL BE FURNISHED BY THE FOREST SERVICE.
(2) THE 5/8n X 2-1/4n GALV. HEX HEAD BOLTS. NUTS. AND WASHERS SHALL BE FURNISHED BY THE TIMBER PURCHASER.
(3) THE CONCRETE PLANKS AND CUTOFF WALL BLOCKS SHALL BE ~ PICKED UP AT THE MOREHEAD RANGER STATION BY THE
PROFILE DETAIL A
BOLT
1JTI1J6 CONNECTIONS SHOULD BE STAGGERED AS ILLUSTRATED TO MAINTAIN CONTINUITY
TIMBER PURCHASER. (4) THE APPROXIMATE WEIGHT OF THE CONCRETE PLANKS AND
CUTOFF WALL BLOCKS ARE 1.300 LBS AND 1.000 LBS. RESPECTIVEL Y.
Figure 3.--Assembly detail of precast concrete ramp planks (part 2).

The planks and cutoff walls are precast by both the Frenchburg and Pine Knot Job Corps Centers for later use on Forest road projects. The plank crossings have been incorporated into force account, timber purchase, and public works projects.
One of the primary reasons the Daniel Boone National Forest is pleased with these structures is that they provide dry crossings during a large part of the year; much of the normal flow goes between the planks and provides a dry running surface. Another reason is that, by articulating the structure, the bolted connections allow some differential settlement to occur without causing structural damage. This type of installation can also be used as a temporary crossing. When it is no longer needed, it can be disassembled and moved to a new site.
The drawings for precast concrete ramp planks are shown in figures 2 and 3. Anyone interested in these installations can contact the Daniel Boone Engineering Staff for plans or further information.
34

Automated Special Project Specifications
Lester M. Pence, Jr. Civil Engineer Region 8
In the past, regionally approved Special Project Specifications (SPS) were sent to each Forest printed on 8-1/2- by II-inch sheets. In turn, each Forest either retyped the SPS or reprinted the applicable SPS and used the cut-and-paste system for each contract package. Both processes were costly, were time consuming, and promoted errors.
With the assistance of Region 8's computer specialist, Leon Furnish, the Automated Special Project Specifications (ASPS) were designed. The specifications are stored on a TI 990 diskette and are sent to each Forest annually. Forests will also store on the diskette any Special Project Specifications (such as the rate of application of seed, lime, fertilizer, and mulch) that are required by the Standard Specifications. Forest personnel are not authorized to make changes to the SPS without Regional Office approval. In approximately 20 minutes using a TI 990, a designer can prepare the Specification and Special Project Specification List (figure 1), Abbreviation List (figure 2), Errata Sheet (figure 3), and Special Project Specifications for a contract package (figure 4).
35

SPECIFICATION AND SPECIAL PROJECT SPECIFICATION LIST
ROAD NAME KIM's KIM'S SPUR CREEK
ROAD NUMBER 637A 637 TERMINI :0.0-3.6 : 0+00-73+00
CONSTRUCTION X RECONSTRUCT ION X STANDARD:LATEST :NOTE: Specifications that are referenced SPEC. OR:REVISION: by other specifications are not SPS NO. :DATE II sted below. STANDARD: SPEC. 1979
101 X X 102 X X 103 X X 104 X X 105 X X 106 X X 201 X X 202 X 203 X 304 X X
ABBREV 6/82 X X ERRA TA 6/82 X X START 6/82 X X REGIONAL:AS SHOWN:
SPS BELOW 104-1 6/82 X 105-2 6/82 X X 106-1 6/82 X X 106-2 6/82 X X 201-1 6/82 X 201-3 6/82 X 201-4 6/82 X X 201-5 6/82 X X 201-14 6/82 X X 201-16 6/82 X 201-19 6/82 X
FOREST : AS SHOWN: SPS BELOW
GW201-1 10/82 X X GW201-a 7/82 X GW625-1 10/82 X X GW625-2 10/82 X X GW625-c 7/82 X
Figure l.--Specification and Special Project Specification List.
36

FOREST SERVICE STANDARD SPECIFICATIONS
SECTION 101 - ABBREVIATIONS Add the following:
Words abbreviated
Cubic Yard Cubic Yard Mile Each Ga I Ion Hour Linear Foot Lump Sum One Thousand Gal Ions Pounds Square Yard Station Station Yard Sq uare Foot
Asphalt Barbed Wire Bituminous Coated Corrugated Steel Pipe
cement Cement-treated Compaction Concrete Corrugated Steel Pipe Corrugated Steel Pipe Arch Erosion and Pollution Control Fabricated Foundation Furnished Grade Height High Strength Horizontal Loading Material Maximum Re f I ector I zed Structural Structural Steel Thickness Vertical White Width With Without Woven wire Ye II ow
Figure 2.--Abbreviation List.
37
Abbreviations
C.Y. CU. YD. MI. EA. GAL. HR. L.F. L.S. M. GALS. LBS. S.Y. STA. STA. YD. S.F.
ASP. B.W. B.C.C.S.P. OR B.C.C.S. PIPE CEMT. CEMT.-T. CMPCT. CONC. e.s.p. C. S.P. ARCH E&P CONTROL FABR. FOUND. FURN. GR. HT. H. STRENGTH HOR. LD. MAT'L MAX. REFLECT. STRUCT. S. STEEL TH. VERT. WHo W. WI WIO W.W. YEo

FOREST SERVICE STANDARD SPECIFICATIONS
ERRATA SHEET
SECTION 102-DEFINITIONS
Between the definition "Timber Sale Contract" and "Traveled Way", add the following definition:
Tops and Limbs -- All bushes and vines and all that portion of a tree less than 6 Inches In diameter.
201.05(b)(7)-PILlNG AND BURNING
After the words, "shall be", In the first sentence, add the word, "p I led".
211.03-METHOD OF MEASUREMENT
Add the fol lowing statement at the end of the paragraph:
"A unit Is 1,000 square feet."
401.11 WEATHER LIMITATIONS
In the first sentence of the first paragraph, after the words, "The bituminous mixture shall not be placed," add the phrase "on any wet surface".
401.21-ACCEPTANCE SAMPLING AND TESTING OF BITUMINOUS MATERIALS (GRADATION AND BITUMINOUS CONTENT)
In the second sentence of the second paragraph, substitute "ASTM" for "ASM".
407.03-MAINTAINING TRAFFIC
Change "103" to "104".
554.06-PLACING AND FASTENING
Paragraph 3 - Substitute 01.4 for 012.1.
555.22-PREPARING METAL SURFACE FOR PAINTING
First paragraph, parts (a) thru (d) - substitute SSPC -SP for SSPC.
Fourth paragraph - substitute SSPC - SP for SSPC.
Figure 3.--Errata Sheet.
38

SPECIAL PROJECT SPECIFICATIONS
FOR
ROAD NAME ROAD NUMBER Kim's Spur 637A Kim's Creek 637
104-1 (6/82)
SECTION 104 - MAINTENANCE, FOR TRAFFIC
Delete the first paragraph and add the fol lowing requirement:
"The existing road may be closed to traffic during construction."
105-2 (6/82)
105.03 - SAMPLING OF AGGREGATE
In the first paragraph, delete al I but the first sentence.,
I 06- I ( 6/82 )
SECTION 106 - MEASUREMENT AND PAYMENT
106.01 Second paragraph - delete "alphabetical" and add "numerical".
I 06- 2 (6/82 )
106.02 - METHODS OF MEASUREMENT
In Paragraph 6, delete the remainder of the first sentence after the word "be" and add: "reduced by moisture content In excess of
6 per cent".
Figure 4.--Special Project Specifications.
39
"" u.s, GOVERNMENT PRINTING OFFICE, 1983 - 381-227 - 814/2250


The Series:
Distribution:
Submittals:
Inquiries:
Regional Coordinators:
Engineering Technical Information System THE ENGINEERING FIELD NOTES SERIES is published periodically as a means of exchanging engineering-related ideas and information on activities, problems encountered and solutions developed, or other data that may be of value to engineers Service-wide. Articles are usually less than six pages, and include material that is not appropriate for an Engineering Technical Report, .or suitable for Engineering Management publications (FSM 1630 and 7113).
Each Field Notes edition is distributed to the Engineering Staff at Regional Offices, Forests, Stations, and Area Headquarters, as well as to Forest Service Engineering Retirees. If your office is not receiving the Field Notes, ask your Office Manager or Regional Information Coordinator to increase the number of copies for your location. Copies of back issues are available in limited quantities from the Washington Office.
Every reader is a potential author of a Field Notes article. If you have a news item or short description about your work that you wish to share with Forest Service Engineers, we invite you to submit the article for publication. Field Personnel should send material to their Regional Information Coordinator for review by the Regional Office to assure inclusion of information that is accurate, timely, and of interest Service-wide; short articles and news items are preferred. Type the manuscript double-spaced; include original drawings and black-and-white photographs (if only color photographs are available, send transparencies or negatives), and two machine copies of the manuscript.
Regional Information Coordinators should send articles for publication and direct questions concerning format, editing, publishing schedules, etc., to:
FOREST SERVICE-USDA Engineering Staff-Washington Office Att: Publications Specialist (Room 1112 RP/E) P.O. Box 2417-Washington, D.C. 20013
Telephone: Area Code 703-235-8198
R-1 Larry Bruesch R-2 Mike Clinton R-3 Jerry Martinez
R-4 Ted Wood R-5 Phillip Russell R-6 Kjell Bakke R-8 Tom Poulin
R-9 Mujeebul Hasan R-10 Mel Dittmer WO AI Colley

Volume 15 April-June 1983
Engineering Field Notes