Embed Size (px)
Citation preview
King County Reclaimed Water Comprehensive Plan
Engineering Analysis and Definition of Reclaimed Water
Strategies
WORKING DRAFT March 2012

For comments or questions, contact: Steve Tolzman King County Wastewater Treatment Division 201 South Jackson Street KSC-NR-0512 Seattle, WA 98104-3856 206-263-6185 [email protected]
This information is available in alternative formats on request at 206-684-1280 (voice) or 711 (TTY).
Engineering Analysis and Definition of Reclaimed Water Strategies
WORKING DRAFT March 2012
Prepared for: King County Wastewater Treatment Division
Prepared by: Brown and Caldwell and Associated Firms
Table of Contents Executive Summary ........................................................................................................................ 1
1.0. Introduction ........................................................................................................................... 5
1.1 Description and Location of Strategies .............................................................................. 5
1.2 Objectives of this Strategy Definition Effort ..................................................................... 6
1.3 Objectives of Benefit-Cost Analyses of Each Strategy ..................................................... 7
2.0. Methodology ......................................................................................................................... 9
2.1 Estimate Reclaimed Water Use Volumes .......................................................................... 9
2.2 Estimate Wastewater Available for Reclamation ............................................................ 11
2.3 Identify Systems and Infrastructure ................................................................................. 12
2.4 Estimate Infrastructure Sizes ........................................................................................... 16
2.5 Determine Operation and Maintenance Needs ................................................................ 18
2.6 Explore Other Resource Recovery Opportunities ........................................................... 19
2.7 Estimate Costs .................................................................................................................. 20
2.8 Analyze Effects on Planned Conveyance and Treatment Improvements ........................ 22
3.0. Redmond/Bear Creek Basin Brightwater Centralized Strategy .......................................... 24
3.1 Strategy Overview ........................................................................................................... 24
3.2 Estimated Volumes and Capacities .................................................................................. 26
3.3 Treatment ......................................................................................................................... 26
3.4 Disinfection ...................................................................................................................... 27
3.5 Distribution System ......................................................................................................... 28
3.6 Operation and Maintenance ............................................................................................. 30
3.7 Cost and Site Footprint Estimates .................................................................................... 30
3.8 Phasing and Coordination ................................................................................................ 31
Working Draft i

3.9 Effects on Planned Conveyance and Treatment Improvements ...................................... 32
4.0. Renton/Tukwila South Plant Centralized Strategy ............................................................. 34
4.1 Strategy Overview ........................................................................................................... 34
4.2 Estimated Volumes and Capacities .................................................................................. 34
4.3 Treatment ......................................................................................................................... 37
4.4 Disinfection ...................................................................................................................... 37
4.5 Distribution System ......................................................................................................... 38
4.6 Operation and Maintenance ............................................................................................. 39
4.7 Cost and Site Footprint Estimates .................................................................................... 40
4.8 Phasing and Coordination ................................................................................................ 40
4.9 Effects on Planned Conveyance and Treatment Improvements ...................................... 41
5.0. Interbay Skimming Decentralized Strategy ........................................................................ 43
5.1 Strategy Overview ........................................................................................................... 43
5.2 Estimated Volumes and Capacities .................................................................................. 43
5.3 Treatment ......................................................................................................................... 46
5.4 Disinfection ...................................................................................................................... 46
5.5 Distribution System ......................................................................................................... 46
5.6 Operation and Maintenance ............................................................................................. 47
5.7 Cost and Site Footprint Estimates .................................................................................... 48
5.8 Phasing and Coordination ................................................................................................ 48
5.9 Effects on Planned Conveyance and Treatment Improvements ...................................... 49
6.0. Duwamish Polishing Decentralized Strategy ...................................................................... 50
6.1 Strategy Overview ........................................................................................................... 50
6.2 Estimated Volumes and Capacities .................................................................................. 50
6.3 Treatment ......................................................................................................................... 53
Working Draft ii
6.4 Disinfection ...................................................................................................................... 53
6.5 Distribution System ......................................................................................................... 53
6.6 Operation and Maintenance ............................................................................................. 54
6.7 Cost and Site Footprint Estimates .................................................................................... 55
6.8 Phasing and Coordination ................................................................................................ 55
6.9 Effects on Planned Conveyance and Treatment Improvements ...................................... 56
7.0. Lower Green River Valley Skimming Decentralized Strategy ........................................... 58
7.1 Strategy Overview ........................................................................................................... 58
7.2 Estimated Volumes and Capacities .................................................................................. 60
7.3 Treatment ......................................................................................................................... 60
7.4 Disinfection ...................................................................................................................... 60
7.5 Distribution System ......................................................................................................... 61
7.6 Operation and Maintenance ............................................................................................. 62
7.7 Cost and Site Footprint Estimates .................................................................................... 62
7.8 Phasing and Coordination ................................................................................................ 63
7.9 Effects on Planned Conveyance and Treatment Improvements ...................................... 64
8.0. Potential New Technology Influences ................................................................................ 65
9.0. References ........................................................................................................................... 67
Working Draft iii

Tables Table 1. Reclaimed Water Strategy Summaries ............................................................................. 3
Table 2. Reclaimed Water Usage Categories ............................................................................... 10
Table 3. Usage Peaking Factors .................................................................................................... 11
Table 4. Assumed Nutrient Levels in Reclaimed Water Used in Strategies That Include Wetland Enhancements ....................................................................................................................... 13
Table 5. System Performance and Sizing Criteria ........................................................................ 17
Table 6. Growth Allowance Factors for Sizing Facilities ............................................................. 18
Table 7. Reclaimed Water Use Projections and Required System Capacities (mgd) Brightwater Strategy ................................................................................................................................. 26
Table 8. Wastewater Available for Reclamation (mgd) Brightwater Strategy ............................. 26
Table 9. Brightwater Strategy Pressure Zones .............................................................................. 28
Table 10. Brightwater Strategy Pump Stations ............................................................................. 29
Table 11. Brightwater Strategy Piping .......................................................................................... 29
Table 12. Brightwater Strategy Storage Tank Elevations and Volumes ...................................... 30
Table 13. Brightwater Strategy Cost and Site Estimates .............................................................. 31
Table 14. Reclaimed Water Use Projections and Required System Capacities (mgd) Renton/Tukwila South Plant Centralized Strategy ............................................................... 37
Table 15. Wastewater Available for Reclamation (mgd) Renton/Tukwila South Plant Centralized Strategy ................................................................................................................................. 37
Table 16. Central Pressure Zone South Plant Centralized Strategy.............................................. 38
Table 17. Pump Station to Serve the Central Pressure Zone South Plant Centralized Strategy ... 39
Table 18. South Plant Strategy Pipe System ................................................................................. 39
Table 19. Storage Tank South Plant Strategy ............................................................................... 39
Table 20. South Plant Strategy Cost and Site Estimates ............................................................... 40
Table 21. Reclaimed Water Use Projections and Required System Capacities (mgd) Interbay Strategy ................................................................................................................................. 46
Working Draft iv
Table 22. Interbay Strategy Pressure Zone ................................................................................... 47
Table 23. Interbay Strategy Pump Station .................................................................................... 47
Table 24. Interbay Strategy Pipe System ...................................................................................... 47
Table 25. Interbay Strategy Storage .............................................................................................. 47
Table 26. Interbay Strategy Cost and Site Estimates .................................................................... 48
Table 27. Reclaimed Water Use Projections and Required System Capacities (mgd) Duwamish Strategy ................................................................................................................................. 53
Table 28. Wastewater Available for Reclamation (mgd) Duwamish Strategy ............................. 53
Table 29. Duwamish Strategy Pressure Zones ............................................................................. 54
Table 30. Duwamish Strategy Pump Station ................................................................................ 54
Table 31. Duwamish Strategy Pipeline ......................................................................................... 54
Table 32. Duwamish Strategy Storage Tank ................................................................................ 54
Table 33. Duwamish Strategy Cost and Site Estimates ................................................................ 55
Table 34. Reclaimed Water Use Projections and Required System Capacities (mgd) LGRV Strategy ................................................................................................................................. 60
Table 35. Wastewater Available for Reclamation (mgd) LGRV Strategy ................................... 60
Table 36. LGRV Strategy Pressure Zone ..................................................................................... 61
Table 37. LGRV Strategy Pump Station ....................................................................................... 61
Table 38. LGRV Strategy Pipe System ........................................................................................ 61
Table 39. LGRV Strategy Storage Tank ....................................................................................... 62
Table 40. LGRV Strategy Cost and Site Estimates ...................................................................... 63
Working Draft v
Figures Figure 1. Reclaimed Water Strategies Recommended for Analysis ............................................... 8
Figure 2. Brightwater Strategy Area ............................................................................................. 25
Figure 3. South Plant Strategy Area ............................................................................................. 35
Figure 4. Interbay Strategy Area ................................................................................................... 44
Figure 5. Duwamish Strategy Area ............................................................................................... 51
Figure 6. Lower Green Valley Strategy Area ............................................................................... 59
Working Draft vi

Abbreviations ASD average seasonal demand
BOD biochemical oxygen demand
BTU British thermal unit
EPA US Environmental Protection Agency
ETS Effluent Transfer System
fps feet per second
ft feet
FTE full time equivalent
gpd gallons per day
gpm gallons per minute
HGL hydraulic grade line
hr hours
hp horsepower
IMLR internal mixed liquor recycle
in inches
kW kilowatt
kWh kilowatt hours
LGRV Lower Green River Valley
$M million dollars
MBR membrane biological reactor
MDD maximum day demand
mgd million gallons per day
MG million gallons
mg/L milligrams per liter
MMBTU million BTU
mL milliliter
MWh megawatt hours
NTU nephelometric turbidity unit
O&M operation and maintenance
PHD peak hour demand
Working Draft vii
Working Draft viii
psi pounds per square inch
TIN total inorganic nitrogen
TKN total Kjeldahl nitrogen
TSS total suspended solids
UV ultraviolet
WAS waste activated sludge
WTD King County Wastewater Treatment Division
EXECUTIVE SUMMARY This report was prepared to support the development of a Reclaimed Water Comprehensive Plan for King County’s Wastewater Treatment Division (WTD). The purpose of the Reclaimed Water Comprehensive Plan is to determine if, how, when, where, and by what funding mechanisms the County’s existing reclaimed water program should expand over the next 30 years, through 2040 and beyond.
The work documented in this report was conducted as part of Step 4 of the reclaimed water planning process as amended and approved by the King County Council in May 2011. The report presents the methodology and results of efforts to further define the three reclaimed water strategies and also considers how future technology may influence strategies. Other reports document the analyses, also conducted during Step 4 of the planning process, of the potential benefits and costs of implementing the strategies, as applied to the environment and the region more generally.
Table 1 presents an overview of findings for each strategy, including anticipated volumes of reclaimed water and of wastewater supply, treatment approaches, infrastructure requirements, resource recovery opportunities, and capital as well as operation/maintenance costs for each strategy.
In addition to the results presented in Table 1, this study also identified operation and maintenance needs as well as the effects of each reclaimed water strategy on WTD’s existing plans to improve wastewater conveyance and treatment. Operation and maintenance needs for each strategy generally include storage of specified chemicals for the identified treatment processes as well as operation and maintenance of relevant equipment. Though each strategy would result in removing flows from the regional conveyance system, none of the strategies would affect the sizing or timing of WTD’s planned treatment or conveyance system improvements.
The strategies were developed for planning and evaluation purposes only and are not intended to necessarily represent any future reclaimed water improvement projects or any implied preference or commitment on the part of any interested parties or potential end users.
Each strategy approved and developed for further analysis represents a concept for producing and supplying reclaimed water to serve potential uses identified during the reclaimed water planning process. The uses include both nonpotable consumptive uses (irrigation, commercial, industrial) and environmental enhancement uses (wetland enhancement and associated indirect groundwater recharge and/or streamflow augmentation). The following are brief descriptions of the strategies:
• Redmond/Bear Creek Basin Brightwater Centralized Strategy. Reclaimed water would be produced through the membrane bioreactor (MBR) process at the Brightwater Treatment Plant for distribution to two areas—one in the immediate vicinity of the plant and one farther south above Lake Sammamish⎯via new pipelines connected to the South Segment of the Brightwater reclaimed water pipeline.
• Renton/Tukwila South Plant Centralized Strategy. Reclaimed water would be produced through expansion of the South Treatment Plant’s tertiary sand filtration system
Working Draft 1
Working Draft 2
for distribution to an area just south of Lake Washington via extension of an existing pipeline that delivers reclaimed water to the City of Tukwila.
• Reclaimed Water Skimming or Polishing Decentralized Strategy.1 This strategy represents opportunities for smaller scale reclaimed water implementation. Infrastructure was constrained to a single treatment plant of up to 0.5 mgd capacity and up to 1 mile of reclaimed water pipeline. Three potential areas and configurations were identified to help define the decentralized strategy:
⎯ An MBR skimming plant located in the Interbay area of Seattle would produce reclaimed water from untreated wastewater in adjacent conveyance pipelines for distribution near the plant via a new pipeline.
⎯ A sand filtration polishing plant located in Seattle on the west side of the Duwamish River would produce reclaimed water from flows in the Effluent Transfer System (ETS) pipeline that carries South plant secondary effluent for discharge at Alki Point in West Seattle. The reclaimed water would be distributed to nearby uses via a new pipeline.
⎯ An MBR skimming plant located in the lower Green River Valley in south King County would produce reclaimed water from untreated wastewater in adjacent conveyance pipelines for distribution near the plant via a new pipeline.
1 A skimming plant removes some of the raw wastewater from pipelines that carry the wastewater to regional plants for treatment and then treats the wastewater to reclaimed water quality for local distribution. A polishing plant removes some secondary-treated effluent from pipelines exiting regional treatment plants and treats the effluent to reclaimed water quality standards.
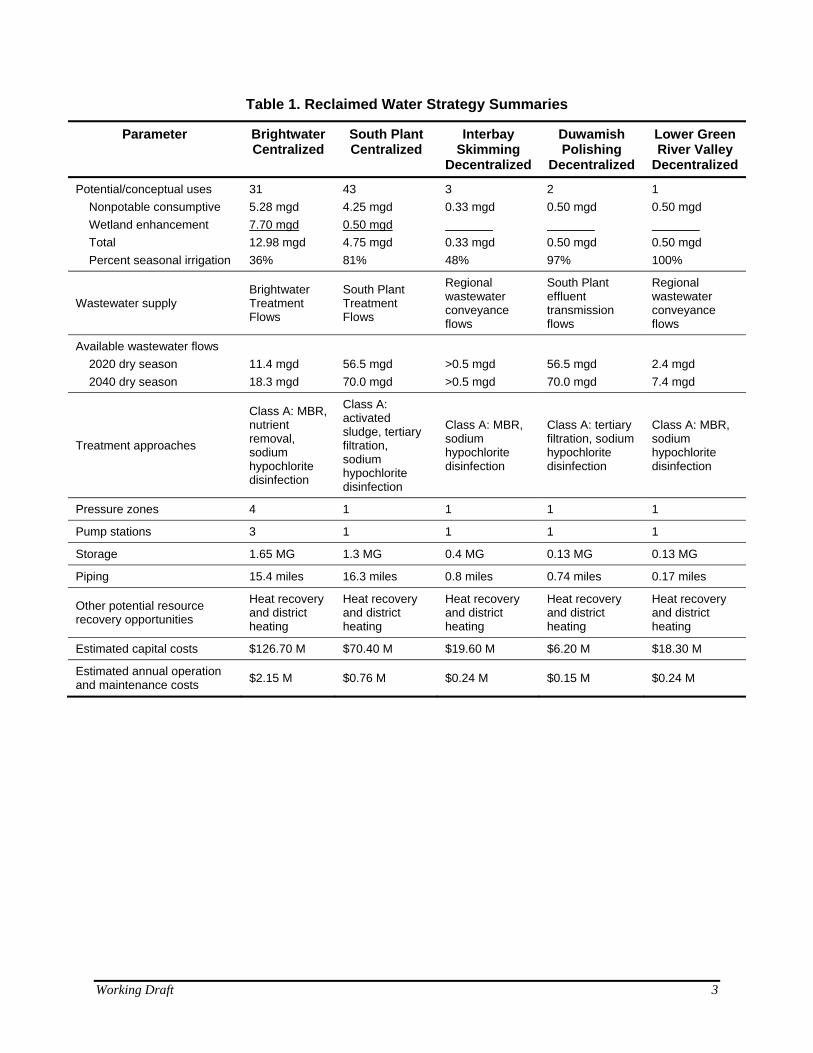
Table 1. Reclaimed Water Strategy Summaries
Parameter Brightwater Centralized
South Plant Centralized
Interbay Skimming
Decentralized
Duwamish Polishing
Decentralized
Lower Green River Valley
Decentralized
Potential/conceptual uses Nonpotable consumptive Wetland enhancement Total Percent seasonal irrigation
31 5.28 mgd 7.70 mgd 12.98 mgd 36%
43 4.25 mgd 0.50 mgd 4.75 mgd 81%
3 0.33 mgd 0.33 mgd 48%
2 0.50 mgd 0.50 mgd 97%
1 0.50 mgd 0.50 mgd 100%
Wastewater supply Brightwater Treatment Flows
South Plant Treatment Flows
Regional wastewater conveyance flows
South Plant effluent transmission flows
Regional wastewater conveyance flows
Available wastewater flows 2020 dry season 2040 dry season
11.4 mgd 18.3 mgd
56.5 mgd 70.0 mgd
>0.5 mgd >0.5 mgd
56.5 mgd 70.0 mgd
2.4 mgd 7.4 mgd
Treatment approaches
Class A: MBR, nutrient removal, sodium hypochlorite disinfection
Class A: activated sludge, tertiary filtration, sodium hypochlorite disinfection
Class A: MBR, sodium hypochlorite disinfection
Class A: tertiary filtration, sodium hypochlorite disinfection
Class A: MBR, sodium hypochlorite disinfection
Pressure zones 4 1 1 1 1
Pump stations 3 1 1 1 1
Storage 1.65 MG 1.3 MG 0.4 MG 0.13 MG 0.13 MG
Piping 15.4 miles 16.3 miles 0.8 miles 0.74 miles 0.17 miles
Other potential resource recovery opportunities
Heat recovery and district heating
Heat recovery and district heating
Heat recovery and district heating
Heat recovery and district heating
Heat recovery and district heating
Estimated capital costs $126.70 M $70.40 M $19.60 M $6.20 M $18.30 M
Estimated annual operation and maintenance costs $2.15 M $0.76 M $0.24 M $0.15 M $0.24 M
Working Draft 3

Working Draft 4
Working Draft 5
1.0. INTRODUCTION This report was prepared to support the development of a Reclaimed Water Comprehensive Plan for King County’s Wastewater Treatment Division (WTD). The purpose of the Reclaimed Water Comprehensive Plan is to determine if, how, when, where, and by what funding mechanisms the County’s existing reclaimed water program should expand over the next 30 years, through 2040 and beyond.
The work documented in this report was conducted as part of Step 4 of the reclaimed water planning process as amended and approved by the King County Council in May 2011. The report presents the methodology and results of efforts to further define the three reclaimed water strategies developed and approved earlier during Step 3.2 Other reports document the analyses, also conducted during Step 4, of potential benefits and costs of implementing the strategies, as applied to the environment and the region more generally.
Throughout the development, definition, and analysis of the strategies, WTD applied County Council−approved evaluation criteria to assess how each strategy addresses the three drivers for the Reclaimed Water Comprehensive Plan—regional wastewater system planning, creating resources from wastewater, and protecting Puget Sound water quality.
The strategies were developed for planning and evaluation purposes only and are not intended to necessarily represent any future reclaimed water improvement projects or any implied preference or commitment on the part of any interested parties or potential end users.
This chapter briefly describes the strategies and then outlines the objectives both of this effort to refine the strategies and of the benefit-cost analyses that are documented in other reports.
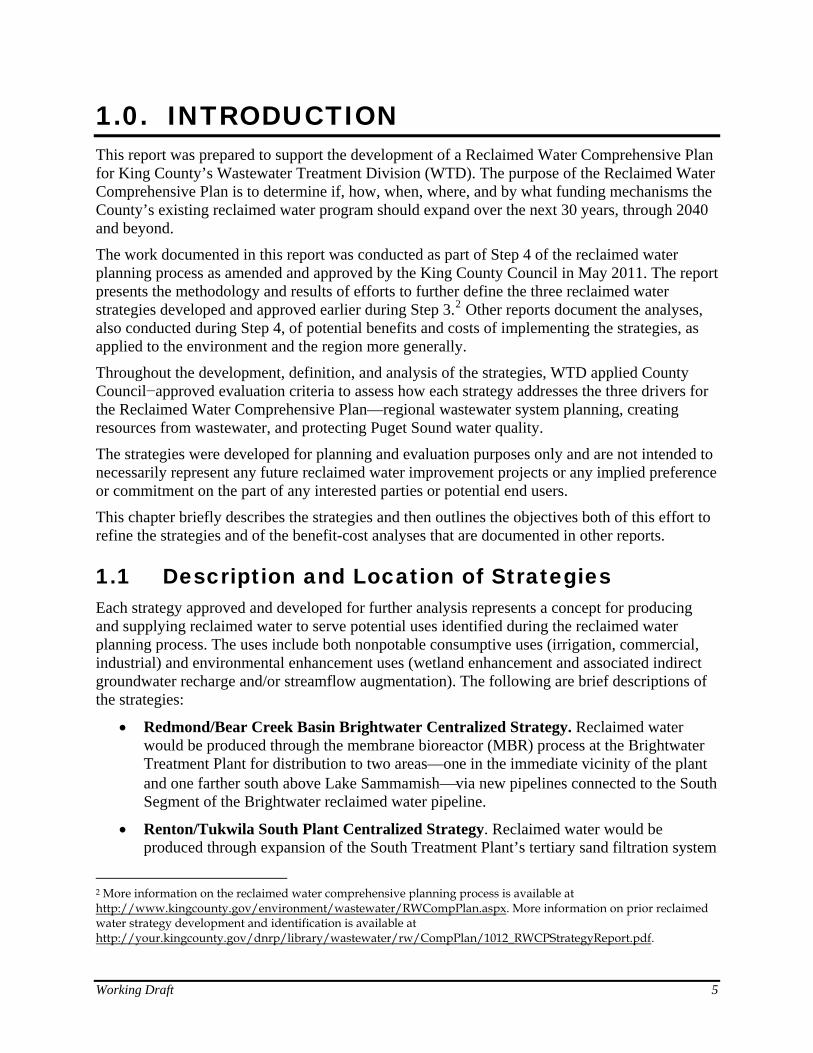
1.1 Description and Location of Strategies Each strategy approved and developed for further analysis represents a concept for producing and supplying reclaimed water to serve potential uses identified during the reclaimed water planning process. The uses include both nonpotable consumptive uses (irrigation, commercial, industrial) and environmental enhancement uses (wetland enhancement and associated indirect groundwater recharge and/or streamflow augmentation). The following are brief descriptions of the strategies:
• Redmond/Bear Creek Basin Brightwater Centralized Strategy. Reclaimed water would be produced through the membrane bioreactor (MBR) process at the Brightwater Treatment Plant for distribution to two areas—one in the immediate vicinity of the plant and one farther south above Lake Sammamish⎯via new pipelines connected to the South Segment of the Brightwater reclaimed water pipeline.
• Renton/Tukwila South Plant Centralized Strategy. Reclaimed water would be produced through expansion of the South Treatment Plant’s tertiary sand filtration system
2 More information on the reclaimed water comprehensive planning process is available at http://www.kingcounty.gov/environment/wastewater/RWCompPlan.aspx. More information on prior reclaimed water strategy development and identification is available at http://your.kingcounty.gov/dnrp/library/wastewater/rw/CompPlan/1012_RWCPStrategyReport.pdf.
Working Draft 6
for distribution to an area just south of Lake Washington via extension of an existing pipeline that delivers reclaimed water to the City of Tukwila.
• Reclaimed Water Skimming or Polishing Decentralized Strategy.3 This strategy represents opportunities for smaller scale reclaimed water implementation. Infrastructure was constrained to a single treatment plant of up to 0.5 mgd capacity and up to 1 mile of reclaimed water pipeline. Three potential areas and configurations were identified to help define the decentralized strategy:
⎯ An MBR skimming plant located in the Interbay area of Seattle would produce reclaimed water from untreated wastewater in adjacent conveyance pipelines for distribution near the plant via a new pipeline.
⎯ A sand filtration polishing plant located in Seattle on the west side of the Duwamish River would produce reclaimed water from flows in the Effluent Transfer System (ETS) pipeline that carries South plant secondary effluent for discharge at Alki Point in West Seattle. The reclaimed water would be distributed to nearby uses via a new pipeline.
⎯ An MBR skimming plant located in the lower Green River Valley in south King County would produce reclaimed water from untreated wastewater in adjacent conveyance pipelines for distribution near the plant via a new pipeline.
The locations of the strategies are shown in Figure 1.
1.2 Objectives of this Strategy Definition Effort This effort set out to develop the following conceptual information to further define each reclaimed water strategy:
• Estimates of reclaimed water usage volumes, variability, and rates as well as the volume of wastewater available for reclamation.
• Systems and infrastructure needed to produce and deliver reclaimed water to satisfy estimated usage in each area, including treatment levels, technologies, and capacity; pumping, piping, and storage requirements; and site footprints.
• Estimates of capital and operation/maintenance costs for identified reclaimed water treatment, pumping, piping, and storage systems.
• Identification of other coincidental resource recovery opportunities, including nutrient, heat, and hydraulic energy recovery.
• Analysis of the effects of each reclaimed water strategy on existing plans to improve wastewater conveyance and treatment.
3 A skimming plant removes some of the raw wastewater from pipelines that carry the wastewater to regional plants for treatment and then treats the wastewater to reclaimed water quality for local distribution. A polishing plant removes some secondary-treated effluent from pipelines exiting regional treatment plants and treats the effluent to reclaimed water quality standards.
1.3 Objectives of Benefit-Cost Analyses of Each Strategy
A variety of engineering, environmental, and economic analyses were conducted on each strategy. The results of these analyses, documented in other reports, will allow for regional discussion on the following topics:
• Consideration of reclaimed water as a wastewater disposal option for the region if conditions lead to greater restrictions on discharges to Puget Sound.
• How reclaimed water strategies could fit into regional wastewater system planning and operations, including their effect on planned improvements and future operation of the regional wastewater system.
• The potential effects of reclaimed water strategies on the environment, including the following:
⎯ Potential for reclaimed water to augment other water supply sources
⎯ Potential for reclaimed water to enhance watershed basin flows
⎯ Effects of reclaimed water use on groundwater and surface water quality
⎯ Effects of reclaimed water use on the built environment, including energy demands and greenhouse gas emissions
• Changes in existing laws and policies that may be needed in order to allow expanded use of reclaimed water.
• The full range of benefits and costs associated with providing additional reclaimed water to serve both nonpotable consumptive and environmental enhancement uses.
The reports documenting these analyses can be found at http://www.kingcounty.gov/environment/wastewater/RWCompPlan/Library.aspx#4.
Working Draft 7
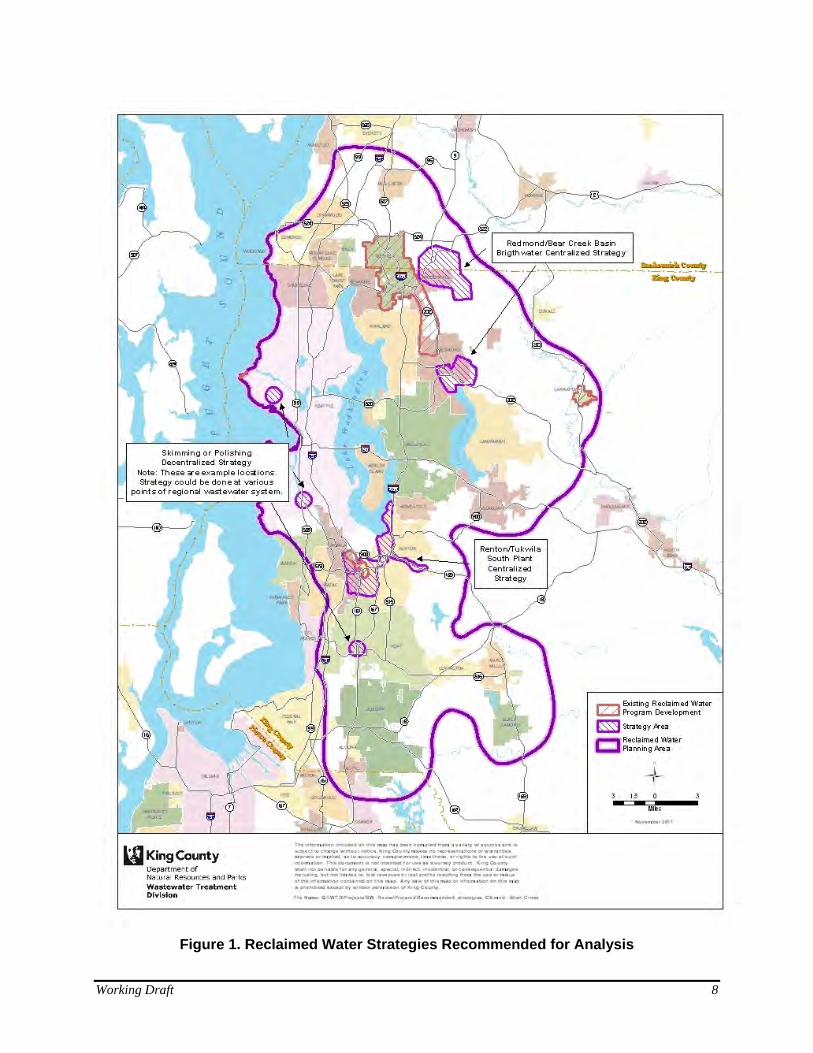
Figure 1. Reclaimed Water Strategies Recommended for Analysis
Working Draft 8
Working Draft 9
2.0. METHODOLOGY This chapter describes the methodology used to further define the systems, infrastructure, and costs associated with each reclaimed water strategy. The methodology consists of the following tasks:
• Estimate reclaimed water use volumes
• Estimate wastewater available for reclamation
• Identify treatment, disinfection, and distribution systems and infrastructure
• Estimate infrastructure sizes
• Determine operation and maintenance needs
• Explore other resource recovery opportunities
• Estimate costs
• Analyze effects on planned conveyance and treatment improvements
Succeeding chapters present the definitions that resulted from applying this methodology. While strategy features are generally consistent with information presented in prior strategy planning and development reports, differences have emerged during the definition process. Strategy features, including locations and layouts of components, are still considered conceptual.
2.1 Estimate Reclaimed Water Use Volumes This section describes the methods used to estimate reclaimed water use volumes for each strategy area. The process built on data collected during the reclaimed water comprehensive planning process regarding potential uses, including use categories, locations, types, and potential annual use volumes.4
2.1.1 Categories, Use Type, and Seasonality The potential reclaimed water uses are classified as either nonpotable consumptive or environmental enhancement use types. Nonpotable consumptive uses include irrigation, commercial, industrial, and other uses. Environmental enhancement uses include wetland enhancement and associated indirect groundwater recharge and/or streamflow augmentation.
The category, use type, and seasonality of use for nonpotable consumptive and environmental enhancement uses are shown in Table 2. Irrigation, with the exception of nursery applications, is considered a seasonal use. The type of usage for commercial, industrial, and “other” categories varies; some of these uses can have a site irrigation component as well.
4 See http://www.kingcounty.gov/environment/wastewater/RWCompPlan/Library.aspx#4 for reports that document the identification of potential uses.
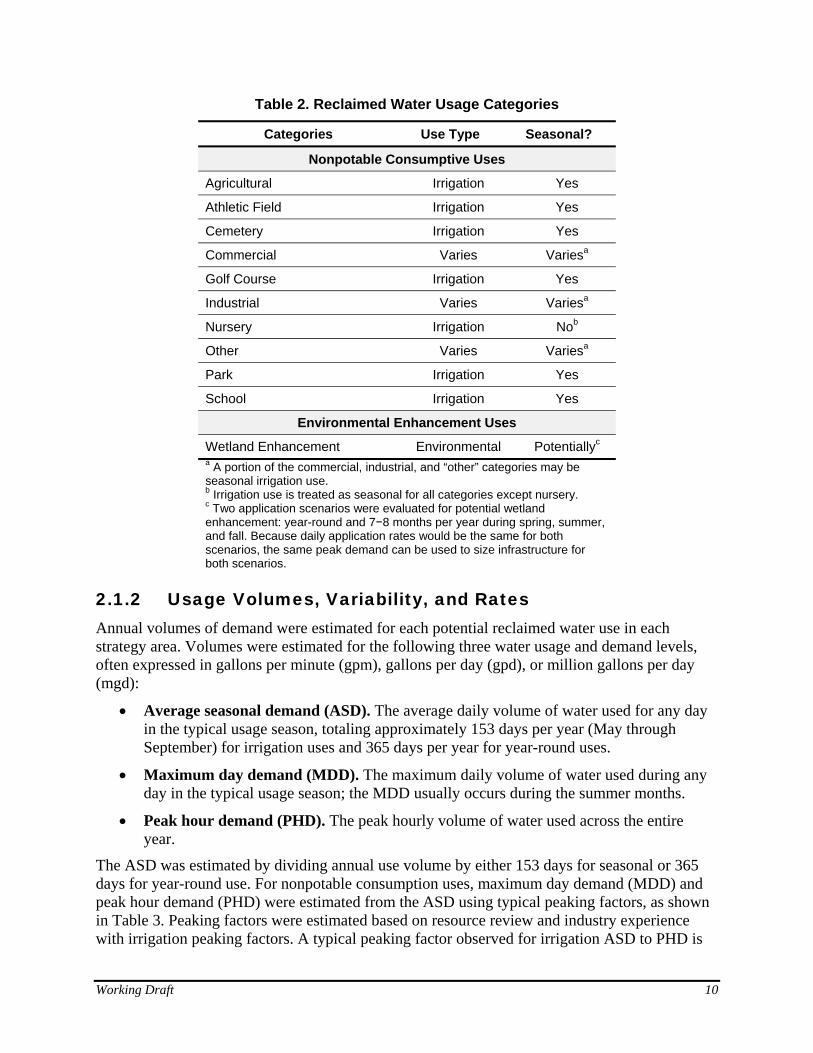
Table 2. Reclaimed Water Usage Categories
Categories Use Type Seasonal?
Nonpotable Consumptive Uses
Agricultural Irrigation Yes
Athletic Field Irrigation Yes
Cemetery Irrigation Yes
Commercial Varies Variesa
Golf Course Irrigation Yes
Industrial Varies Variesa
Nursery Irrigation Nob
Other Varies Variesa
Park Irrigation Yes
School Irrigation Yes
Environmental Enhancement Uses
Wetland Enhancement Environmental Potentiallyc a A portion of the commercial, industrial, and “other” categories may be seasonal irrigation use. b Irrigation use is treated as seasonal for all categories except nursery. c Two application scenarios were evaluated for potential wetland enhancement: year-round and 7−8 months per year during spring, summer, and fall. Because daily application rates would be the same for both scenarios, the same peak demand can be used to size infrastructure for both scenarios.
2.1.2 Usage Volumes, Variability, and Rates Annual volumes of demand were estimated for each potential reclaimed water use in each strategy area. Volumes were estimated for the following three water usage and demand levels, often expressed in gallons per minute (gpm), gallons per day (gpd), or million gallons per day (mgd):
• Average seasonal demand (ASD). The average daily volume of water used for any day in the typical usage season, totaling approximately 153 days per year (May through September) for irrigation uses and 365 days per year for year-round uses.
• Maximum day demand (MDD). The maximum daily volume of water used during any day in the typical usage season; the MDD usually occurs during the summer months.
• Peak hour demand (PHD). The peak hourly volume of water used across the entire year.
The ASD was estimated by dividing annual use volume by either 153 days for seasonal or 365 days for year-round use. For nonpotable consumption uses, maximum day demand (MDD) and peak hour demand (PHD) were estimated from the ASD using typical peaking factors, as shown in Table 3. Peaking factors were estimated based on resource review and industry experience with irrigation peaking factors. A typical peaking factor observed for irrigation ASD to PHD is
Working Draft 10
Working Draft 11
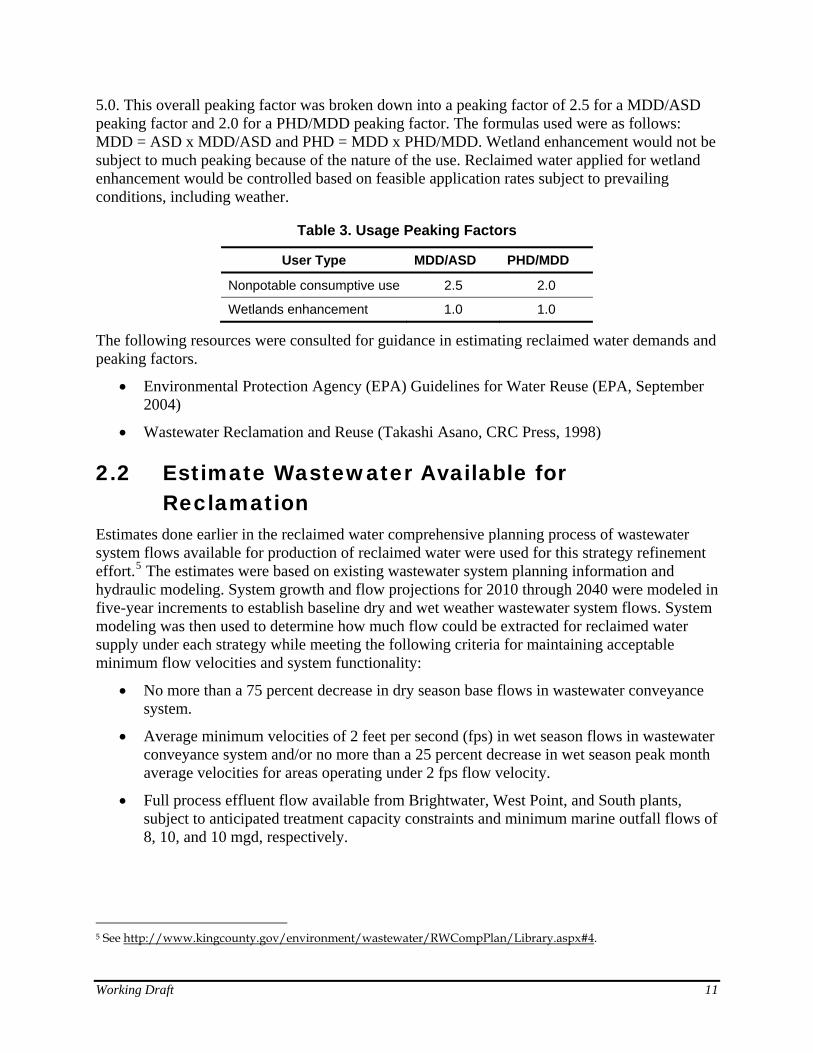
5.0. This overall peaking factor was broken down into a peaking factor of 2.5 for a MDD/ASD peaking factor and 2.0 for a PHD/MDD peaking factor. The formulas used were as follows: MDD = ASD x MDD/ASD and PHD = MDD x PHD/MDD. Wetland enhancement would not be subject to much peaking because of the nature of the use. Reclaimed water applied for wetland enhancement would be controlled based on feasible application rates subject to prevailing conditions, including weather.
Table 3. Usage Peaking Factors
User Type MDD/ASD PHD/MDD
Nonpotable consumptive use 2.5 2.0
Wetlands enhancement 1.0 1.0
The following resources were consulted for guidance in estimating reclaimed water demands and peaking factors.
• Environmental Protection Agency (EPA) Guidelines for Water Reuse (EPA, September 2004)
• Wastewater Reclamation and Reuse (Takashi Asano, CRC Press, 1998)
2.2 Estimate Wastewater Available for Reclamation
Estimates done earlier in the reclaimed water comprehensive planning process of wastewater system flows available for production of reclaimed water were used for this strategy refinement effort.5 The estimates were based on existing wastewater system planning information and hydraulic modeling. System growth and flow projections for 2010 through 2040 were modeled in five-year increments to establish baseline dry and wet weather wastewater system flows. System modeling was then used to determine how much flow could be extracted for reclaimed water supply under each strategy while meeting the following criteria for maintaining acceptable minimum flow velocities and system functionality:
• No more than a 75 percent decrease in dry season base flows in wastewater conveyance system.
• Average minimum velocities of 2 feet per second (fps) in wet season flows in wastewater conveyance system and/or no more than a 25 percent decrease in wet season peak month average velocities for areas operating under 2 fps flow velocity.
• Full process effluent flow available from Brightwater, West Point, and South plants, subject to anticipated treatment capacity constraints and minimum marine outfall flows of 8, 10, and 10 mgd, respectively.
5 See http://www.kingcounty.gov/environment/wastewater/RWCompPlan/Library.aspx#4.
2.3 Identify Systems and Infrastructure The following sections describe the methods used to determine appropriate treatment, disinfection, and distribution systems and associated infrastructure for each reclaimed water strategy.
2.3.1 Treatment Systems This section describes available treatment options to meet Washington state requirements for production of Class A reclaimed water and to provide further nutrient removal for potential environmental enhancement reclaimed water uses, including wetlands enhancement.
Under current Washington state reclaimed water standards, Class A reclaimed water is defined as reclaimed water that, at a minimum, is at all times an oxidized, coagulated, filtered, disinfected wastewater:
• Oxidized wastewater is defined as wastewater in which organic matter has been stabilized such that the biochemical oxygen demand (BOD) does not exceed 30 mg/L and the total suspended solids (TSS) do not exceed 30 mg/L, is non-putrescible, and contains dissolved oxygen.
• Coagulated wastewater is defined as an oxidized wastewater in which colloidal and finely divided suspended matter has been destabilized and agglomerated prior to filtration by the addition of chemicals or by an equally effective method.
• Filtered wastewater is defined as an oxidized, coagulated wastewater that has been passed through filtration processes so that the turbidity, as determined by an approved laboratory method, does not exceed an average operating turbidity of 2 nephelometric turbidity units (NTUs), determined monthly, and does not exceed 5 NTUs at any time.
• Disinfected wastewater means wastewater in which pathogenic organisms have been destroyed by chemical, physical, or biological means. Reclaimed wastewater shall be considered adequately disinfected if the median number of total coliform organisms in the wastewater after disinfection does not exceed 2.2/100 mL, as determined from the bacteriological results of the last 7 days for which analyses have been completed, and the number of total coliform organisms does not exceed 23/100 mL in any sample. In addition, Washington state reclaimed water standards typically require a minimum disinfectant residual of 0.5 mg/L as free chlorine at every point in the reclaimed water distribution system.
Options considered for reclaimed water treatment systems that can meet these standards for types of strategies are discussed below.
Options for Centralized Strategies
For the two centralized strategies, it was assumed that current reclaimed water treatment processes at the Brightwater Treatment Plant (MBR) and South Treatment Plant (activated sludge and rapid sand filtration) with additional disinfection can achieve Class A reclaimed water suitable for nonpotable consumptive uses. Additional sand filter units would need to be added to South plant’s system to accommodate the Renton/Tukwila South Plant Centralized Strategy.
Working Draft 12
Working Draft 13
For use of reclaimed water in existing natural wetlands, current Washington state regulations require phosphorus concentrations in reclaimed water to be less than 1 mg/L and total Kjeldahl nitrogen (TKN) concentrations to be less than 3 mg/L, both on an average annual basis.6 The only strategy that would need to meet these requirements is the Redmond/Bear Creek Basin Centralized Strategy. The Brightwater MBR process, while not currently producing, is designed to produce reclaimed water that meets the TKN standard, but phosphorus removal processes would be required to meet the phosphorus standard. These nutrient removal processes are assumed elements of the Redmond/Bear Creek Basin Centralized Strategy because of the discharge to natural existing wetlands.
The South Treatment Plant process is not capable of nutrient removal. Nutrient removal is not assumed for the Renton/Tukwila South Plant Centralized Strategy because the discharge is to a constructed beneficial use wetland. It is assumed that due to the net increase in environmental function derived as a result of the discharge of reclaimed water, nutrient removal will not be required under current Washington state regulations.
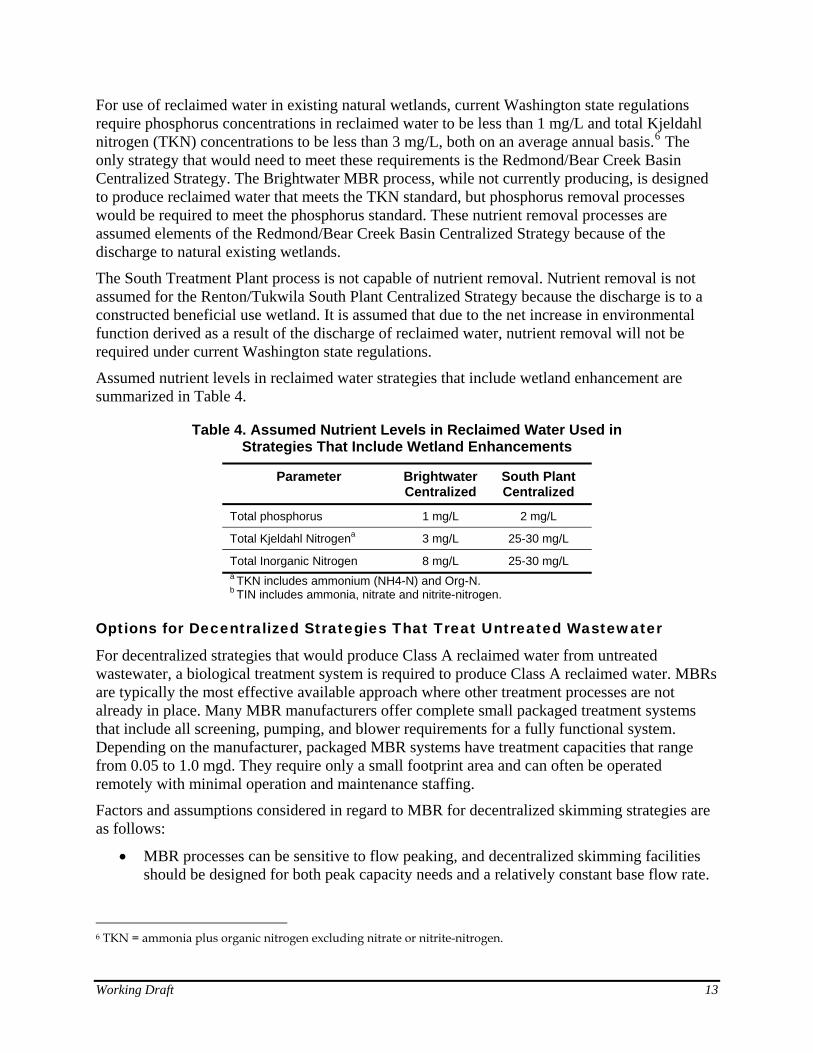
Assumed nutrient levels in reclaimed water strategies that include wetland enhancement are summarized in Table 4.
Table 4. Assumed Nutrient Levels in Reclaimed Water Used in Strategies That Include Wetland Enhancements
Parameter Brightwater Centralized
South Plant Centralized
Total phosphorus 1 mg/L 2 mg/L
Total Kjeldahl Nitrogena 3 mg/L 25-30 mg/L
Total Inorganic Nitrogen 8 mg/L 25-30 mg/L a TKN includes ammonium (NH4-N) and Org-N. b TIN includes ammonia, nitrate and nitrite-nitrogen.
Options for Decentralized Strategies That Treat Untreated Wastewater
For decentralized strategies that would produce Class A reclaimed water from untreated wastewater, a biological treatment system is required to produce Class A reclaimed water. MBRs are typically the most effective available approach where other treatment processes are not already in place. Many MBR manufacturers offer complete small packaged treatment systems that include all screening, pumping, and blower requirements for a fully functional system. Depending on the manufacturer, packaged MBR systems have treatment capacities that range from 0.05 to 1.0 mgd. They require only a small footprint area and can often be operated remotely with minimal operation and maintenance staffing.
Factors and assumptions considered in regard to MBR for decentralized skimming strategies are as follows:
• MBR processes can be sensitive to flow peaking, and decentralized skimming facilities should be designed for both peak capacity needs and a relatively constant base flow rate.
6 TKN = ammonia plus organic nitrogen excluding nitrate or nitrite-nitrogen.

• An influent pump station needs to be installed in the wastewater collection system to convey the wastewater to the MBR plant.
• Continuous year-round operation was assumed because complete seasonal shutdown of MBR treatment facilities requires reseeding and redeveloping a biological treatment population before restarting the processes; cleaning and removal of activated sludge from process tanks; continuous submergence of the membranes in clean water; continuation of regular membrane flexing and air scour maintenance; and regular disinfection of storage water to prevent algae growth and membrane fouling. MBR skimming systems can be operated with minimal flow during the off season; treated water would be sent to the downstream collection system and conveyed either to centralized treatment facilities or directly to local water bodies through existing outfalls.
• Waste solids from decentralized MBR processes would be returned to the wastewater collection system and flushed downstream for processing at central treatment plants. The small amount of solids generated by a 0.5 mgd decentralized MBR facility typically will have negligible impact on larger downstream centralized wastewater treatment plants.
Options for Decentralized Strategies That Treat Secondary Effluent
For decentralized strategies that would produce Class A reclaimed water from secondary effluent from conveyance pipelines such as the South Plant Effluent Transfer System (ETS), additional biological treatment is not required. Class A reclaimed water supply can be achieved by implementing tertiary coagulation/filtration and disinfection processes to provide polishing treatment of secondary effluent.
Several technologies are capable of meeting Class A coagulation/filtration performance and turbidity requirements. Of these technologies, rapid sand or membrane filtration can be readily implemented via modular construction or small packaged systems.
Factors and assumptions considered in regard to decentralized polishing strategies are as follows:
• All pumps, chemical coagulant/polymer feed systems, and filter areas are designed around peak flow requirements. While influent quality is also a concern, the relatively stable nature and high quality of typical treated secondary effluent makes this a lesser consideration for design of these systems.
• If the secondary effluent conveyance pipeline is sufficiently pressurized, then the effluent can be conveyed to the polishing filtration system using a sufficiently sized pipeline and throttling valve to meet reclaimed water flow demands. If the secondary effluent conveyance pipeline is under-pressurized or not pressurized, then the polishing system will require influent pumping to convey the effluent through the filtration processes.
• Waste streams would be discharged to the wastewater collection system and flushed downstream for central treatment plant processing. Small quantities of residual solids generated by filtration waste streams would have a negligible impact on operation of large centralized wastewater treatment facilities.
Working Draft 14
2.3.2 Disinfection Systems Each of the treatment options for producing reclaimed water will require disinfection. It was assumed in defining the strategies that all the reclaimed water strategies would use a sodium hypochlorite disinfection system. While many disinfection technologies, including ozone and ultraviolet (UV) light, can achieve the total coliform inactivation required by Washington state standards, chlorine disinfection is often the best choice for reclaimed water disinfection because it can satisfy both the total coliform inactivation and residual requirements.
Liquid sodium hypochlorite is often preferred for reclaimed water disinfection because of increasing safety concerns with handling and/or generation of gaseous chlorine and chlorine dioxide. A liquid sodium hypochlorite disinfection system is relatively simple, consisting of liquid chemical storage tanks, metering pumps, and chlorine residual analyzers coupled with feedback metering pump controls to ensure proper chlorine residual concentrations.
Other factors and assumptions considered in regard to disinfection systems for all strategies are as follows:
• Design of chlorine disinfection systems must, at a minimum, consider the maximum flow rate of the reclaimed water system and the anticipated chlorine demand of the treated reclaimed water so that a minimum residual level and appropriate disinfection contact times can be maintained.
• For potential wetland enhancement uses, dechlorination processes or other approaches to reduce chlorine residuals prior to application would likely be needed. Infrastructure for dechlorination could be based on tablet or liquid chemical feeder systems that use a dechlorinating agent such as ascorbic acid or calcium thiosulfate.
2.3.3 Distribution Systems Conceptual distribution systems for each strategy consist of pressure zones, pump stations, piping, and storage tanks:
• The potential uses were grouped by strategy area and further by location and service elevations into conceptual reclaimed water system pressure zones. Distribution pressure zone boundaries and hydraulic grade lines (HGLs) were established based on the service elevations to ensure appropriate system service pressures.
• Storage tanks were included to provide equalizing storage to meet peak-hour demand and provide hydraulic support for pressure zone HGLs and associated service pressures.
• Pump stations were defined that would meet estimated demands and support the service pressure requirements and HGLs in each pressure zone.
• Distribution pipeline alignments were based on serving the few reclaimed water uses that were used to define the strategies, and the pipes were sized to meet initial and future demands.
Working Draft 15
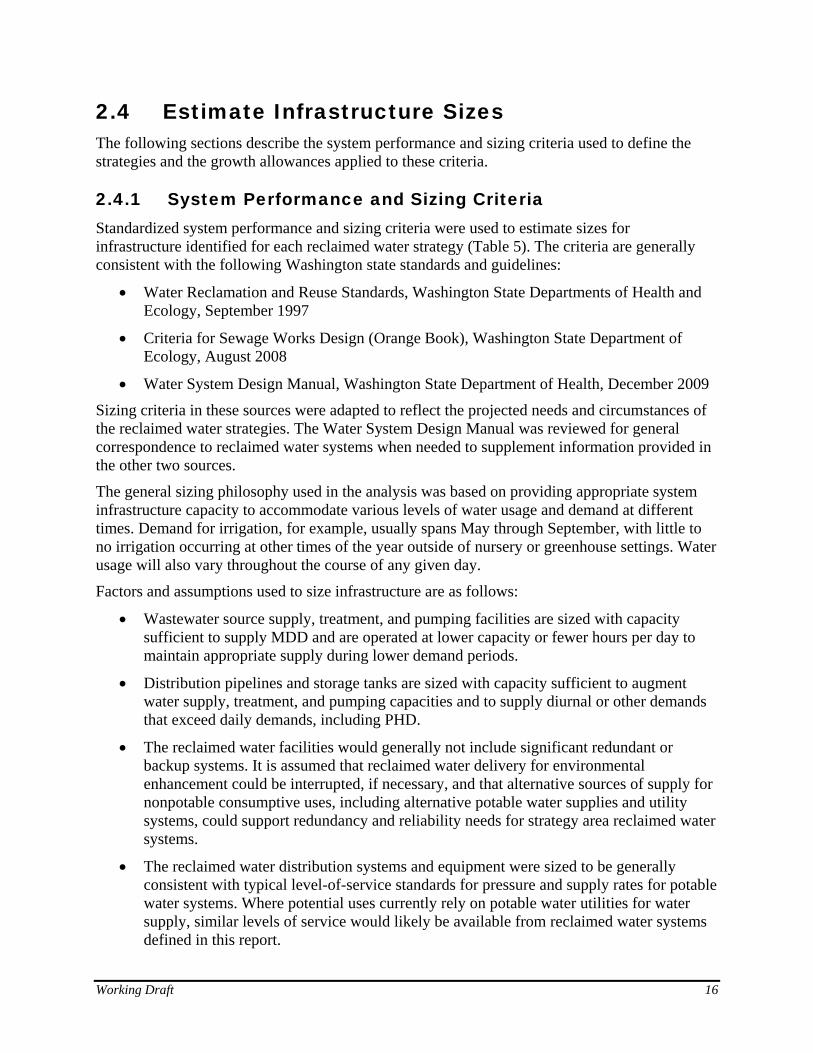
2.4 Estimate Infrastructure Sizes The following sections describe the system performance and sizing criteria used to define the strategies and the growth allowances applied to these criteria.
2.4.1 System Performance and Sizing Criteria Standardized system performance and sizing criteria were used to estimate sizes for infrastructure identified for each reclaimed water strategy (Table 5). The criteria are generally consistent with the following Washington state standards and guidelines:
• Water Reclamation and Reuse Standards, Washington State Departments of Health and Ecology, September 1997
• Criteria for Sewage Works Design (Orange Book), Washington State Department of Ecology, August 2008
• Water System Design Manual, Washington State Department of Health, December 2009
Sizing criteria in these sources were adapted to reflect the projected needs and circumstances of the reclaimed water strategies. The Water System Design Manual was reviewed for general correspondence to reclaimed water systems when needed to supplement information provided in the other two sources.
The general sizing philosophy used in the analysis was based on providing appropriate system infrastructure capacity to accommodate various levels of water usage and demand at different times. Demand for irrigation, for example, usually spans May through September, with little to no irrigation occurring at other times of the year outside of nursery or greenhouse settings. Water usage will also vary throughout the course of any given day.
Factors and assumptions used to size infrastructure are as follows:
• Wastewater source supply, treatment, and pumping facilities are sized with capacity sufficient to supply MDD and are operated at lower capacity or fewer hours per day to maintain appropriate supply during lower demand periods.
• Distribution pipelines and storage tanks are sized with capacity sufficient to augment water supply, treatment, and pumping capacities and to supply diurnal or other demands that exceed daily demands, including PHD.
• The reclaimed water facilities would generally not include significant redundant or backup systems. It is assumed that reclaimed water delivery for environmental enhancement could be interrupted, if necessary, and that alternative sources of supply for nonpotable consumptive uses, including alternative potable water supplies and utility systems, could support redundancy and reliability needs for strategy area reclaimed water systems.
• The reclaimed water distribution systems and equipment were sized to be generally consistent with typical level-of-service standards for pressure and supply rates for potable water systems. Where potential uses currently rely on potable water utilities for water supply, similar levels of service would likely be available from reclaimed water systems defined in this report.
Working Draft 16
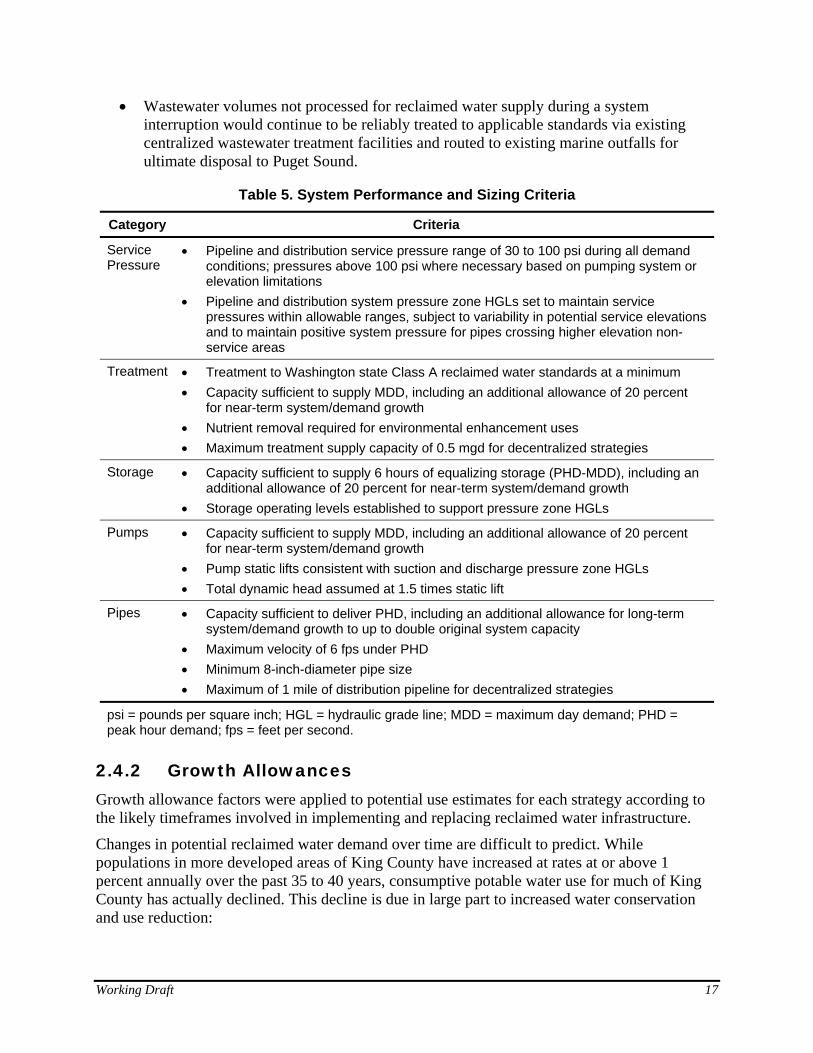
• Wastewater volumes not processed for reclaimed water supply during a system interruption would continue to be reliably treated to applicable standards via existing centralized wastewater treatment facilities and routed to existing marine outfalls for ultimate disposal to Puget Sound.
Table 5. System Performance and Sizing Criteria
Category Criteria
Service Pressure
• Pipeline and distribution service pressure range of 30 to 100 psi during all demand conditions; pressures above 100 psi where necessary based on pumping system or elevation limitations
• Pipeline and distribution system pressure zone HGLs set to maintain service pressures within allowable ranges, subject to variability in potential service elevations and to maintain positive system pressure for pipes crossing higher elevation non-service areas
Treatment • Treatment to Washington state Class A reclaimed water standards at a minimum • Capacity sufficient to supply MDD, including an additional allowance of 20 percent
for near-term system/demand growth • Nutrient removal required for environmental enhancement uses • Maximum treatment supply capacity of 0.5 mgd for decentralized strategies
Storage • Capacity sufficient to supply 6 hours of equalizing storage (PHD-MDD), including an additional allowance of 20 percent for near-term system/demand growth
• Storage operating levels established to support pressure zone HGLs
Pumps • Capacity sufficient to supply MDD, including an additional allowance of 20 percent for near-term system/demand growth
• Pump static lifts consistent with suction and discharge pressure zone HGLs • Total dynamic head assumed at 1.5 times static lift
Pipes • Capacity sufficient to deliver PHD, including an additional allowance for long-term system/demand growth to up to double original system capacity
• Maximum velocity of 6 fps under PHD • Minimum 8-inch-diameter pipe size • Maximum of 1 mile of distribution pipeline for decentralized strategies
psi = pounds per square inch; HGL = hydraulic grade line; MDD = maximum day demand; PHD = peak hour demand; fps = feet per second.
2.4.2 Growth Allowances Growth allowance factors were applied to potential use estimates for each strategy according to the likely timeframes involved in implementing and replacing reclaimed water infrastructure.
Changes in potential reclaimed water demand over time are difficult to predict. While populations in more developed areas of King County have increased at rates at or above 1 percent annually over the past 35 to 40 years, consumptive potable water use for much of King County has actually declined. This decline is due in large part to increased water conservation and use reduction:
Working Draft 17

• Low-flow fixtures are employed in both new construction and retrofit applications, water efficient appliances have become more commonplace and sought after, and less irrigation intensive landscaping is becoming the norm.
• Water conservation programs promoted by area potable water purveyors have enjoyed widespread success in reducing water use. Regional potable water demands have held steady or declined over the past 35 to 40 years despite sustained population growth. While growth and development factors may tend to push overall water demands upward, trends toward conservation and increasingly higher water supply costs tend to drive use downward.
To account for such effects, growth allowances were roughly based on an assumed 1 percent per year nominal growth in reclaimed water usage. It was assumed that treatment, storage, and pumping facilities would be sized to accommodate anticipated system needs for at least a 20-year lifecycle before replacement and that buried pipes would have a service life of 50 to 70 years. The resulting growth allowance factors are shown in Table 6.
Table 6. Growth Allowance Factors for Sizing Facilities
Facility Growth Allowance
Treatment plants, storage tanks, and pump stations 1.2
Pipes 2.0
2.5 Determine Operation and Maintenance Needs Operation of the reclaimed water strategy systems was assumed to be generally similar to operation of existing county reclaimed water systems and would be managed similarly to potable water delivery systems. Reclaimed water could be delivered by the County either directly on a retail basis or on a wholesale basis for retail distribution by other agencies.
General operation and maintenance (O&M) needs associated with the reclaimed water strategies are as follows:
• Staffing. Each of the reclaimed water strategies would require county staff to manage strategy design, implementation, and capital project construction; perform O&M; and conduct administrative, reporting, and recordkeeping tasks to comply with applicable regulations and manage the new systems. These efforts would likely scale proportionately to existing staff allocations in strategy areas.
• Materials. The reclaimed water strategies would involve additional costs for materials to maintain equipment and infrastructure, supply treatment and disinfection chemicals, perform laboratory analyses, and other needs. As with staffing, many of these additional costs would scale proportionately to existing operations.
• Energy demands. The reclaimed water strategies would impose additional energy demands for running equipment and for facility heating and lighting. The majority of these costs would be associated with aeration blowers and pumping. Modern energy efficient and sustainable approaches would be incorporated where appropriate to allow for efficient operations.
Working Draft 18

• Extent of ownership and responsibility. For nonpotable consumptive uses, reclaimed water utility infrastructure ownership was assumed to extend to each customer meter, with county responsibility limited to providing and maintaining defined levels of service for reclaimed water supply.
• Metering. Metering of reclaimed water use for customer billing purposes could be accomplished using potable water meters sized to accommodate estimated use demands. It was assumed that systems would likely be configured to employ automatic meter reading and accounting systems to facilitate management and billing of customer accounts on a routine basis.
2.6 Explore Other Resource Recovery Opportunities
The following sections describe nutrient and energy resource recovery opportunities that may be compatible with production and distribution of reclaimed water.
2.6.1 Nutrient Recovery Recovery of nitrogen or phosphate can be implemented as part of wastewater treatment processes to produce products that can be used or sold, such as fertilizer.
Nutrient recovery, however, would not be suitable for any of the strategy areas. None of the major flow streams considered for reclaimed water strategies (raw wastewater influent, secondary effluent, and tertiary effluent) have high enough concentrations of nitrogen or phosphorus to make nutrient recovery economical. To be cost-effective, nutrient recovery would require a wastewater stream that is at least 15 to 20 times more concentrated than untreated municipal wastewater, such as the waste/recycle streams from municipal wastewater biosolids dewatering processes.
2.6.2 Energy Recovery Implementation of reclaimed water strategies may also present opportunities for energy recovery, both in terms of potentially offsetting reclaimed water system energy consumption and providing renewable energy sources to surrounding properties. Two forms of energy recovery were investigated for implementation: hydroelectric and heat recovery.
As described below, the analysis found that the strategies were not suitable for hydroelectric energy recovery but that there may be potential benefits from heat recovery. More analyses would be necessary before including heat recovery as part of implementation of any strategy.
Hydroelectric Energy Recovery
This analysis investigated the use of small hydro-turbines and micro-hydro systems that convert the potential energy associated with falling water into electrical energy. Hydro-turbines can be very efficient, converting hydraulic energy into electrical energy at efficiencies between 60 and 90 percent. Assuming 70 percent turbine efficiency, 1 mgd of water falling 10 feet would produce approximately 1.2 kW of power, or just over 10 MWh of electrical energy each year. Larger turbines generally operate most efficiently.
Working Draft 19
The optimal application for hydro-turbines in wastewater handling is for treatment plant effluent because the turbine flows are generally free of solids and large drops in elevation and hydraulic energy can occur. Hydro-turbines should not be considered for raw wastewater systems because of the potential for clogging. In addition, the use of hydraulic energy capture should be avoided on pumped systems because the energy capture is offset by the power used to pressurize the flow.
Hydroelectric energy recovery provides no practical benefit for the reclaimed water strategies considered. There would be not be enough energy available in these systems for recovery because the reclaimed water produced would have to be pumped into the distribution system.
Heat Recovery
Although heat recovery was not included in the cost estimates for the reclaimed water strategies, it does have the potential to be used if strategies were implemented.
Because of economies of scale, heat recovery for centralized strategies would best be explored in the context of overall primary and secondary wastewater treatment. Treated effluent from wastewater treatment plants offers a convenient and reliable source of heat at any location and at a relatively high temperature (compared to surface water or groundwater). Effluent temperatures are above 50°F throughout the year for most wastewater plants. A number of heat pumps on the market can produce the hot water temperatures required for process and space heating at a wastewater treatment plant or for local district heating/cooling. Performance of heat pumps can vary, but typically for every 7,000 to 12,000 BTU/hr of heat produced, 1 kW of electricity is required. Generally, heat can be produced two to three times more efficiently than from direct electric heating.
Adding heat recovery to decentralized reclaimed water treatment would depend on the proximity of local end users who might pay for access to a reclaimed water flow. Identifying end users would be necessary before proceeding with heat recovery in any of the strategies considered. So far, only the Interbay Skimming Decentralized Strategy has an identified potential end user. Reclaimed water production for decentralized strategies is limited to 0.5 mgd. Assuming 5°F of heat extraction from the reclaimed water (50°F inlet, 45°F outlet), approximately 0.8 MMBTU/hr would be available for local end users. A heat pump of this size would require approximately 100 kW of electrical power to operate, and the capital costs involved in heat pump installation (no offsite piping included) could be on the order of $200,000.
2.7 Estimate Costs Capital and O&M costs were estimated for each approved strategy. This section summarizes the assumptions and values used to prepare the estimates.
2.7.1 Capital Costs Capital cost estimates were developed as follows:
• Treatment capital costs were developed as planning-level estimates, where project engineering and design concepts are at the 0 to 15 percent design concept level. Such estimates are typically developed to evaluate design alternatives where design and cost estimates can be further refined as planning and evaluation move forward.
Working Draft 20
• Pumping, storage, and piping capital costs were developed using King County Tabula 3.1 estimating software. Tabula 3.1 is a cost estimation tool intended for conceptual or feasibility studies or for projects at the 0 to 15 percent level of design. Construction costs are based, where possible, on unit costs, or cost curves, from completed conveyance system projects in the Pacific Northwest.
• Capital cost estimates include allied costs (design, permitting, construction management, administration) applied at a rate of 53.1 percent, but do not include siting or property acquisition costs nor allowances for contingency and markups.
• Construction costs include contractor overhead and profit.
• Onsite improvements necessary to deliver and supply reclaimed water from meters to individual customer sites, including additional onsite pumping and storage, would be the responsibility of each customer.
• Costs are in 2011 dollars.
• Expected accuracy for planning-level estimates ranges from −30 to +50 percent.
2.7.2 Operation and Maintenance Costs
Non-Labor
Estimated annual non-labor O&M costs for materials and energy were developed based on information provided by equipment vendors, pumping and air delivery energy estimates, and an annual upkeep allowance equivalent to 1 percent of capital construction costs, exclusive of allied costs.
Current electrical power costs for major King County facilities fall across a range of prices:
• $0.052/kWh from Snohomish County PUD at Brightwater
• $0.053 to $0.058/kWh from Seattle City Light at West Point and other Seattle area facilities
• $0.070 to $0.085/kWh from Puget Sound Energy at South plant
Energy demands for treatment and pumping were estimated consistent with the reclaimed water use projections for each strategy (including the 1.2 growth allowance) based on an assumed common electric power rate of $0.065/kWh. Future electric rates could deviate significantly from this assumed rate.
Labor
Estimated fulltime equivalents (FTEs) for operating and maintaining treatment facilities were identified based on estimates of labor for new treatment facilities. FTEs for operating and maintaining storage tanks, pump stations, and pipelines were based on WTD experience. The estimated FTEs and annual labor costs were derived from the following assumptions:
• Pump station = 0.5 hour per day
• Filter plant = 1 hour per day
Working Draft 21
• MBR plant = 2 hours per day
• Flushing station = 2 hours per week
• Dechlorination facility = 1 hour per day
• Pipeline = 2 hours per day
• Storage tank = 2 hours per week
• Travel time = 2.5 hours per workday per FTE
• Administration time = no hours included in estimate (administration assumed to be covered under centralized treatment plant annual costs)
• Hourly rate = $51.17
2.7.3 Construction Coordination It was assumed that implementation of the reclaimed water strategies would be completed as standalone projects. However, if the opportunities present themselves, it would be beneficial to coordinate capital project implementation with other utility and roadway improvement projects undertaken by the County, local cities, and other utilities.
In addition to providing for streamlined construction and reduced construction impacts to the public, such coordination could reduce implementation costs, especially for pipelines. Typical cost estimates suggest that the costs to install reclaimed water pipelines as part of other roadway or utility improvement projects could be 30 to 50 percent less than costs to install pipelines in roadways and traffic corridors as standalone projects. Similarly, the costs and economies of scale to implement additional reclaimed water treatment systems at Brightwater or South plant would be reduced if these improvements could be coordinated as part of other system upgrade and improvement projects.
2.8 Analyze Effects on Planned Conveyance and Treatment Improvements
The reclaimed water strategies could alter the wastewater flows in WTD’s conveyance system and treatment facilities such that they affect planned improvements to the regional wastewater system. To determine the effect of the reclaimed water strategies on existing plans to improve conveyance and treatment, the following were considered:
• Changes in amounts of flow to the conveyance system and treatment plants
• Types and timing of reclaimed water uses
• Additional treatment needs resulting from the reclaimed water strategies
Reclaimed water uses that are year-round and would not be discharged back to the conveyance or treatment system have the highest potential to alter planned treatment and conveyance system improvements. If reclaimed water is being used primarily for irrigation purposes during spring and summer, the amount of flow diverted for such uses is unlikely to affect capacity needs since maximum flows tend to occur in the winter months when there are more sizable rain events. If
Working Draft 22

reclaimed water is being used primarily for industrial and cooling uses, it is important to consider if potable water is being replaced or supplemented and to determine the amount of flow that would be discharged back to the conveyance system.
Some reclaimed water uses, such as wetland enhancement uses, may require additional treatment processes and result in alterations to planned process improvements at treatment plants.
Working Draft 23
3.0. REDMOND/BEAR CREEK BASIN BRIGHTWATER CENTRALIZED STRATEGY
The Redmond/Bear Creek Basin Brightwater Centralized Strategy focuses on expanding reclaimed water service in the vicinity of the Brightwater Treatment Plant, including areas in and around the Cities of Woodinville and Redmond. This chapter gives an overview of the strategy, followed by sections that describe conceptual treatment, disinfection, and distribution systems; O&M needs; planning-level cost and footprint estimates; implementation phasing and construction coordination opportunities; and effects of the strategy on planned conveyance and treatment improvements.
3.1 Strategy Overview This strategy would rely largely on MBR wastewater treatment and Class A reclaimed water production processes already in place at the Brightwater Treatment Plant, located adjacent to Highway 522 and north of Woodinville. The area to be served by the strategy is divided into two subareas near the South Segment of the Brightwater reclaimed water pipeline. One subarea surrounds the plant site; the other subarea is farther south at the north end of Lake Sammamish. Figure 2 shows the two subareas.
Thirty-one potential reclaimed water uses were identified in the strategy area. Nonpotable consumptive uses include landscape and agricultural irrigation, industrial process, and industrial cooling applications. The strategy also includes three wetland enhancement uses. In addition to MBR treatment, nutrient removal processes designed to remove both nitrogen and phosphorus would be required to provide reclaimed water to these enhancement areas.
Four conceptual pressure zones were developed to provide service pressures, as shown in Figure 2. A storage tank would be installed in each zone. Reclaimed water would be distributed via three pump stations and 15.4 miles of new distribution pipeline. The three pressure zones near Brightwater would be served with pipes leading directly from the pump station near the plant. Pipes extending from the existing South Segment of the Brightwater reclaimed water pipeline would serve the Lake Sammamish Zone. Capacity exists in the South Segment to supply approximately 7 mgd to the Lake Sammamish Zone, which exceeds reclaimed water demands estimated for that zone.
The commercial/light industrial nature of areas adjacent to Brightwater could make implementation of heat recovery for district heating attractive for area development. However, because Brightwater effluent is already suitable for heat recovery applications, heat recovery and district heating implementation from Brightwater would not depend on reclaimed water strategy development.
Estimated capital cost for this strategy is $127 million; estimated annual O&M cost is $2 million.
Working Draft 24
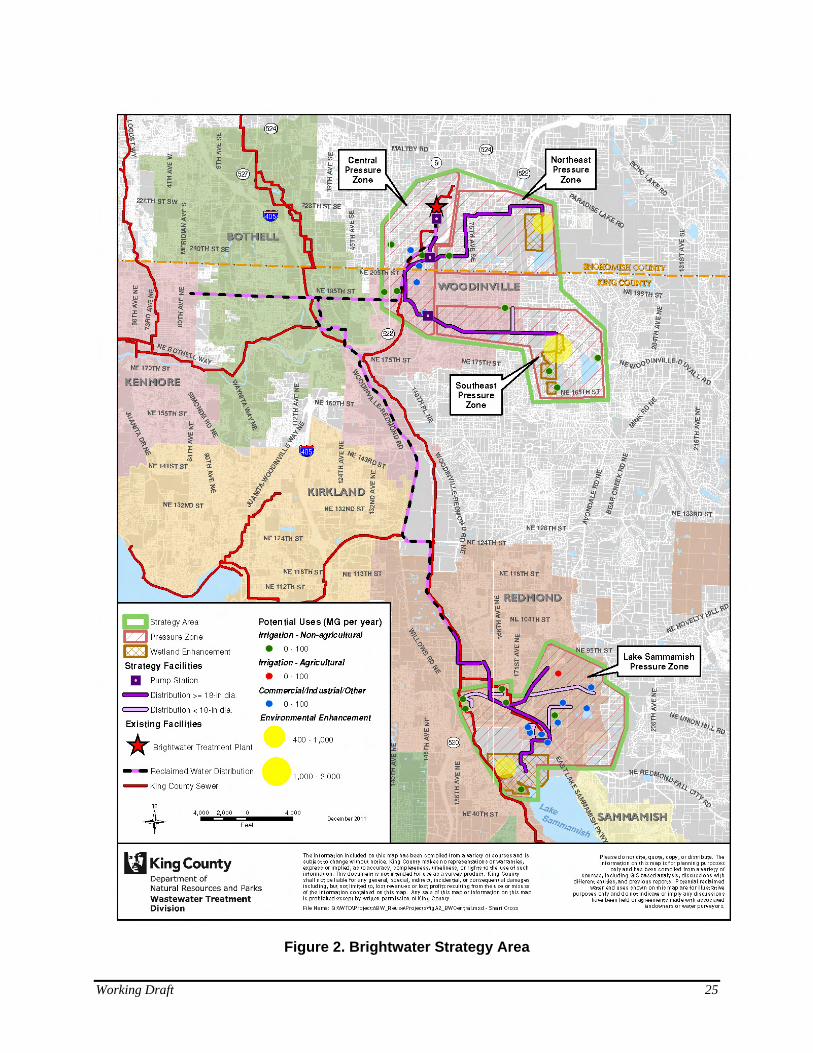
Figure 2. Brightwater Strategy Area
Working Draft 25
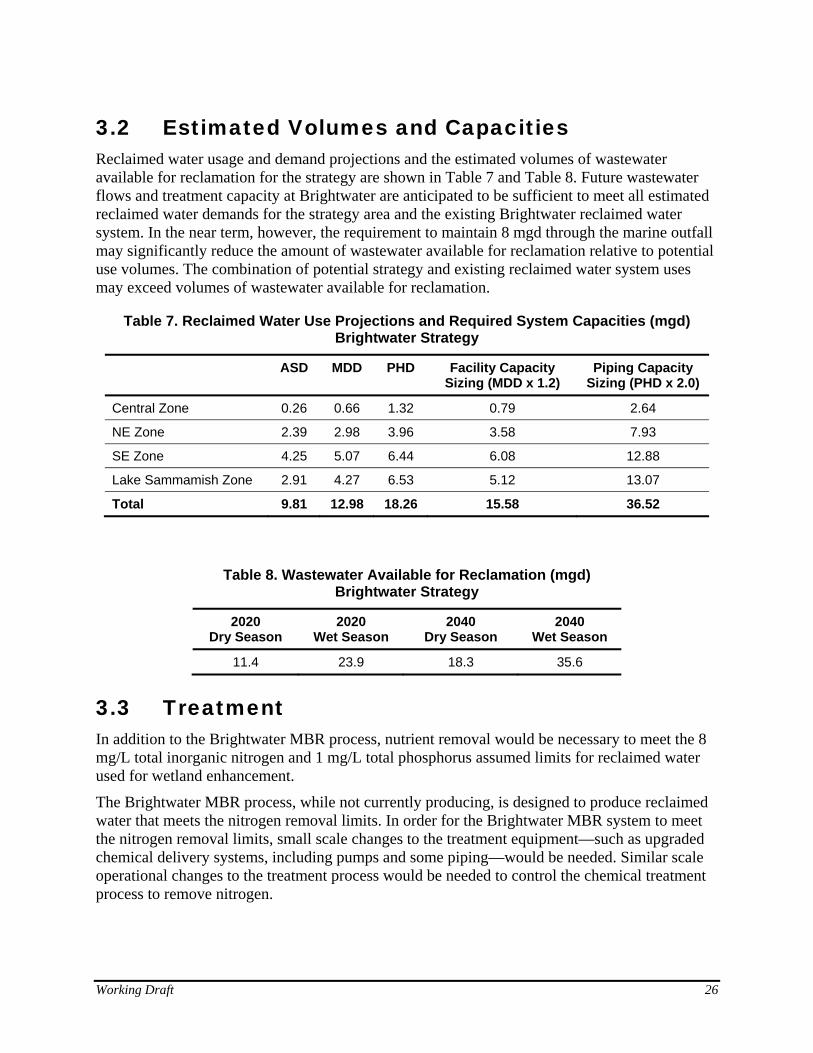
3.2 Estimated Volumes and Capacities Reclaimed water usage and demand projections and the estimated volumes of wastewater available for reclamation for the strategy are shown in Table 7 and Table 8. Future wastewater flows and treatment capacity at Brightwater are anticipated to be sufficient to meet all estimated reclaimed water demands for the strategy area and the existing Brightwater reclaimed water system. In the near term, however, the requirement to maintain 8 mgd through the marine outfall may significantly reduce the amount of wastewater available for reclamation relative to potential use volumes. The combination of potential strategy and existing reclaimed water system uses may exceed volumes of wastewater available for reclamation.
Table 7. Reclaimed Water Use Projections and Required System Capacities (mgd) Brightwater Strategy
ASD MDD PHD Facility Capacity Sizing (MDD x 1.2)
Piping Capacity Sizing (PHD x 2.0)
Central Zone 0.26 0.66 1.32 0.79 2.64
NE Zone 2.39 2.98 3.96 3.58 7.93
SE Zone 4.25 5.07 6.44 6.08 12.88
Lake Sammamish Zone 2.91 4.27 6.53 5.12 13.07
Total 9.81 12.98 18.26 15.58 36.52
Table 8. Wastewater Available for Reclamation (mgd) Brightwater Strategy
2020 Dry Season
2020 Wet Season
2040 Dry Season
2040 Wet Season
11.4 23.9 18.3 35.6
3.3 Treatment In addition to the Brightwater MBR process, nutrient removal would be necessary to meet the 8 mg/L total inorganic nitrogen and 1 mg/L total phosphorus assumed limits for reclaimed water used for wetland enhancement.
The Brightwater MBR process, while not currently producing, is designed to produce reclaimed water that meets the nitrogen removal limits. In order for the Brightwater MBR system to meet the nitrogen removal limits, small scale changes to the treatment equipment—such as upgraded chemical delivery systems, including pumps and some piping—would be needed. Similar scale operational changes to the treatment process would be needed to control the chemical treatment process to remove nitrogen.
Working Draft 26
Phosphorus removal would be added as a tertiary treatment process downstream of the Brightwater MBR systems at the Brightwater site. The site includes several suitable locations for such facilities.
Tertiary phosphorus removal is most easily accomplished using chemical precipitation technologies. Numerous chemical systems are available, including package systems in modular, expandable form. These systems include a continuous backwashing sand filter that uses ferric chloride for phosphorus precipitation and contains hydrous ferric oxide−coated sand to help improve phosphorus adsorption and removal. The filters are sized based on influent flow rate, influent total phosphorus concentration, and target effluent phosphorus concentration. The backwash water can be recycled to the headworks of the Brightwater Treatment Plant for treatment and disposal.
All Brightwater reclaimed water flows would receive phosphorus nutrient removal treatment under this strategy because reclaimed water delivered for wetland enhancement uses would be delivered to nonpotable consumptive uses in the strategy area along with reclaimed water intended for the existing Brightwater reclaimed water system. An overall peak nutrient removal treatment capacity of 25 mgd would support estimated Brightwater reclaimed water uses, including approximately 13 mgd for the strategy area and 12 mgd for the existing Brightwater reclaimed water system. Nutrient removal could be phased in as environmental enhancement uses are developed in order to manage the costs of this additional treatment.
3.4 Disinfection Chlorination facilities were sized for the estimated 15.6-mgd MDD of the strategy area only. Systems are already in place to provide disinfection for existing Brightwater reclaimed water system flows.
Assuming a maximum hypochlorite dose of 5 mg/L as free chlorine and 12 percent strength hypochlorite solution, disinfection facilities to meet the peak estimated treatment capacity would provide an estimated chemical delivery capacity of approximately 800 gpd. To maintain a recommended minimum of one week storage of hypochlorite, a 6,000-gallon storage facility would be needed.
Although a minimum chlorine contact time of 30 minutes at a chlorine residual level of 1 mg/L or greater is required, a 1-hour contact time is appropriate for tank sizing to compensate for typical hydraulic inefficiencies. A chlorine contact tank volume of approximately 0.65 MG is needed to achieve this contact time under identified reclaimed water strategy flow rates and treatment capacity.
Rather than installing a disinfection system to accommodate the strategy, hypochlorite disinfection systems for Brightwater’s existing reclaimed water system could be expanded. Additional sodium hypochlorite metering pumps, pipe systems, and chlorine contact volume would likely be required. The design, layout, operation, and capacity requirements for the existing hypochlorite system would need to be examined in more detail when actual projects are considered to determine if there is sufficient capacity in the existing system to accommodate the peak demands of the reclaimed water strategy area without impacting minimum operational requirements for the existing system.
Working Draft 27
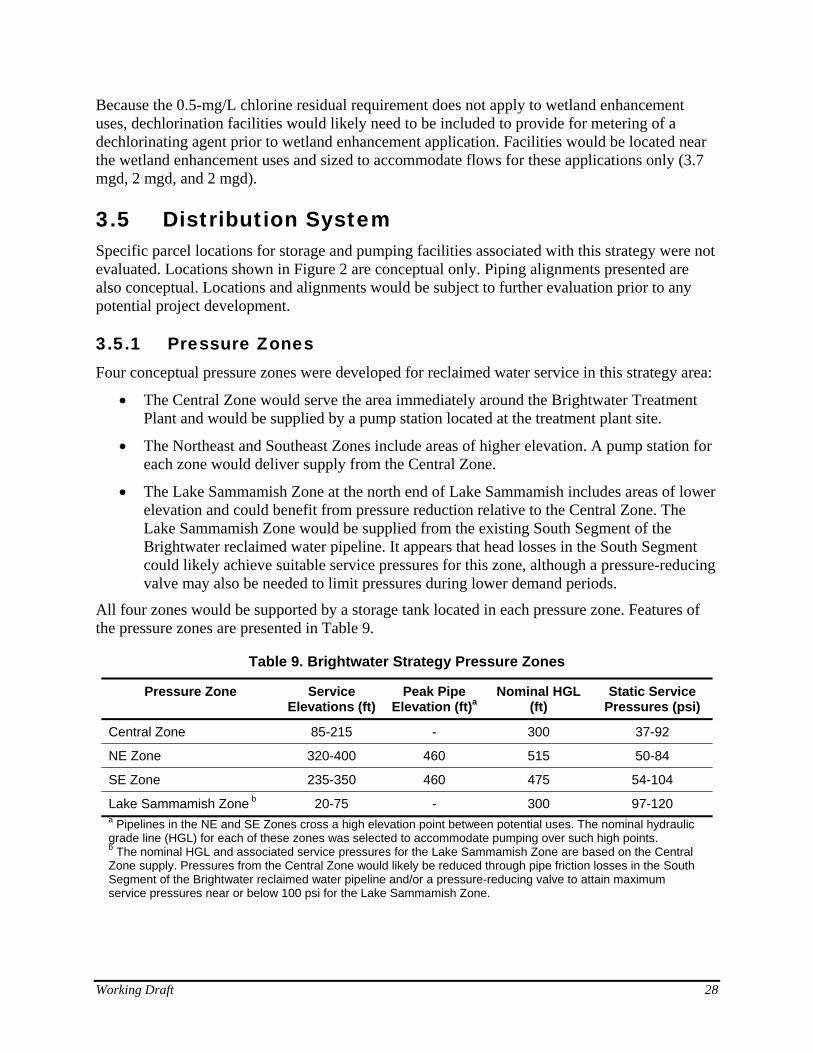
Because the 0.5-mg/L chlorine residual requirement does not apply to wetland enhancement uses, dechlorination facilities would likely need to be included to provide for metering of a dechlorinating agent prior to wetland enhancement application. Facilities would be located near the wetland enhancement uses and sized to accommodate flows for these applications only (3.7 mgd, 2 mgd, and 2 mgd).
3.5 Distribution System Specific parcel locations for storage and pumping facilities associated with this strategy were not evaluated. Locations shown in Figure 2 are conceptual only. Piping alignments presented are also conceptual. Locations and alignments would be subject to further evaluation prior to any potential project development.
3.5.1 Pressure Zones Four conceptual pressure zones were developed for reclaimed water service in this strategy area:
• The Central Zone would serve the area immediately around the Brightwater Treatment Plant and would be supplied by a pump station located at the treatment plant site.
• The Northeast and Southeast Zones include areas of higher elevation. A pump station for each zone would deliver supply from the Central Zone.
• The Lake Sammamish Zone at the north end of Lake Sammamish includes areas of lower elevation and could benefit from pressure reduction relative to the Central Zone. The Lake Sammamish Zone would be supplied from the existing South Segment of the Brightwater reclaimed water pipeline. It appears that head losses in the South Segment could likely achieve suitable service pressures for this zone, although a pressure-reducing valve may also be needed to limit pressures during lower demand periods.
All four zones would be supported by a storage tank located in each pressure zone. Features of the pressure zones are presented in Table 9.
Table 9. Brightwater Strategy Pressure Zones
Pressure Zone Service Elevations (ft)
Peak Pipe Elevation (ft)a
Nominal HGL (ft)
Static Service Pressures (psi)
Central Zone 85-215 - 300 37-92
NE Zone 320-400 460 515 50-84
SE Zone 235-350 460 475 54-104
Lake Sammamish Zone b 20-75 - 300 97-120 a Pipelines in the NE and SE Zones cross a high elevation point between potential uses. The nominal hydraulic grade line (HGL) for each of these zones was selected to accommodate pumping over such high points. b The nominal HGL and associated service pressures for the Lake Sammamish Zone are based on the Central Zone supply. Pressures from the Central Zone would likely be reduced through pipe friction losses in the South Segment of the Brightwater reclaimed water pipeline and/or a pressure-reducing valve to attain maximum service pressures near or below 100 psi for the Lake Sammamish Zone.
Working Draft 28
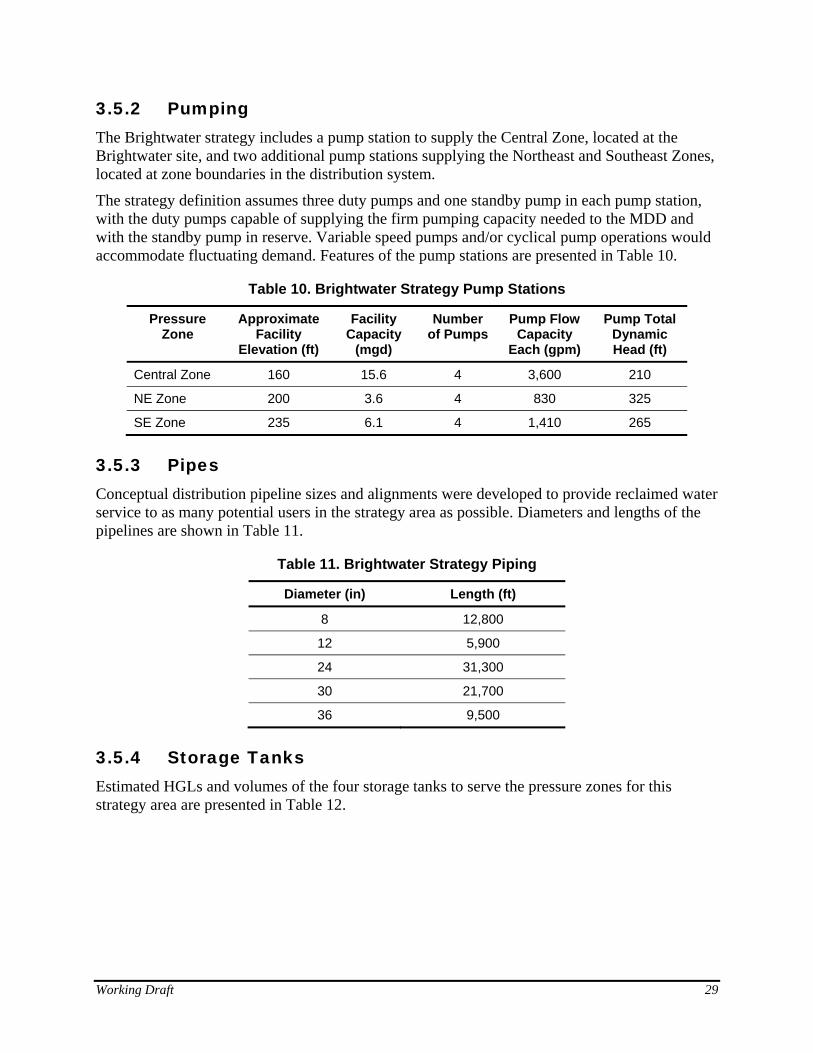
3.5.2 Pumping The Brightwater strategy includes a pump station to supply the Central Zone, located at the Brightwater site, and two additional pump stations supplying the Northeast and Southeast Zones, located at zone boundaries in the distribution system.
The strategy definition assumes three duty pumps and one standby pump in each pump station, with the duty pumps capable of supplying the firm pumping capacity needed to the MDD and with the standby pump in reserve. Variable speed pumps and/or cyclical pump operations would accommodate fluctuating demand. Features of the pump stations are presented in Table 10.
Table 10. Brightwater Strategy Pump Stations
Pressure Zone
Approximate Facility
Elevation (ft)
Facility Capacity
(mgd)
Number of Pumps
Pump Flow Capacity
Each (gpm)
Pump Total Dynamic Head (ft)
Central Zone 160 15.6 4 3,600 210
NE Zone 200 3.6 4 830 325
SE Zone 235 6.1 4 1,410 265
3.5.3 Pipes Conceptual distribution pipeline sizes and alignments were developed to provide reclaimed water service to as many potential users in the strategy area as possible. Diameters and lengths of the pipelines are shown in Table 11.
Table 11. Brightwater Strategy Piping
Diameter (in) Length (ft)
8 12,800
12 5,900
24 31,300
30 21,700
36 9,500
3.5.4 Storage Tanks Estimated HGLs and volumes of the four storage tanks to serve the pressure zones for this strategy area are presented in Table 12.
Working Draft 29
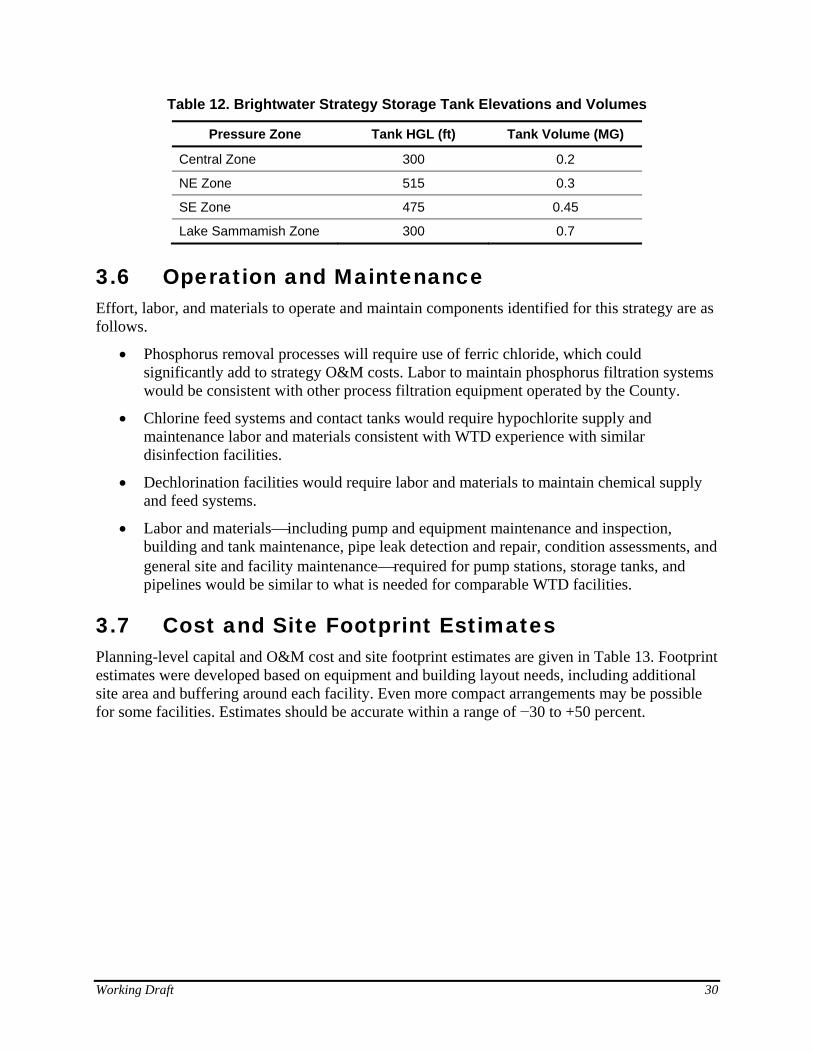
Table 12. Brightwater Strategy Storage Tank Elevations and Volumes
Pressure Zone Tank HGL (ft) Tank Volume (MG)
Central Zone 300 0.2
NE Zone 515 0.3
SE Zone 475 0.45
Lake Sammamish Zone 300 0.7
3.6 Operation and Maintenance Effort, labor, and materials to operate and maintain components identified for this strategy are as follows.
• Phosphorus removal processes will require use of ferric chloride, which could significantly add to strategy O&M costs. Labor to maintain phosphorus filtration systems would be consistent with other process filtration equipment operated by the County.
• Chlorine feed systems and contact tanks would require hypochlorite supply and maintenance labor and materials consistent with WTD experience with similar disinfection facilities.
• Dechlorination facilities would require labor and materials to maintain chemical supply and feed systems.
• Labor and materials⎯including pump and equipment maintenance and inspection, building and tank maintenance, pipe leak detection and repair, condition assessments, and general site and facility maintenance⎯required for pump stations, storage tanks, and pipelines would be similar to what is needed for comparable WTD facilities.
3.7 Cost and Site Footprint Estimates Planning-level capital and O&M cost and site footprint estimates are given in Table 13. Footprint estimates were developed based on equipment and building layout needs, including additional site area and buffering around each facility. Even more compact arrangements may be possible for some facilities. Estimates should be accurate within a range of −30 to +50 percent.
Working Draft 30
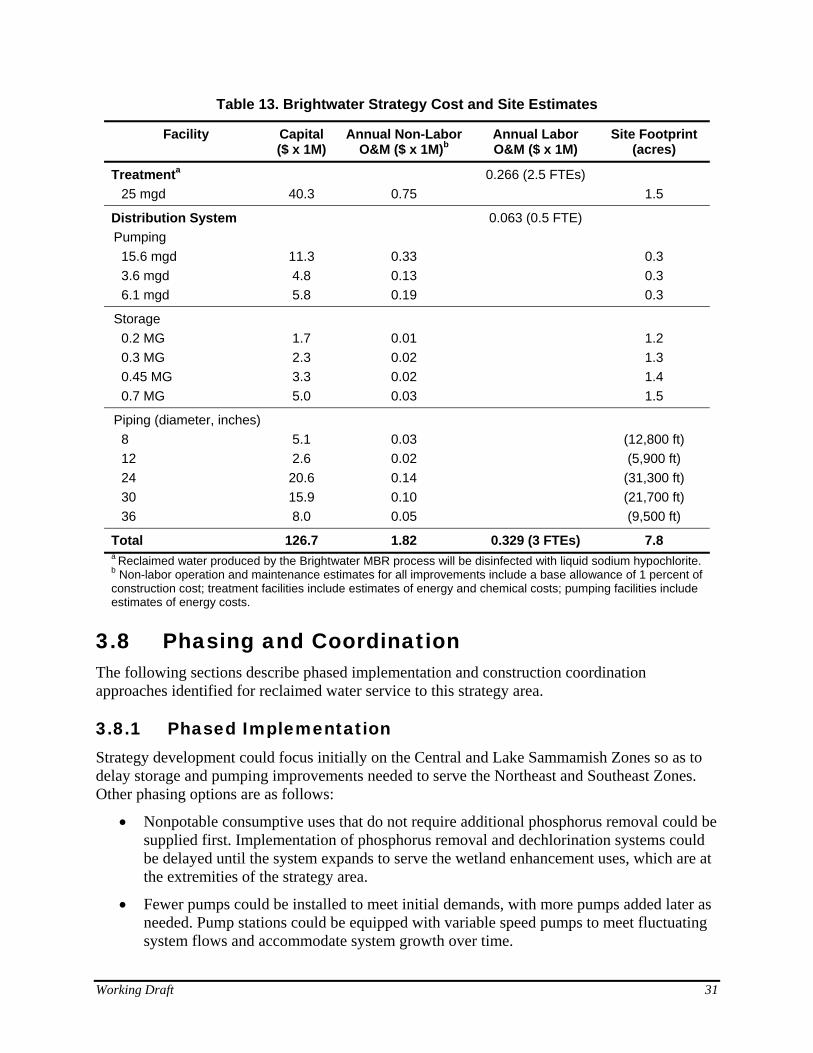
Table 13. Brightwater Strategy Cost and Site Estimates
Facility Capital ($ x 1M)
Annual Non-Labor O&M ($ x 1M)b
Annual Labor O&M ($ x 1M)
Site Footprint (acres)
Treatmenta 25 mgd
40.3
0.75
0.266 (2.5 FTEs) 1.5
Distribution System Pumping
15.6 mgd 3.6 mgd 6.1 mgd
11.3 4.8 5.8
0.33 0.13 0.19
0.063 (0.5 FTE)
0.3 0.3 0.3
Storage 0.2 MG 0.3 MG 0.45 MG 0.7 MG
1.7 2.3 3.3 5.0
0.01 0.02 0.02 0.03
1.2 1.3 1.4 1.5
Piping (diameter, inches) 8 12 24 30 36
5.1 2.6 20.6 15.9 8.0
0.03 0.02 0.14 0.10 0.05
(12,800 ft) (5,900 ft)
(31,300 ft) (21,700 ft) (9,500 ft)
Total 126.7 1.82 0.329 (3 FTEs) 7.8 a Reclaimed water produced by the Brightwater MBR process will be disinfected with liquid sodium hypochlorite. b Non-labor operation and maintenance estimates for all improvements include a base allowance of 1 percent of construction cost; treatment facilities include estimates of energy and chemical costs; pumping facilities include estimates of energy costs.
3.8 Phasing and Coordination The following sections describe phased implementation and construction coordination approaches identified for reclaimed water service to this strategy area.
3.8.1 Phased Implementation Strategy development could focus initially on the Central and Lake Sammamish Zones so as to delay storage and pumping improvements needed to serve the Northeast and Southeast Zones. Other phasing options are as follows:
• Nonpotable consumptive uses that do not require additional phosphorus removal could be supplied first. Implementation of phosphorus removal and dechlorination systems could be delayed until the system expands to serve the wetland enhancement uses, which are at the extremities of the strategy area.
• Fewer pumps could be installed to meet initial demands, with more pumps added later as needed. Pump stations could be equipped with variable speed pumps to meet fluctuating system flows and accommodate system growth over time.
Working Draft 31
• Other system growth needs, including storage capacity, could be accommodated as needed on an incremental basis.
3.8.2 Construction Coordination The strategy area consists mostly of lower density suburban and semi-rural areas. Utility corridors may be less densely filled than in more developed urban areas, and a variety of alternative locations and corridors may be available for identified facilities and pipelines. To the extent possible, future construction of reclaimed water improvements would benefit from coordination with other King County, City of Woodinville, and City of Redmond roadway/utility improvement projects in the area.
3.9 Effects on Planned Conveyance and Treatment Improvements
Because the Brightwater effluent pipeline and outfall have been designed to meet the projected 20-year peak-flow storm at full build-out, the Brightwater strategy would not affect future capacity needs of the pipeline. Depending on the timing of the strategy, availability of flows to accommodate this strategy could be a consideration. The Brightwater strategy would initially divert an estimated 9.8 mgd of flow from the Brightwater effluent pipeline. This amount would be in addition to the 7 mgd of reclaimed water that will be available from the South Segment of the Brightwater Reclaimed Water Pipeline in 2013 as part of the County’s existing reclaimed water program.
The strategy could affect the treatment process at the Brightwater plant because additional tertiary nutrient removal processes for phosphorus and possibly nitrogen may be required to provide reclaimed water for wetland enhancement purposes. At this time, there are no future plans to add treatment processes at the Brightwater Treatment Plant.
Working Draft 32

Working Draft 33
4.0. RENTON/TUKWILA SOUTH PLANT CENTRALIZED STRATEGY
The Renton/Tukwila South Plant Centralized Strategy focuses on expanding reclaimed water service in the vicinity of the South Treatment Plant, including areas in and around the Cities of Renton and Tukwila. This chapter gives an overview of the strategy, followed by sections that describe conceptual treatment, disinfection, and distribution systems; O&M needs; planning-level cost and footprint estimates; implementation phasing and construction coordination opportunities; and effects of the strategy on planned conveyance and treatment improvements.
4.1 Strategy Overview This strategy would rely on the tertiary sand filtration system and other Class A reclaimed water production processes at the South Treatment Plant, located next to Interstate 405 in Renton. Expansion of the existing 1.3-mgd tertiary treatment facility on the plant site would be required to support strategy development. The areas to be served by the strategy are primarily to the south, east, and northeast of the treatment plant, as shown in Figure 3.
Forty-three potential reclaimed water uses were identified in the strategy area. Nonpotable consumptive uses include landscape irrigation, industrial process, and industrial cooling applications. One constructed beneficial use wetland application area was also identified. Due to the net increase in environmental function derived as a result of creating wetland by discharging reclaimed water, it is assumed that nutrient removal will not be required under current Washington state regulations.
One pressure zone was established to provide service pressures. A storage tank would be installed in this pressure zone. Reclaimed water would be distributed via a pump station located at the South plant site and 16.3 miles of distribution pipeline.
The commercial/industrial nature of areas around the South plant could make implementation of heat recovery for district heating attractive for area development. However, because South plant effluent is already suitable for heat recovery applications, heat recovery and district heating implementation in the area would not depend on reclaimed water strategy development.
Estimated capital cost for this strategy is $70 million; estimated annual O&M cost is $0.8 million.
4.2 Estimated Volumes and Capacities Estimated reclaimed water use volumes, capacity sizing, and wastewater volumes available for reclamation are shown in Table 14 and Table 15. Existing wastewater flows and treatment capacity at South plant should be sufficient to provide treated secondary effluent to meet all estimated reclaimed water demands both for the strategy area the existing South plant reclaimed water system.
Working Draft 34
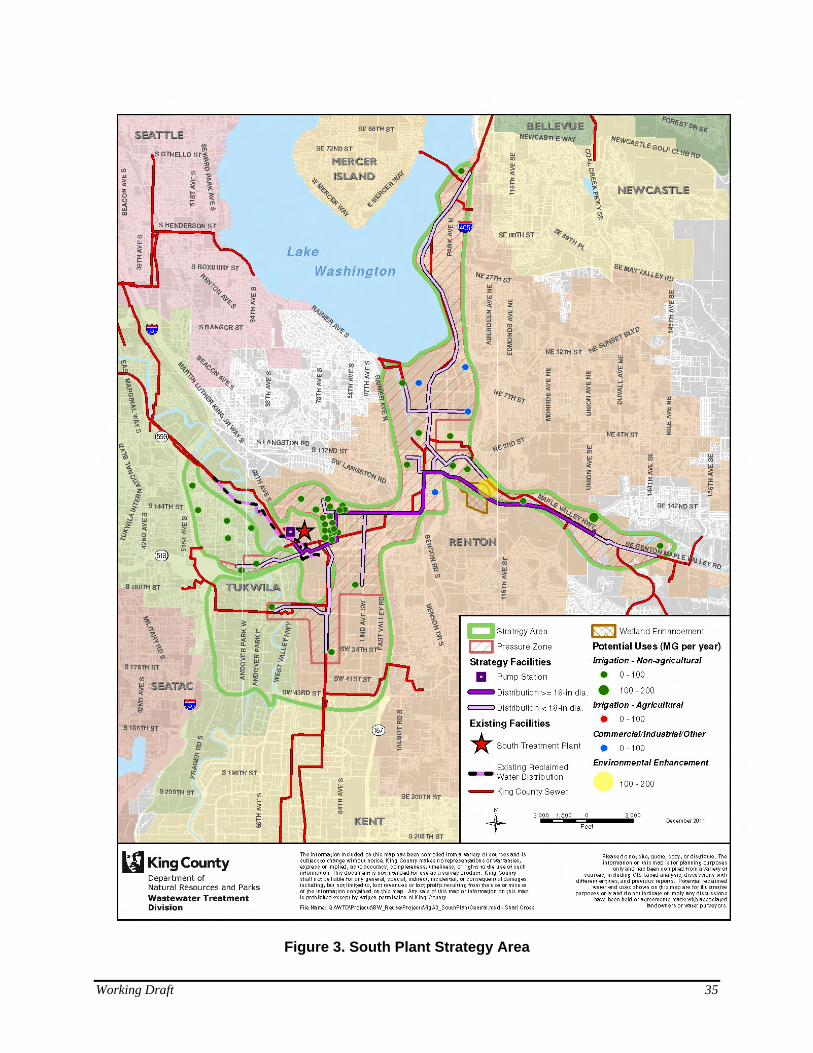
Figure 3. South Plant Strategy Area
Working Draft 35

Working Draft 36
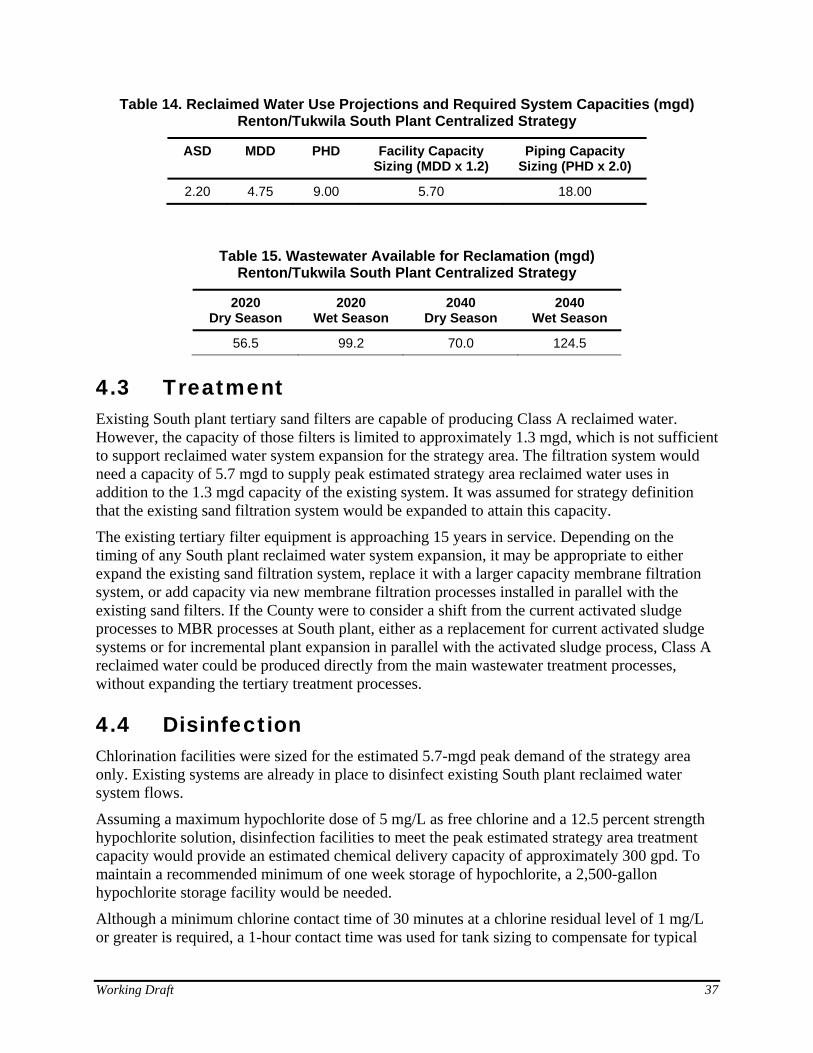
Table 14. Reclaimed Water Use Projections and Required System Capacities (mgd) Renton/Tukwila South Plant Centralized Strategy
ASD MDD PHD Facility Capacity Sizing (MDD x 1.2)
Piping Capacity Sizing (PHD x 2.0)
2.20 4.75 9.00 5.70 18.00
Table 15. Wastewater Available for Reclamation (mgd) Renton/Tukwila South Plant Centralized Strategy
2020 Dry Season
2020 Wet Season
2040 Dry Season
2040 Wet Season
56.5 99.2 70.0 124.5
4.3 Treatment Existing South plant tertiary sand filters are capable of producing Class A reclaimed water. However, the capacity of those filters is limited to approximately 1.3 mgd, which is not sufficient to support reclaimed water system expansion for the strategy area. The filtration system would need a capacity of 5.7 mgd to supply peak estimated strategy area reclaimed water uses in addition to the 1.3 mgd capacity of the existing system. It was assumed for strategy definition that the existing sand filtration system would be expanded to attain this capacity.
The existing tertiary filter equipment is approaching 15 years in service. Depending on the timing of any South plant reclaimed water system expansion, it may be appropriate to either expand the existing sand filtration system, replace it with a larger capacity membrane filtration system, or add capacity via new membrane filtration processes installed in parallel with the existing sand filters. If the County were to consider a shift from the current activated sludge processes to MBR processes at South plant, either as a replacement for current activated sludge systems or for incremental plant expansion in parallel with the activated sludge process, Class A reclaimed water could be produced directly from the main wastewater treatment processes, without expanding the tertiary treatment processes.
4.4 Disinfection Chlorination facilities were sized for the estimated 5.7-mgd peak demand of the strategy area only. Existing systems are already in place to disinfect existing South plant reclaimed water system flows.
Assuming a maximum hypochlorite dose of 5 mg/L as free chlorine and a 12.5 percent strength hypochlorite solution, disinfection facilities to meet the peak estimated strategy area treatment capacity would provide an estimated chemical delivery capacity of approximately 300 gpd. To maintain a recommended minimum of one week storage of hypochlorite, a 2,500-gallon hypochlorite storage facility would be needed.
Although a minimum chlorine contact time of 30 minutes at a chlorine residual level of 1 mg/L or greater is required, a 1-hour contact time was used for tank sizing to compensate for typical
Working Draft 37

hydraulic inefficiencies. A chlorine contact tank volume of approximately 0.24 MG is needed to achieve this contact time under identified reclaimed water strategy flow rates and treatment capacity.
Rather than installing a new disinfection system for the strategy, the existing disinfection systems at South plant could be expanded. Additional chemical metering, delivery piping, and chlorine contact volume would likely be required. This option would need to be studied in greater detail to determine if there is sufficient capacity in the existing South plant systems to accommodate the peak demands of the reclaimed water strategy area without impacting performance and delivery.
4.5 Distribution System Specific parcel locations for storage and pumping facilities associated with this strategy were not evaluated. Locations shown in Figure 3 are conceptual only. The pipe alignments presented are also conceptual. Locations and alignments would be subject to further evaluation prior to any potential project development.
4.5.1 Pressure Zone Topography in the South plant strategy area is suitable for reclaimed water service from a single common central pressure zone. A small area inside the strategy area to the southwest of South plant was excluded from the strategy because the high elevations would have required a second higher pressure zone. The low potential use estimates for this small area do not appear to justify construction of facilities to serve an independent pressure zone.
Features of the Central Zone are shown in Table 16.
Table 16. Central Pressure Zone South Plant Centralized Strategy
Service Elevations (ft)
Nominal HGL (ft)
Static Service Pressures (psi)
13−160 245 37−100
4.5.2 Pumping The South plant strategy area includes a single pump station located at South plant to supply the Central Zone. The strategy definition assumes three duty pumps and one standby pump, with the duty pumps capable of supplying the firm pumping capacity needed to supply the MDD and with the standby pump in reserve. Variable speed pumps and/or cyclical pump operations would accommodate fluctuating demand. Features of the pump station are presented in Table 17.
Working Draft 38
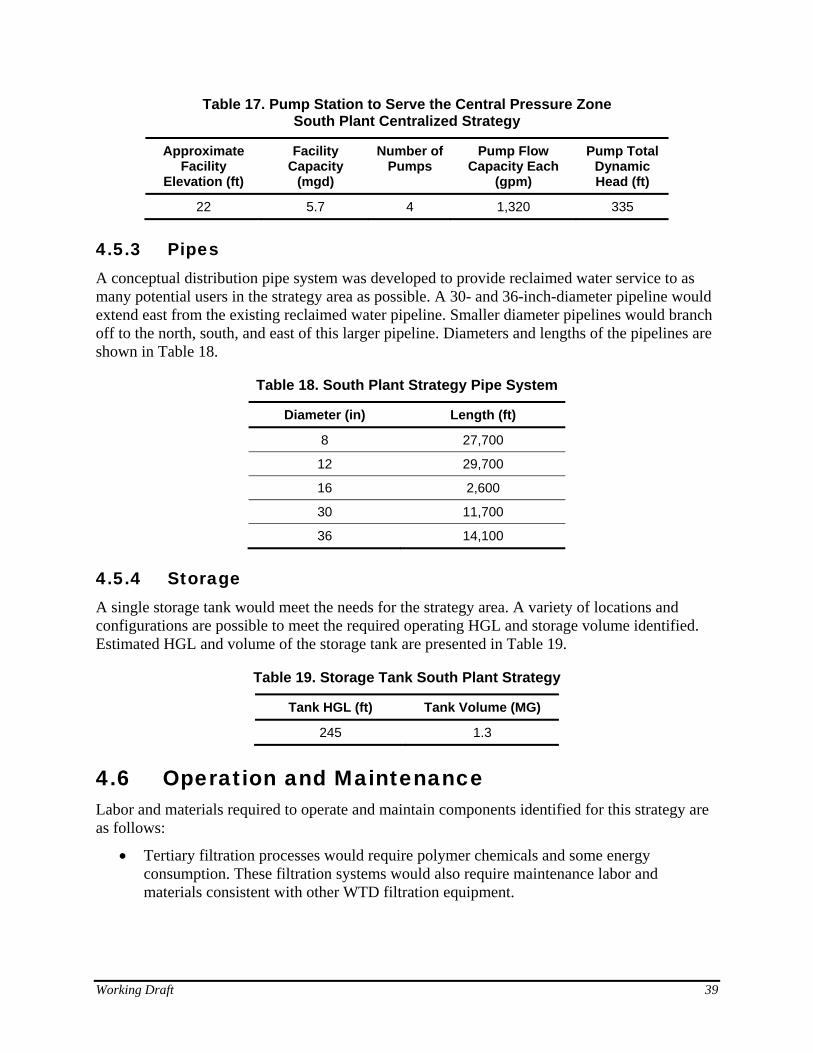
Table 17. Pump Station to Serve the Central Pressure Zone South Plant Centralized Strategy
Approximate Facility
Elevation (ft)
Facility Capacity
(mgd)
Number of Pumps
Pump Flow Capacity Each
(gpm)
Pump Total Dynamic Head (ft)
22 5.7 4 1,320 335
4.5.3 Pipes A conceptual distribution pipe system was developed to provide reclaimed water service to as many potential users in the strategy area as possible. A 30- and 36-inch-diameter pipeline would extend east from the existing reclaimed water pipeline. Smaller diameter pipelines would branch off to the north, south, and east of this larger pipeline. Diameters and lengths of the pipelines are shown in Table 18.
Table 18. South Plant Strategy Pipe System
Diameter (in) Length (ft)
8 27,700
12 29,700
16 2,600
30 11,700
36 14,100
4.5.4 Storage A single storage tank would meet the needs for the strategy area. A variety of locations and configurations are possible to meet the required operating HGL and storage volume identified. Estimated HGL and volume of the storage tank are presented in Table 19.
Table 19. Storage Tank South Plant Strategy
Tank HGL (ft) Tank Volume (MG)
245 1.3
4.6 Operation and Maintenance Labor and materials required to operate and maintain components identified for this strategy are as follows:
• Tertiary filtration processes would require polymer chemicals and some energy consumption. These filtration systems would also require maintenance labor and materials consistent with other WTD filtration equipment.
Working Draft 39
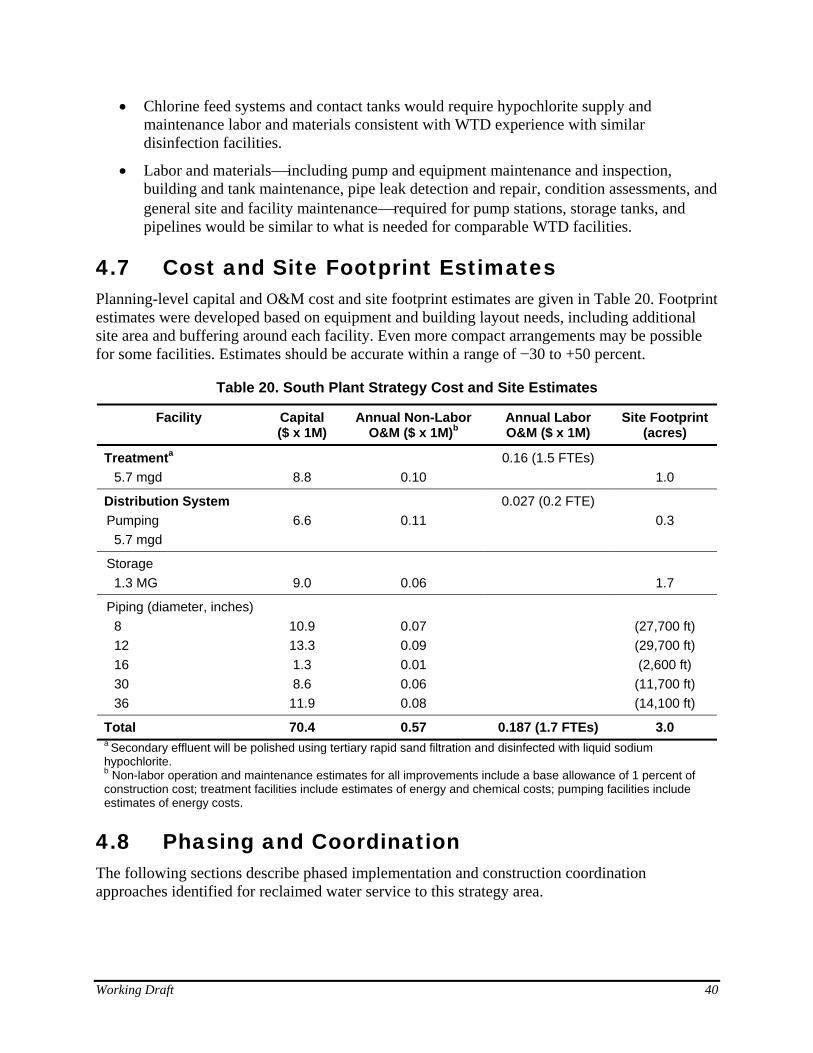
• Chlorine feed systems and contact tanks would require hypochlorite supply and maintenance labor and materials consistent with WTD experience with similar disinfection facilities.
• Labor and materials⎯including pump and equipment maintenance and inspection, building and tank maintenance, pipe leak detection and repair, condition assessments, and general site and facility maintenance⎯required for pump stations, storage tanks, and pipelines would be similar to what is needed for comparable WTD facilities.
4.7 Cost and Site Footprint Estimates Planning-level capital and O&M cost and site footprint estimates are given in Table 20. Footprint estimates were developed based on equipment and building layout needs, including additional site area and buffering around each facility. Even more compact arrangements may be possible for some facilities. Estimates should be accurate within a range of −30 to +50 percent.
Table 20. South Plant Strategy Cost and Site Estimates
Facility Capital ($ x 1M)
Annual Non-Labor O&M ($ x 1M)b
Annual Labor O&M ($ x 1M)
Site Footprint (acres)
Treatmenta 5.7 mgd
8.8
0.10
0.16 (1.5 FTEs) 1.0
Distribution System Pumping
5.7 mgd
6.6
0.11
0.027 (0.2 FTE)
0.3
Storage 1.3 MG
9.0
0.06
1.7
Piping (diameter, inches) 8 12 16 30 36
10.9 13.3 1.3 8.6 11.9
0.07 0.09 0.01 0.06 0.08
(27,700 ft) (29,700 ft) (2,600 ft)
(11,700 ft) (14,100 ft)
Total 70.4 0.57 0.187 (1.7 FTEs) 3.0 a Secondary effluent will be polished using tertiary rapid sand filtration and disinfected with liquid sodium hypochlorite. b Non-labor operation and maintenance estimates for all improvements include a base allowance of 1 percent of construction cost; treatment facilities include estimates of energy and chemical costs; pumping facilities include estimates of energy costs.
4.8 Phasing and Coordination The following sections describe phased implementation and construction coordination approaches identified for reclaimed water service to this strategy area.
Working Draft 40
Working Draft 41
4.8.1 Phased Implementation Strategy implementation could be phased in the following ways:
• Reclaimed water system development and expansion could start from the central system supply and build outward, focusing first on large nearby users. Initial core pipelines should be sized to accommodate future demand growth and strategy area expansion.
• Fewer pumps could be installed to meet initial demands, with more pumps added later as needed. Pump stations could be equipped with variable speed pumps to meet fluctuating system flows and accommodate system growth over time.
• Other system growth needs, including storage capacity, could be accommodated as needed on an incremental basis.
4.8.2 Construction Coordination The South plant strategy area consists mostly of large-scale industrial development, with areas of medium-density residential development and lower-density recreational development. Utility corridors may be less densely filled than in more developed urban areas, and a variety of alternative locations and corridors may be available for identified facilities and pipe alignments. To the extent possible, future construction of reclaimed water improvements would benefit from coordination with other King County, City of Renton, and City of Tukwila roadway/utility improvement projects in the area.
4.9 Effects on Planned Conveyance and Treatment Improvements
The South plant strategy would affect neither the re-rating of the South Treatment Plant that is planned for 2023 nor the expansion of the plant planned for 2029. The strategy would initially divert an estimated 2.2 mgd of effluent to reclaimed water, and some return flow would go back to the South plant.7 The amount of return flow would not increase flows significantly enough to accelerate the need for the re-rating or affect the magnitude of a treatment plant upgrade.8
If the reclaimed water is not discharged back into the wastewater system after use, the strategy may result in removing 2.2 mgd of effluent from the Effluent Transfer System (ETS), which carries effluent from the South plant to a marine outfall. The ETS has a maximum design capacity of 350 mgd, and it is therefore unlikely that the strategy will impact the operation of the ETS. There are no future upgrades or improvements planned for the ETS.
7 Ten percent of the flow that is treated to reclaimed water standards would be considered “return flow” to transport residual solids back to the treatment plant. 8 Facility re-rating is the practice of evaluating a facility or unit treatment process to determine if it is possible to operate the facility at a higher capacity than the original design capacity and includes identifying needed capital improvements, such as pumps, pipes, or odor control facilities.

Working Draft 42
5.0. INTERBAY SKIMMING DECENTRALIZED STRATEGY
The Interbay Skimming Decentralized Strategy would produce and distribute reclaimed water in the Interbay area of Seattle. This chapter gives an overview of the strategy, followed by sections that describe conceptual treatment, disinfection, and distribution systems; O&M needs; planning-level cost and footprint estimates; implementation phasing and construction coordination opportunities; and effects of the strategy on planned conveyance and treatment improvements.
5.1 Strategy Overview This strategy would rely on a small decentralized skimming treatment plant to produce Class A reclaimed water from untreated wastewater drawn from adjacent conveyance lines. The area to be served by the strategy is a 1 mile radius surrounding a conceptual treatment plant site located in Seattle between the Queen Anne and Magnolia neighborhoods, as shown in Figure 4. For the purpose of strategy definition, reclaimed water service was targeted for three nonpotable consumptive uses, selected based on use type, volume, seasonality, and geographic proximity.
The wastewater would be treated through a packaged MBR system with a maximum capacity of 0.5 mgd. This capacity would be sufficient to supply the three targeted reclaimed water uses, with capacity to spare for potential growth or system expansion up to 0.5 mgd. Waste solids and other waste streams produced at the skimming plant would be returned to the source wastewater pipeline for conveyance to the West Point Treatment Plant.
One pressure zone and one storage tank would meet the demands of this strategy. Reclaimed water would be distributed via a pump station and 0.8 mile of distribution pipeline.
The facility locations shown in Figure 4 are conceptual. Decentralized skimming treatment, pumping, and storage facilities could be located at a variety of locations. There are a number of large King County wastewater conveyance lines and branches in the vicinity. Specific locations and alignments would need to be further evaluated if projects are considered for implementation.
The Interbay reclaimed water strategy would be beneficial for heat recovery. Private developers in and around the strategy area have expressed interest in heat recovery for district heating of planned land development projects.
Estimated capital cost for this strategy is $20 million; estimated annual O&M cost is $0.24 million.
5.2 Estimated Volumes and Capacities Estimated reclaimed water use volumes and capacity sizing are shown in Table 21. Specific wastewater flows available for reclamation were not assessed; however, flows in this vicinity suggest that volumes well in excess of the 0.5-mgd capacity assumed for the strategy should be continuously available.
Working Draft 43
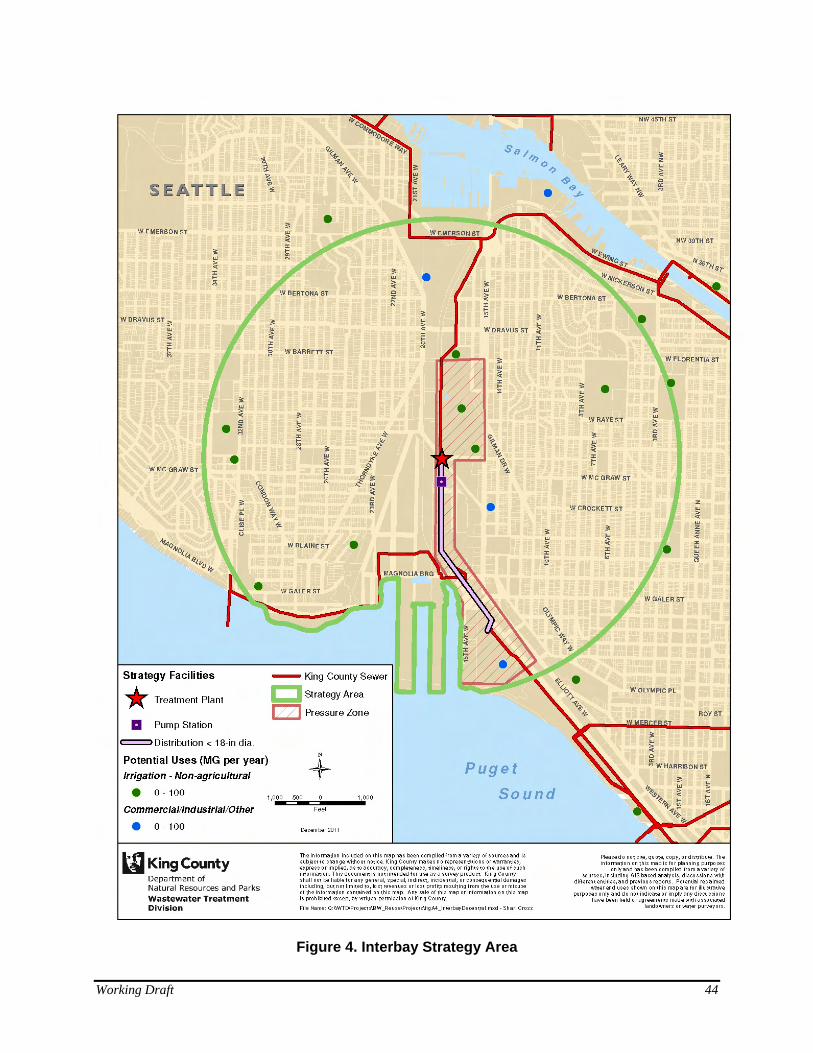
Figure 4. Interbay Strategy Area
Working Draft 44

Working Draft 45

Table 21. Reclaimed Water Use Projections and Required System Capacities (mgd) Interbay Strategy
ASD MDD PHD Facility Capacity Sizing (MDD x 1.2)a
Piping Capacity Sizing (PHD x 2.0)a
0.13 0.33 0.65 0.39 1.31 a Limited to 0.5 mgd total MDD capacity.
5.3 Treatment Reclaimed water implementation for the Interbay strategy area would include construction of a packaged decentralized MBR skimming treatment plant capable of producing up to 0.5 mgd of Class A reclaimed water from an untreated wastewater source, to include required oxidation, coagulation, and filtration processes. The skimming plant would need a peak capacity of 0.39 mgd to meet estimated reclaimed water uses identified for the conceptual strategy area.
5.4 Disinfection Disinfection facilities were sized to accommodate the estimated 0.39-mgd peak demand of the strategy area.
Assuming a maximum hypochlorite dose of 5 mg/L as free chlorine and a 12 percent strength hypochlorite solution, disinfection facilities to meet the peak estimated strategy area treatment capacity would provide an estimated chemical delivery capacity of approximately 20 gpd. To maintain a recommended minimum of one week storage of hypochlorite, a 150−200 gallon storage tank would be needed.
Although a minimum chlorine contact time of 30 minutes at a chlorine residual level of 1 mg/L or greater is required, a one-hour contact time was used for tank sizing to compensate for typical hydraulic inefficiencies. A chlorine contact tank volume of approximately 0.021 MG would be required to achieve this contact time.
5.5 Distribution System
5.5.1 Pressure Zone A single Interbay pressure zone was delineated to serve the potential service elevations and limited number of uses identified for the Interbay strategy area. Features of the Interbay Zone are given in Table 22.
Working Draft 46
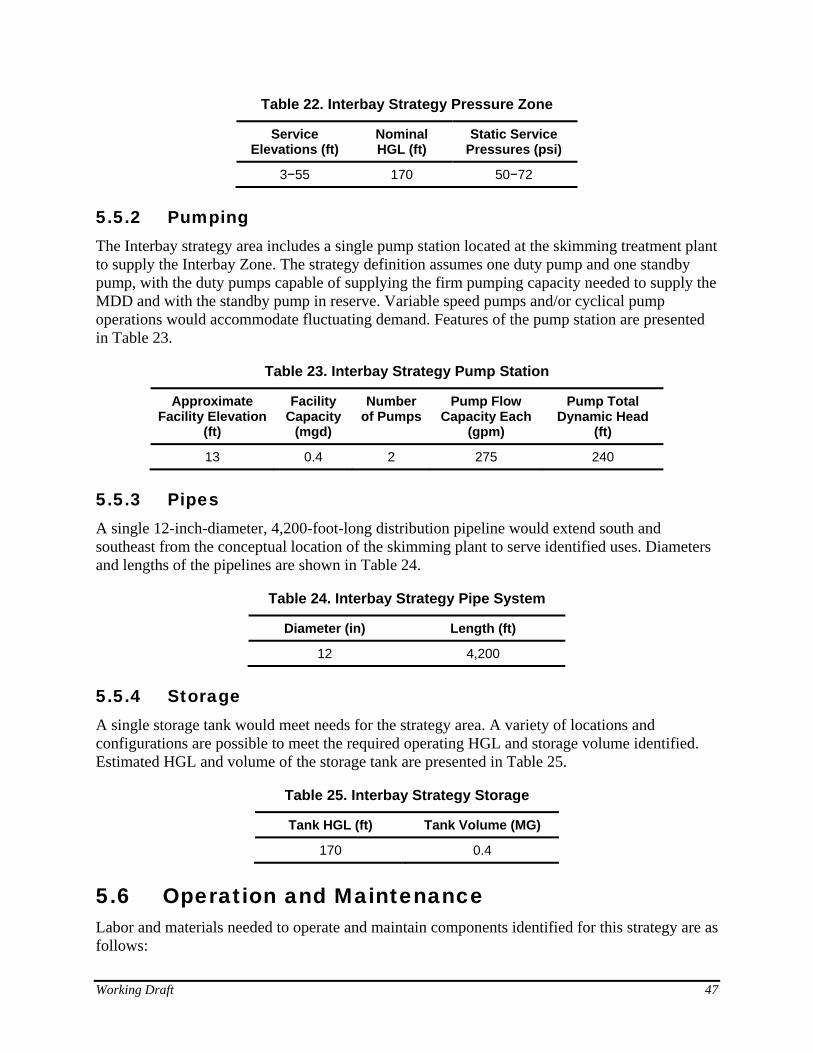
Table 22. Interbay Strategy Pressure Zone
Service Elevations (ft)
Nominal HGL (ft)
Static Service Pressures (psi)
3−55 170 50−72
5.5.2 Pumping The Interbay strategy area includes a single pump station located at the skimming treatment plant to supply the Interbay Zone. The strategy definition assumes one duty pump and one standby pump, with the duty pumps capable of supplying the firm pumping capacity needed to supply the MDD and with the standby pump in reserve. Variable speed pumps and/or cyclical pump operations would accommodate fluctuating demand. Features of the pump station are presented in Table 23.
Table 23. Interbay Strategy Pump Station
Approximate Facility Elevation
(ft)
Facility Capacity
(mgd)
Number of Pumps
Pump Flow Capacity Each
(gpm)
Pump Total Dynamic Head
(ft)
13 0.4 2 275 240
5.5.3 Pipes A single 12-inch-diameter, 4,200-foot-long distribution pipeline would extend south and southeast from the conceptual location of the skimming plant to serve identified uses. Diameters and lengths of the pipelines are shown in Table 24.
Table 24. Interbay Strategy Pipe System
Diameter (in) Length (ft)
12 4,200
5.5.4 Storage A single storage tank would meet needs for the strategy area. A variety of locations and configurations are possible to meet the required operating HGL and storage volume identified. Estimated HGL and volume of the storage tank are presented in Table 25.
Table 25. Interbay Strategy Storage
Tank HGL (ft) Tank Volume (MG)
170 0.4
5.6 Operation and Maintenance Labor and materials needed to operate and maintain components identified for this strategy are as follows:
Working Draft 47
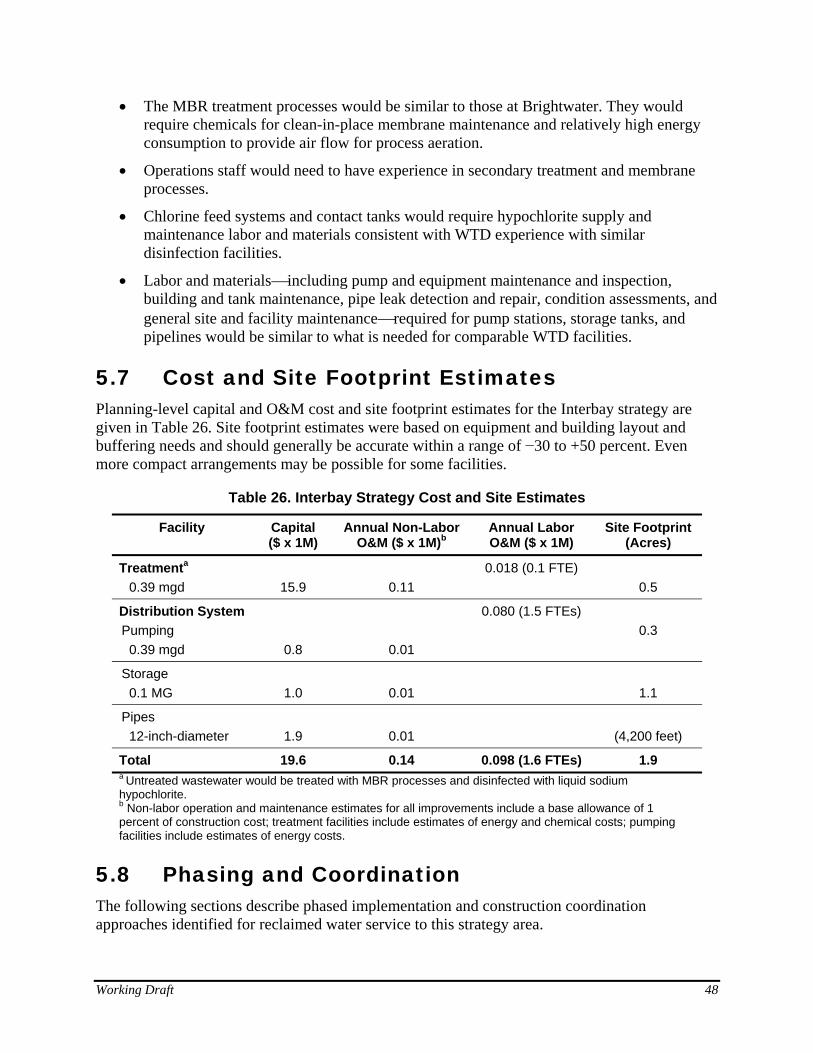
• The MBR treatment processes would be similar to those at Brightwater. They would require chemicals for clean-in-place membrane maintenance and relatively high energy consumption to provide air flow for process aeration.
• Operations staff would need to have experience in secondary treatment and membrane processes.
• Chlorine feed systems and contact tanks would require hypochlorite supply and maintenance labor and materials consistent with WTD experience with similar disinfection facilities.
• Labor and materials⎯including pump and equipment maintenance and inspection, building and tank maintenance, pipe leak detection and repair, condition assessments, and general site and facility maintenance⎯required for pump stations, storage tanks, and pipelines would be similar to what is needed for comparable WTD facilities.
5.7 Cost and Site Footprint Estimates Planning-level capital and O&M cost and site footprint estimates for the Interbay strategy are given in Table 26. Site footprint estimates were based on equipment and building layout and buffering needs and should generally be accurate within a range of −30 to +50 percent. Even more compact arrangements may be possible for some facilities.
Table 26. Interbay Strategy Cost and Site Estimates
Facility Capital ($ x 1M)
Annual Non-Labor O&M ($ x 1M)b
Annual Labor O&M ($ x 1M)
Site Footprint (Acres)
Treatmenta 0.39 mgd
15.9
0.11
0.018 (0.1 FTE) 0.5
Distribution SystemPumping
0.39 mgd
0.8
0.01
0.080 (1.5 FTEs)
0.3
Storage 0.1 MG
1.0
0.01
1.1
Pipes 12-inch-diameter
1.9
0.01
(4,200 feet)
Total 19.6 0.14 0.098 (1.6 FTEs) 1.9 a Untreated wastewater would be treated with MBR processes and disinfected with liquid sodium hypochlorite. b Non-labor operation and maintenance estimates for all improvements include a base allowance of 1 percent of construction cost; treatment facilities include estimates of energy and chemical costs; pumping facilities include estimates of energy costs.
5.8 Phasing and Coordination The following sections describe phased implementation and construction coordination approaches identified for reclaimed water service to this strategy area.
Working Draft 48
5.8.1 Phased Implementation Strategy implementation could be phased in the following ways:
• Reclaimed water system development and expansion could start from the central system supply and build outward, focusing first on large nearby users. Initial core pipelines should be sized to accommodate future demand growth and strategy area expansion.
• The MBR skimming plant could be configured so as to be expandable beyond the 0.5-mgd capacity.
• Variable speed pumps would be able to meet fluctuating system flows and accommodate system growth over time. Any future expansion beyond the 0.5-mgd system capacity could be accommodated by adding additional pumps or replacing initial pumps with larger units.
• Additional storage could also be added incrementally as needed.
5.8.2 Construction Coordination The Interbay strategy area consists mostly of industrial and recreational land uses in a long-established urban area. Utility corridors may be more densely filled than in less developed suburban and rural areas and fewer alternative locations and corridors for identified facilities and pipe alignments may be available. To the extent possible, future construction of reclaimed water improvements would benefit from coordination with other King County or City of Seattle roadway/utility improvement projects in the area.
The planned Magnolia CSO storage project may present one project coordination opportunity for this strategy. It may be possible to co-locate reclaimed water strategy facilities with improvements needed for the CSO control project.
5.9 Effects on Planned Conveyance and Treatment Improvements
The Interbay strategy would remove 0.5 mgd of wastewater from the Elliott Bay Interceptor (EBI) downstream of the Interbay Pump Station, which is an insufficient amount to affect the sizing or timing of any planned improvements. The maximum capacity of the EBI is 133 mgd, and during sizable rainfall events it tends to flow full. The 0.5 mgd of flow removed by the Interbay strategy would unlikely be beneficial during these events, as the reclaimed water that would serve irrigation uses would presumably not be needed during the winter months when sizable rainfall events are most common. In addition, the reclaimed water that would serve industrial uses year-round may be discharged back into the collection system and not result in decreasing the volume of flow that is transported to the treatment facilities.
Working Draft 49
6.0. DUWAMISH POLISHING DECENTRALIZED STRATEGY
The Duwamish Polishing Decentralized Strategy would produce and distribute reclaimed water on the west side of the Duwamish River in Seattle. This chapter gives an overview of the strategy, followed by sections that describe conceptual treatment, disinfection, and distribution systems; O&M needs; planning-level cost and footprint estimates; implementation phasing and construction coordination opportunities; and effects of the strategy on planned conveyance and treatment improvements.
6.1 Strategy Overview The Duwamish strategy would rely on a small decentralized polishing treatment plant to produce Class A reclaimed water from secondary effluent drawn from the South Treatment Plant ETS pipeline. The area to be served by the strategy is a 1 mile radius surrounding a conceptual treatment plant site in the Georgetown neighborhood in south Seattle, as shown in Figure 5. Reclaimed water service is targeted for two nonpotable consumptive uses, selected based on use type, volume, seasonality, and geographic proximity in order to define the strategy.
The secondary effluent would be treated by a packaged sand filtration polishing plant with a maximum capacity of 0.5 mgd. This capacity would be sufficient to supply estimated reclaimed water demands of the two targeted uses. Waste solids and other waste streams produced at the polishing plant would be routed to area wastewater pipelines for conveyance to the West Point Treatment Plant.
One pressure zone and one storage tank would meet the demands of this strategy. Reclaimed water would be distributed via a pump station and 0.7 mile of pipeline.
The facility and alignments locations shown in Figure 5 are conceptual. Decentralized polishing treatment, pumping, and storage facilities could be located at a variety of locations, limited only by practical access to the ETS. Specific parcels and alignments would need to be further evaluated if this strategy were to be implemented.
The Duwamish reclaimed water strategy would be beneficial to any heat recovery efforts in the area. Significant flows in the ETS would be available as a heat source, and opportunities may exist to co-locate heat recovery equipment with reclaimed water treatment systems.
Estimated capital cost for this strategy is $6.2 million; estimated annual O&M cost is $0.15 million.
6.2 Estimated Volumes and Capacities Estimated reclaimed water use volumes, capacity sizing, and wastewater volumes available for reclamation are shown in Table 27 and Table 28. There is ample wastewater available to meet the limited uses and capacities targeted for the Duwamish strategy.
Working Draft 50
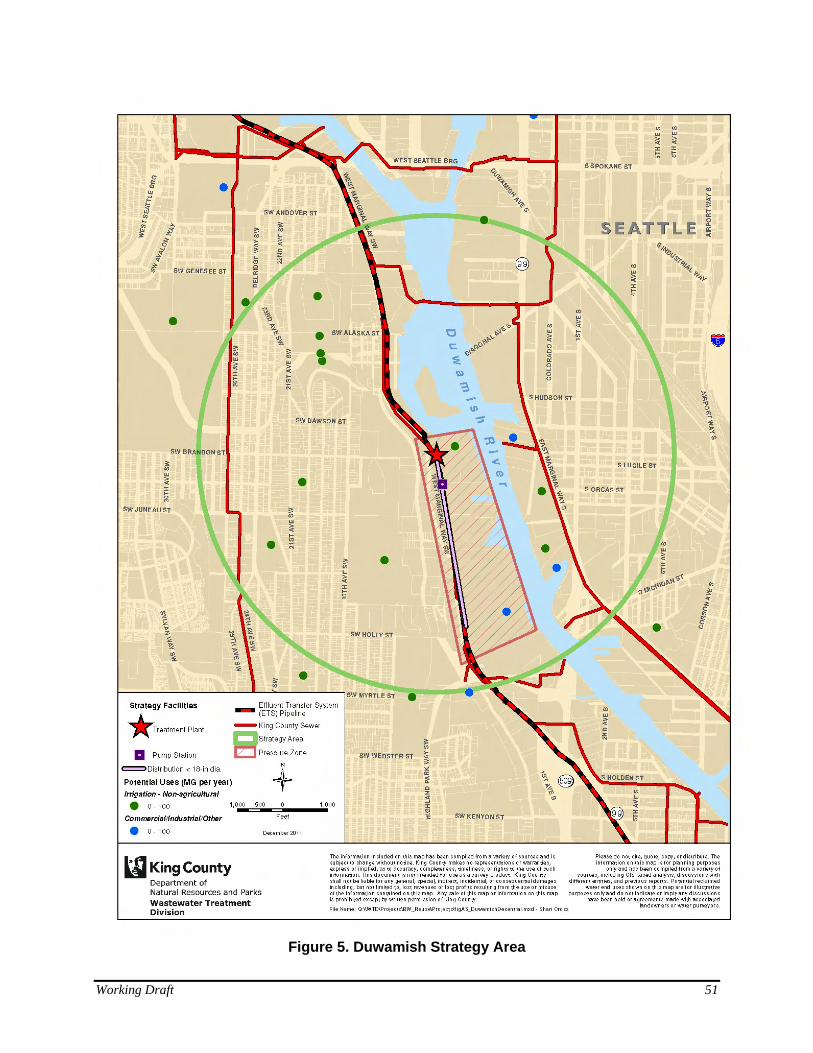
Figure 5. Duwamish Strategy Area
Working Draft 51

Working Draft 52

Table 27. Reclaimed Water Use Projections and Required System Capacities (mgd) Duwamish Strategy
ASD MDD PHD Facility Capacity Sizing (MDD x 1.2)a
Piping Capacity Sizing (PHD x 2.0)a
0.34 0.50 1.00 0.50 2.00 a Limited to 0.5 mgd total MDD capacity.
Table 28. Wastewater Available for Reclamation (mgd) Duwamish Strategy
2020 Dry Season
2020 Wet Season
2040 Dry Season
2040 Wet Season
56.5 99.2 70.0 124.5
6.3 Treatment The South plant treatment system uses primary settling and secondary activated sludge processes to produce a fully oxidized and treated secondary wastewater effluent, which is then conveyed via the ETS to a Puget Sound outfall.
A small packaged polishing plant would produce up to 0.5 mgd of Class A reclaimed water for the Duwamish strategy area from wastewater drawn from the ETS. Sand filtrations would satisfy the required coagulation and filtration.
6.4 Disinfection Disinfection facilities were sized to accommodate the estimated 0.5-mgd peak demand of the strategy area.
Assuming a maximum hypochlorite dose of 5 mg/L as free chlorine and a 12 percent strength hypochlorite solution, disinfection facilities to meet the peak estimated strategy area treatment capacity would provide an estimated chemical delivery capacity of approximately 25 gpd. To maintain a recommended minimum of one week storage of hypochlorite, a 200 gallon storage facility would be needed.
Although a minimum chlorine contact time of 30 minutes at a chlorine residual level of 1 mg/L or greater is required, a one-hour contact time was used for tank sizing to compensate for typical hydraulic inefficiencies. A chlorine contact tank volume of approximately 0.021 MG would be required to achieve this contact time.
6.5 Distribution System
6.5.1 Pressure Zone A single Duwamish pressure zone would serve the potential service elevations and limited number of uses identified for the Duwamish strategy area. Features of this zone are given in Table 29.
Working Draft 53
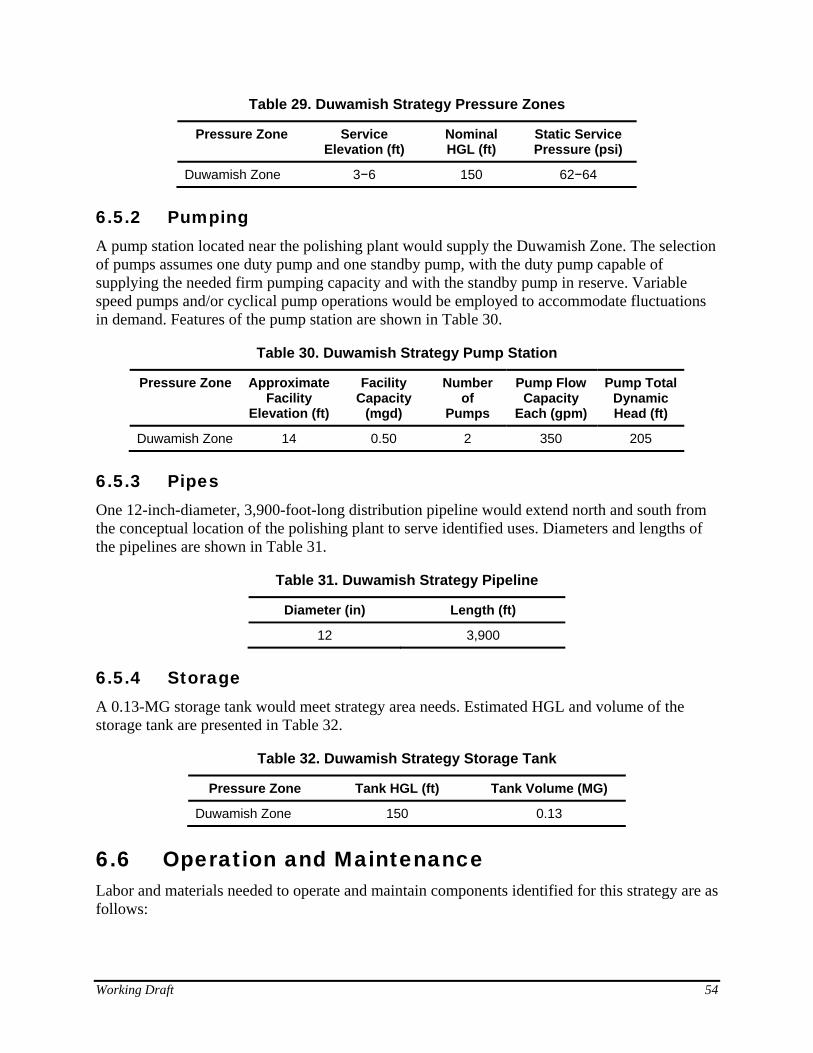
Table 29. Duwamish Strategy Pressure Zones
Pressure Zone Service Elevation (ft)
Nominal HGL (ft)
Static Service Pressure (psi)
Duwamish Zone 3−6 150 62−64
6.5.2 Pumping A pump station located near the polishing plant would supply the Duwamish Zone. The selection of pumps assumes one duty pump and one standby pump, with the duty pump capable of supplying the needed firm pumping capacity and with the standby pump in reserve. Variable speed pumps and/or cyclical pump operations would be employed to accommodate fluctuations in demand. Features of the pump station are shown in Table 30.
Table 30. Duwamish Strategy Pump Station
Pressure Zone Approximate Facility
Elevation (ft)
Facility Capacity
(mgd)
Number of
Pumps
Pump Flow Capacity
Each (gpm)
Pump Total Dynamic Head (ft)
Duwamish Zone 14 0.50 2 350 205
6.5.3 Pipes One 12-inch-diameter, 3,900-foot-long distribution pipeline would extend north and south from the conceptual location of the polishing plant to serve identified uses. Diameters and lengths of the pipelines are shown in Table 31.
Table 31. Duwamish Strategy Pipeline
Diameter (in) Length (ft)
12 3,900
6.5.4 Storage A 0.13-MG storage tank would meet strategy area needs. Estimated HGL and volume of the storage tank are presented in Table 32.
Table 32. Duwamish Strategy Storage Tank
Pressure Zone Tank HGL (ft) Tank Volume (MG)
Duwamish Zone 150 0.13
6.6 Operation and Maintenance Labor and materials needed to operate and maintain components identified for this strategy are as follows:
Working Draft 54
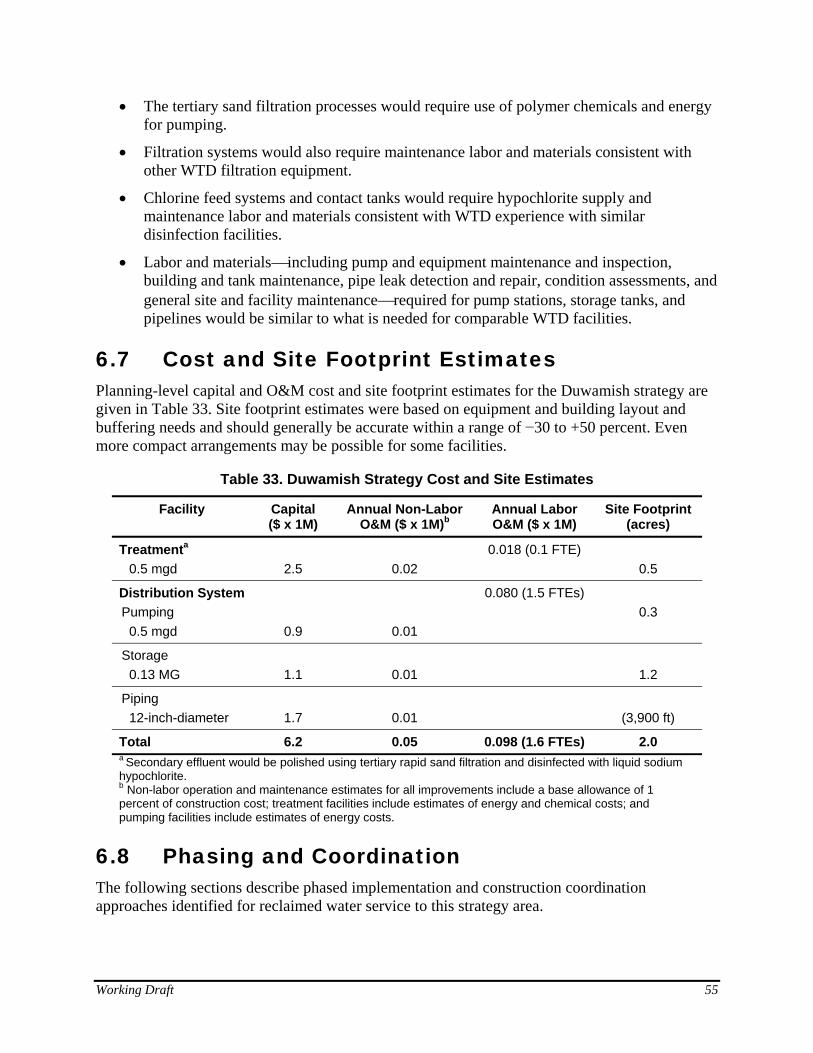
• The tertiary sand filtration processes would require use of polymer chemicals and energy for pumping.
• Filtration systems would also require maintenance labor and materials consistent with other WTD filtration equipment.
• Chlorine feed systems and contact tanks would require hypochlorite supply and maintenance labor and materials consistent with WTD experience with similar disinfection facilities.
• Labor and materials⎯including pump and equipment maintenance and inspection, building and tank maintenance, pipe leak detection and repair, condition assessments, and general site and facility maintenance⎯required for pump stations, storage tanks, and pipelines would be similar to what is needed for comparable WTD facilities.
6.7 Cost and Site Footprint Estimates Planning-level capital and O&M cost and site footprint estimates for the Duwamish strategy are given in Table 33. Site footprint estimates were based on equipment and building layout and buffering needs and should generally be accurate within a range of −30 to +50 percent. Even more compact arrangements may be possible for some facilities.
Table 33. Duwamish Strategy Cost and Site Estimates
Facility Capital ($ x 1M)
Annual Non-Labor O&M ($ x 1M)b
Annual Labor O&M ($ x 1M)
Site Footprint (acres)
Treatmenta 0.5 mgd
2.5
0.02
0.018 (0.1 FTE) 0.5
Distribution SystemPumping
0.5 mgd
0.9
0.01
0.080 (1.5 FTEs)
0.3
Storage 0.13 MG
1.1
0.01
1.2
Piping 12-inch-diameter
1.7
0.01
(3,900 ft)
Total 6.2 0.05 0.098 (1.6 FTEs) 2.0 a Secondary effluent would be polished using tertiary rapid sand filtration and disinfected with liquid sodium hypochlorite. b Non-labor operation and maintenance estimates for all improvements include a base allowance of 1 percent of construction cost; treatment facilities include estimates of energy and chemical costs; and pumping facilities include estimates of energy costs.
6.8 Phasing and Coordination The following sections describe phased implementation and construction coordination approaches identified for reclaimed water service to this strategy area.
Working Draft 55
6.8.1 Phased Implementation Strategy implementation could be phased in the following ways:
• Reclaimed water system development and expansion could start from the central system supply and build outward, focusing first on large nearby users. Initial core pipelines should be sized to accommodate future demand growth and strategy area expansion.
• The polishing plant could be configured so as to be expandable beyond the 0.5-mgd capacity.
• Variable speed pumps would be able to meet fluctuating system flows and accommodate system growth over time. Any future expansion beyond the 0.5-mgd system capacity could be accommodated by adding additional pumps or replacing initial pumps with larger units.
• Additional storage could also be added incrementally as needed.
6.8.2 Construction Coordination The Duwamish strategy area consists mostly of heavy industrial land uses within a long-established industrial urban area. Utility corridors may be more densely filled than in less developed suburban and rural areas and fewer alternative locations and corridors for identified facilities and piping alignments may be available. To the extent possible, future construction of reclaimed water improvements would benefit from coordination with other King County or City of Seattle roadway/utility improvement projects in the area.
6.9 Effects on Planned Conveyance and Treatment Improvements
The Duwamish strategy would remove 0.5 mgd of effluent from the Effluent Transfer System (ETS), which would have minimal impact on the ETS, as it is designed to carry up to 350 mgd. No improvements are planned for the ETS, which carries treated effluent from the South Treatment Plant to a marine outfall.
Working Draft 56

Working Draft 57
7.0. LOWER GREEN RIVER VALLEY SKIMMING DECENTRALIZED STRATEGY
The Lower Green River Valley (LGRV) Skimming Decentralized Strategy would produce and distribute reclaimed water along the floor of the LGRV, including areas in and around the Cities of Kent and Auburn. This chapter gives an overview of the strategy, followed by sections that describe conceptual treatment, disinfection, and distribution systems; O&M needs; planning-level cost and footprint estimates; implementation phasing and construction coordination opportunities; and effects of the strategy on planned conveyance and treatment improvements.
7.1 Strategy Overview The LGRV strategy would rely on a small decentralized skimming treatment plant to produce Class A reclaimed water from untreated wastewater drawn from adjacent conveyance lines. The area to be served by the strategy is a 1 mile radius surrounding a conceptual treatment site located in south King County in the vicinity of Kent and Auburn, as shown in Figure 6.
A single large agricultural irrigation use was targeted in order to define the strategy. During irrigation season, this use could require the entire capacity of the skimming plant and reclaimed water supply. Outside of irrigation season, the plant would be idle. The selected use is conveniently located relative to source wastewater pipelines, but many suitable agricultural uses exist in and around the LGRV strategy area that could alternatively be targeted for reclaimed water service.
The wastewater would be treated through a packaged MBR system with a maximum capacity of 0.5 mgd. This capacity would be sufficient to fully supply the single targeted reclaimed water use in the strategy area. Waste solids and other waste streams produced at the skimming plant would be returned to the source wastewater pipeline for conveyance to the South Treatment Plant.
One pressure zone and one storage tank would meet the demands of this strategy. Reclaimed water would be distributed via a pump station near the skimming plant and 900 feet of distribution pipeline.
The facility locations shown in Figure 6 are conceptual. Decentralized skimming treatment, pumping, and storage facilities could be located at a variety of locations. There are a number of large King County wastewater conveyance lines and branches in the vicinity. Specific locations and alignments would need to be further assessed if projects are considered for implementation.
The LGRV reclaimed water strategy would be beneficial to any heat recovery efforts in the area.
Estimated capital cost for this strategy is $18 million; estimated annual O&M cost is $0.24 million.
Working Draft 58
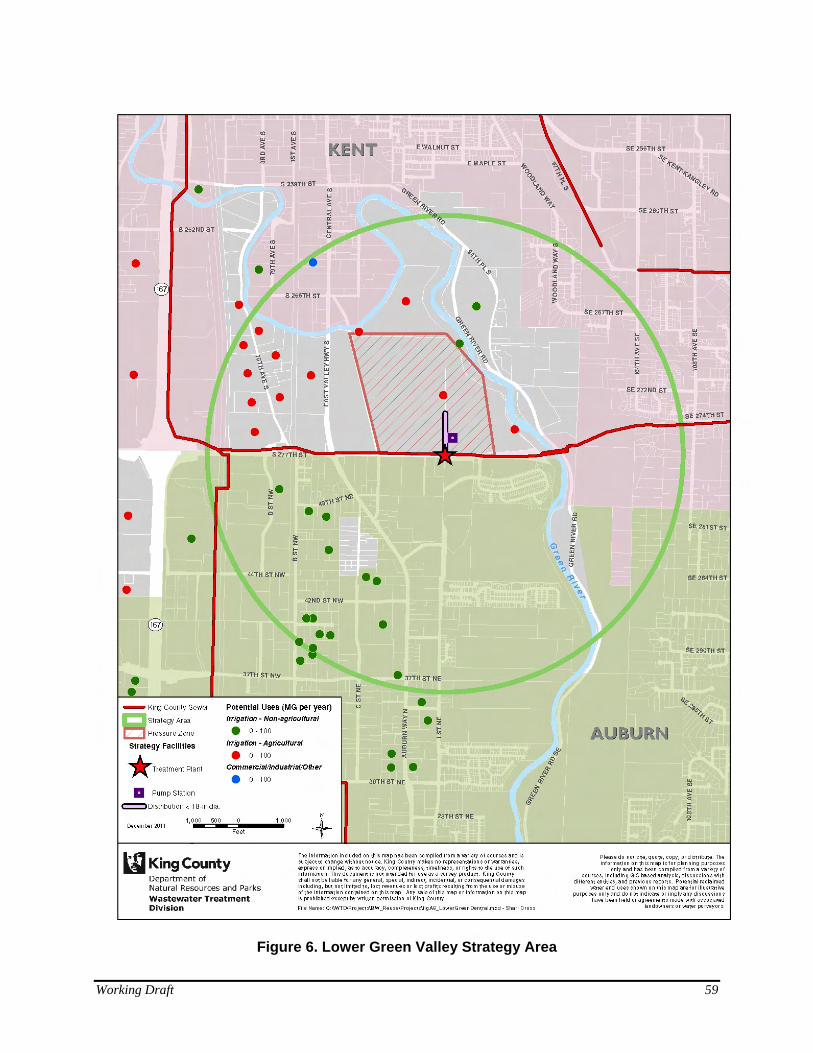
Figure 6. Lower Green Valley Strategy Area
Working Draft 59
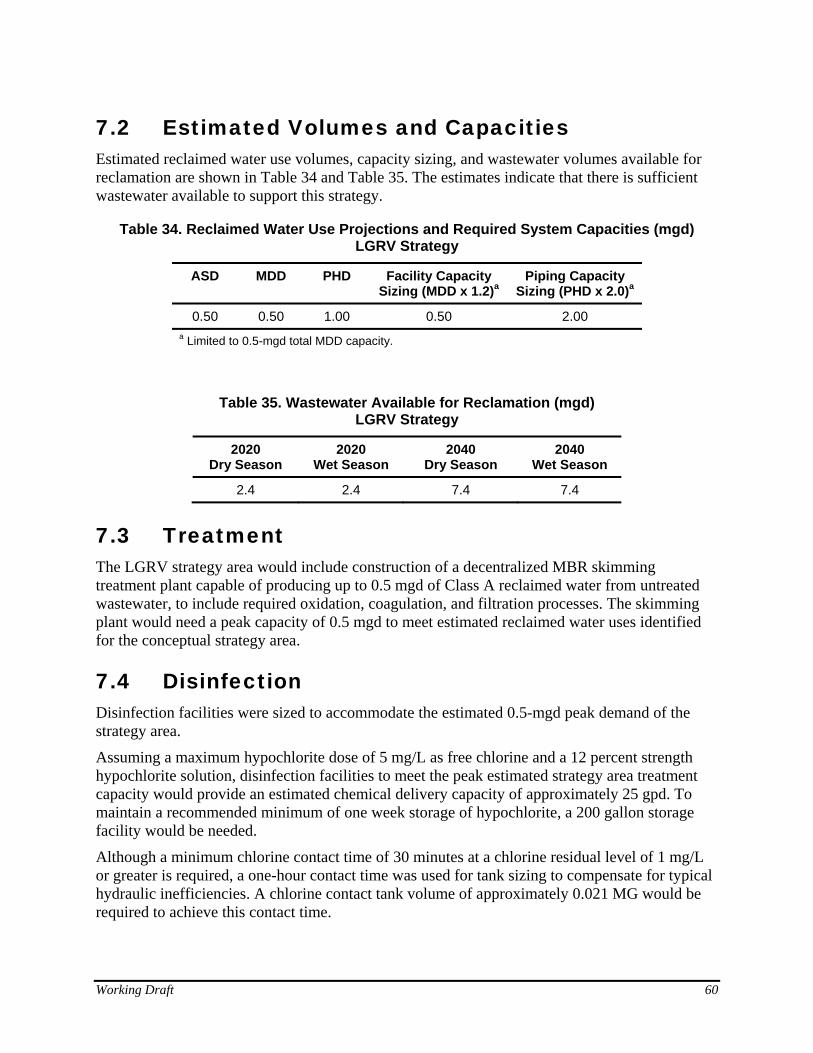
7.2 Estimated Volumes and Capacities Estimated reclaimed water use volumes, capacity sizing, and wastewater volumes available for reclamation are shown in Table 34 and Table 35. The estimates indicate that there is sufficient wastewater available to support this strategy.
Table 34. Reclaimed Water Use Projections and Required System Capacities (mgd) LGRV Strategy
ASD MDD PHD Facility Capacity Sizing (MDD x 1.2)a
Piping Capacity Sizing (PHD x 2.0)a
0.50 0.50 1.00 0.50 2.00 a Limited to 0.5-mgd total MDD capacity.
Table 35. Wastewater Available for Reclamation (mgd) LGRV Strategy
2020 Dry Season
2020 Wet Season
2040 Dry Season
2040 Wet Season
2.4 2.4 7.4 7.4
7.3 Treatment The LGRV strategy area would include construction of a decentralized MBR skimming treatment plant capable of producing up to 0.5 mgd of Class A reclaimed water from untreated wastewater, to include required oxidation, coagulation, and filtration processes. The skimming plant would need a peak capacity of 0.5 mgd to meet estimated reclaimed water uses identified for the conceptual strategy area.
7.4 Disinfection Disinfection facilities were sized to accommodate the estimated 0.5-mgd peak demand of the strategy area.
Assuming a maximum hypochlorite dose of 5 mg/L as free chlorine and a 12 percent strength hypochlorite solution, disinfection facilities to meet the peak estimated strategy area treatment capacity would provide an estimated chemical delivery capacity of approximately 25 gpd. To maintain a recommended minimum of one week storage of hypochlorite, a 200 gallon storage facility would be needed.
Although a minimum chlorine contact time of 30 minutes at a chlorine residual level of 1 mg/L or greater is required, a one-hour contact time was used for tank sizing to compensate for typical hydraulic inefficiencies. A chlorine contact tank volume of approximately 0.021 MG would be required to achieve this contact time.
Working Draft 60
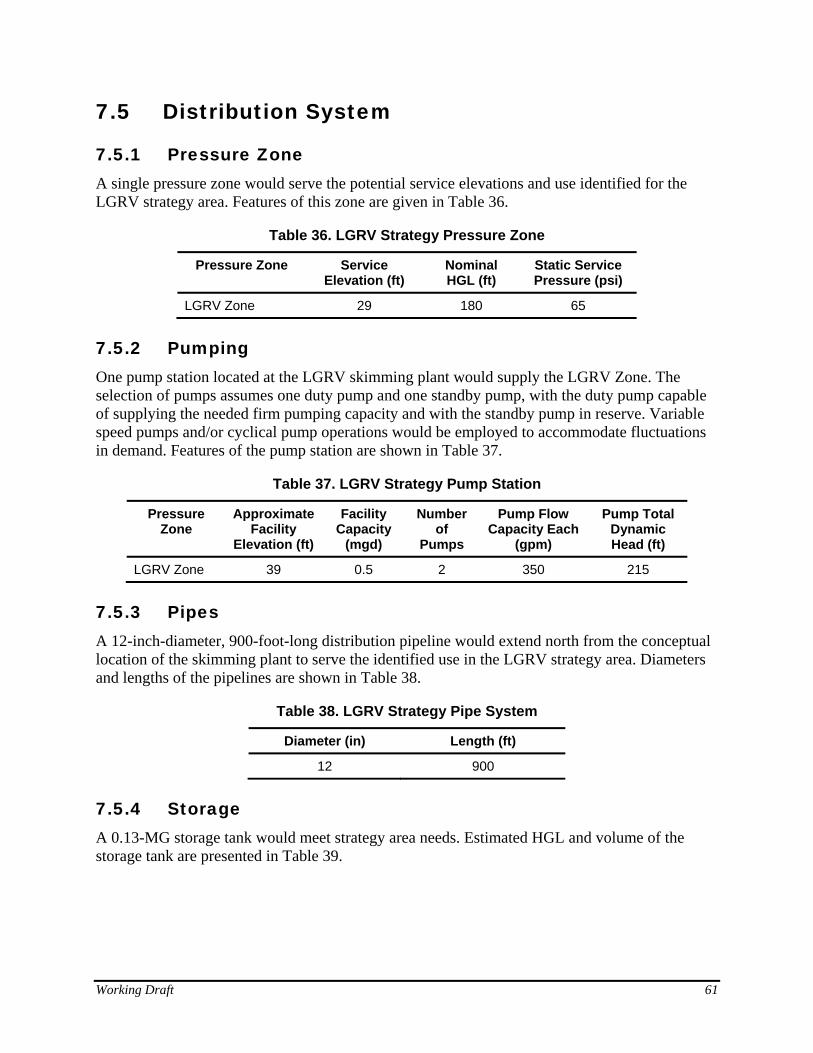
7.5 Distribution System
7.5.1 Pressure Zone A single pressure zone would serve the potential service elevations and use identified for the LGRV strategy area. Features of this zone are given in Table 36.
Table 36. LGRV Strategy Pressure Zone
Pressure Zone Service Elevation (ft)
Nominal HGL (ft)
Static Service Pressure (psi)
LGRV Zone 29 180 65
7.5.2 Pumping One pump station located at the LGRV skimming plant would supply the LGRV Zone. The selection of pumps assumes one duty pump and one standby pump, with the duty pump capable of supplying the needed firm pumping capacity and with the standby pump in reserve. Variable speed pumps and/or cyclical pump operations would be employed to accommodate fluctuations in demand. Features of the pump station are shown in Table 37.
Table 37. LGRV Strategy Pump Station
Pressure Zone
Approximate Facility
Elevation (ft)
Facility Capacity
(mgd)
Number of
Pumps
Pump Flow Capacity Each
(gpm)
Pump Total Dynamic Head (ft)
LGRV Zone 39 0.5 2 350 215
7.5.3 Pipes A 12-inch-diameter, 900-foot-long distribution pipeline would extend north from the conceptual location of the skimming plant to serve the identified use in the LGRV strategy area. Diameters and lengths of the pipelines are shown in Table 38.
Table 38. LGRV Strategy Pipe System
Diameter (in) Length (ft)
12 900
7.5.4 Storage A 0.13-MG storage tank would meet strategy area needs. Estimated HGL and volume of the storage tank are presented in Table 39.
Working Draft 61
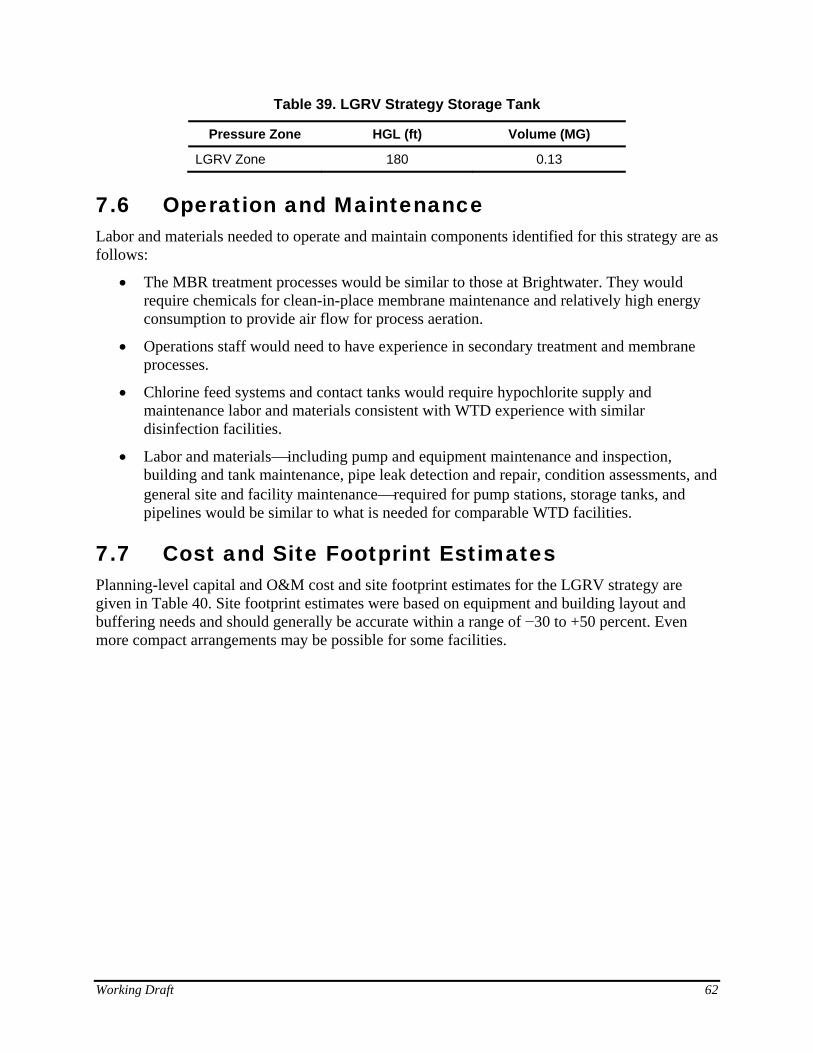
Table 39. LGRV Strategy Storage Tank
Pressure Zone HGL (ft) Volume (MG)
LGRV Zone 180 0.13
7.6 Operation and Maintenance Labor and materials needed to operate and maintain components identified for this strategy are as follows:
• The MBR treatment processes would be similar to those at Brightwater. They would require chemicals for clean-in-place membrane maintenance and relatively high energy consumption to provide air flow for process aeration.
• Operations staff would need to have experience in secondary treatment and membrane processes.
• Chlorine feed systems and contact tanks would require hypochlorite supply and maintenance labor and materials consistent with WTD experience with similar disinfection facilities.
• Labor and materials⎯including pump and equipment maintenance and inspection, building and tank maintenance, pipe leak detection and repair, condition assessments, and general site and facility maintenance⎯required for pump stations, storage tanks, and pipelines would be similar to what is needed for comparable WTD facilities.
7.7 Cost and Site Footprint Estimates Planning-level capital and O&M cost and site footprint estimates for the LGRV strategy are given in Table 40. Site footprint estimates were based on equipment and building layout and buffering needs and should generally be accurate within a range of −30 to +50 percent. Even more compact arrangements may be possible for some facilities.
Working Draft 62
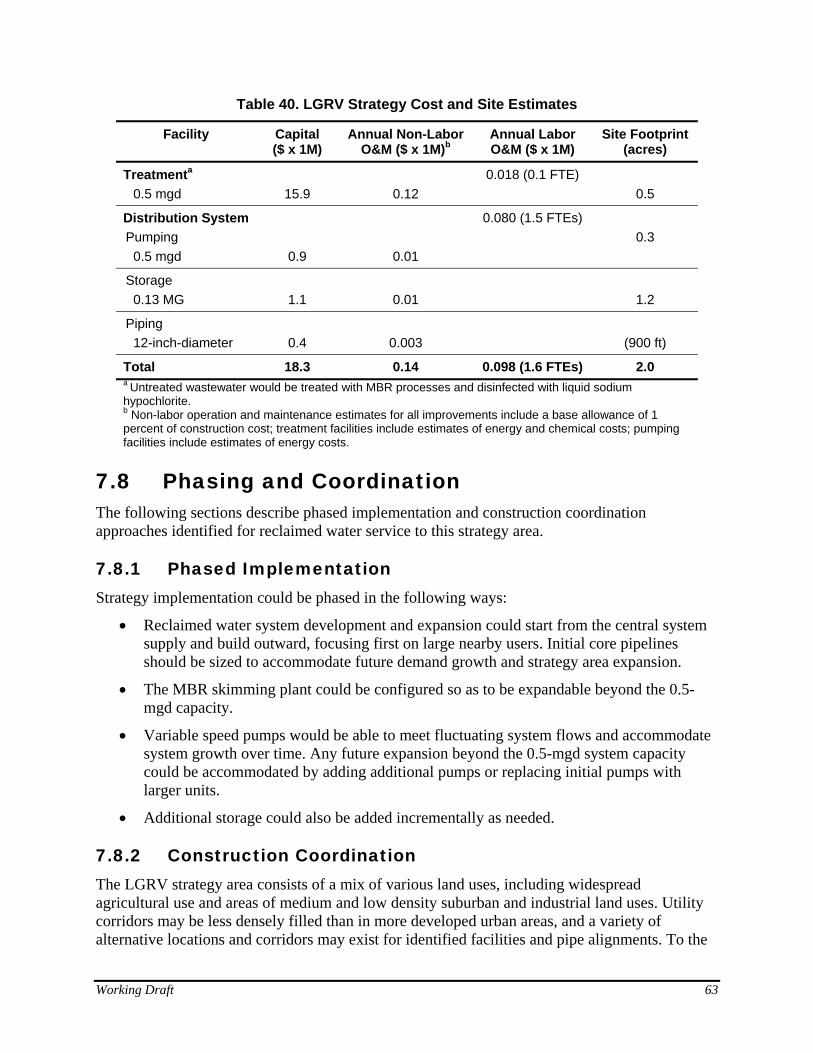
Table 40. LGRV Strategy Cost and Site Estimates
Facility Capital ($ x 1M)
Annual Non-Labor O&M ($ x 1M)b
Annual Labor O&M ($ x 1M)
Site Footprint (acres)
Treatmenta 0.5 mgd
15.9
0.12
0.018 (0.1 FTE) 0.5
Distribution System Pumping
0.5 mgd
0.9
0.01
0.080 (1.5 FTEs)
0.3
Storage 0.13 MG
1.1
0.01
1.2
Piping 12-inch-diameter
0.4
0.003
(900 ft)
Total 18.3 0.14 0.098 (1.6 FTEs) 2.0 a Untreated wastewater would be treated with MBR processes and disinfected with liquid sodium hypochlorite. b Non-labor operation and maintenance estimates for all improvements include a base allowance of 1 percent of construction cost; treatment facilities include estimates of energy and chemical costs; pumping facilities include estimates of energy costs.
7.8 Phasing and Coordination The following sections describe phased implementation and construction coordination approaches identified for reclaimed water service to this strategy area.
7.8.1 Phased Implementation Strategy implementation could be phased in the following ways:
• Reclaimed water system development and expansion could start from the central system supply and build outward, focusing first on large nearby users. Initial core pipelines should be sized to accommodate future demand growth and strategy area expansion.
• The MBR skimming plant could be configured so as to be expandable beyond the 0.5-mgd capacity.
• Variable speed pumps would be able to meet fluctuating system flows and accommodate system growth over time. Any future expansion beyond the 0.5-mgd system capacity could be accommodated by adding additional pumps or replacing initial pumps with larger units.
• Additional storage could also be added incrementally as needed.
7.8.2 Construction Coordination The LGRV strategy area consists of a mix of various land uses, including widespread agricultural use and areas of medium and low density suburban and industrial land uses. Utility corridors may be less densely filled than in more developed urban areas, and a variety of alternative locations and corridors may exist for identified facilities and pipe alignments. To the
Working Draft 63
extent possible, future construction of reclaimed water improvements would benefit from coordination with other King County, City of Kent, or City of Auburn roadway/utility improvement projects in the area.
7.9 Effects on Planned Conveyance and Treatment Improvements
The LGRV strategy, which would remove 0.5 mgd of wastewater from the South Interceptor or the Eastside Interceptor (ESI) upstream of the South Treatment Plant, would not affect planned improvements of either interceptor. There are capacity limitations in the ESI during peak flow events that usually occur during sizable rainfall events in the winter months. Because the LGRV strategy focuses on serving agricultural irrigation uses, it would not affect the timing or capacity needs of any planned treatment or conveyance improvements. There are no capacity limitations in the South Interceptor and the strategy would not affect future capacity needs of the pipeline.
Working Draft 64
8.0. POTENTIAL NEW TECHNOLOGY INFLUENCES
Pumping, piping, and storage technologies represent relatively mature and well understood technologies. Continued improvements are not expected to have much impact on reclaimed water strategy implementation.
Sand and other media filtration treatment systems may be enjoying a resurgence following a recent industry rush to membrane solutions. Membranes involve comparatively higher capital and O&M lifecycle costs. Traditional media filters can offer more straightforward implementation and operation approaches while maintaining reliable performance. While performance can be improved through judicious design and implementation, significant technological advancements in media filtration are unlikely because it is such a mature technology.
The biggest changes and advancements will likely involve increased focus on water quality parameters and contaminants of concern as well as treatment processes involving membrane technology, including MBRs. This chapter discusses these and other potential areas of future technological advancement including nutrient removal, disinfection, and automated systems.
8.1.1 Water Quality Analyses and Contaminant Concerns New and improving water quality analysis techniques, technologies, and standards allow water quality contaminant levels to be detected, quantified, and reported at ever lower concentrations. With the increased awareness and ability to detect water quality contaminants and the increased reporting of their occurrence come increased public concern about potential effects.
For nonpotable consumptive use of Class A reclaimed water, with its limited potential for direct human ingestion and contact and its limited potential for significant water quality contaminant levels, current research suggests that known and emerging contaminants would not pose a direct human health concern. However, potential impacts to the environment, natural systems, and resulting indirect impacts to human health may come to light as our understanding of the fate and effects of wastewater contaminants in the environment becomes better understood.
8.1.2 Membrane Treatment Processes Recent improvements in membrane filtration treatment, including applications for biological treatment such as MBRs, have seen significant shifts and technological advancements in recent years as membrane materials become more robust; membrane life, fouling resistance, and chemical cleaning tolerances improve; and membrane processes become more efficient. For potable water, wastewater, and reclaimed water treatment, membrane and MBR technologies currently represent a pinnacle of advanced treatment applications with respect to contaminant removal, effluent quality, and ease of implementation/operation.
Recent improvements in membrane technology, including MBRs, micro/ultrafiltration, nanofiltration, and reverse osmosis technologies, have reduced power, operation, maintenance, and lifecycle costs but have not significantly improved gross removal performance or greatly increased hydraulic capacity. As membrane applications become more widespread, future
Working Draft 65
advancements in membrane filtration and MBR technology may increase hydraulic capacity and allow for reduced footprint. Although footprint may be reduced, it is unlikely that future technological advancements would drastically change membrane and MBR costs, performance, and efficiencies.
8.1.3 Nutrient Removal While nutrient removal processes have seen improvements in recent years, most nutrient removal technologies rely on the same fundamental principles that have been known for decades. Recent improvements have only incrementally reduced the footprint, power, and chemical use requirements of these technologies. The phosphorus removal filters discussed earlier in this report represent some of the most advanced chemical precipitation/adsorption technologies for phosphorus on the market today. While technology breakthroughs in these areas are always possible, they are not likely. The only anticipated future improvements in nutrient removal processes would be to further reduce footprint or chemical use for phosphorus precipitation technology.
8.1.4 Disinfection Another area of recent technological improvement is disinfection, including ozone, UV, and small-scale onsite hypochlorite generation processes. For reclaimed water strategy development, however, it may be difficult to improve the established disinfection performance, relative safety, and cost efficiency of bulk sodium hypochlorite.
8.1.5 Automation, Data Management, and Controls Ongoing technological advancements in process control, utility management systems/software, and customer billing systems through automatic metering and related systems bear consideration in the potential development of reclaimed water strategies. Although control, communications, software, and equipment life/performance continue to improve and change rapidly, changes in these technologies are unlikely to significantly affect the implementation of reclaimed water systems.
Working Draft 66
9.0. REFERENCES Asano, T. (ed.). 1998. Wastewater Reclamation and Reuse. Water Quality Management Library, 10. Boca Raton, FL: CRC Press.
U. S. Environmental Protection Agency. 2004. Guidelines for Water Reuse. EPA Publication No. EPA/625/R-04/108. Washington, DC: U.S. Environmental Protection Agency.
Washington State Department of Ecology. 2008. Criteria for Sewage Works Design (Orange Book). Publication No. 98-37 WQ. Olympia, WA: Washington State Department of Ecology.
Washington State Departments of Health and Ecology. 1997. Water Reclamation and Reuse Standards. Publication No. 97-23. Olympia, WA: Washington State Departments of Health and Ecology.
Washington State Department of Health. 2009. Water System Design Manual. Publication No. DOH 331-123. Olympia, WA: Washington State Department of Health.
Working Draft 67


![[TR] Invikta WTD [TR] Invikta WTD - URSAN Pompa](https://img.dokumen.tips/doc/110x75/62349ad01ddc377a5c6869f4/tr-invikta-wtd-tr-invikta-wtd-ursan-pompa.jpg)