Embed Size (px)
Citation preview
ENGINEERED BIOFILTRATION FOR
ULTRAFILTRATION FOULING CONTROL AND DBP
PRECURSOR REMOVAL
by
Jamal Azzeh
A thesis submitted in conformity with the requirements
for the degree of Master of Applied Science
Graduate Department of Civil Engineering
University of Toronto
© Copyright by Jamal Azzeh 2014

ii
ENGINEERED BIOFILTRATION FOR ULTRAFILTRATION
FOULING CONTROL AND DBP PRECURSOR REMOVAL
Jamal Azzeh
Master of Applied Science, 2014
Graduate Department of Civil engineering
University of Toronto
ABSTRACT
Recently, treatment plants have adopted biofiltration to compliment conventional treatment
and ozonation. Previous literature has focused on passive applications of biofiltration. In this study,
several pilot-scale biofiltration trains were designed in parallel to conventional treatment to
investigate the impact of nutrient addition (nitrogen and phosphorus), use of hydrogen peroxide,
aluminum sulphate (alum), and different filtration media (anthracite vs. granular activated carbon
(GAC)) on biofiltration performance. Parameters measured included organic removal, reduction
of DBP precursor, improvements in filter runtimes and ultrafiltration (UF) fouling control. Nutrient
addition did not improve biofiltration performance. Supplementing hydrogen peroxide (<1 mg/L)
decreased headloss, DBP formation potentials while adversely affecting UF fouling. In-line alum
addition (<0.5 mg/L) improved biofilter’s ability to control fouling and DBP precursor without
adversely impacting headloss. GAC provided superior performance when compared to anthracite.
Conventional treatment provided higher DOC, and DBP precursor removal, as well as better UF
fouling control compared to biofiltration.

iii
ACKNOWLEDGMENTS
This work was funded by the Natural Sciences and Engineering Research Council of
Canada (NSERC) Chair in Drinking Water Research at the University of Toronto, and by the
Ontario Research Fund (ORF).
I would like to thank my supervisor, Professor R.C. Andrews, for his continuous and
invaluable guidance, support, and encouragement. Also, I would like to extend my thanks to Prof.
R. Hofmann and Prof. S. Andrews in particular and my other course instructors in general. I
sincerely appreciate the assistance of John Armour, Liz Taylor-Edmonds, Sara Sadreddini, Jim
Wang, Isabelle Netto, Mike McKie, Jennifer Lee, Pulin Mondal, Sabrina Diemert, Joshua Elliott
and other members of the Drinking Research Group. My thanks also goes to Giovanni Buzzeo for
the effort in constructing the experimental set-up.
My gratitude to the management and staff at the Peterborough utilities company for their
support, accommodation, and hospitality especially Rene Gagnon, Keven Light, and Graham Bill.
This research would not have been possible without their help.
Finally, to my dear parents, family and friends, thank you for your encouragement, advice
and love which inspires me at every stage of my life.

iv
TABLE OF CONTENTS
ABSTRACT .................................................................................................................................... ii
ACKNOWLEDGMENTS ............................................................................................................. iii
TABLE OF CONTENTS ............................................................................................................... iv
LIST OF TABLES ....................................................................................................................... viii
LIST OF FIGURES ........................................................................................................................ x
NOMENCLATURE .................................................................................................................... xiii
1. Introduction ................................................................................................................................ 1
1.1 Background ......................................................................................................................... 1
1.2 Research Objectives ............................................................................................................ 2
1.3 Description of Chapters ...................................................................................................... 3
2. Literature Review ....................................................................................................................... 4
2.1 Natural Organic Matter (NOM) .......................................................................................... 4
2.2 Biofiltration ......................................................................................................................... 5
2.2.1 Factors Affecting Biofilter Performance ................................................................ 5
2.2.1.1 Contact Time ............................................................................................ 6
2.2.1.2 Water Matrix............................................................................................. 7
2.2.1.3 Filter Media .............................................................................................. 7
2.2.1.4 Temperature .............................................................................................. 8
2.2.1.5 Backwashing ............................................................................................. 9
2.2.1.6 Biological Activity ................................................................................. 10
2.2.1.7 Ozone Pre-treatment and Hydrogen Peroxide Addition ......................... 11
2.2.2 NOM Monitoring Techniques for Biofiltration Studies ....................................... 12
2.2.3 Biomass Quantification and Qualification Methods ............................................. 16
2.3 Biofiltration for UF fouling control .................................................................................. 17
2.4 Coagulation as a Pre-treatment for UF ............................................................................. 18
2.5 Research Gaps and Needs ................................................................................................. 19
3. Materials and Methods ............................................................................................................. 21
3.1 Research Objective ........................................................................................................... 21
3.2 Experimental Configuration .............................................................................................. 21
3.2.1 Biofilter Size and Media Depth ............................................................................ 21
3.2.2 Pilot-scale Plant .................................................................................................... 22

v
3.2.3 Biofiltration Treatment Train ................................................................................ 24
3.2.4 Sampling Locations .............................................................................................. 27
3.2.5 Ultrafiltration Unit ................................................................................................ 28
3.3 Experimental Design ......................................................................................................... 29
3.3.1 Variables ............................................................................................................... 29
3.3.2 Monitored Parameters ........................................................................................... 30
3.3.3 Sampling Time ...................................................................................................... 30
3.3.4 Media Type ........................................................................................................... 31
3.3.5 Chemical Addition ................................................................................................ 31
3.3.5.1 Nutrient Enhancement ............................................................................ 32
3.3.5.2 Hydrogen Peroxide Addition .................................................................. 32
3.3.5.3 Alum Addition ........................................................................................ 32
3.4 Analytical Methods ........................................................................................................... 34
3.4.1 Dissolved Organic Carbon .................................................................................... 34
3.4.2 UV254 ..................................................................................................................... 35
3.4.3 THMs .................................................................................................................... 36
3.4.4 HAAs .................................................................................................................... 39
3.4.5 AOX ...................................................................................................................... 42
3.4.6 ATP Analysis ........................................................................................................ 44
3.4.7 EPS Analysis ......................................................................................................... 45
3.4.8 Nitrogen and Phosphorus ...................................................................................... 49
3.4.9 Chlorine (Cl2) Demands and Residuals ................................................................ 49
3.5 Quality Assurance/ Quality Control (QA/QC) ................................................................. 50
3.6 Statistical Analysis ............................................................................................................ 51
4. Engineered Biofiltration for NOM, DBP Precursor Removal, and UF Fouling Control ......... 53
4.1 Introduction ....................................................................................................................... 53
4.2 Materials and Methods ...................................................................................................... 54
4.2.1 Source Water Quality Parameters ......................................................................... 54
4.2.2 Pilot Configuration ................................................................................................ 55
4.2.3 Ultrafiltration Units ............................................................................................... 55
4.2.4 Experimental Design ............................................................................................. 57
4.2.5 Analytical Methods ............................................................................................... 58

vi
4.2.6 Statistical Analysis ................................................................................................ 59
4.2.7 UF Fouling Quantification .................................................................................... 60
4.3 Results and Discussion ..................................................................................................... 60
4.3.1 Biofilter Acclimation and Activity ....................................................................... 60
4.3.2 Impact of Engineered Biofiltration on Turbidity Removal ................................... 61
4.3.3 Impact of Engineered Biofiltration on NOM Removal ........................................ 62
4.3.4 Impact of Enhancement Strategies on Headloss (LOH) ....................................... 65
4.3.5 DBP Precursor Reduction ..................................................................................... 67
4.3.6 Engineered Biofiltration for Ultrafiltration Fouling Mitigation ........................... 70
4.4 Summary ........................................................................................................................... 74
5. Comparison between Conventional Treatment and Biofiltration for DBP Precursor
Removal and UF Fouling Control ............................................................................................ 76
5.1 Introduction ....................................................................................................................... 76
5.2 Materials and Methods ...................................................................................................... 77
5.2.1 Source Water Quality ............................................................................................ 77
5.2.2 Pilot- and Full-scale Plant Configuration ............................................................. 77
5.2.3 Ultrafiltration Unit and Fouling Quantification .................................................... 78
5.2.4 Analytical Methods ............................................................................................... 78
5.2.5 Statistical Analysis ................................................................................................ 80
5.3 Results and Discussion ..................................................................................................... 80
5.3.1 Biofilter Acclimation and Activity ....................................................................... 80
5.3.2 Turbidity Removal ................................................................................................ 81
5.3.3 NOM Removal ...................................................................................................... 81
5.3.4 Headloss (LOH) .................................................................................................... 86
5.3.5 DBP Precursor Removal ....................................................................................... 88
5.3.6 Ultrafiltration Fouling Mitigation ......................................................................... 90
5.4 Summary ........................................................................................................................... 91
6. Overall Summary, Conclusions and Recommendations .......................................................... 93
6.1 Summary ........................................................................................................................... 93
6.2 Conclusions ....................................................................................................................... 93
6.3 Recommendations ............................................................................................................. 94
7. References ................................................................................................................................ 95

vii
8. Appendices ............................................................................................................................. 109
8.1 Appendix A (Calibration Curves) ................................................................................... 109
8.2 Appendix B (Raw Data) .................................................................................................. 112
8.3 Appendix C (QA/QC) ..................................................................................................... 127
8.3.1 THMs .................................................................................................................. 127
8.3.2 HAAs .................................................................................................................. 129
8.4 Appendix D (Additional Information) ............................................................................ 130
viii
LIST OF TABLES
Table 2.1: The degree of control and impact of factors influencing biofiltration .......................... 6
Table 2.2: LC-OCD fractions ....................................................................................................... 15
Table 3.1: Summary of the characteristics of biofilters in previous studies ................................ 22
Table 3.2: Biofilter conditions ..................................................................................................... 27
Table 3.3: Experimental design ................................................................................................... 33
Table 3.4: DOC analyzer conditions ............................................................................................ 34
Table 3.5: DOC analysis reagents ................................................................................................ 35
Table 3.6: DOC method outline ................................................................................................... 35
Table 3.7: THM instrument conditions ........................................................................................ 36
Table 3.8: THM reagents ............................................................................................................. 37
Table 3.9: THM method outline .................................................................................................. 37
Table 3.10: THM method detection limits ................................................................................... 39
Table 3.11: HAA instrument conditions ...................................................................................... 39
Table 3.12: HAA reagents ........................................................................................................... 40
Table 3.13: HAA method outline ................................................................................................. 40
Table 3.14: HAA method detection limits ................................................................................... 42
Table 3.15: AOX instrument conditions ...................................................................................... 43
Table 3.16: AOX reagents ........................................................................................................... 43
Table 3.17: AOX method outline ................................................................................................. 43
Table 3.18: ATP method outline .................................................................................................. 44
Table 3.19: EPS reagents ............................................................................................................. 46
Table 3.20: EPS method outline .................................................................................................. 46
Table 4.1: Otonabee River raw water quality parameters ............................................................ 54
Table 4.2: Expermintal design for biofiltration pilot ................................................................... 57
Table 4.3: Biopolymer and humic substance removals (%) by biofiltration. .............................. 64
Table 4.4: Average hourly headloss for biofilters during the period of chemical addition ......... 66
Table 4.5: Impact of filter media and biofiltration conditions on performance parameters ........ 75
Table 4.6: Impact of biofiltration, filter media, and chemical addition on reversible and
irreversible UF fouling .................................................................................................................. 75
Table 5.1: ATP concentrations on biofilter and conventional filters media ................................ 81

ix
Table 5.2: DOC removal pre/post pilot conventional filters with alum and PACl, and after
biofiltration ................................................................................................................................... 84
Table 5.3: Impact of biofiltration and conventional treatment on the removal of the variables in
this study ....................................................................................................................................... 92
Table 8.1: Water quality and DOC results (Raw) ...................................................................... 112
Table 8.2: THM and AOX results (Raw) ................................................................................... 116
Table 8.3: HAA results (Raw) ................................................................................................... 120
Table 8.4: Raw ATP and EPS data ............................................................................................ 125
Table 8.5: LC-OCD results (Raw) ............................................................................................. 126
Table 8.6: Sample THMs control chart warning and control limits .......................................... 127
Table 8.7: HAA control chart warning and control limits ......................................................... 129
Table 8.8: DOC concentrations in raw water and biofilter effluent ........................................... 133

x
LIST OF FIGURES
Figure 2.1: Typical LC-OCD diagram with OCD, OND and UV detectors ............................... 14
Figure 3.1: Schematic of the pilot-plant treatment processes showing the conventional treatment
trains and the biofiltration treatment trains. .................................................................................. 23
Figure 3.2: Biofiltration schematic .............................................................................................. 25
Figure 3.3: Photo of the biofiltration set-up at the PWTP showing the large biofilters along with
the conventional filters (right) and the small biofilters (left) ........................................................ 26
Figure 3.4: Sketch showing the water sampling locations at the Peterborough pilot treatment
plant ............................................................................................................................................... 28
Figure 3.5: UF unit schematic (a) and photo (b) .......................................................................... 29
Figure 3.6: DOC concentration and UV254 absorbance in the biofilter effluent after a backwash
....................................................................................................................................................... 31
Figure 3.7: Chemical addition Gantt chart ................................................................................... 33
Figure 4.1: Biofiltration pilot plant schematic ............................................................................. 56
Figure 4.2: ATP concentrations of biofilter media during the experimental period .................... 61
Figure 4.3: DOC removal (%) by biofiltration ............................................................................ 63
Figure 4.4: Protein and polysaccharide concentrations on media ............................................... 66
Figure 4.5: Relationship between ATP, proteins and polysaccharides ........................................ 67
Figure 4.6: DBP formation potentional. Single samples analyzed in duplicate, vertical bars
represent one standard deviation. .................................................................................................. 68
Figure 4.7: DBP removal as a function of biopolymer removal .................................................. 69
Figure 4.8: Normalized UF resistance profile comparing raw water vs large control biofilter
effluent .......................................................................................................................................... 70
Figure 4.9: Normalized UF resistance profile comparing nutrient enahnced vs large control
biofilter effluent ............................................................................................................................ 71
Figure 4.10: Normalized UF resistance profiles comparing 0.1 mg/L in-line alum vs large
control biofilter effluent ................................................................................................................ 72
Figure 4.11: Normalized UF resistance profile showing the impact of 0.25 mg/L in-line alum vs
small control biofilter effluent ...................................................................................................... 72
Figure 4.12: Normalized UF resistance profile the impact of 0.5 mg/L in-line alum vs small
control biofilter effluent ................................................................................................................ 73

xi
Figure 4.13: Normalized UF resistance profile showing the impact of 1 mg/L of peroxide vs the
small control biofilter effluent ...................................................................................................... 74
Figure 4.14: Normalized UF resistance profiles depict the impact of filter media type .............. 74
Figure 5.1: Pilot-plant schematic ................................................................................................. 79
Figure 5.2: Average monthly turbidity trends. ............................................................................ 82
Figure 5.3: Average monthly DOC concentrations. .................................................................... 83
Figure 5.4: Average monthly UV254 values ................................................................................. 85
Figure 5.5: UV254 removal as a function of DOC removal. ......................................................... 84
Figure 5.6: Biopolymer (BP) and humic substance (HS) removals.. .......................................... 86
Figure 5.7: Average hourly filter headloss .................................................................................. 87
Figure 5.8: Typical headloss curves for the biofilter and pilot-plant (alum and PACl) filters
during summer 2003 and winter 2013 .......................................................................................... 87
Figure 5.9: Protein and polysaccharide concentrations for biofilter and conventional filter media
....................................................................................................................................................... 88
Figure 5.10: 24 hour DBP formation potentionals. ..................................................................... 89
Figure 5.11: Normalized UF resistance profile comparing coagulation (29.1-30.1 mg/L alum) to
biofiltration ................................................................................................................................... 91
Figure 5.12: Normalized UF resistance profile comparing coagulation (30.0 mg/L alum) with
filtration to biofiltration ................................................................................................................ 91
Figure 8.1: Sample DOC calibration curve ............................................................................... 109
Figure 8.2: Sample THM calibration curve (June 2013) ........................................................... 109
Figure 8.3: HAA calibration curves (June-September 2013) .................................................... 110
Figure 8.4: Sample PS calibration curve (June 2013) ............................................................... 111
Figure 8.5: Sample Pr. calibration curve (June 2013) ............................................................... 111
Figure 8.6: TCM control chart (June 2013) ............................................................................... 127
Figure 8.7: TCM control chart (July-Nov 2013) ....................................................................... 127
Figure 8.8: BDCM control chart (June 2013) ............................................................................ 128
Figure 8.9: BDCM control chart (July-Nov 2013) .................................................................... 128
Figure 8.10: DCAA control chart (June-Nov 2013) .................................................................. 129
Figure 8.11: TCAA control chart (June-Nov 2013) .................................................................. 129
Figure 8.12: AOX control chart (Sept-Nov 2013) ..................................................................... 130
Figure 8.13: Daily coagulant dose during the study .................................................................. 130
xii
Figure 8.14: Avarage daily raw water tempreture at the peterborough water treatment plant .. 131
Figure 8.15: Average daily DOC concentration in raw water, conventional, biofilter effluent 131
Figure 8.16: Average daily UV254 in raw water, conventional, biofilter effluent ...................... 132

xiii
NOMENCLATURE
˚C Degree(s) Celsius
< Less than
> More than
α Confidence level
1,2 DBP THM internal standard
2,3,5,6 TFBA HAA internal standard
µg/g Micrograms per gram
µg/L Micrograms per liter
Alum Aluminum sulfate
AOC Assimilable organic carbon
AOX Adsorbable organic halogens
ATP Adenosine tri-phosphate
BAC Biologically active carbon
BB Building blocks
BCAA Bromochloroacetic acid
BDCM Bromodichloromethane
BDCAA Bromodichloroacetic acid
BDOC Biodegradable organic carbon
BDOCfast Easily biodegradable organic carbon
BF Biofiltration
BOM Biodegradable organic matter
BP Biopolymers
BW Backwash
C Concentration, initial concentration
C0 Initial concentration
CA Cellulose acetate
CF Conventional filtration
cm Centimetre(s)
C:N:P Carbon: nitrogen: phosphorus ratio

xiv
Coag. Coagulation
D Diameter
d10 Effective diameter
DBAA Dibromoacetic acid
DBCAA Dibromochloroacetic acid
DBCM Dibromochloromethane
DBP Disinfection by-product
DBPFP Disinfection by-product formation potential
DCAA Dichloroacetic acid
DOC Dissolved organic carbon
EBCT Empty bed contact time
EC Expanded clay
EDC Endocrine disrupting compound
EM Emission
EPS Extracellular polymeric substances
EX Excitation
FEEM Fluorescence excitation emission matrixes
FCM Flow cytometry
FSP Peterborough water treatment plant full scale filter 11
g Gram(s)
GAC Granular activated carbon
GC Gas chromatography
GC-MS Gas chromatography – mass spectrometry
GC-ECD Gas chromatography-electron capture detection
H2O2 Hydrogen peroxide
HAA(s) Haloacetic acids
HPC Heterotrophic plate counts
HS Humic substances
kDa Kilo-Dalton
kPa Kilo-Pascal
xv
L Liter
LC-OCD Liquid chromatography-organic carbon detection
LMH Liter(s) per square meter per hour
LMW Low molecular weight
LOH Headloss
m Meter(s)
M Mean
m/h Meter per hour
m-1 1/meter(s)
m2 Squared meter(s)
MCAA Monochloroacetic acid
MBAA Monobromoacetic acid
MDL Method detection limit
MF Microfiltration
mg/L Milligram(s) per liter
mg/mL Milligram(s) per milliliter
min Minute(s)
mL/min Milliliter(s) per minute
mm Millimeter(s)
MTBE Methyl-tert -butyl-ether
NaOCl Sodium hypochlorite
NaOH Sodium hydroxide
NaSO4 Sodium sulphate
NF Nanofiltration
ng/g Nanogram(s) per gram
nm Nanometer(s)
NOM Natural organic matter
NR Not reported
NS Not Sampled, off-line
NTU Nephelometric Turbidity Unit

xvi
OCD Organic carbon detection
OND Organic nitrogen detection
PACl Polyaluminum chloride
pH -log (hydrogen ions concentration)
ppb Particles per billion
PPCP Pharmaceuticals and personal care products
Pr. Proteins
PS Polysaccharides
psi Pound(s) per square inch
PWTP Peterborough water treatment plant
QA/QC Quality assurance/quality control
R Pearson correlation coefficient
R2 Coefficient of determination
RO Reverse osmosis
RW Raw water
SD Standard deviation
SEC Size exclusion chromatography
SEC-OCD Size exclusion chromatography-organic carbon detection
SEM Scan electron microscopy
SL Sample lost
SPE Solid phase extraction
SUVA Specific ultraviolet absorbance (at 254 nm)
SW Settled water
t Student t-test value or student t probability distribution
TBM Tribromomethane
TBAA Tribromoacetic acid
TCAA Trichloroacetic acid
TCM Chloroform
THM(s) Trihalomethane(s)
TMP Transmembrane pressure

xvii
TOC Total organic carbon
UC Uniformity Coefficient
UF Ultrafiltration
UFS UF experiment samples
µg/g Microgram per grams
µL Microliters
UMFI Unified membrane fouling index
UV Ultraviolet
UV254 UV absorbance at 254 nm

1
1. Introduction
1.1 Background
The goal of providing safe and aesthetically pleasing drinking water has been
traditionally accomplished using conventional treatment (coagulation/flocculation/
sedimentation, filtration and disinfection). However, since the early 1980s, detectable
concentrations (low ng/L) of pharmaceuticals, personal care products (PPCPs) and other
emerging contaminates have been observed in drinking water sources and distribution
systems (Richardson and Bowron, 1985; Richardson and Ternes, 2011). Many of these
contaminants are potentially carcinogenic, mutagenic and maybe classified as endocrine
disrupting compounds (EDCs) (Richardson, 2009; Richardson and Ternes, 2011), and
conventional treatment has shown to be ineffective for their removal (Rana et al., 2012).
As well, stricter regulations to control disinfection by-products (DBPs) and other
compounds with possible human health impacts have dictated a need for more advanced
treatment processes (Malievialle et al., 1996). Therefore, the use of membranes have
emerged as a cost effective solution to: i) improve overall water quality, ii) reduce
treatment plant size (Singh, 2006), and, iii) comply with current and potential future
regulations (Plakas and Karabelas, 2012).
In the last decade, low pressure membrane filtration, including microfiltration (MF)
and ultrafiltration (UF), has gained momentum because of its capability of providing high
quality water at competitive cost when compared to conventional treatment (Neubrand et
al., 2010; Wang and Wang, 2006). Low pressure membranes have also been used as pre-
treatment prior to high pressure membranes; nanofiltration (NF) and reverse osmosis (RO)
(Chellam et al., 1997a). However, one of the major limitations of membrane processes is
fouling (Howe and Clark, 2002) which hinders treatment efficiency, damages the
membrane surface, and increases maintenance and operation costs (Singh, 2006). The
fouling rate and type (hydraulically revisable or irreversible) is a function of the
composition of the water matrix, and the foulants’ interaction with the membrane surface
(Peiris et al., 2010b). Metals, salts, colloids, organic matter, and suspended solids have
been identified as the main foulants (Gao et al., 2011). Most of these foulants are

2
hydrophobic and/or carry a surface charge (Henderson et al., 2011; Singh, 2006). However,
studies by others have shown that hydrophilic compounds may also contribute to fouling
(Brinkman and Hozalski, 2011; Kennedy et al., 2005). Fouling may occur by many
mechanisms including adsorption to the membrane surface and pores, and gel formation
(Henderson et al., 2011; Zheng et al., 2010). Older literature identified humic substances
(HS) as the main source of organic fouling (Wang and Wang, 2006). However, more recent
studies have shown that biopolymers, hydrophobic non-humic compounds, and colloids
might be the major source of irreversible organic fouling (Hallè, 2010; Neubrand et al.,
2010; Zheng et al., 2010; Zheng et al., 2012).
Many techniques have been developed to limit fouling including modifying
membrane materials, using pre-treatment methods such as activated carbon, enhanced or
in-line coagulation, and provision of anti-scaling treatment (Huang et al., 2009).
Coagulation has been widely applied as an effective membrane pre-treatment method
(Zheng et al., 2012). However, coagulation involves the addition of chemicals and might
result in severe irreversible fouling (Malievialle et al., 1996; Neubrand et al., 2010; Wang
and Wang, 2006).
Biofiltration presents a cost effective and chemical-free process for fouling control
(Hallé et al., 2009; Huck et al., 2011; Peldszus et al., 2011). Biofilters are simply granular
media filters operated without prior chemical disinfection, which allows microorganism
growth on the filter media and the biodegradation of a portion of the organic matter (Zhu
et al., 2010). Various configurations have been used including bank, slow sand, dual media,
and activated carbon biofiltration (Hammes et al., 2011). Europe has led the use of
biofilters because of their desire to provide high quality water; while in recent years,
biofiltration has become very popular in North America as the tradition of providing high
quality water was adapted (Huck and Sozański, 2008). Recent work has focused on the
active control of biofiltration to improve its performance (Lauderdale et al. 2012).
1.2 Research Objectives
The goal of this research was to optimize the use of biofiltration at pilot-scale to
minimize UF fouling. Specific objectives of the research included:

3
1- To assess the efficiency of biofiltration with respect to natural organic matter
(NOM), DBP precursor and UF foulant removal under a range of operating
conditions: filtration media (GAC vs. anthracite), nutrient addition (phosphorus
and nitrogen), hydrogen peroxide addition, and inline coagulation with
aluminum sulphate (alum).
2- To compare biofiltration to conventional treatment as pre-treatments to improve
UF performance and DBP precursor removal
3- To study the impact of filtration media, nutrient addition, hydrogen peroxide
addition and in-line coagulation on the development of biomass within the
biofilter and on filter runtimes.
1.3 Description of Chapters
Chapter 2: provides background information regarding natural organic matter
(NOM) and biofiltration.
Chapter 3: describes the experimental design, analytical methods, quality control/
quality assurance (QA/QC) procedures, sampling techniques, and data analysis
approach.
Chapter 4: discusses the effectiveness of adding phosphorus, nitrogen, peroxide,
and alum in controlling filter headloss, mitigating UF fouling, and removing DBP
precursors in with respect to pilot-scale study results and findings.
Chapter 5: provides results for pilot- and full-scale experiments, comparing
coagulation with/without filtration and biofiltration for fouling control, DBP
precursor, and NOM removal.
Chapter 6: provides an overall summary of the study and its findings, conclusions
and recommendations.
Chapter 7: contains a list of the references.
Chapter 8: contains appendices including raw data, supplementary figures, tables,
and QA/QC charts.

4
2. Literature Review
2.1 Natural Organic Matter (NOM)
NOM is a complex mixture of organic compounds that result from various aquatic
or vegetational biological processes and is traditionally divided into humics, and non-
humics portions (Barrett et al., 2000). NOM includes a wide variety of compounds that
differ in their physical and chemical properties which complicate their detection and
removal (Leenheer et al., 2000; Yavich et al., 2004). Humic substances (HS) are usually
subdivided into humic and fulvic acids and comprise about 50% of NOM; the other half
encompasses a wide range of compounds such as carbohydrates, amino acids, and
carboxylic groups (Leenheer and Croué, 2003). NOM composition and concentration in
water sources vary spatially and temporally depending on many factors such as climate and
land use (Brinkman and Hozalski, 2011). In general, NOM concentrations increase during
the summer because of higher surface runoff and biological activity (Jarvis et al., 2004).
NOM itself does not present a direct health concern (Hozalski et al., 1999),
however, it can affect overall water quality. NOM reacts with chlorine and other
disinfectants to form disinfection by-products (DBPs) (Chaiket et al., 2002; Richardson et
al., 2007; Wassink et al., 2011), causes microbial regrowth in the distribution system
(Persson et al., 2006; Yang et al., 2011), affects treatment processes efficiency (e.g. reduces
granular activated carbon (GAC) adsorption capacity) (Hozalski et al., 1999), and may lead
to membrane fouling (Howe and Clark, 2002; Huang et al., 2007; Lee et al., 2004; Zheng
et al., 2010).
To a certain extent, NOM removal can be achieved through conventional treatment
processes including coagulation, filtration, biological processes, and adsorption (Jacangelo
et al., 1995). Membranes offer superior and more efficient NOM removal, but are
susceptible to fouling (Brinkman and Hozalski, 2011). Biofiltration has been shown to be
an effective method for NOM removal, especially when considering the easily
biodegradable portion (Hozalski et al., 1999; Huang et al., 2011; Liu et al., 2001).

5
2.2 Biofiltration
Hammes et al. (2011) defined biofiltration as a filtration process where indigenous
bacteria and microorganisms inhabit the filter media and achieve one or more of the
treatment goals. Biofilters are operated without prior chlorination allowing
microorganisms to grow and consume organic matter (Huck and Sozański, 2008). Since
the early 1900s, biofiltration has been applied for drinking water treatment (Zhu et al.,
2010). Different configurations (e.g. rapid sand filters, slow sand filters, and bank
filtration) and media (e.g. sand, anthracite, and GAC) have been used. While slow sand
filters can provide higher NOM removals (10-50%), their application is limited by their
size requirements (2.4 m2 of filter surface area per liter of water produced per day) and
hydraulic loading rates (<0.3 m/h) (Ellis, 1985); bank filtration is also limited by location
(near river and lake banks) and lack of control over the flow rates (function of the soil
permeability and the topography of the area) (Tufenkji et al., 2002). As such, rapid single
and dual media filters have gained much popularity in North America because of their
ability to provide acceptable NOM removal (up to 50% DOC removal) while operating at
higher hydraulic loading rates (>5-7 m/h) (Huck and Sozański, 2008).
Biofiltration has been used for DBP precursor removal, limiting microbial growth
in the distribution system (Van der kooij, 1992; Wert et al., 2008; Yang et al., 2011), taste
and odour control (Elhadi et al., 2006; Srinivasan and Sorial, 2011), nitrification (Wahman
et al., 2011; Wert et al., 2008), pathogens removal (Zhu et al., 2010) and membrane fouling
control (Hallé et al., 2009; Huck et al., 2011; Peldszus et al., 2011).
2.2.1 Factors Affecting Biofilter Performance
NOM removal by biofiltration is influenced by many variables including filter
volume, NOM concentration and composition (Ahmad et al., 1998; Huck and Sozański,
2008; Liu et al., 2001). Huck and Sozański (2008) stated that pre-chlorination, temperature
and operation time are the major factors in determining NOM removal, while other factors
such as the filter media type, contact time, backwashing, NOM composition and
concentration are of less importance. Table 2.1 summarizes both the impact of these factors
and the degree of control over them (Huck and Sozański 2008)

6
Table 2.1: The degree of control and impact of factors influencing biofiltration (Adapted
from Huck and Sozański, 2008)
Parameter Degree of Control Effect
Media type H M
Chlorination M H
Filtration Rate (EBCT) M M
Backwashing method H M
NOM loading L M
Temperature N H
Time since start up N H
(H= high, M= moderate, L= low, N=none)
Other studies reported that the type of microorganisms growing on the biofilter
media (McDowall et al., 2009; Zhang et al., 2011a) and the amount of essential nutrients
in the biofilter effluent (Boon et al., 2011; Lauderdale et al., 2012; Vahala et al., 1998) can
also influence biodegradation of organics. The following presents a discussion of these
factors and their impacts on biofilter performance.
2.2.1.1 Contact Time
Contact time is an important factor in determining NOM removal during
biofiltration (Elhadi et al., 2006; Liu et al., 2001) because it affects the amount of organic
carbon that is adsorbed and biodegraded by the biofilm (Huck and Sozański, 2008). Contact
time maybe expressed as empty bed contact time (EBCT) as shown in equation 2.1.
𝐸𝐵𝐶𝑇 =𝐸𝑚𝑝𝑡𝑦 𝐵𝑒𝑑 𝑉𝑜𝑙𝑢𝑚𝑒 (𝑚3)
𝐹𝑙𝑜𝑤 𝑟𝑎𝑡𝑒 (𝑚3
𝑚𝑖𝑛)
(2.1)
The EBCT varies by the filter type and operating conditions; however, rapid dual
media filters are usually operated with an empty bed contact time of 5 to 20 min (Hammes
et al., 2011). EBCT impact varies on different NOM measurements; Yavich et al. (2004)
found that an EBCT of approx. 20 min is required to remove the easily biodegradable
dissolved organic carbon (BDOCfast) following ozonation, and that the required EBCT
varied by the water source and the ozone dose (from 0.5 to 3 mg/L). Carlson and Amy
(2001) reported the optimum EBCT for DOC removal to be 5.5 min. Wert et al. (2008)

7
observed that increasing a pilot-scale biofilter (diameter (D) =25.4cm) EBCT beyond 3.2
min by increasing the filter depth from 53 to 183 cm or increasing the filtration rate from
4.8 to 14.6 m/h did not affect assimilable organic carbon (AOC) removal. Also, Hozalski
et al. (1995) found that the difference in total organic carbon (TOC) removal in a bench-
scale sand biofilters operated at EBCT 4, 10 and 20 min was statically insignificant
(α=0.05). In contrast, Hallé et al. (2009) found that increasing the biofilter’s EBCT from 5
to 14 min prior to UF membrane increased biopolymer removal (initial concentration
(C0)=0.09-0.53 mg/L) by 21% on average, and lowered the membrane’s irreversible
transmembrane pressure (TMP) development rate by approximately 70%.
2.2.1.2 Water Matrix
Biofilter influent quality and composition impacts NOM removal; some studies
have shown that a biofilter’s ability to remove organics varies by water source (Hammes
et al., 2011; Yavich et al., 2004). Persson et al. (2006) found linear correlations between
the concentrations of the biologically degradable organic carbon (BDOC) and AOC in the
biofilter effluent to their removal (R=0.8 and 0.5, respectively).
Liu et al. (2001) reported that the presence of 3 mg/L of alum residual or 1.5 mg/L
of clay (particles) in a bench-scale anthracite/sand and granular activated carbon
(GAC)/sand biofilters (D=50 mm, 0.7 m deep, and EBCT= 5.6 min) influent had an
insignificant impact (95% confidence) on the degradation of acetate (C0=300 μg/L),
formate (C0=400 μg/L), formaldehyde (C0=100 μg/L), and glyoxal (C0=30 μg/L). Influent
pH is another important parameter in determining organics removal since it can affect
microorganism growth and activity (Rittmann, 2001); Egashira et al. (1992) found a pH of
7 to 9 to be optimal for MIB removal.
2.2.1.3 Filter Media
Many studies have explored the use of different filtration media to improve biofilter
performance. Sand, anthracite, and GAC have been intensively studied (Dussert and
Tramposch, 1997; Emelko et al., 2006; Liu et al., 2001). Most of the studies found that
GAC and anthracite biofilters provided similar TOC and biodegradable organic matter
(BOM) removal (α=0.05) at 20-25˚C (Emelko et al., 2006; Liu et al., 2001); however, GAC

8
provided higher TOC and AOC removal (up to 100% more than anthracite) at low
temperatures (1-10 ˚C), when lab and pilot-scale biofilters were backwashed with water
containing 0.5 to 1 mg/L chlorine residual, and during the filter start-up (Dussert and
Tramposch, 1997; Emelko et al., 2006). The reason behind GAC superiority as biofilter
media is the high surface area (>1000 m2/g) and the porous nature (pores volume >0.15
cm3/g) of its particles which support microorganisms’ attachment and growth (Dussert and
Tramposch, 1997; Klymenko et al., 2010). Also, microorganisms have better adhesion to
GAC because they adsorb to its surface and pores which protects them from detachment
during backwash (Hammes et al., 2011; Zhu et al., 2010). Liu et al (2001) reported that
GAC is capable of supporting twice the phospholipids mass in comparison to an
anthracite/sand filter at 20 C. Likewise, many researchers have hypothesized that the GAC
superior performance may be explained by the bio-regeneration of GAC: microorganisms
consume NOM attached to GAC, which reactivate the adsorption sites for binding with
new compounds (Velten et al., 2011a; Zhu et al., 2010). Other materials such as expanded
clays (EC), ceramics and plastics have been used as a filtration media (Okei et al., 2009);
Persson et al. (2006) found that GAC and expanded clay (EC) biofilter were able to remove
34 % and 30 % of BDOC (C0= 1.06 ± 0.25 mg/L), respectively.
2.2.1.4 Temperature
Studies have shown that TOC, AOC, BDOC, and organic compound removals were
reduced at low temperatures (<10˚C) (Andersson et al., 2001; Liu et al., 2001; Moll et al.,
1999). Liu et al. (2001) noticed a reduction in acetate removal (C0 = 300 μg/L) from approx.
80% to 50% in bench-scale anthracite/sand biofilter (backwash contained 0.5 mg/L
chlorine residual) when the temperature decreased from 20 to 5˚C, but the removal in the
GAC/sand biofilter remained constant at approx. 80%. However, Emelko et al. (2006)
found the difference between TOC and oxalate removal in low (1-3˚C) and warm (21-25˚C)
temperatures to be statically insignificant (α=0.05) for both GAC and anthracite biofilters.
Moll et al. (1999), in a bench-scale study, observed constant TOC, BDOC and AOC
removals (24%, 60%, and approximately 55% respectively) between 20 and 35˚C;
however, at 5˚C, the removals decreased to 15%, 38%, and 43%, respectively, for initial
concentrations of 4±0.3, 1.6±0.2 and 1.4±0.18 mg/L, respectively. These reductions were

9
associated with changes in the microbial species from positive gram and sulphate reducing
bacteria to negative gram bacteria. Hallé et al. (2009) noted a reduction in the biopolymers
removal (C0= 0.09-0.53 mg/L) in biofiltration (EBCT= 10 min) from approx. 70% to 35%
when the temperature decreased from 10-25˚C to 1-4˚C between warm (April to
September) and cold (October to March) months. Velten et al. (2011a) stated that the lower
temperature in their study (7 ˚C) compared to others (9-20˚C) caused lower microbial
growth rate, (0.0001-0.0043 h-1) vs. (0.038-0.16 h-1).
2.2.1.5 Backwashing
The effect of using chlorine and/or air scour during backwashing on NOM removal
varies widely between different studies. Urfer (1998) observed a decrease in acetate (C0=
300 µg/L) and formate (C0= 400 µg/L) removals from approx. 90% to 40% when 1 mg/L
free chlorine was present in the biofilter backwash. Miltner et al. (1995) reported that 1
mg/L free chlorine in the backwash reduced TOC removal (C0= 1.1-2.2 mg/L) from 21%
to 16% on average and decreased trihalomethanes (THMs) and haloacetic acids (HAAs)
formation potential (at 7 days) removal (C0 not reported) from 43% and 27% to 29% and
15%, respectively. However, in later studies, Wert et al. (2008) found that 1.5 mg/L free
chlorine in the backwash did not impact AOC removal (C0 = 475±45 µg/L) in a pilot-scale
biofilter; which is in agreement with Liu et al. (2001) bench-scale studies where they
showed that 0.5 mg/L free chlorine in the filter backwash did not reduce BOM removal.
Emelko et al. (2006) found that using air scour and collapse pulsing during
backwash had an insignificant impact (α=0.05) on TOC removal (C0= 5-7 mg/L), which is
in agreement with Wert et al. (2008). Zhu et al. (2010) stated that backwashing is necessary
to preserve the steady-state condition (constant AOC, BDOC, or specific compound
removal) and avoid filter clogging. In a model proposed by Rittmann et al. (2002), it was
shown that 27% of the biomass was removed during backwash while BOM removal
(C0=2.3 mg oxygen demand/L) remained constant at 80%. In a recent study, Huck et al.
(2011) found that the standard backwashing procedure (collapse-pulsing with 50% bed
expansion) increased the TMP development rate of a UF unit downstream of the biofilter
directly after the backwash (no values reported); by eliminating air scour, they were able
to maintain a constant TMP development rate.

10
2.2.1.6 Biological Activity
Biological activity in a biofilter is controlled by the species of microorganisms
present, time from start-up, and the concentration of the nutrients (e.g. carbon,
phosphorous) in the filter influent. Biofilter microorganisms consist mostly of prokaryotes
(Moll et al., 1998), and are subjected to indigenous conditions (Hammes et al., 2011). Many
studies have attempted to characterize and classify microbial communities within biofilters
(Boon et al., 2011; Moll et al., 1998; Zhang et al., 2010; 2011a; Zheng et al., 2011);
however, their findings varied in terms of the dominant microbial species and relative
abundance. Yang et al. (2011) identified beta-proteobacteria as of the dominant species in
a full-scale biofilter (Cheng-Ching Lake, China) and hypothesized that they were
responsible for AOC removal. Zhang et al. (2011a) reported the dominant bacterial species
in a pilot-scale biological activated carbon (BAC) biofilter to be pseudomonas sp, bacillus
subtilis, and nitrospira sp. Bacillus species were also identified by Zhang et al. (2010) in a
bench-scale BAC biofilter and were hypothesized to be responsible for degrading a wide
range of organic compounds including polysaccharides which are considered a major UF
foulant (Hallé et al., 2009). McDowall et al. (2009) reported higher geosmin removal (up
to 75% in the inoculated biofilter in comparison to 25% in control) when they seeded
bench-scale biofilters (D= 2.5 cm, height= 15 cm) with previously isolated and cultured
geosmin degrading bacteria (sphingopyxis sp., novosphingobium sp. and pseudomonas
sp.); however, their experiment was run for a short time (12-16 days) and their approach
was not verified by other studies.
A carbon: nitrogen: phosphorus (C:N:P) ratio of 21:5:1 by weight has been reported
as being required for optimal bacterial growth; however this ratio is not typically attained
in a biofilter influent (Liu et al. 2001). Some studies have shown phosphorus to be the
limiting nutrient (Sang et al., 2003); moreover, Lauderdale et al. (2012) observed a 15%
decrease in headloss and a 75% increase in DOC removal (C0= 3.6±0.1 mg/L) when a
C:N:P stoichiometric ratio in a pilot-scale biofilter influent (D= 15.24 cm, height= 1.22 m)
was adjusted to more than 100:10:2.
Time to reach steady-state in terms of stabilizing the microbial community is also
a factor in controlling NOM removal. Velten et al. (2011a) reported that a consistent DOC

11
removal of 22% (C0=1.1±0.04 mg/L) and ATP biomass concentration (0.8-1.83×10⁻³ g
ATP/g GAC) was reached after 90 days in a pilot-scale GAC biofilter (D=1.1 m, height=
1.55 m). In their review, Hammes et al. (2011) reported that filter start-up periods varied
between different studies from 2 to 8 months. Zhang et al. (2011a) found that 9 months
were required to develop a stable microbial community and reach steady-state conditions.
Wert et al. (2008) observed a variation in the time required to achieve constant removals
of different NOM measurements (e.g. 75 days for AOC, 155 days for formaldehyde). Liu
et al. (2001) found that reaching steady-state conditions varied with respect to compound,
temperature and filter media; furthermore, at 20℃, 20 days were required to reach steady
removal of easily biodegradable BOM (acetate, formate, formaldehyde) in comparison to
40 days for non-easily biodegradable BOM (glyoxal) in both GAC and anthracite biofilters.
Similarly, at 5℃, the results did not vary for the easily biodegradable compounds in both
media; however, glyoxal was not removed by the anthracite filter at this temperature and
required 60 days to reach steady-state removal in GAC.
2.2.1.7 Ozone Pre-treatment and Hydrogen Peroxide Addition
The combination of ozone and biofiltration is widely used in drinking water
treatment because biofiltration can limit regrowth potential resulting from increased AOC
and BDOC concentrations during ozonation (Hozalski et al., 1999; Persson et al., 2006).
In a full-scale study, Yang et al. (2011) observed that AOC concretions increased by 57%
during ozonation and decreased by 83% following BAC. Yavich et al. (2004) reported an
increase in BDOC concentration by 200-240% in river water when they applied an ozone
dose of 0.5 to 1 mg O3/mg carbon. However, when the same dose was applied to lake water,
no increase in BDOC was observed. This suggests that the ozone effect varies by water
source and ozone dosage, which is in agreement with Hozalski et al. (1999) bench-scale
studies and computer model. Carlson and Amy (2001), in bench and pilot-scale studies,
found the optimum ozone dose for different water sources to be between 0.4-0.6 O3/DOC,
which approximated a typical disinfection dose required for 3-log cryptosporidium
inactivation.
Urfer and Huck (2000) did not observe a change in BOM removal (acetate and
formate removal remained >95%) when a 0.1-0.2 mg/L ozone residual or 0.5 mg/L
12
hydrogen peroxide residual was present in the influent water of a lab-scale anthracite/sand
biofilter (D= 50 mm, height= 70 cm). However, Boon et al. (2011) attributed a 30%
decrease in the biomass at the top 10 cm of a biofilter to the presence of 0.22 mg/L ozone
residual in a pilot-scale GAC biofilter influent (D= 1.1 m, height= 1.55 m). Lauderdale et
al. (2012) reported the addition of 1 mg/L hydrogen peroxide to filter influent decreased
headloss by 66% while maintaining DOC removal at 15±3%. No peroxide residual was
detected in the biofilter effluent (< 0.1 mg/L) when 1 mg/L hydrogen peroxide was added
prior to biofiltration (Lauderdale et al., 2012; Urfer and Huck, 1997).
2.2.2 NOM Monitoring Techniques for Biofiltration Studies
Researchers have developed different methods to monitor the concentrations of
NOM in water. TOC, DOC, and UV absorbance at 254 nm (UV254) were traditionally used
for this purpose and are still commonly employed. TOC is measured by oxidizing the
sample through combustion at 600-800℃ and then measuring carbon dioxide produced
using an infrared detector (Qian and Mopper, 1996). Similarly, DOC is measured by the
same technique but after passing the sample through 0.45 μm filter (Qian and Mopper,
1996). Hallé et al. (2009) noted that DOC removals are not a good indication of the
performance of the biofilter as a pre-treatment for membranes, as the removals did not vary
with EBCT. However, in most biofiltration studies DOC has been utilized as a general
measure of NOM removal. UV254 has been used to measure the concentration of the
aromatic compounds in water. Specific UV absorbance (SUVA) is the ratio of UV254 to
DOC, and it is used as a measure of the aromaticity of the organic carbon in water. SUVA
values above 4 are associated with hydrophobic NOM whereas values less than 3 are
associated with hydrophilic NOM (Matilainen et al., 2011).
The previously mentioned techniques are not representative of the biodegradation
process in biofiltration as they describe only the chemical nature of the organic compounds
and not their tendency to be metabolized. Therefore, biological techniques such as AOC
and BDOC have been developed to measure the biodegradable portion of NOM. AOC
correlates the growth of test organisms (pseudomonas fluorescens P17 and spirillum NOX)
to the concentration of easily biodegradable (assimilable) NOM; whereas BDOC measures
the consumption of DOC by a biofilm, grown on glass beads or filter media, to estimate

13
the biodegradable DOC (Escobar and Randall, 2001). AOC and BDOC concentrations in
drinking water sources have been reported to range between 0-9% (Leenheer and Croué,
2003) and 0-40% (Escobar et al., 2000) of TOC, respectively. Unlike AOC, BDOC mimics
the biofilm processes since it stimulates the biodegradation of complex compounds (i.e.
enzymatic biodegrading). However, both techniques are laborious and time consuming
(AOC, 2-14 days and BDOC, 3-5 days) (Hammes et al., 2011). Velten et al. (2008) stated
that AOC is an inadequate measurement of NOM removal since it only presented 35% of
DOC removed during biofiltration and suggested the use of BDOC instead.
Methods to fractionate NOM by hydrophobicity, size and photonic characteristics
provide researchers with the ability to identify components of organic carbon and to tackle
concerns related to specific NOM components (Matilainen et al., 2011). For example,
biopolymers as identified by liquid chromatography-organic carbon detection (LC-OCD),
as well as colloids and protein-like substances as identified by fluorescence excitation-
emission matrices (FEEM) were found to be responsible for UF fouling, and have been
shown to be readily removed by biofiltration (Hallé et al. 2009; Peldszus et al. 2011).
Polymeric adsorbents maybe used to fractionate NOM based on hydrophobicity
(Matilainen et al., 2011). Chow et al. (2004) was able to fractionate NOM as; i) very
hydrophobic, ii) slightly hydrophobic, iii) charged hydrophilic, and iv) neutral hydrophilic
acids by using three consecutive resins (DAX-8, XAD-4, and IRA-958). The
hydrophobicity of NOM can impact its removal by biofiltration and affect the degree of
fouling. For example, BDOC, which can be removed by biofiltration was correlated with
charged hydrophilic (R2= 0.78-0.87) and neutral (R2= 0.88) fractions of DOC (Tihomirova
et al., 2010). Hydrophobic NOM was found to responsible for membrane fouling (Drioli,
2009). Chen et al. (2011) found that BAC (height= 1.5 m, and flow rate= 4 m/h) after
ozonation was capable of reducing the hydrophobic (C0 approximately 1.5 mg/L) and
hydrophilic (C0 approximately 1.5 mg/L) carbon by 29% and 22%, respectively. Removals
of hydrophilic and hydrophobic fractions were attributed to biodegradation and adsorption,
respectively. Also, Tian et al. (2009) reported biologically activated carbon (D= 6 cm,
height= 1 m) to be more effective for the removal of hydrophobic neutrals, hydrophobic
acids, and hydrophilic NOM (4 to 14% higher) when compared to a membrane bioreactor.

14
Another method that is used to characterize NOM is liquid chromatography-organic
carbon detection (LC-OCD), which is a variant of size exclusion chromatography (SEC)
where the SEC column leads to a non-destructive UV analyzer (at 254 nm) and a
destructive organic carbon detector (OCD). NOM is oxidized to carbon dioxide in a
Grantzel thin-film reactor and measured by an infrared detector (Baghoth et al., 2009;
Huber and Frimmel, 1994). LC-OCD fractionates NOM into the components shown in
Table 2.1 (Huber and Frimmel, 1994; Penru et al., 2011). A typical LC-OCD
chromatogram is shown in Figure 2.1 (Huber et al., 2011a). Organic nitrogen detection
(OND) can be coupled with OCD to identify proteinic matter within each fraction
(Henderson et al., 2011; Huber et al., 2011a).
Figure 2.1: Typical LC-OCD diagram with OCD, OND and UV detectors (A=
biopolymers, B= HS, C= building blocks, D= LMW acids, E= LMW neutrals) (after Huber
et al. (2011a))

15
Table 2.2: LC-OCD fractions
Fraction
Molecular weight
(kDa) (Penru et al.,
2011)
Compounds (Huber et al.,
2011b)
Biopolymers >10-20 Polysaccharides, proteins or
amino sugars
HS 0.8-1 Humic and fulvic acid
Building blocks 0.35-6 HS breakdown products
Low molecular weight
(LMW) acids <0.35 Not applicable
LMW neutrals <0.35 LMW alcohols, aldehydes,
ketones, sugars, and amino acids
Hydrophobic organic carbon Not applicable Not applicable
Fluorescence excitation-emission matrices (FEEM) analysis is a relatively new
method of representing organic matter that has the potential of being integrated on-line to
provide real-time measurement of NOM fractions (Peiris et al., 2010a; Stedmon et al.,
2011). FEEM can be used to differentiate protein-like, tyrosine-like, humic-like, fulvic-
like, and colloidal matter (Matilainen et al., 2010). Peiris et al. (2010a) utilized FEEM and
principle component analysis to identify three fouling components: humic-like substances,
protein-like substances, and collides/ particulate matter. Using the same approach,
Peldszus et al. (2011) correlated the concentration of protein-like substances in a UF
membrane feed to irreversible fouling (R2= 0.87-0.96) when TMP was less than 6 psi. They
reported that protein-like substances can be reduced by biofiltration (no values reported),
and that their removal was found to be increasing with increasing EBCT (Peldszus et al.
2011).
The previously described techniques can also be used in tandem for further
characterization of NOM. Penru et al. (2011) utilized LC-OCD following resin
fractionation to determine the hydrophobicity of different NOM fractions. A similar
approach was applied by Kennedy et al. (2005) where they attributed irreversible fouling
to hydrophilic colloidal matter (mainly polysaccharides).
Other techniques such as mass spectrometry and membrane filtration are available
for NOM characterization but their use is limited because they require method

16
development, may damage the organic compounds, and lead to false results (Matilainen et
al., 2011).
LC-OCD and FEEM appear to be the most promising techniques in recent
biofiltration studies (Peldszus et al., 2011). Attempts to correlate their fractions (e.g.
biopolymers) with fouling and removal by biofiltration were successful (Hallé et al. 2009;
Peldszus et al. 2011). However, these correlations were not tested on different water
matrices, and recent research has shown no correlation between biopolymer concentrations
and irreversible fouling across different water matrices in Ontario (Croft, 2012).
2.2.3 Biomass Quantification and Qualification Methods
Many researchers have developed techniques to quantify and qualify the
microorganisms in biofilters (Zhu et al., 2010). Biomass measurements provide an insight
regarding the development of microbial communities within the biofilter and assist in
identifying and diagnosing potential problems (Hammes et al., 2011). Many biomass
monitoring methods have been used, such as heterotrophic plate counts (HPC),
phospholipids and scan electron microscopy (SEM). These measurements can be applied
either to the biofilter effluent or directly to the filter media.
Measuring biomass in biofilter effluent is preferable to measuring it on the filter
media since it does not involve disturbing the biofilter bed and can sometimes be integrated
on-line (e.g. Flow cytometry (FCM)) (Hammes et al., 2011). Plate counts, particle counts,
and ATP analysis are the three main techniques used to measure the biomass in the filter
effluent. HPC measures the number of cells after cultivating bacteria isolated from a
sample (for 2 to 5 days) (Allen et al., 2004). It is a widely accepted measure for microbial
regrowth potential in the distribution system, and is used for regulatory purposes in some
countries (Allen et al., 2004). A viable alternative for HPC is the use of cell counters, which
can yield faster measurements as they do not require cultivation (Wu et al., 2008). Also,
microscopy can be used to characterize the bacteria in terms of shape, size and even species
(Hammes et al., 2008; Wang et al., 2010). Adenosine triphosphate (ATP) analysis measures
the concentration in a water sample using a luminometer following the addition of an
enzyme reagent and buffer (Magic-Knezev and van der Kooij, 2004; Velten et al., 2007).

17
ATP analysis is faster than HPC, less expensive than cell counts, and can be correlated to
both HPC and cell counts (Siebel et al., 2008). However, one of the major drawbacks of
this method is that it does not yield any specific information regarding the cell size or
properties, and that it has not been widely used in biofiltration studies (Hammes et al.,
2008).
Biomass on filter media can be measured using different methods including
phospholipids and microscopy (Hammes et al., 2011). The most widely used method is
phospholipids which measures bacterial membrane constituent absorbance at 610 nm after
adding a reagent and a buffer to separate the biomass from the media (Wang et al., 1995).
ATP analysis can also be used on sample media after isolating the biofilm by chemical or
physical means. Phospholipids are considered to be a more direct measurement of the total
biomass; however, unlike ATP they are not indicative of the active biomass which is more
of an interest in biofiltration studies (Hammes et al., 2011). NOM removal was not found
to be correlated to the concentration of the biomass in terms of adenosine triphosphate
(ATP) (R2=0.03 for AOC) (Velten et al., 2011a) or phospholipids (R=0.1 for AOC and
BDOC) (Persson et al., 2006). In addition, microscopic methods has been used to
characterize the microbial communities and their distribution on the biofilter media but
their use is limited due to their high cost and complexity of their results (Madrid and Felice,
2005). Other methods such as the biomass activity and uptake of labelled substances are
also available but are not widely used due to their time requirement (5 hours to days) and
laborious nature (Urfer and Huck, 2001).
2.3 Biofiltration for UF fouling control
The concept of applying biofiltration as a UF membrane pre-treatment to reduce
organic fouling has been reported by others (Basu and Huck, 2004; Hallé et al., 2009; Huck
et al., 2011). Moreover, Tsujimoto et al. (1998) utilized a pilot-scale biologically active
carbon, with a media depth of 1 m and EBCT of 6 min, to treat water prior to a cellulose
acetate UF. They found that it could operate for 80 days before reaching a limiting TMP
of 80 kPa. Basu and Huck (2004) observed a reduction in the cleaning frequency of a
hollow fibre UF (defined by TMP exceeding 28 psi) from 53 to 28 days in one run and
from 69 to 56 days in the other when a bench-scale anthracite/sand biofilter (depth= 0.8 m,

18
EBCT of 22 min) was used as a pre-treatment. Mosqueda-Jimenez et al. (2008) reported
that using bench-scale anthracite/sand biofilter with an EBCT of 35 min prior to UF
decreased the decline in membrane permeability from 56% to 11% at 5500 L/m2 permeate
volume. Hallè et al. (2009) observed a TMP decrease from approximately 9 psi at permeate
volume of 2000 L/m2 to approximately 4 psi and approximately 1.2 at 7500L/m2 when
applying biofiltration with EBCT of 5 and 15 min, respectively to pre-treat a hollow fiber
UF. Zhang et al. (2011b) reported that combining biofiltration in conjunction with
coagulation maintained the TMP after 144 hours of operation at approximately 17 kPa in
comparison to approximately 24 kPa when coagulation was applied alone (EBCT not
reported). Peldszus et al. (2012) found that pilot-scale biofilters operated at 5, 10 and 15
min EBCTs were effective for fouling control even at low temperatures (1-25℃). However,
Geismar et al. (2012) used a lab-scale BAC (EBCT=11 min) post ozonation to evaluate its
impact on the unified membrane fouling index (UMFI), a recent method to quantify
reversible and irreversible fouling, and found that the biofilter effect on UMFI following
ozonation to be statically insignificant (α=0.05).
2.4 Coagulation as a Pre-treatment for UF
Coagulation enables the destabilization of particles by different mechanisms (e.g.
charge neutralization, and sweep flocculation) to facilitate the formation of bigger particles
that can be removed by settling or filtration (Crittenden et al., 2012). Coagulation has been
shown to be effective for removing NOM and DBP precursors (Matilainen et al., 2010).
Enhanced coagulation aims to maximize particles, TOC, and DBP precursor removals
while minimizing coagulant residual and sludge production (Edzwald and Tobiason, 1999).
Polyaluminum Chloride (PACl) can provide similar performance to alum at lower
coagulant dosages while being temperature independent (Van Benschoten and Edzwald,
1990). Different coagulation configurations have been applied as UF pre-treatment
including coagulation/flocculation with/without sedimentation (Crittenden et al., 2012),
and in-line coagulation (Neubrand et al., 2010; Wang and Wang, 2006; Zheng et al., 2012).
Some studies have observed an improvement in UF fouling mitigation when alum is used
as a pre-treatment (Choi and Dempsey, 2004; Li et al., 2013) while others did not (Howe
and Clark, 2006; Neubrand et al., 2010). Howe and Clark (2006) observed that enhanced

19
coagulation was effective for fouling mitigation but an adverse effect was observed at
lower doses. Wray et al. (Wray et al., 2014) did not observe an improvement when applying
coagulation (<15 mg/L alum, below enhanced dosages) as a pre-treatment for UF
membranes and found the point of diminishing return for biopolymer removal to be 0.1
mg/L.
2.5 Research Gaps and Needs
Biofiltration as pre-treatment to UF membrane has been previously explored as
discussed earlier. The results of these studies show that biofiltration is a promising
technique for fouling control; however, more work needs to be done to verify this potential,
to optimize biofiltration conditions, and to explore strategies to control and enhance
specific foulant removal. Also, a detailed evaluation of the process and its mechanism using
a range of water matrixes and membrane modules have not been conducted (Hallè, 2010).
In addition, a parallel comparison to other pre-treatments (e.g. coagulation, GAC) has not
been performed (Peldszus et al., 2012).
Active application of biofiltration including the use of nutrient and hydrogen
peroxide addition, pre-ozonation, and pre-aeration on the biofilter ability to limit UF
fouling has not been examined. Previous studies have shown that GAC can be more
effective than anthracite as a biofiltration media especially at low temperatures (< 3 ℃)
(Emelko et al., 2006); a study to compare GAC and anthracite as biofiltration media to
reduce ultrafiltration fouling is needed. Lauderdale et al. (2012) found that adjusting the
C:N:P ratio to beyond 100:10:1 increased DOC removal by 75 % but they did not report
the impact of this procedure on foulants (e.g. biopolymers) or DBP precursors. Also, the
impact of applying hydrogen peroxide for extended durations on fouling precursor removal
has not been evaluated.
The combination of biofiltration and in-line coagulation may offer superior fouling
control at a lower cost when compared to coagulation or biofiltration separately (i.e. lower
coagulant dose, lower EBCT, and/or longer membrane operation time). Moreover,
biofiltration has been shown to be effective for the removal of biopolymers (61 ± 22 % at
EBCT of 15 min), but not HS (e.g. 7% HS removal when biopolymer removal was 86%)

20
(Hallé et al., 2009; Nguyen and Roddick, 2010). However, coagulation has been shown to
be effective for HS removal (e.g. in-line coagulation improved the removal of natural
humic acid (<1 kDa) by UF from 6.1% to 59.3%) (Wang and Wang, 2006). Therefore, their
combination has the potential to offer higher DOC removal, and better fouling control.
Also, it may be more practical and convenient to adjust the coagulant dose as opposed to
the EBCT during severe fouling events (e.g. increased NOM or turbidity) or when
biological activity is suppressed at cold temperatures (< 10℃). Therefore, the application
of coagulation prior to or following biofiltration may impart more control and flexibility in
operation especially at low coagulant dosages (< 0.5 mg/L) which could be explored prior
and post biofiltration to improve fouling mitigation.
In terms of ultrafiltration, the correlation between biopolymer concentrations and
irreversible fouling has not been well established. Croft (2012) was able to correlate
biopolymers concentration in different source waters in Ontario, Canada to reversible
fouling but was not able to reach the same conclusion for irreversible fouling. These results
indicate that biopolymer composition and properties might alter its effect on fouling. This
problem needs to be addressed by further characterization of biopolymer properties which
can be achieved through using a different detection method following size exclusion
chromatography (such as FEEM) (Matilainen et al., 2011; Wu et al., 2003), or by using
resin fractionation prior to LC-OCD (Penru et al., 2011). FEEM may also provide insight
into the nature of the LC-OCD fractions (e.g. protein-like biopolymers); also, resin
fractionation can be used to further characterize LC-OCD fractions based on their
hydrophobicity. Additionally, the interaction of biopolymers with other water constituents
(e.g. turbidity, and particulate matter) need to examined.

12
3. Materials and Methods
3.1 Research Objective
The goal of this research was to explore the effectiveness of biofiltration and enhancement
strategies (i.e. nutrient enhancement (phosphorus and nitrogen), in-line coagulation, and hydrogen
peroxide (H2O2) addition) in terms of natural organic matter (NOM) removal (DOC, LC-OCD
fractions), disinfection by product (DBP) precursor reduction (formation potential of THMs,
HAAs, and AOX), ultrafiltration (UF) fouling control, and filter runtimes improvement (headloss
(LOH) reduction). This will be achieved by; i) supplementing phosphorus and nitrogen as a
function of DOC removed (i.e. adjusting the carbon to nitrogen to phosphorus (C:N:P) ratio), ii)
adding hydrogen peroxide (H2O2), and iii) varying the biofilter media type (granular activated
carbon (GAC) vs. anthracite) for Otonabee river water, Peterborough, ON. Finally, the impact of
in-line coagulation (0.1-0.5 mg/L alum with rapid mixing and no flocculation) prior to biofiltration
was evaluated for each of the measured parameters. A side-by-side pilot- and full-scale comparison
between biofiltration and conventional treatment was also conducted.
3.2 Experimental Configuration
3.2.1 Biofilter Size and Media Depth
To select the diameter (D) of a biofilter column, two considerations should be taken into
account; firstly, the amount of water available for filtration, and secondly, minimizing the wall
effects. Table 3.1 summarizes the dimensions and flow rates of biofilters used in previous pilot-
scale biofiltration studies. Some lab- and pilot-scale studies have utilized columns with 5-6 cm
internal diameter as biofilters (Elhadi et al., 2004; Tian et al., 2009); while others such as the ones
shown in Table 3.1 used internal diameters of up to 25.4 cm. The selection of a diameter within
the range of these studies should be adequate. For the current research, two sizes of biofilters were
selected; a large diameter (D= 15.24 cm (6 in)) which will be used for the purpose of comparing
biofiltration with or without nutrient (nitrogen and phosphorus) enhancement to conventional
filtration, and a small diameter (D= 7.62 cm (3 in)) which will be used for the evaluation of
different enhancement strategies (more discussion is provided later). The media depth and

22
configuration was matched to the conditions in the Peterborough pilot-scale conventional drinking
water plant.
Table 3.1: Summary of the characteristics of biofilters in previous studies
Study Diameter
(cm)
Media
Type
Depth
(cm)
Sand
Depth
(cm)
Gravel
Depth
(cm)
EBCT
(min)
Halle et al.
(2009)
NR Anth. 20 20 15 4.8
NR Anth. 20 97 15 14
Huck et al.
(2011)
15 Anth. 20 20 15 5
20 Anth. 20 63 15 10
15 Anth. - 40 15 15
Lauderdale
et al. (2012) 15 GAC 100 20 Cap 6.65
Wert et al.
(2008)
25.4 Anth. 53 25 - 3.2
25.4 Anth. 53 25 - 9.7
25.4 Anth. 183 20 - 8.3-25
Persson et
al. (2006)
20 GAC 100 - 15 31
20 EC 100 - - 31
Tian et al.
(2009) 6 GAC 100 - - NR
(Anth. = anthracite, GAC= granular activated carbon, EC= expanded clay, NR= not reported,
Cap= supporting cap for drainage)
3.2.2 Pilot-scale Plant
The pilot plant is located at the Peterborough Water Treatment Plant (PWTP) on the
Otonabee River (Peterborough, ON). It is fed by pre-chlorinated raw water (dose= 0.5 mg/L Cl2,
when the temperature is >12 ºC) with a DOC between 4 to 6 mg/L.
The pilot-plant consisted of two parallel conventional treatment trains (using alum and
PACl as coagulants) and two biofiltration treatment trains. The coagulation train consisted of a
rapid mix, tapered flocculation, parallel plate settlers, and dual media filtration (EBCT= 12-36
min, Diameter (D) =15.24 cm). The biofiltration train consisted of two large biofilters (D=15.24
cm) and four smaller biofilters (D = 7.62 cm), operated at an empty bed contact time (EBCT) of
11 and 10 min, respectively. Figure 3.1 shows a general schematic of the pilot plant configuration.

23
Figure 3.1: Schematic of the pilot-plant treatment processes showing the conventional treatment
trains and the biofiltration treatment trains. (Not to scale) (BF= biofilter, CF= conventional filter)
24
3.2.3 Biofiltration Treatment Train
The biofiltration and the conventional treatment trains were fed directly by a constant head
tank. Two large (D= 15.24 cm) dual-media anthracite/sand biofilters matching the size and media
depth (1 m) of the pilot-scale conventional filters were used for the study. They were constructed
of glass, and all fittings and piping were either stainless steel or Teflon®. The filters contained 50
cm of anthracite (effective size (d10)= 0.85, uniformity coefficient (UC)= 1.8) on top of 50 cm of
sand ( d10= 0.5, UC= 1.8); a wedge wire support plate was used instead of gravel. These large
filters, named biofilter 1 (BF1) and biofilter 2 (BF2) were operated in parallel with an empty bed
contact time (EBCT) of 11 minutes. The water level above each filter was maintained at 90 cm
from the top of the filter media (constant head mode). The filters were backwashed using their
unchlorinated effluent (with or without air scour) when the headloss (LOH) reached 150 cm, when
air binding occurred, or a maximum of three times a week (on Monday, Wednesday and Friday).
The backwash procedure included a slow backwash for 4 minutes (30% bed fluidization) followed
by 8 minutes of fast backwash at collapse pulsing conditions (50 % bed fluidization), and 2 minutes
of slow backwash.
The small-scale (D= 7.62 cm) biofiltration train consisted of four parallel filtration
columns. The filters were constructed of acrylic with PVC fittings. They contained 50 cm of
anthracite on top of 50 cm of sand; the filtration media was supported by a stainless steel screen
followed by a stainless steel mesh. The filters were operated at EBCT of 10 minutes. An overflow
was located at 90 cm from the top of the media to allow the filter to be operated in constant head
mode. Filter effluent storage tanks, with a volume of 57 L, were located after each filter and were
used to provide unchlorinated backwash water. Backwash was performed on each filter at the same
frequency as the large biofilters or whenever the flow could not be maintained. The backwash
sequence included a slow backwash with or without air scour for 4 minutes (30% bed fluidization)
followed by an 8 minutes of fast backwash at collapse pulsing conditions (50% bed fluidization)
and 2 minutes of slow backwash. Media sampling ports were located along the filter media depth
at 5, 45, 55, and 95 cm as measured from the bottom of the filter; also, a water sampling port was
located at 5 cm above the top of the media to obtain water samples if needed. A sketch and a photo
of the biofiltration set-up are shown in Figures 3.2 and 3.3, respectively.

25
Figure 3.2: Biofiltration schematic (BF= Biofilter, BW=Backwash and S= Sampling port) (Not
to scale)

26
Figure 3.3: Photo of the biofiltration set-up at the PWTP showing the large biofilters along with
the conventional filters (right) and the small biofilters (left)
The large-scale biofilters were used to compare biofiltration with or without nutrient
(phosphorus and nitrogen) enhancement to conventional treatment. The small biofilters were used
to explore the effect of media type (anthracite vs. GAC), peroxide enhancement, and direct
filtration (in-line alum coagulation prior to filtration) on the performance of biofiltration in terms
of LOH reduction, DBP precursor removal, UF fouling control, and other parameters measured in
this study (discussed later). The condition of each biofilter is presented in Table 3.2.
BF2 BF1 BF5 BF6
CF
Al
CF
PACl
BF4 BF3

27
Table 3.2: Biofilter conditions
Filter No. BF1
(large)
BF2
(large)
BF3
(small)
BF4
(small)
BF5
(small)
BF6
(small)
Condition Control,
comparing
biofiltration
to
conventional
treatment
Nutrient
enhancement
(phosphorus
and nitrogen)
Control,
comparing
large to
small
biofilters
H2O2
addition
Alum
addition (In-
line
coagulation)
GAC vs.
anthracite
as a filter
media
3.2.4 Sampling Locations
Samples were collected from the Peterborough pilot plant biofiltration and conventional
treatment trains as well as Peterborough full-scale Water Treatment Plant (PWTP) filter #11 (FSP).
The samples obtained were the following;
1- Raw water (RW),
2- Alum and PACl coagulated, flocculated, and settled water (Pilot pre-filter (Alum) (SW
Alum) and pilot pre-filter (PACl) (SW PACl), respectively),
3- Conventional filers effluent post Alum and PACl coagulation/flocculation/settling
treatment (post-filter (Alum) (CF Alum) and post-filter (PACl) (CF PACl), respectively),
4- The large biofilter effluents (BF1 (Large control) and BF2 (Nutrient enhancement)),
5- The small biofilter effluents (BF3 (small control), BF4 (peroxide addition), BF5 (in-line
alum), and BF6 (GAC)),
6- Full scale plant filter #11 (FSP).
Also, media samples from the pilot large and small biofilters (6 samples), conventional filters (2
samples) and FSP were collected and analyzed. Sampling locations in the pilot Peterborough
Water Treatment Plant are shown in Figure 3.4

28
Figure 3.4: Sketch showing the water sampling locations at the Peterborough pilot treatment
plant, ( = sampling point, not to scale)
3.2.5 Ultrafiltration Unit
Two automated ultrafiltration pilot systems were adapted for this research work; they used
a polyvinylidene fluoride (PVDF) hollow fiber UF, Zeeweed 1 series 500 (ZW-1) (GE, Oakville,
ON). The membrane nominal surface area was 0.047 m2, and it was operated at a flux of 30 LMH.
The membrane was immersed in a 2 L vessel and operated using outside-in dead-end mode. The
UF operation involved permeation for 30 minutes followed by backpulsing with air scour for 15
minutes; the membrane tank was then completely drained, re-filled, and placed back in operation.
The membrane module was cleaned after each run by soaking it in 750 mg/L sodium hypochlorite
(NaOCl) solution for 24-48 hours followed by permeating 750 mg/L NaOCl for 30 minutes. Clean
water recovery was then checked by permeating distilled water for 30 minutes. The membranes

29
were stored in 50 mg/L chlorine solution after cleaning. Experiments were conducted on a side by
side or a back to back basis. A sketch and a photo of the UF unit is shown in Figure 3.5.
Figure 3.5: UF unit schematic (a) and photo (b)
3.3 Experimental Design
3.3.1 Variables
Experimental variables which affect biofiltration performance are discussed in section
2.2.1. Most of these variables, including temperature and NOM concentration, are hard to control
especially in pilot- and full-scale experiments; therefore, many studies have focused on others such
as EBCT, backwash strategy and filter media type (Huck and Sozański, 2008). EBCT is usually
varied through controlling the filtration rate or the biofilter media depth. EBCT has ranged from a
few minutes to around an hour in some studies, but most researchers have used EBCT values
between 4 to 20 min (Hammes et al., 2011). On the other hand, varying the backwash procedure
is more complicated and might require a separate study to examine the long term effects on the
removal of foulants, and hydraulic operations (e.g. clogging, mud ball formation). In this study,
the EBCT was not varied since preliminary testing of lower EBCTs (5 min) caused a rapid increase
in terminal headloss (1.5 m in approx. 1 day) and increased the biofilter backwash frequency to at
a) b)

30
least once a day. Therefore, an EBCT of 11 and 10 minutes was used for the large and small filters,
respectively. For our study, we selected to vary the filter media type, C:N:P ratio, hydrogen
peroxide addition, and in-line coagulation dose.
3.3.2 Monitored Parameters
In this study, LC-OCD along with DOC and UV254 were selected as analytical techniques
to measure the organic matter in water and UF foulants. Membrane resistance (TMP/flow rate)
was also utilized for UF reversible and irreversible fouling quantification since it accounts for
variability in the membrane flux. For the purpose of DBP precursor monitoring, THM, HAA and
AOX formation potentials (after 24 hours at 20ºC and 1.5±0.5 mg/L chlorine residual) were
monitored. Additionally, turbidity and other general water parameters such as temperature and pH
were recorded.
The two large biofiltration and the two conventional treatment trains were equipped with
on-line water quality instruments and connected to the full-scale plant sophisticated supervisory
control and data acquisition (SCADA) system. These included pH (Hach DPD1P1, Mississauga,
ON), temperature (Siemens Milltronics Airanger DPL, Peterborough, ON), turbidity (Hach,
1720E, Mississauga, ON), UV absorbance at 254 (UV254) (Real Tech, UV254 M3000, Whitby,
ON), dissolved organic carbon (DOC) (General Electric, 5310 C On-Line TOC analyzer,
Colorado, USA), and differential headloss meters (Siemens, Sitrans P XP/DIP, Peterborough,
ON).
Media samples were analyzed for ATP concentration to determine the microbial activity
in each filter. Also, extracellular polymeric substances (EPS) (proteins and polysaccharides) were
measured to determine the status (stress level) of the microbial community and to determine their
correlation to headloss.
3.3.3 Sampling Time
At the beginning of the study (24th June- 12th August 2013) samples were obtained 4 hours
after the filter run. However, after obtaining on-line DOC and UV254 data from the large control
filter effluent (Figure 3.6), it was found that the biofilter requires a minimum of 24 hours to reach
steady DOC removal. Therefore, samples obtained prior to 12th August 2013 were obtained 4 hours
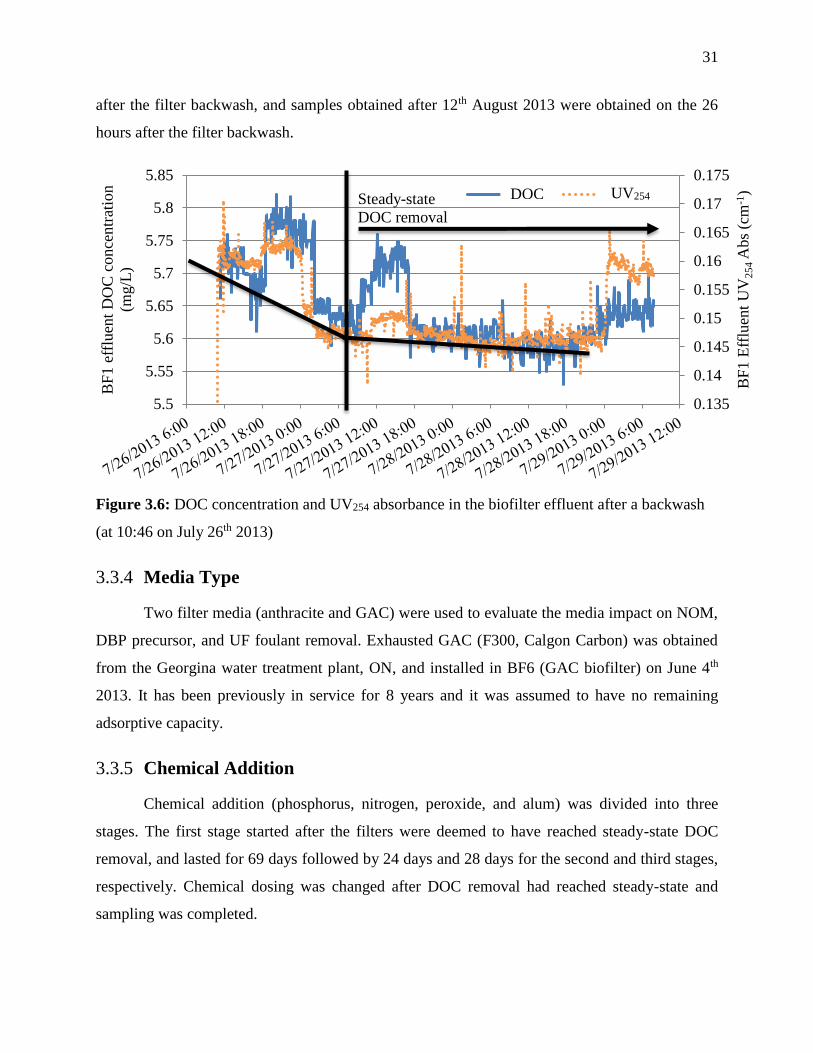
31
after the filter backwash, and samples obtained after 12th August 2013 were obtained on the 26
hours after the filter backwash.
Figure 3.6: DOC concentration and UV254 absorbance in the biofilter effluent after a backwash
(at 10:46 on July 26th 2013)
3.3.4 Media Type
Two filter media (anthracite and GAC) were used to evaluate the media impact on NOM,
DBP precursor, and UF foulant removal. Exhausted GAC (F300, Calgon Carbon) was obtained
from the Georgina water treatment plant, ON, and installed in BF6 (GAC biofilter) on June 4th
2013. It has been previously in service for 8 years and it was assumed to have no remaining
adsorptive capacity.
3.3.5 Chemical Addition
Chemical addition (phosphorus, nitrogen, peroxide, and alum) was divided into three
stages. The first stage started after the filters were deemed to have reached steady-state DOC
removal, and lasted for 69 days followed by 24 days and 28 days for the second and third stages,
respectively. Chemical dosing was changed after DOC removal had reached steady-state and
sampling was completed.
0.135
0.14
0.145
0.15
0.155
0.16
0.165
0.17
0.175
5.5
5.55
5.6
5.65
5.7
5.75
5.8
5.85
BF
1 E
fflu
ent
UV
25
4A
bs
(cm
-1)
BF
1 e
fflu
ent
DO
C c
once
ntr
atio
n
(mg/L
)
Series1 Series2Steady-state
DOC removal
DOC UV254

32
3.3.5.1 Nutrient Enhancement
A molar C:N:P ratio of 100:10:1 (21:5:1 by mass) has been shown to be optimal for
bacterial growth (Lauderdale et al. 2012); however, this ratio is usually not met in biofilter influent
(Liu et al. 2001). In raw Otonabee River water, nitrogen (as ammonium, NH4) and phosphorus
(orthophosphate (PO4)) concentrations were approximately 0.3 mg/L NH4-N and 0.00 mg/L PO4-
P, respectively. Since the DOC removal was approximately 0.5 mg/L before enhancement as
measured at the University of Toronto on June 24th, the C:N:P stoichiometric ratio was calculated
to be 100:30:0. This demonstrated that the water was only phosphorus limited, and that the
phosphorus addition was required to adjust the C:N:P ratio for optimal biomass activity.
Phosphorus (in the form of PO4) was as phosphoric acid (H2PO4) to the nutrient enhanced biofilter
influent; the required initial dose was calculated to be 0.025 mg/l PO4-P (C:N:P 100:30:2). DOC
removal was observed after 61 days. Then, ammonium was dosed in the form of ammonium
chloride at 0.1 mg/L NH4-N (C:N:P 100:40:2) for 24 days. The orthophosphate dose was then
increased to 0.25 mg/L PO4-P (C:N:P 100:40:20) for 28 days. Table 3.3 shows the nutrient
enhancement plan and Figure 3.7 shows a Gantt chart of the plan.
3.3.5.2 Hydrogen Peroxide Addition
Lauderdale et al. (2012) found that the addition of 1 mg/L hydrogen peroxide (H2O2)
decreased the terminal headloss by 60% when compared to a control, without affecting DOC
removal. Peroxide dosages were chosen to cover a similar range as reported in previous studies
(Lauderdale et al., 2012; Urfer and Huck, 1997). In this study, 0.1-1 mg/L H2O2 was added to BF4
(peroxide addition) influent as shown in Table 3.3 and Figure 3.7.
3.3.5.3 Alum Addition
Addition of 0.1-2 mg/L alum to the in-line coagulation biofilter influent was used
determine the optimum dose to reduce DOC, DBP precursor and UF fouling. An alum dose of
<0.5 mg/L was selected based on recent work done by Wray et al. (2014) where it was
demonstrated that 0.1 mg/L alum is the point of diminishing return for biopolymer removal. The
headloss was also monitored to determine the effect of the coagulant addition on the filter runtime.
The coagulant dose was varied as shown in Table 3.3 and Figure 3.7.

33
Table 3.3: Experimental design
Passive
Monitoring
Stage 1 (24-July-
13 to 30-Sept-13)
Stage 2 (30-Sept-
13 to 23-Oct-13)
Stage 3 (23-Oct-
13 to 21-Nov-13)
BF1 (control
large) Used as a control for the large filters (installed: October 2012)
BF2 (nutrient
Enhancement)
C:N:P
100:30:0
C:N:P
100:30:2
C:N:P
100:40:2
C:N:P
100:40:20
BF3 (control
small) Used as a control for the small filters (installed: February 2013)
BF4 (peroxide
addition) 0 mg/L 0.1 mg/L 0.5 mg/L 1 mg/L
BF5 (alum
addition) 0 mg/L 0.1 mg/L 0.5 mg/L 0.25 mg/L
BF6 (GAC) GAC column (installed: June 2013)
Figure 3.7: Chemical addition Gantt chart

43
3.4 Analytical Methods
3.4.1 Dissolved Organic Carbon
Dissolved organic carbon (DOC) was measured using the wet oxidation method based on
Standard Method 5310 D (APHA, 2012). The analysis was carried out using O-I Corporation
Model 1010 Analytical TOC Analyzer with a Model 1051 Vial Multi-Sampler. The instrument
conditions are shown in Table 3.4. Water samples were filtered using a 0.45 µm fiber glass filter,
transferred to 40 mL amber vials, and capped with Teflon®-lined septum screw caps. Samples
were stored at 4ºC and tested within 7 days of collection. DOC concentrations in water samples
were quantified using anhydrous potassium hydrogen phthalate (KHP) in Milli-Q® water
calibration solution, which was run with each sample set (Concentration= 0, 1.25, 2.5, 5, and 10
mg/L). A new calibration curve was prepared before each set of samples. Check standards (C= 3
mg/L) were run after every 10 samples, and at the end of a sample set. At least 3 blank samples
(Milli-Q® water) or a blank every tenth sample were run regularly. The reagent list and the method
outline are listed in Tables 3.5 and 3.6, respectively.
Table 3.4: DOC analyzer conditions
Parameter Description
Acid volume 500 μL of 5% phosphoric acid
Oxidant volume 1000 μL of 10% sodium persulphate
Sample volume 2 mL
Rinses per sample 1
Volume per rinse 15 mL
Replicates per sample 3
Reaction time (min:sec) TIC 01:30; TOC 02:00
Detection time (min:sec) TIC 00:00; TOC 03:00
Purge gas Nitrogen
Loop size 10 mL

35
Table 3.5: DOC analysis reagents
Reagent Source
Milli-Q® water Prepared in the laboratory
Sulphuric acid, H2SO4 Anachemia, 98+%
Sodium persulphate, Na2(SO4) Sigma Aldrich, 98+%, anhydrous
Potassium hydrogen phthalate (KHP),
C8H5KO4
Sigma Aldrich, 98+%
Phosphoric acid, H3PO4 Caledon, >85%
Nitrogen gas, N2 Praxair, Ultra high purity (UHP)
Table 3.6: DOC method outline
Blanks:
Use 40 mL of Milli-Q® water.
Stock solution:
Add 2.13 g potassium hydrogen phthalate in 1 L Milli-Q® water and acidify at pH <2
with H2SO4. Store in the fridge at 4°C
Check Standard (3.0 mg/L):
Add 300 μL of stock solution to 100 mL Milli-Q® water.
Analyze using TOC analyzer.
3.4.2 UV254
The ultraviolet absorbance at 254 nm (UV254) was determined via a CE 3055 Single Beam
Cecil UV/Visible Spectrophotometer (Cambridge, England) using 1 cm quartz cells (Hewlett
Packard, Mississauga). The spectrophotometer was zeroed with Milli-Q® water. Quartz cells were
rinsed with Milli-Q® and the water sample between measurements.

36
3.4.3 THMs
Trihalomethane (THM) (chloroform (trichloromethane, TCM), bromodichloromethane
(BDCM), dibromochloromethane (DBCM), and bromoform (tribromomethane, TBM)) analysis
was conducted using a liquid-liquid extraction gas chromatographic method based on Standard
Method 6232 B (APHA, 2012). The analysis took place at the University of Toronto laboratory
(Toronto, ON) using a Hewlett Packard 5890 Series II Plus Gas Chromatograph (Mississauga,
ON) equipped with an electron capture detector (GC-ECD) and a DB 5.625 capillary column
(Agilent Technologies Canada Inc., Mississauga, ON). The instrument conditions, required
reagents and method outline are described in Tables 3.7, 3.8, and 3.9, respectively. The
concentration of THM stock solution was 2000 μg/L. The concentrations of THM species in the
intermediate solution were 20 mg/L. Calibration standards were prepared at concentrations of 0,
5, 10, 20, 40, 60, 100, and 150 μg/L (in some cases half of these concentrations were used (i.e. 0,
2.5, 5, 10, 20, 30, 50, and 75 μg/L). The MDL for each species is shown in Table 3.10. MDLs were
determined by multiplying the standard deviation of 8 replicates, prepared in the same order of
magnitude as the expected MDL, by the Student-t value (3.0). A chloroform contaminated Methyl-
tert-butyl-ether (MTBE) was used to prepare the calibration curve and samples on September 24th,
2013. The contamination was accounted for by subtracting the blank from all samples and
standards.
Table 3.7: THM instrument conditions
Parameter Description
Injector Temperature 200°C
Detector Temperature 300°C
Temperature program 40°C for 4.0 min
4°C/min temperature ramp to 95°C
60°C/min temperature ramp to 200°C
Carrier Gas Helium
Make-up Gas P5 Argon (5% Methane)
Flow Rate 1.2 mL/min at 35°C

37
Table 3.8: THM reagents
Reagent Source
Milli-Q® water Prepared in the laboratory
Trihalomethane concentrated stock for
calibration
Supleco, 2000 μg/mL in methanol (48140-
U)
1,2- dibromopropane concentrated stock Supleco, 100 mg/L in Methyl-tert-butyl-
ether
Sodium sulphate [Na2SO4] Sigma Aldrich, ACS Grade
Methyl-tert -butyl-ether (MTBE) J.T. Baker ultra-resin-analyzed
Table 3.9: THM method outline
Collect samples in 500 mL amber bottles quenched with 0.025 g of ascorbic acid (100
mg/mL).
Store samples in the dark at 4°C for up to 7 days.
To begin preparing samples, remove from refrigerator and bring to room temperature.
Blanks:
Transfer 20 mL of Milli-Q® water into 40 mL vials and process alongside samples.
Standard Solution:
20 mg/L THM solution prepared from 2000 μg/mL stock.
Prepare calibration standards by adding the appropriate amount to get standard
concentrations of (0, 5, 10, 20, 40, 60, 100 and 150 μg/L)
** Wipe the syringe tip with a Kimwipe before measuring out the THM stock and before
adding stock to solution.

38
Table 3.9: THM method outline (cont.)
Check Standards: (20 μg/L):
Add 20 μL of calibration solution to 20 mL of Milli-Q® water in a 40 mL vial and
process alongside samples.
Include blanks and running standards every 10 samples.
Extraction:
Transfer 20 ml of each sample vial into a clean 40 mL vial.
Add 50 μL of the 1,2-dibromopropane solution
Add 2 scoops of sodium sulphate (Na2SO4) in order to increase extraction efficiency.
Add 4 mL of MTBE extraction solvent and cap with Teflon®-lined silicon septum and
screw cap.
Shake sample vial vigorously for approx. 30 seconds and place on counter on its side.
Repeat and complete for all samples, blanks and standards before proceeding.
Shake the samples by hand for 2 minutes.
Let samples stand for 15-30 minutes for phase separation.
Extract 2 mL from the organic layer using a Pasteur pipette and place in a 1.8 mL GC
vial filled with 2 small scoops of Na2SO4 (there should not be any water in the vial). Use
a clean pipette for each sample. Fill the vial to the top and cap immediately, ensuring that
there is no headspace. To ensure only the MTBE layer was taken, freeze the samples and
examine the vials after more than two hours to see if there is only one phase visible.
If not analyzing immediately, store the samples in the freezer (-11°C) for up to 21 days.
Analyze using a GC-ECD.

39
Table 3.10: THM method detection limits
Analyte Standard Deviation (μg/L) MDL (μg/L)
TCM 0.23 0.69
BDCM 0.05 0.16
DBCM 0.09 0.26
TBM 0.18 0.54
3.4.4 HAAs
Haloacetic acids (HAAs) (monochloroacetic acid (MCAA), monobromoacetic acid
(MBAA), dichloroacetic acid (DCAA), trichloroacetic acid (TCAA), bromochloroacetic acid
(BCAA), dibromoacetic acid (DBAA), bromodichloroacetic acid (BDCAA), dibromochloroacetic
acid (DBCAA), and tribromoacetic acid (TBAA)) analysis was conducted using a liquid-liquid
extraction gas chromatographic method based on Standard Method 6251 B (APHA, 2012). All
analyses were conducted at the University of Toronto laboratory facility (Toronto, ON) using a
Hewlett Packard 5890 Series II Plus Gas Chromatograph (Mississauga, ON) equipped with an
electron capture detector (GC-ECD) and a DB 5.625 capillary column (Agilent Technologies
Canada Inc., Mississauga, ON). The instrument conditions, required reagents method outline and
method MDLs are described in Tables 3.11, 3.12, 3.13, and 3.14, respectively. Few samples (BF4,
BF5, and BF5 duplicate) from September 24th were analyzed without adding an internal standard.
Table 3.11: HAA instrument conditions
Parameter Description
Injector Temperature 200°C
Detector Temperature 300°C
Temperature program 35°C for 10.0 min
2.5°C/min temperature ramp to 65°C
10°C/min temperature ramp to 85°C
20°C/min temperature ramp to 205°C, hold for 7 min
Carrier Gas Helium
Make-up Gas P5 Argon (5% Methane)
Flow Rate 1.2 mL/min at 35°C

40
Table 3.12: HAA reagents
Reagent Source
N-methyl-N-nitroso-p-toluene sulfonamide
(Diazald) [CH3C6H4SO2N(CH3)NO]
Sigma Aldrich, 99+%
Sodium hydroxide [NaOH] BDH, 85.0+%, ACD Grade
Sulphuric acid [H2SO4] Anachemia, 98+%
Haloacetic acids concentrated stock EPA 552.2 Acids Calibration Mix in
MTBE
2,3,5,6 tetrafluorobenzoic acid (TFBA)
concentrated stock
Supleco, 2000 mg/L in MTBE
Sodium sulphate [Na2SO4] Sigma Aldrich, ACS Grade
Methyl-tert -butyl-ether (MTBE) Sigma Aldrich, >99.8% Or J.T. Baker
ultra-resin-analyzed
Table 3.13: HAA method outline
Collect samples in 500 mL amber bottles quenched with 0.025 g of ascorbic acid (100
mg/mL). Ensure that samples are headspace-free.
Store samples in the dark at 4°C for up to 9 days.
To begin preparing samples, remove from refrigerator and bring to room temperature.
Blanks:
Transfer 20 mL of Milli-Q® water into 40 mL vials and process alongside samples.
Standard Solution (10 μg/mL):
Collect 20 mL of MilliQ® in 40 ml Vial
Using a 50 μL syringe and the sandwich technique, add 0, 5, 10, 20, 40, and 60 μL of
HAA stock (2000 μg/mL each)

41
Table 3.13: HAA method outline (cont.)
** Wipe the syringe tip with a Kimwipe before measuring out the HAA stock and before
adding stock.
Check Standards (40 ug/L):
Add 20 μL of working solution (10 mg/mL) to 20 mL of Milli-Q® water, process alongside
samples.
Include blanks and running standards every 10 samples.
Diazomethane Generation
Set up the generation apparatus as shown in Figure 6521:2 in Standard Methods (APHA,
2012).
Extraction
Transfer 20 ml the contents of each sample vial into a clean 40 mL vial.
Add 20 μL of the 2,3,5,6-TFBA solution
Add 3 mL of sulphuric acid (H2SO4) to reduce the pH of the sample.
Add 2 two scoop of sodium sulphate (Na2SO4) in order to increase extraction efficiency.
Add 5 mL of MTBE extraction solvent and cap with Teflon®-lined silicon septa and screw
cap.
Shake sample vial vigorously for approx. 30 seconds and place on counter on its side.
Complete this procedure for all samples, blanks and standards before proceeding.
Shake the samples by hand for 5 minutes. Let samples stand for 15-30 minutes for phase
separation.

42
Table 3.13: HAA method outline (cont.)
Transfer MTBE to GC vials to the just above 1.5 ml mark to allow for addition of 150 μL
diazomethane cap immediately, ensuring that there is no headspace. Use a clean pipette for
each sample.
To ensure only the MTBE layer was taken, freeze the samples and examine the vials after
more than two hours to see if there is only one phase visible.
Add 150 μL of diazomethane to the GC vial (submerge tip before injection) and cap
immediately.
If not analyzing immediately, store the samples in the freezer (-11°C) for up to 21 days.
Analyze using a GC-ECD.
Table 3.14: HAA method detection limits
Analyte Standard Deviation (μg/L) MDL (μg/L)
MCAA 0.34 1.03
MBAA 0.47 1.41
DCAA 0.40 1.20
TCAA 0.35 1.06
BCAA 0.39 1.16
DBAA 0.27 0.80
BDCAA 0.19 0.57
DBCAA 0.15 0.46
TBAA 0.15 0.46
3.4.5 AOX
Adsorbable Organic Halogens (AOX) analysis was conducted using a titration method
based on Standard Method 5320 (APHA, 2012). All analyses were conducted at the University of
Toronto laboratory (Toronto, ON) using a Trace Element Instruments Xplorer organic halogens
analyzer (Delft, Netherlands). Instrument conditions, reagents and method are shown in tables

43
3.15, 3.16, and 3.17. Samples were run in duplicates, and a check standard (100 μg/L) was injected
into the test cell before each analysis.
Table 3.15: AOX instrument conditions
Parameter Description
Combustion cell temperature 1000°C
Combustions gas Oxygen
Carrier gas to combustion cell Argon
Carrier gas to titration cell Oxygen
Cell scrubber Concentrated sulfuric acid 98%
Table 3.16: AOX reagents
Reagent Source
Nitrate stock solution, 1% 14 mL of nitrite stock 67% in 1 L of MQ
mixed with 14 g of Sodium Nitrate
Nitrate wash solution 50 mL of Nitrate stock solution in 1 L of MQ
Acetic Acid Sigma Aldrich, 75%
Sulphuric acid [H2SO4] Anachemia, 98+%
Standard Solution (4-Chlorophenol) Trace Elements, 200 mg/L Cl
Sodium Chloride Trace Elements, 2 mmol/L
Table 3.17: AOX method outline
Collect samples in 500 mL amber bottles. Ensure that samples are headspace-free.
Store samples in the dark at 4°C for up to 14 days.
To begin preparing samples, remove from refrigerator and bring to room temperature.

44
Table 3.17: AOX method outline (cont.)
Sample extraction:
Prepare the extraction column set by connecting two activated carbon columns with the
connector. Make sure to puncture the column cap to allow sample pass
through.
Assemble the column set onto the Xprep sample filtration unit.
Shake and homogenize samples, pour 100 mL into the extraction syringes.
Check the wash solution of sodium nitrate/nitric acid. Start the extraction. It takes about
50 minutes for the whole extraction depending on the flow rate (1-2 mL/min).
Transferring of activated carbon to the test cups:
At the end of sample extraction, take off the column sets from the Xprep.
Using the ejecting tool to transfer the activated carbon to clean test cups and place on the
sample auto sequencer and run them immediately
3.4.6 ATP Analysis
Luminaltra adenosine triphosphate (ATP) analysis kit (DSA-100C, Fredericton, NB) was
used to carry out the ATP analysis following manufacturer instructions as shown in Table 3.18.
Media samples were obtained from the top of the biofilter or conventional filter at the end of each
enhancement stage.
Table 3.18: ATP method outline
Collect in 10 mL Falcon tubes and store at 4°C and analyze within 24 hours.
To calibrate the Luminometer, add two drops (100 μL) of enzyme reagent (Luminase)
and two drops (100 μL) of tATP standard (Ultracheck 1) in a 12×55 mm test tube

45
Table 3.18: ATP method outline (cont.)
Measure the relative light units (RLU) using a Luminometer (RLUstandard).
Weight 1 g of sample media and transfer to 17×100 mm test tube
Using a micropipette, add 5 mL of (total ATP) tATP extraction reagent (UltralyseTM 7)
and shake rigorously
Incubate the sample for 5 minutes
Transfer 1 mL of the incubated sample to a new 17×100 mm test tube and add 9 mL of
tATP dilution reagent (UltraLute). Cap the tube and shake gently
Using a micropipette, transfer 100 μL from the dilution tube to a new 12×55 mm test tube
and add 2 drops (100 μL) of Luminase
Mix gently and place in the Luminometer to measure the RLU (RLUsample).
The ATP concentration is determined as follows:
• tATP (pg ATP/g) on the filter media=RLUSample
RLUStandard×
50000 (pg ATP)
masssample (g)
• tATP (pg ATP/mL) on the filter media=RLUSample
RLUStandard×
50000 (pg ATP)
volumesample (mL)
3.4.7 EPS Analysis
Extracellular polymeric substances (EPS) analysis was conducted on biofilter and
conventional filter media obtained from the top 5 cm. Protein and polysaccharide analyses were
carried out at the University of Toronto laboratory (Toronto, ON) using a method adapted from
Papineau et al. (2012) and DuBois et al. (1956), respectively. The samples were extracted using a
Tris EDTA extraction method as described by Liu and Fang (2002). A fresh calibration curve was
prepared for each analysis; a serial dilution curves (0, 3.125, 6.25, 12.5, 25, 50, and 100 mg/L) of
glucose and Bovine Serum Albumin (BSA) solution were used for polysaccharides and proteins;

46
respectively. The reagent used and the method outline are presented in Tables 3.19 and 3.20,
respectively. CE 3055 Single Beam Cecil UV/Visible Spectrophotometer (Cambridge, UK) and
Hach spectrophotometer (Hach Odyssey DR/2500 Scanning Spectrophotometer, Mississauga,
ON) were used for protein and polysaccharide analysis, respectively.
Table 3.19: EPS reagents
Reagent Source
Ethylenediaminetetraacetic acid (EDTA)
disodium salt dehydrate
Sigma Aldrich, ACS grade
Tris (Hydrohymethyl) Aminomethane,
BioUltrapure
BioShop, > 99.9 %
Bovine Serum Albumin (BSA) solution BioLabs, 10 mg/mL
D-Glucose Anhydrous, reagent grade
Pierce™ BCA Reagent A + B Thermo Scientific
Phenol Alfa Aesar, ACS grade
Sulphuric Acid Anachemia, 98+ %
Table 3.20: EPS method outline
Collect samples in 10 mL Falcon Tubes.
Store samples in the fridge at 4°C for < 48 hours.
To begin preparing samples, remove from the fridge and bring to room temperature.
Sample extraction:
Prepare Tris-EDTA buffer from concentrate in a 50 mL tube using a 1:9 ratio of 10 times
concentrated Tris-EDTA to Milli-Q® water
Add a magnetic stirrer and place in stirrer for 30 min or until reagents are fully dissolved
Sterilize in the autoclave at 121°C for 20 min and keep at room temperature

47
Table 3.20: EPS method outline (cont.)
Extraction procedure:
Incubate samples at 4°C in an environmental chamber for 4 hours on a shaker
Centrifuge samples at 12,000 g at 4°C for 15 minutes
Pipet the supernatant while avoiding the media residue
Filter samples into sterile Falcon tubes using a 0.45 μm filter syringe
If not analyzed immediately, store in freezer at -11°C.
Protein Analysis:
In a fume hood, place hot water bath in the fume hood and heat to 60°C
Prepare Pierce™ BCA working reagent by adding 50 parts reagent A to 1 part reagent B,
Calculate the volume of working reagent required by multiplying the number of samples by
1.5 (since 1.5 mL is needed per sample), including blanks, standard curve, and duplicates
Working Solutions (1 mg/mL):
Add 100 μL of the BCA standard to 900 μL of MilliQ®
Analysis Procedure:
Add 400 μL of working solution to 3600 μL of MilliQ® to prepare 100 μg/mL standard
Transfer 150 μL of the 100 μg/mL standard to a microcentrifuge tube
Add 75 μL of each concentration of the BCA standards into the next lower concentration in
microcentrifuge tubes (filled with 75 μL of MilliQ®) to prepare the serial dilution standards
Add 75 μL of sample into microcentrifuge tubes (duplicates for each sample)
Add 75 μL of Milli-Q® water into a microcentrifuge tube for the blank

48
Table 3.20: EPS method outline (cont.)
In the fume hood, add 1.5 μL of Peirce™ BCA working reagent to the blank, the BSA serial
dilution, and the samples
Incubate in water bath at 60°C for 30 min
Let cool to room temperature and read absorbance at 562 nm (OD562) with the
spectrophotometer (CE 3055 Single Beam Cecil UV/Visible Spectrophotometer).
Polysaccharides Analysis:
In a fume hood, place hot water bath in the fume hood and heat to 100°C
Standard and Working Solutions:
In a 50 mL graduated cylinder, add 2.5 g of glucose anhydrides and fill it to the 50 mL mark
with MilliQ® to prepare 50 mg/mL standard solution
In a 50 mL graduated cylinder, add 1 mL of glucose standard and fill it to the 50 mL mark
with MilliQ® to prepare 1 mg/mL working solution
Analysis Procedure:
Add 200 μL the glucose working solution (1 mg/mL) and 1800 μL of MilliQ® to a glass
vial to prepare 2 mL of 100 μg/mL standard
Add 1 mL of of each concentration of the standard into the next lower concentration in a
glass vial (already filled with 1 mL of MilliQ®) to prepare the serial dilution standards, and
cap using acid-resistant lids
Add 1 mL of sample (in triplicates) including a blank (Milli-Q®) into the glass vials
Add 1 mL of 5 % phenol solution into each vial

49
Table 3.20: EPS method outline (cont.)
In a fume hood, add 5 mL of 98 % sulfuric acid into each vial using the pump. Close the caps
but not tightly
Vortex samples (use a low vortex speed setting, do not let liquid reach tops of vials)
Place vials in water bath (100°C) for 5 minutes
Remove rack from water bath and vortex each sample
Cover racks in aluminum foil and incubate in the dark, at room temperature, for 10 minutes.
Vortex the samples gently
Re-cover the racks in foil and incubate in the dark at room temperature for additional 30
minutes and afterwards vortex the samples gently
Read absorbance at 492 nm (OD492) using the Hach spectrophotometer (Hach Odyssey
DR/2500 Scanning Spectrophotometer), vial labels aligned with arrow.
3.4.8 Nitrogen and Phosphorus
Nitrogen in the form of ammonia (NH3-N) and phosphorus in the form of orthophosphate
(PO4-P) were measured using Hach® Ammonia Reagent Set Salicylate Method (10 mL), and
PhosVer® 3 Phosphate Reagent Powder Pillows (10ml), respectively following the manufacturer
instructions. The analysis was conducted using Hach® Odyssey DR/2500 Scanning
Spectrophotometer (Mississauga, ON).
3.4.9 Chlorine (Cl2) Demands and Residuals
DBPs were formed by chlorinating raw water and biofilter effluents. The 24 hour chlorine
(Cl2) demands were estimated by dosing the conventional treatment, and biofilter samples with 5
and 7 mg/L Cl2, respectively, in 125 ml chlorine-demand-free amber bottles and measuring the
free chlorine residual after 24 hours as described in Standard Method 4500-CI G (APHA, 2012).
The free chlorine dosage was calculated to provide a residual of 1.5±0.5 mg/L after 24 hours.

50
Samples were chlorinated in 500 ml amber bottles with no head space, incubated at 20±2˚C for 24
hours, after which the chlorine residuals were measured and were quenched using ascorbic acid
(100 mg/L).
3.5 Quality Assurance/ Quality Control (QA/QC)
Water samples were stored in amber glass bottles. Samples were preserved at 4˚C and were
processed within 48 hours from the sampling period. Standards for pH, turbidity, DOC, UV254,
THMs, and HAAs were run regularly to ensure the instruments were well calibrated. LC-OCD
was calibrated at least once every six months at the University of Waterloo. DOC, UV254, turbidity,
pH, THMs, HAAs, and AOX were done in duplicates.
Media samples were collected and stored in clear falcon tubes. ATP analysis was
performed either on-site after sample collection or within 8 hours of sample collection. EPS
samples were stored at 4˚C and were analyzed within 2 days of collection. ATP samples were not
replicated. Polysaccharides and protein samples were run in duplicates and triplicates,
respectively.
Check standards were run regularly during analysis of THMs, HAAs, and AOX to establish
quality control. They were prepared to be in the expected sample concentration range and run
every tenth sample. Also, method and instrument blanks were analysed after every tenth sample.
A new calibration curve was prepared with each batch of DOC, and EPS samples. UV254 and
turbidity were zeroed with MilliQ® prior to analysis. Quality control charts were created using the
check standards, which were used to ensure the method’s accuracy and performance as per
Standard Method 1020 (APHA, 2012). The method was recalibrated if any of the following trends
were observed:
- 2 consecutive measurements outside the control limits of Mean ± 3×standard deviation(s)
(upper control limit (UCL) and lower control limit (LCL));
- 3 out of 4 consecutive measurements were outside of mean ± 2×standard deviation(s)
(upper warning limit (UWL) and lower warning limit (LWL));
- 5 out of 6 consecutive measurements were outside of mean ± standard deviation(s);
- 5 out of 6 consecutive measurements were following a trend of increasing or decreasing;

51
- 7 consecutive measurements were > the mean, or 7 consecutive measurements were < the
mean.
The mean and standard deviation were calculated by analyzing 7 or 8 individually prepared
standard standards in sequence along with a new calibration curve. Calibration curves, raw data,
and QA/QC charts are shown in Appendix A, B, and C, respectively.
3.6 Statistical Analysis
A student t-test (Equation 3.1) was used to evaluate the impact of nutrient, peroxide, and
alum addition on biofiltration ability to remove turbidity and UV254 when compared to the control.
Also, a paired t-test (Equation 3.2) was used to determine the impact of these enhancement
strategies on DOC removal and headloss compared to the control. All statistical analyses were
performed at the 95% confidence level. Also, a paired student t-test was used to compare
biofiltration (large control (BF1)) to conventional treatment (alum and PACl coagulation/
flocculation/sedimentation with/without filtration)
If 𝑡 =𝑀𝑠𝑎𝑚𝑝𝑙𝑒−𝑀𝑐𝑜𝑛𝑡𝑜𝑙
𝑆𝐷𝑠𝑎𝑚𝑝𝑙𝑒,𝑐𝑜𝑛𝑡𝑟𝑜𝑙/√2
𝑛
> |𝑡𝛼
2,𝑛−1| (3.1)
Then the difference in the historical mean of the analyte (e.g. DOC) is statistically significant
between two biofilters (or treatment options).
Where t is the t-test value, 𝑀 is the mean of each sample set, 𝑆𝐷𝑠𝑎𝑚𝑝𝑙𝑒,𝑐𝑜𝑛𝑡𝑟𝑜𝑙 is the grand standard
deviation of the two sample sets (i.e. 𝑆𝐷𝑠𝑎𝑚𝑝𝑙𝑒,𝑐𝑜𝑛𝑡𝑟𝑜𝑙 = √1
2(𝑆𝐷𝑠𝑎𝑚𝑝𝑙𝑒
2 + 𝑆𝐷𝑐𝑜𝑛𝑡𝑟𝑜𝑙2) ), and n is
the number of observations (samples).
If 𝑡 =∑ 𝐷
√𝑛(∑ 𝐷2)−(∑ 𝐷)2
𝑛−1
> |𝑡𝛼
2,𝑛−1| (3.2)
Then the difference in the historical mean of the analyte (e.g. DOC) is statistically significant
between two biofilters (or treatment options).

52
Where t is the paired t-test value, ∑ 𝐷 is the sum of difference between pairs, (∑ 𝐷2) is the sum of
the square difference between pairs, (∑ 𝐷)2 is the square of the sum of difference between pairs,
and n is the number of observations (pairs).
53
4. Engineered Biofiltration for NOM, DBP Precursor
Removal, and UF Fouling Control
4.1 Introduction
Membrane filtration has emerged as a cost effective solution to remove emerging
contaminants and to meet potential future regulations (Plakas and Karabelas, 2012; Rana et al.,
2012; Singh, 2006). However, fouling remains as one of the major limitations when considering
the implementation of membranes (Howe and Clark, 2002). Membrane fouling can hinder
treatment efficiency, damage the membrane surface, and significantly increase maintenance and
operation costs (Singh, 2006). Natural organic matter (NOM) has been identified as the major
foulant (Wang and Wang, 2006), and recent studies have shown that biopolymer and colloid
organic fractions are the major contributors to irreversible organic fouling (Hallè, 2010; Neubrand
et al., 2010; Zheng et al., 2010; Zheng et al., 2012). While NOM itself does not present a direct
health concern (Hozalski et al., 1999), it can influence overall water quality by reacting with
chlorine and other disinfectants to form disinfection by-products (DBPs) (Chaiket et al., 2002;
Richardson et al., 2007).
Biofiltration has been presented as a cost effective and chemical-free process for the
removal of NOM (Huck and Sozański, 2008). It has been reported to be effective for DBP
precursor removal, for limiting microbial growth in distribution systems (Van der kooij, 1992;
Wert et al., 2008; Yang et al., 2011), for controlling taste and odour (Elhadi et al., 2006; Srinivasan
and Sorial, 2011), as well as membrane fouling control (Hallé et al., 2009; Huck et al., 2011;
Peldszus et al., 2011). Biologically active granular media filters operated without chemical
disinfection (e.g. chlorinated backwash) can promote microorganism growth on filter media (Zhu
et al., 2010). The biological community can consume NOM. Recent research has focused on
actively improving biofiltration by way of nutrient enhancement, where adjusting the carbon to
phosphorus ratio (C:P) to 100:2 was found to increase dissolved organic carbon (DOC) removal
by 75% and decrease headloss by 15% (Lauderdale et al., 2012). Hydrogen peroxide (H2O2)
addition was reported to decrease headloss by up to 75% without impacting DOC removal
(Lauderdale et al., 2012; Urfer and Huck, 2000).

54
Granular activated carbon (GAC) and anthracite has been intensively studied as a biofilter
media (Dussert and Tramposch, 1997; Emelko et al., 2006; Liu et al., 2001). Most of the literature
suggests that exhausted GAC and anthracite biofilters provide similar TOC and organic compound
(e.g. acetate, formate) when temperatures are between 20 to 25˚C (Emelko et al., 2006; Liu et al.,
2001). It was reported that that GAC provides higher total organic carbon (TOC) and assimilable
organic carbon (AOC) removals (up to 100% more than anthracite) at low temperatures (1-10˚C)
(Dussert and Tramposch, 1997; Emelko et al., 2006). Many researchers have hypothesized that the
superior performance of GAC is due to its high surface area (>1000 m2/g) and porous nature (pores
volume >0.15 cm3/g) where particles attachment and growth of microorganisms is more favourable
(Dussert and Tramposch, 1997; Klymenko et al., 2010). Others have attributed the superior
performance to bio-regeneration, since microorganisms consume NOM attached to GAC which in
turns reactivate adsorption sites (Velten et al., 2011a; Zhu et al., 2010).
The objective of this pilot-scale study was to investigate the impact of biofiltration
enhancement strategies and filter media types on NOM removal, DBP precursor reduction, and
mitigation of ultrafiltration (UF) fouling. Six pilot-scale biofiltration trains were designed to
examine the impact of stepwise addition of nutrients (phosphorous and nitrogen), peroxide, and
in-line alum, as well as the biofilter media type (GAC vs. anthracite).
4.2 Materials and Methods
4.2.1 Source Water Quality Parameters
The source water for this study was Otonabee River (Peterborough, Canada). When
influent water temperatures were > 12˚C, the water was pre-chlorinated for zebra mussel control.
Residual chlorine was quenched prior to biofiltration by applying sodium thiosulfate (3.5:1 sodium
thiosulfate to chlorine ratio by mass). Typical water quality parameters are shown in Table 4.1.
Table 4.1: Otonabee River raw water quality parameters
Parameter (units) Yearly range
Temperature (˚C) 3-29
pH 7-9
Turbidity (NTU) 0.3-1.5
DOC (mg/L) 5.8-7.3
55
4.2.2 Pilot Configuration
The pilot consisted of parallel biofiltration treatment trains incorporating two large glass
biofilters (Diameter (D)= 15.24 cm) and four small acrylic biofilters (D= 7.62 cm). The large and
small biofilters were operated at empty bed contact times (EBCTs) of 11 and 10 minutes,
respectively. They contained 50 cm of anthracite (effective size (d10)= 0.85, uniformity coefficient
(UC)= 1.8) over 50 cm of sand (d10= 0.5, UC= 1.8). A wedge wire plate was installed below the
sand layer to support the media for the large filters, and a stainless steel mesh was used in the small
filters. Exhausted GAC (F300, Calgon Carbon) was obtained from the Georgina Water Treatment
Plant, Ontario, Canada. It has been previously in service for 8 years and adsorptive capacity was
assumed to be exhausted. The water level above each filter was maintained at 90 cm from the filter
media bed (constant head mode). Each filter was backwashed using its own effluent three times
per week (Monday, Wednesday, and Friday), or as needed to maintain the EBCT. The backwash
procedure included a slow backwash with air scour for 2 minutes (30% bed fluidization), followed
by 8 minutes of fast backwash at collapse pulsing conditions (50% bed fluidization), and a slow
backwash for 4 minutes. A general schematic of the pilot plant configuration is depicted in Figure
4.1.
4.2.3 Ultrafiltration Units
Two automated ultrafiltration pilot systems were adapted for this research work. They
consisted of a polyvinylidene fluoride (PVDF) hollow fiber UF membrane, Zeeweed 1 series 500
(ZW-1) (GE, Oakville, ON) where the membrane nominal surface area was 0.047 m2. The units
were operated at a flux of 30 LMH. The membrane was immersed in a 2 L vessel and operated
using outside-in dead-end mode. UF operation consisted of 30 minutes permeation followed by
backpulsing with air scour for 15 minutes; after which the membrane tanks were completely
drained, re-filled, and placed back in operation. The membrane module was cleaned after each UF
run by soaking it in 750 mg/L sodium hypochlorite (NaOCl) solution for 24-48 hours, followed
by permeation with 750 mg/L NaOCl for 30 minutes and distilled water for 30 minutes. The
membranes were stored in 50 mg/L chlorine solution between runs. Experiments were conducted
in parallel or back to back basis as required.

56
Figure 4.1: Biofiltration pilot plant schematic (BF= Biofilter, BW=Backwash and S= Sampling
port) (Not to scale)
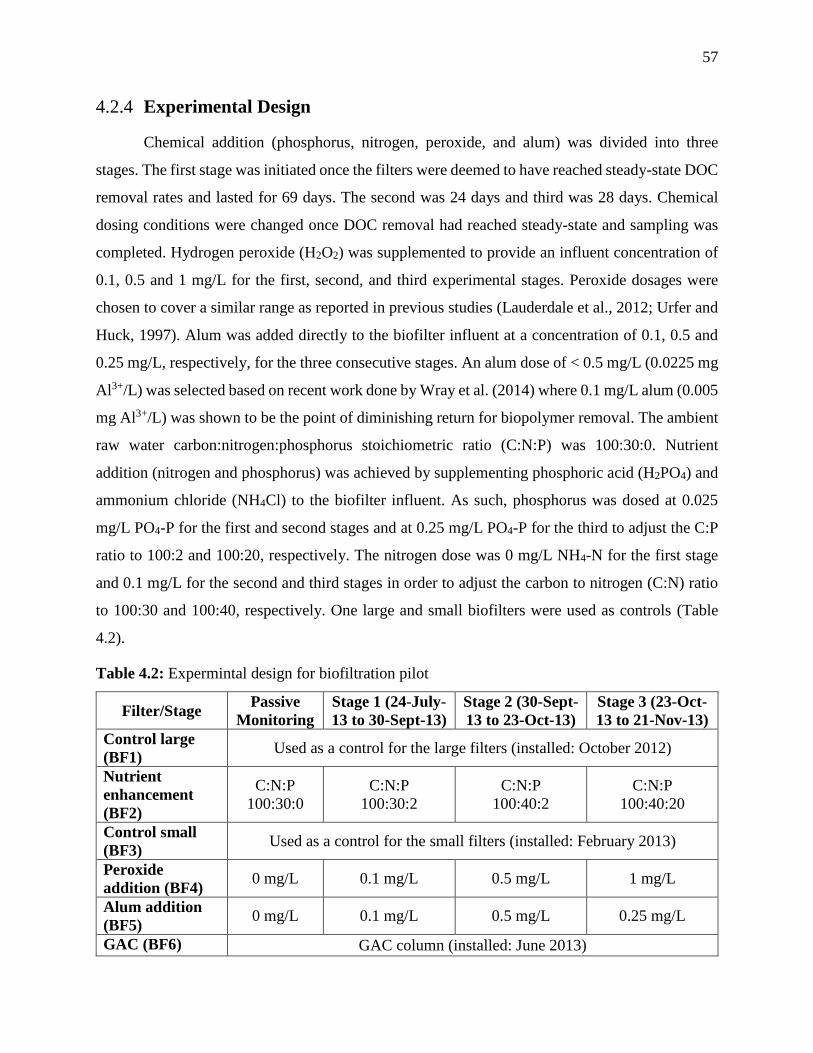
57
4.2.4 Experimental Design
Chemical addition (phosphorus, nitrogen, peroxide, and alum) was divided into three
stages. The first stage was initiated once the filters were deemed to have reached steady-state DOC
removal rates and lasted for 69 days. The second was 24 days and third was 28 days. Chemical
dosing conditions were changed once DOC removal had reached steady-state and sampling was
completed. Hydrogen peroxide (H2O2) was supplemented to provide an influent concentration of
0.1, 0.5 and 1 mg/L for the first, second, and third experimental stages. Peroxide dosages were
chosen to cover a similar range as reported in previous studies (Lauderdale et al., 2012; Urfer and
Huck, 1997). Alum was added directly to the biofilter influent at a concentration of 0.1, 0.5 and
0.25 mg/L, respectively, for the three consecutive stages. An alum dose of < 0.5 mg/L (0.0225 mg
Al3+/L) was selected based on recent work done by Wray et al. (2014) where 0.1 mg/L alum (0.005
mg Al3+/L) was shown to be the point of diminishing return for biopolymer removal. The ambient
raw water carbon:nitrogen:phosphorus stoichiometric ratio (C:N:P) was 100:30:0. Nutrient
addition (nitrogen and phosphorus) was achieved by supplementing phosphoric acid (H2PO4) and
ammonium chloride (NH4Cl) to the biofilter influent. As such, phosphorus was dosed at 0.025
mg/L PO4-P for the first and second stages and at 0.25 mg/L PO4-P for the third to adjust the C:P
ratio to 100:2 and 100:20, respectively. The nitrogen dose was 0 mg/L NH4-N for the first stage
and 0.1 mg/L for the second and third stages in order to adjust the carbon to nitrogen (C:N) ratio
to 100:30 and 100:40, respectively. One large and small biofilters were used as controls (Table
4.2).
Table 4.2: Expermintal design for biofiltration pilot
Filter/Stage Passive
Monitoring
Stage 1 (24-July-
13 to 30-Sept-13)
Stage 2 (30-Sept-
13 to 23-Oct-13)
Stage 3 (23-Oct-
13 to 21-Nov-13)
Control large
(BF1) Used as a control for the large filters (installed: October 2012)
Nutrient
enhancement
(BF2)
C:N:P
100:30:0
C:N:P
100:30:2
C:N:P
100:40:2
C:N:P
100:40:20
Control small
(BF3) Used as a control for the small filters (installed: February 2013)
Peroxide
addition (BF4) 0 mg/L 0.1 mg/L 0.5 mg/L 1 mg/L
Alum addition
(BF5) 0 mg/L 0.1 mg/L 0.5 mg/L 0.25 mg/L
GAC (BF6) GAC column (installed: June 2013)

58
4.2.5 Analytical Methods
Biofilter influent (raw water) and effluents were collected 4 hours after backwash during
the monitoring stage and first three weeks of stage 1 then at 26 hours after backwash to ensure
steady-state DOC removal (Figure 3.6). Temperature, pH, turbidity, dissolved organic carbon
(DOC), UVA at 254 nm (UV254), liquid chromatography-organic carbon detection (LC-OCD), 24
hour disinfection by-product (DBPs) formation potential (DBPFP) (trihalomethanes (THMs),
haloacetic acids (HAAs), and absorbable organic halogens (AOX)) were measured. In addition,
biofilter media was assayed for adenosine triphosphate (ATP), polysaccharides (PS) and proteins
(Pr). Media samples were obtained at the end of a given filter run (approximately 48 hours) and
collected from the surface of the large biofilters and 5 cm below the surface from the small
biofilters.
Raw water temperature was measured using a Siemens Milltronics Airanger DPL
thermometer (Peterborough, ON); a change in temperature was not observed through the filters.
Turbidity was measured using a Hach 2100N Turbidimeter (Mississauga, ON). pH was measured
using a Thermo Scientific Orion Star A111 pH Meter (Mississauga, ON).
DOC was measured using a wet oxidation method as described in standard method 5310
D (APHA, 2012). An O-I Corporation Model 1010 Analytical TOC Analyzer (College Station,
Texas, USA) was used to conduct the analysis. All samples were collected in amber glass bottles,
stored at 4ºC and analyzed within 7 days of collection. A new calibration curve was prepared for
each analysis. UV254 was measured using a CE 3055 Single Beam Cecil UV/Visible
Spectrophotometer (Cambridge, England) equipped with a 1 cm quartz cell (Hewlett Packard,
Mississauga, ON). LC-OCD analysis was conducted according to the method described Huber et
al. (2010) at the University of Waterloo (Waterloo, ON). Samples were filtered through 0.45 um
filter, stored in 40 ml amber glass vials at 4ºC, and shipped for analysis. Periodic calibration curves
and check standards were prepared at the University of Waterloo.
ATP analyses were conducted using a Luminultra Deposit Surface Analysis kit (DSA-
100C, Fredericton, NB) following manufacturer’s instructions. Media samples were stored at 4ºC
and analyzed within 8 hours of collection. Protein and polysaccharide analyses were carried out
using a method adapted from Papineau et al. (2012) and DuBois et al. (1956), respectively. CE
59
3055 Single Beam Cecil UV/Visible Spectrophotometer (Cambridge, England) and a Hach
Odyssey DR/2500 Scanning Spectrophotometer (Mississauga, ON) were used for protein and
polysaccharide analysis, respectively. Samples were extracted and analyzed within 24 hours of
collection.
DBP precursor removal was examined by bench-chlorination of raw water and biofilter
effluents. The 24 hours chlorine (Cl2) demand was determined by dosing samples with 7 mg/L Cl2
in 125 ml chlorine-demand-free amber bottles and the free chlorine residual was measured after
24 hours as described in Standard Method 4500-CI G (APHA, 2012). The free chlorine dosage
was calculated to provide a residual of 1.5±0.5 mg/L after 24 hours. Samples were chlorinated in
500 ml amber bottles with no head space, incubated at 20±2˚C for 24 hours, after which the
chlorine residuals were measured and were quenched using ascorbic acid (100 mg/L).
THMs (chloroform (trichloromethane, TCM), bromodichloromethane (BDCM),
dibromochloromethane (DBCM), and bromoform (tribromomethane, TBM)) were analyzed using
a liquid-liquid extraction gas chromatographic method based on Standard Method 6232 B (APHA,
2012). HAAs (monochloroacetic acid (MCAA), monobromoacetic acid (MBAA), dichloroacetic
acid (DCAA), trichloroacetic acid (TCAA), bromochloroacetic acid (BCAA), dibromoacetic acid
(DBAA), bromodichloroacetic acid (BDCAA), dibromochloroacetic acid (DBCAA), and
tribromoacetic acid (TBAA)) analyses were conducted using a liquid-liquid extraction gas
chromatographic method based on Standard Method 6251 B (APHA, 2012). A Hewlett Packard
5890 Series II Plus Gas Chromatograph (Mississauga, ON) equipped with an electron capture
detector (GC-ECD) and a DB 5.625 capillary column (Agilent Technologies Canada Inc.,
Mississauga, ON) was used for THM and HAA analysis. Check standards for THM and HAA
were analyzed after every tenth sample as per Standard Method 1020 (APHA, 2012); QA/QC
charts are shown in Appendix C. AOX analysis was conducted using a titration method based on
Standard Method 5320 (APHA, 2012) using a Trace Element Instruments Xplorer Organic
Halogens Analyzer (Delft, Netherlands).
4.2.6 Statistical Analysis
A paired t-test was used to evaluate the impact of the nutrient (nitrogen and/or phosphorus),
peroxide, and alum additions on DOC removal, turbidity reduction and headloss. A student’s t-test

60
was used to determine impacts on DBP precursor removal and UV254 reduction. All statistical
analyses were performed at the 95% confidence level.
4.2.7 UF Fouling Quantification
Membrane fouling was quantified by calculating the increase in membrane resistance over
the first 60 cycles (30 min each) for each UF experiment (if not available, the maximum number
of cycles was used). The reversible fouling rate for each cycle was calculated as the difference
between the final and starting resistance of two consecutive cycles; while the irreversible fouling
was calculated by subtracting the initial resistance of these cycles. Statistical analysis was not
performed since the UF experiments were not duplicated.
4.3 Results and Discussion
4.3.1 Biofilter Acclimation and Activity
Biological activity was determined by measuring ATP levels on biofilter media whereas
acclimation was determined by measuring DOC removal. Following installation of the large
biofilters in October 2012, DOC removals by biofiltration were monitored. After 2 months of
operations, the filters had a high ATP concentrations (approximately 800 ng/g), the DOC removal
remained below 2%. As the raw water temperature increased, the DOC removal increased and
reached steady-state removal (7±4%) once water temperature exceeded 20˚C. The small
anthracite/sand filters were installed in February 2013, and ATP levels monitored from June 2013.
The ATP concentrations were significantly lower than that of large filters (125±80 ng/g compared
to 635±5 ng/g). Yet, by the end of July, the small filters had similar ATP concentrations to the
large ones (800±107 ng/g compared to 541±78 ng/g). The average DOC removal for the small
filters was 4±3% in June and July. The GAC biofilter media, which has been in service for 8 years,
was installed on the June, 4th 2013. ATP concentration and DOC removal were approximately
1350 ng/g and 5±4%, respectively. The filters were deemed to be fully acclimated by the end of
July 2013, at which point, the DOC removals of all filters were found to be statistically similar
using a paired t-test (α= 0.05). This shows that the control filters are the same and by which the
first stage of enhacment was intiated.

61
Figure 4.2: ATP concentrations of biofilter media during the experimental period, test error <10%
based on manufacturer manual
4.3.2 Impact of Engineered Biofiltration on Turbidity Removal
The large and small biofilters removed 64±10% and 50±20% of the raw water turbidity
(0.333-0.842 NTU), respectively (data in Appendix B). There was no statistical difference between
the large and small control biofilters (α= 0.05, n= 6). Nutrient enhancement, alum and peroxide
addition did not impact on turbidity removal (α= 0.05, n= 5). In all instances, the biofilter effluent
had a turbidity level < 0.3 NTU as required by Health Canada for chemically assisted filtration
(Health Canada, 2009), except for one recording of < 0.4 NTU on the 12th August 2013 for the
small biofilters. The goal of this study was not to evaluate biofiltration as a single treatment process
but as a pre-treatment for ultrafiltration which itself can provide high turbidity removals, but it is
reassuring that biofiltration can perform to regulatory guidelines.
1
10
100
1000
10000
4-Jun-13 24-Jul-13 30-Sep-13 23-Oct-13 18-Nov-13
AT
P (
ng/g
med
ia)
Logar
ithm
ic-s
cale
Control Large (BF1) Nutrient Enhancement (BF2)
Control Small (BF3) Peroxide Addition (BF4)
Alum Addition (BF5) GAC (BF6)
C:N:P 100:30:2
H2O2 0.1 mg/L
Alum 0.1 mg/L
C:N:P 100:40:2
H2O2 0.5 mg/L
Alum 0.5 mg/L
C:N:P 100:40:20
H2O2 1 mg/L
Alum 0.25 mg/L
C:N:P 100:30:0
H2O2 0 mg/L
Alum 0 mg/L
N
ot
inst
alle
d

62
4.3.3 Impact of Engineered Biofiltration on NOM Removal
The DOC removal achieved by biofiltration across the control filters (one large and one
small) was consistently 5±2% (n= 18) throughout the experiment as shown in Figure 4.3. Direct
biofiltration studies conducted by Hallé et al. (2009) reported removals of 11% on average; also,
Peldszus et al. (2012) reported removals <15%. DOC removal was heavily influenced by water
temperature (Figure 4.2), where lower temperatures resulted in lower DOC removals which is
consistent with results reported by Emelko et al. (2006) and Moll et al. (1999) where they reported
a reduction in DOC and TOC removals at cold (<5˚C) temperatures.
DOC removal was not impacted (α= 0.05) by nitrogen, phosphorus, and alum addition in
this study, irrespective of the chemical dose (Figure 4.3), which was unexpected. The
ineffectiveness of nutrient enhancement is in contrast with the literature. A possible explanation is
a biodegradable carbon limitation in water, whereby the biofilters consumed all of the easily
biodegradable organic material. This hypothesis is supported by the fact that the supplemented
phosphorus or nitrogen were not utilized or consumed across the filter (no change was observed
between the influent and effluent phosphorus and nitrogen concentrations). Further studies could
examine biodegradable DOC (BDOC) or assimilable organic carbon (AOC) and impact of ozone.
As expected, hydrogen peroxide addition did not impact DOC removal as supported by the
literature (Urfer and Huck, 1997). Theoretically, an alum dose of 0.1-0.5 mg/L is sufficient to
reduce the biopolymer fraction (biopolymers were <10% of DOC), yet no variation in DOC was
observed in the biofilter effluent (α= 0.05). Hallé et al. (2009) also reported similar results,
suggesting that DOC measurements are not sensitive enough to detect biopolymer removal. GAC
was the most effective filter for DOC removal and removed an additional 0.1 mg/L of DOC on
average in comparison to control (α= 0.05). As previously discussed, the ability of GAC to remove
DOC might be attributed to higher surface area and/or the bio-regeneration at adsorption sites.
NOM characterization by LC-OCD was used to calculate the biopolymer removal by
biofiltration (Table 4.3). The control biofilters readily removed 20±4% (large column) and 16±7%
(small column) of raw water biopolymers (initial concentration (C0)= 0.41-0.53 mg/L). This trend
was not reflected in the DOC removals, demonstrating that DOC is not an effective tool for
predicting BP removal. Phosphorus addition (at 0.025 mg/L PO4-P to adjust C:N:P 100:30:2)
increased the biopolymer removal by 4%; however, the removal decreased by 25% when the C:N:P

63
Figure 4.3: DOC removal (%) by biofiltration (x-axis not to scale)
0
5
10
15
20
25
30
-2
0
2
4
6
8
10
12
14
T (
˚C)
DO
C R
emoval
(%
)Control Large (BF1) Nutrient Enhancement (BF2) Control Small (BF3)
Peroxide Addition (BF4) Alum Addition (BF5) GAC (BF6)
T (˚C)
C:N:P 100:40:2
H2O2 0.5 mg/L
Alum 0.5 mg/L
C:N:P 100:40:20
H2O2 1 mg/L
Alum 0.25 mg/L
C:N:P 100:30:2
H2O2 0.1 mg/L
Alum 0.1 mg/L
C:N:P 100:30:0
H2O2 0 mg/L
Alum 0 mg/L

64
ratio was adjusted to 100:40:2 by adding 0.25 mg/L PO4-P and 0.1 mg/L NH4-N. This indicates
that phosphorous dosing has a point of diminishing and even detrimental returns. Applying 0.1
mg/L of peroxide increased biopolymer removal by 4% when compared to control; however, when
the dose was increased to 1 mg/L, the biopolymer removal decreased by 5%. This could reflect the
peroxide-induced degradation of biofilm or EPS where approximately 50% less EPS was measured
in comparison to control. As expected, applying 0.1 and 0.25 mg/L of alum removed an additional
2% and 4% of biopolymers, respectively. This translates into an overall removal of 0.01 and 0.02
mg/L of biopolymers across the filter. In terms of media type, GAC did not provide an additional
advantage when compared to anthracite as the biopolymer removal by GAC was similar to the
anthracite control (α= 0.05) at 15±10%. It has been documented that biopolymers are relatively
large in terms of size (molecular weight) which may prevent them from accessing GAC absorptive
sites (Gibert et al., 2013; Velten et al., 2011b); thus, biopolymer removal by GAC was attributed
to solely to biological activity.
Table 4.3: Biopolymer and humic substance removals (%) by biofiltration, where BP=
biopolymers, HS= humic substances, and NS = not sampled.
Sample Date 16-Jun-13 12-Aug-13 24-Sep-13 12-Nov-13
Filter/Compound BP HS BP HS BP HS BP HS
Control Large (BF1) 22% 3% 21% -1% 21% 0% 15% 0%
Nutrient Enhancement
(BF2) -13% -2% 27% 4% 22% 3% 11% -5%
C:N:P 100:30:0 100:30:2 100:40:20
Control Small (BF3) 8% 4% 9% -4% 23% 1% 15% 1%
Peroxide Addition
(BF4) NS NS 13% -4% 24% 7% 9% 0%
Dose H2O2 0 mg/L H2O2 0.1 mg/L H2O2 1 mg/L
Alum Addition (BF5) 5% 5% 7% -4% 26% 5% 19% 1%
Dose Alum 0 mg/L Alum 0.1 mg/L Alum 0.25 mg/L
GAC (BF6) 17% 4% 0% 0% 25% 2% 17% -2%
As identified by LC-OCD, biofiltration was ineffective at removing humic substances
(Table 4.3). The large and small control biofilters removed 0±2% and 0±4% (n= 4) of the raw
waters humic substances (HS) (C0= 3.0-3.3 mg/L), respectively. Hallé et al. (2010) reported
preferential biopolymer removal (61±22%) and low (6±4%) HS removal by biofiltration. Unlike

65
biopolymers, phosphorus and nitrogen addition did not have an impact on HS. However, by the
end of the enhancement period, application of 0.1 mg/L of peroxide and alum increased the humic
substance removal from 1% in control to 7% and 5%, respectively. No improvement was observed
when the peroxide concentration was increased to 1 mg/L or when alum was increased to 0.25
mg/L. These results highlight the importance of dosing at optimal levels, rather than in excess.
GAC media did not have an effect on HS removal (α= 0.05) when compared to the anthracite
control.
4.3.4 Impact of Enhancement Strategies on Headloss (LOH)
The addition of 0.1, 0.5, and 1 mg/L hydrogen peroxide had a positive effect on
performance by decreasing headloss by 9, 48, and 40%, respectively (Table 4.4). In the first stage,
where 0.1 mg/L was added, the reduction was not significant, but in the second and third stages,
the reduction proved to be statistically significant (α= 0.05). The peroxide reacted immediately
with raw water resulting in a 0.1-0.3 mg/L demand prior to the filter influent, and no residual was
detected in the filter effluent (MDL= 0.1 mg/L). Headloss reduction is presumed to be a direct
result of EPS degradation. EPS is composed mainly of proteins and polysaccharides; it was found
that both constituents were approximately 30% higher when compared to control during the first
stage when 0.1 mg/L peroxide was applied; additionally, they were 6% and 52% lower,
respectively, when applying 0.5 and 1 mg/L peroxide (Figure 4.4). Lauderdale et al. (2011) also
reported lower EPS in peroxide-enhanced biofilter (1 mg/L). The effect of alum on headloss was
found to be dose-dependent, where 0.1 mg/L was the optimal dose resulting in a 40% decrease in
LOH. When the dose was increased to 0.25 mg/L, the filter performed similarly to the control (α=
0.05); however, a significant increase in LOH was noted when the dose increased to 0.5 mg/L
alum (α= 0.05). Typically, direct filtration coagulant dosages are lower than 20 mg/L, and are
expected to increase headloss, except during period of low turbidity and TOC conditions. This is
because aluminum hydroxide ions can precipitate and clog the filter (Edzwald et al., 1987). Yet in
this study, 0.1 and 0.25 mg/L of alum did not have an adverse effect on LOH. As such, low
coagulant dosages (<0.5 mg/L) have the potential for use in high turbidity (0.3-0.9 NTU) and DOC
(5-7 mg/L) water without significant impact on headloss. GAC filter had similar headloss to that
of the anthracite filter.
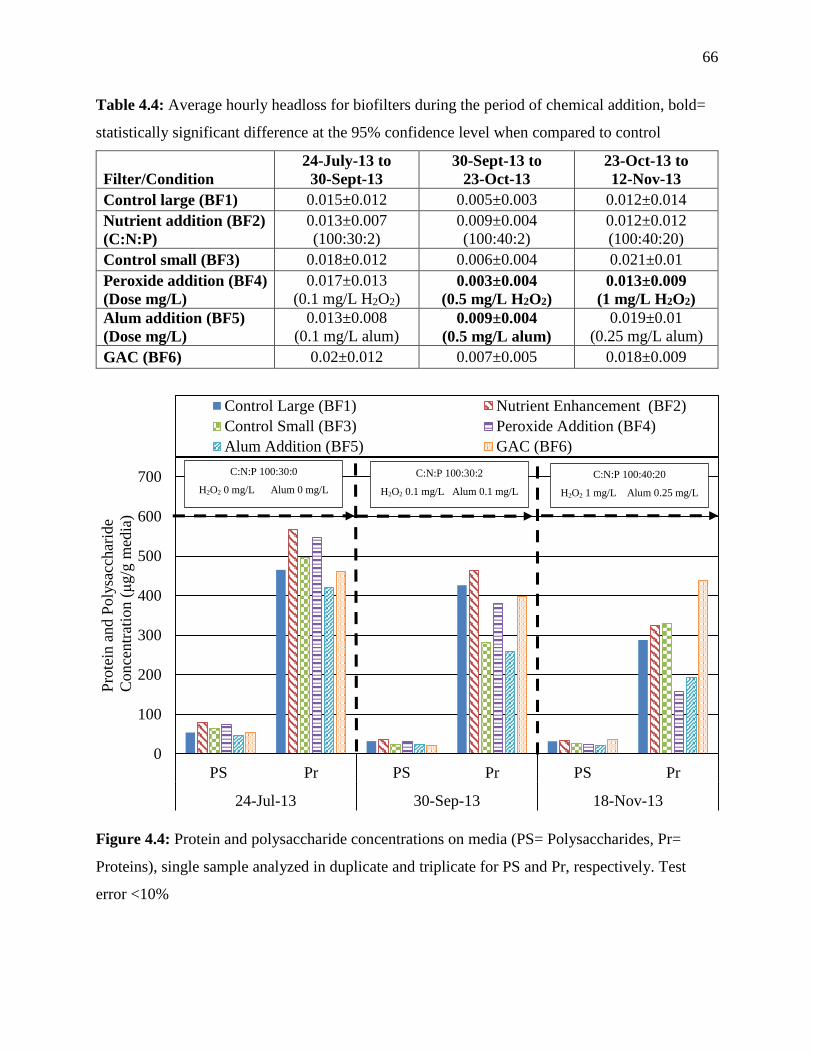
66
Table 4.4: Average hourly headloss for biofilters during the period of chemical addition, bold=
statistically significant difference at the 95% confidence level when compared to control
Filter/Condition
24-July-13 to
30-Sept-13
30-Sept-13 to
23-Oct-13
23-Oct-13 to
12-Nov-13
Control large (BF1) 0.015±0.012 0.005±0.003 0.012±0.014
Nutrient addition (BF2)
(C:N:P)
0.013±0.007
(100:30:2)
0.009±0.004
(100:40:2)
0.012±0.012
(100:40:20)
Control small (BF3) 0.018±0.012 0.006±0.004 0.021±0.01
Peroxide addition (BF4)
(Dose mg/L)
0.017±0.013
(0.1 mg/L H2O2) 0.003±0.004
(0.5 mg/L H2O2)
0.013±0.009
(1 mg/L H2O2)
Alum addition (BF5)
(Dose mg/L)
0.013±0.008
(0.1 mg/L alum) 0.009±0.004
(0.5 mg/L alum)
0.019±0.01
(0.25 mg/L alum)
GAC (BF6) 0.02±0.012 0.007±0.005 0.018±0.009
Figure 4.4: Protein and polysaccharide concentrations on media (PS= Polysaccharides, Pr=
Proteins), single sample analyzed in duplicate and triplicate for PS and Pr, respectively. Test
error <10%
0
100
200
300
400
500
600
700
PS Pr PS Pr PS Pr
24-Jul-13 30-Sep-13 18-Nov-13
Pro
tein
and P
oly
sacc
har
ide
Conce
ntr
atio
n (
μg/g
med
ia)
Control Large (BF1) Nutrient Enhancement (BF2)
Control Small (BF3) Peroxide Addition (BF4)
Alum Addition (BF5) GAC (BF6)
C:N:P 100:40:20
H2O2 1 mg/L Alum 0.25 mg/L
C:N:P 100:30:0
H2O2 0 mg/L Alum 0 mg/L
C:N:P 100:30:2
H2O2 0.1 mg/L Alum 0.1 mg/L

67
As shown in Figure 4.5, ATP concentrations were weakly correlated with protein
concentration (R2= 0.50), but no correlation was detected with polysaccharides (R2= 0.29),
suggesting EPS constituents are not a good surrogate for biological activity.
Figure 4.5: Relationship between ATP, proteins and polysaccharides
4.3.5 DBP Precursor Reduction
Biofiltration was an effective mean of reducing DBP formation potential (DBPFP) for
THMs, HAAs, and AOX (Figure 4.6). THMs consisted primarily of TCM and BDCM whereas
HAAs consisted of BCAA and TCAA. THMs and HAAs comprised 55±7% of the total AOX,
leaving 45% as unknown AOX. THM formation potentials (C0= 145-202 μg/L in raw water) were
significantly reduced by 20±11% by the large filter and by 18±9% across the small biofilter (α=
0.05). Similarly, HAAs (C0= 60-132 μg/L in raw water) decreased by 14±10% and 12±10% in the
large and small control filters, respectively. However, this decrease was not statistically
significant. Influent AOX (C0= 475-557 μg/L) was reduced by 6±11% and 11±10%, respectively,
however these too were not significant. These DBP precursor removals are similar to those
observed by others (Chaiket et al., 2002; Wang et al., 1995). Chaiket et al. (2002) reported 1-25%
removals for THMs and 6-25% for HAAs.
y = 0.13x + 7.5
R² = 0.27
y = 0.41x + 109
R² = 0.50
0
100
200
300
400
500
600
700
800
0 200 400 600 800 1000 1200
Pro
tein
and P
oly
sacc
har
ide
conce
ntr
atio
n (
ug/g
med
ia)
ATP concentration (ng/g media)
Proteins Polysaccharides

68
Figure 4.6: DBP formation potentional. Single samples analyzed in duplicate, vertical bars represent one standard deviation.
0
100
200
300
400
500
600
TH
M, H
AA
and A
OX
Conce
trat
ion (
μg/L
as
Cl- )
THMs HAAs Unknown AOX
C:N:P 100:30:2
H2O2 0.1 mg/L Alum 0.1 mg/L 24-Sept-13
C:N:P 100:40:2
H2O2 0.5 mg/L Alum 0.5 mg/L 23-Oct-13
C:N:P 100:40:20
H2O2 1 mg/L Alum 0.25 mg/L 21-Nov-13
C:N:P 100:30:0
H2O2 0 mg/L Alum 0 mg/L 24-July-13
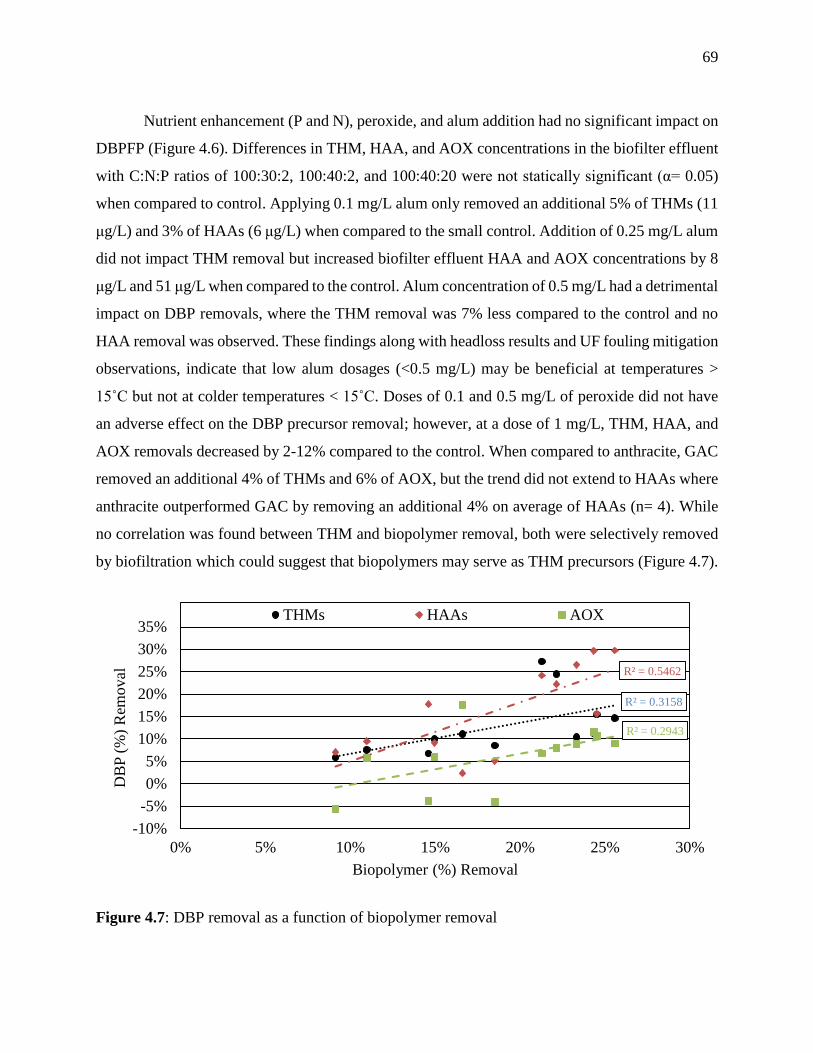
69
Nutrient enhancement (P and N), peroxide, and alum addition had no significant impact on
DBPFP (Figure 4.6). Differences in THM, HAA, and AOX concentrations in the biofilter effluent
with C:N:P ratios of 100:30:2, 100:40:2, and 100:40:20 were not statically significant (α= 0.05)
when compared to control. Applying 0.1 mg/L alum only removed an additional 5% of THMs (11
μg/L) and 3% of HAAs (6 μg/L) when compared to the small control. Addition of 0.25 mg/L alum
did not impact THM removal but increased biofilter effluent HAA and AOX concentrations by 8
μg/L and 51 μg/L when compared to the control. Alum concentration of 0.5 mg/L had a detrimental
impact on DBP removals, where the THM removal was 7% less compared to the control and no
HAA removal was observed. These findings along with headloss results and UF fouling mitigation
observations, indicate that low alum dosages (<0.5 mg/L) may be beneficial at temperatures >
15˚C but not at colder temperatures < 15˚C. Doses of 0.1 and 0.5 mg/L of peroxide did not have
an adverse effect on the DBP precursor removal; however, at a dose of 1 mg/L, THM, HAA, and
AOX removals decreased by 2-12% compared to the control. When compared to anthracite, GAC
removed an additional 4% of THMs and 6% of AOX, but the trend did not extend to HAAs where
anthracite outperformed GAC by removing an additional 4% on average of HAAs (n= 4). While
no correlation was found between THM and biopolymer removal, both were selectively removed
by biofiltration which could suggest that biopolymers may serve as THM precursors (Figure 4.7).
Figure 4.7: DBP removal as a function of biopolymer removal
R² = 0.3158
R² = 0.5462
R² = 0.2943
-10%
-5%
0%
5%
10%
15%
20%
25%
30%
35%
0% 5% 10% 15% 20% 25% 30%
DB
P (
%)
Rem
oval
Biopolymer (%) Removal
THMs HAAs AOX

70
4.3.6 Engineered Biofiltration for Ultrafiltration Fouling Mitigation
To evaluate whether biofiltration can reduce UF fouling, two ultrafiltration units were run
in parallel; one with raw water and the other with effluent from the control biofilter (large) for 28
hours. Biofiltration reduced the irreversible fouling resistance rate from (7.4±29)×1010 m-1/cycle
(m-1/c) to (2.7±25)×1010 m-1/c (Figure 4.8), which translates into a 60% improvement. No impact
was observed on the reversible fouling as it remained at an average of 1.1×10¹² m-1/c for both UF
units. Reduction in the irreversible UF fouling was attributed to biopolymer removal (20±4%) and
particulate matter removal (turbidity removal of 64±10%). Further investigation to quantify the
biopolymer, protein, and polysaccharide rejection by the membrane would clarify which
constituent is responsible for the irreversible fouling. The control biofilter was connected to the
UF immediately following a backwash. This resulted in an initial increase in membrane resistance
by approximately 3×10¹² m-1 over 4 cycles (approximately 2 hours) (Figure 4.8). This filter
ripening effect was transient in nature and did not adversely affect the overall results, however in
future studies, it is recommended that filters should be given 3 hours of run time post-backwash
prior to connection with the UF units.
Figure 4.8: Normalized UF resistance profile comparing raw water vs large control biofilter
effluent (October, 30th 2013, T= 11˚C)
Both large and small biofilters had similar irreversible fouling rates (6.5±48)×1010 m-1/c
and (6.9±35)×1010 m-1/c, respectively, therefore biofilter size did not influence fouling profiles.
0
2
4
6
8
0 5 10 15 20 25 30
Norm
aliz
ed m
embra
ne
resi
stan
ce @
20
˚C (
×1
01
2 m
-1)
Permeation Time (hr)
Control Large (BF1)
Raw Water

71
Phosphorus and nitrogen addition (C:N:P 100:40:20 or stage 3) did not improve
irreversible fouling rates (7.8±22)×1010 m-1/c and (7.7±57)×1010 m-1/c, for nutrient enhance and
control, respectively (Figure 4.9). The reversible fouling rate, however, increased by
approximately 50% and was attributed to the lower biopolymer removals where nutrient enhanced
removed 11% compared to 15% in control. Turbidity removal followed a similar trend with
removals of (49% compared to 55%), for the nutrient enhanced and control (data not shown).
Figure 4.9: Normalized UF resistance profile comparing nutrient enahnced vs large control
biofilter effluent (BF1: November 18th,2013, T= 7ºC. BF2: November 15th, 2013, T= 6ºC)
In-line coagulation prior to biofiltration at dosages of 0.1, 0.25, and 0.5 mg/L was evaluated
in terms of UF fouling control (Figures 4.10, 4.11, and 4.12). When compared to the control,
application of 0.1 and 0.25 mg/L alum decreased irreversible fouling by 60% and 35%,
respectively. This improvement might be attributed to the minimal increase biopolymer removal
(3-4% more than the control), which underlines the importance of biopolymer removal for
irreversible UF fouling control. From an operational standpoint, irreversible fouling mitigation is
a key consideration for minimizing costs. These improvements in irreversible fouling rates did not
translate into improvements in reversible fouling, which increased by approximately 30% and 55%
compared to the control for the respective runs. It is well documented that alum performance
decreases with water temperature (Van Benschoten and Edzwald, 1990) and during the study,
temperatures steadily decreased which could have resulted in poor biopolymer removal, despite
the increase in dose. The increase in alum dose may also result in an increase in aluminum residuals
0
2
4
6
8
0 5 10 15 20 25 30
Norm
aliz
ed m
emb
ran
e
resi
stan
ce @
20
˚C (
×10
12
m-1
)
Permeation Time (hr)
Control Large (BF1)
Nutrient Enhanced (BF2, C:N:P 100:40:20)

72
(not measured), which can foul the UF membrane (Zheng et al., 2012). This was more pronounced
when applying 0.5 mg/L where no irreversible fouling improvement was observed. Conversely, it
resulted in lower reversible fouling rates of 35% when compared to control. This improvement can
be attributed to the formation of cake layer that prevents further attachment of foulants, as
discussed by Paar et al. (2011) and Zheng et al (2012). LC-OCD data was not available for this
testing condition; therefore biopolymer removal could not be analytically quantified or correlated.
Figure 4.10: Normalized UF resistance profiles comparing 0.1 mg/L in-line alum vs large
control biofilter effluent (Septmeber, 16th 2013, 18˚C)
Figure 4.11: Normalized UF resistance profile showing the impact of 0.25 mg/L in-line alum vs
small control biofilter effluent (BF3: Novermber 20th, 2013, T= 6.5ºC. BF5: November 22th,
2013, T= 5.5ºC)
0
2
4
6
8
0 5 10 15 20 25 30
Norm
aliz
ed m
emb
ran
e
resi
stan
ce @
20
˚C (
×10
12
m-1
)
Permeation Time (hr)
Control Large (BF1)
Alum Addition (BF5, 0.1 mg/L)
0
2
4
6
8
0 5 10 15 20 25 30
No
rmal
ized
mem
bra
ne
resi
stan
ce @
20
˚C (
×10
12
m-1
)
Permeation Time (hr)
Control Small (BF3)
Alum Addition (BF5, 0.25 mg/L)

73
Figure 4.12: Normalized UF resistance profile the impact of 0.5 mg/L in-line alum vs small
control biofilter effluent (October 7th, 2013, T= 18ºC)
Peroxide addition (at 1 mg/L) increased the reversible fouling by 45% and had little impact
on irreversible, with a nominal increase of 5% as compared to control (Figure 4.13). Peroxide can
degrade EPS causing the release of proteins and polysaccharides in biofilter effluent. This is
supported by the 60% reduction of EPS constituent in the biofilter media when 1 mg/L peroxide
was added. LC-OCD corroborates the peroxide-induced degradation of EPS since the biopolymer
concentration actually increased (by 0.03 mg/L) in the filter effluent, in comparison to control. The
improvement in headloss with peroxide did not translate into improvements in UF fouling, in fact,
peroxide adversely affected UF performance. This novel finding merits further investigation of
peroxide doses < 1 mg/L.
GAC resulted in a similar irreversible fouling as compared to anthracite, but 29% lower
reversible fouling (Figure 4.14) and is reflected by a slight increase in biopolymer removal (2%),
again demonstrating the importance of biopolymers when discussing UF fouling. As was the case
for NOM, the improvement in GAC performance was attributed to higher surface area and
potential for reactivation of adsorption sites. Furthermore, this study shows the potential of for the
use of exhausted filter media as a method for eliminating acclimation time.
0
2
4
6
8
0 5 10 15 20 25 30
No
rmal
ized
mem
bra
ne
resi
stan
ce @
20˚C
(×
10
12
m-1
)
Permeation Time (hr)
Control Small (BF3)
Alum Addition (BF5, 0.5 mg/L)

74
Figure 4.13: Normalized UF resistance profile showing the impact of 1 mg/L of peroxide vs the
small control biofilter effluent (November 11th, 2013 T= 8ºC)
Figure 4.14: Normalized UF resistance profiles depict the impact of filter media type ( GAC vs
anthrcite) (BF3: Novermber 20th, 2013, T= 6.5ºC. BF6: November 25th, 2013, T= 4ºC)
4.4 Summary
Biofiltration was found to be effective for turbidity, biopolymer, and DBP precursor
reduction as well as a pre-treatment strategy to reduce irreversible UF fouling. Adjustment of the
C:N:P ratio in the filter influent (to 100:30:2, 100:40:2, and 100:40:20) did not improve
performance. Hydrogen peroxide addition at dosages < 1 mg/L decreased headloss, THM
formation potential, and AOX; however, it adversely affected UF fouling mitigation and HAA
precursor removal. In-line coagulation (< 0.5 mg/L) prior to biofiltration has the potential to
0
2
4
6
8
0 5 10 15 20 25 30
No
rmal
ized
mem
bra
ne
resi
stan
ce @
20
˚C (
×1
01
2 m
-1)
Permeation Time (hr)
Control Small (BF3)Peroxide Addition (BF4, 1 mg/L)
0
2
4
6
8
0 5 10 15 20 25 30
Norm
aliz
ed m
embra
ne
resi
stan
ce @
20˚C
(×
10
12
m-1
)
Permeation Time (hr)
Control Small (BF3) GAC (BF6)

75
improve UF fouling and reduce DBP precursors without impacting headloss by increasing
biopolymer removal. GAC outperformed anthracite in terms of NOM and DBP precursor removal,
and reduced UF reversible fouling; however no impact on irreversible fouling was observed.
Tables 4.5 and 4.6 summarize the findings of the study.
Table 4.5: Impact of filter media and biofiltration conditions on performance parameters (↑=
positive impact, ↓= adverse impact, ●= no impact, = significant and = not statistically
significant at the 95% confidence. Where symbols not present= statistical analysis was not
possible, NS= Not Sampled, NA= Not applicable)
Condition DOC BP HS THMs HAAs AOX LOH
Biofiltration NA ↑ ↑ ● ↑ ↑ ↑ NA
Filter Size NA ● ● ● ● ● ● NA
Nutrient
Enhancement
(C:N:P)
100:30:2 ● ↑ ● ● ● ● ●
100:40:2 ● NS NS ● ● ● ●
100:40:20 ● ↓ ● ● ● ● ●
Peroxide
Addition
(mg/L)
0.1 ● ↑ ↑ ● ● ● ↑
0.5 ● NS NS ● ● ● ↑
1 ● ↓ ● ↓ ↓ ↓ ↑
Alum
Addition
(mg/L)
0.1 ● ↑ ↑ ↑ ↑ ● ↑
0.5 ● NS NS ↓ ↓ ↑ ↓
0.25 ● ↑ ● ● ↓ ↓ ●
Filter Media GAC ↑ ● ● ↑ ↓ ↑ ●
Table 4.6: Impact of biofiltration, filter media, and chemical addition on reversible and
irreversible UF fouling (↑= positive impact, ↓= adverse impact, ●= no impact)
Condition Irreversible UF
fouling control
Reversible UF
fouling control
Biofiltration NA ↑ ●
Filter Size NA ● ↓
Nutrient Enhancement
(C:N:P) 100:30:2 ● ↓
Peroxide Addition (mg/L) 1 ↓ ↓
Alum Addition (mg/L)
0.1 ↑ ↓
0.5 ● ↑
0.25 ↑ ↓
Filter Media GAC ● ↑
76
5. Comparison between Conventional Treatment and
Biofiltration for DBP Precursor Removal and UF
Fouling Control
5.1 Introduction
Application of low pressure membranes such as ultrafiltration (UF) has gained momentum
in recent years because it can provide high quality drinking water at a competitive cost when
compared to conventional treatment (Neubrand et al., 2010; Wang and Wang, 2006). However,
fouling is a major limitation because it can increase operation costs and can damage membrane
surfaces (Howe and Clark, 2002; Singh, 2006). Natural organic matter (NOM) and particulates
have been identified as major foulants (Wang and Wang, 2006); recent studies have shown that
biopolymers and colloids may represent the major sources of irreversible organic fouling (Hallè,
2010; Neubrand et al., 2010; Zheng et al., 2010; Zheng et al., 2012). Coagulation may result in
severe irreversible fouling if improper dosing occurs (Malievialle et al., 1996; Neubrand et al.,
2010; Wang and Wang, 2006). Biofiltration presents a cost effective and chemical-free process for
fouling control (Hallé et al., 2009; Huck et al., 2011). Yet, a parallel comparison between
biofiltration and coagulation has not been performed to date (Peldszus et al., 2012).
Coagulation enables the destabilization of particles by different mechanisms (e.g. charge
neutralization, sweep flocculation) to facilitate the formation of larger particles that can be
removed by settling or filtration (Crittenden et al., 2012). Coagulation is effective for removing
NOM and DBP precursors (Matilainen et al., 2010). Different coagulation configurations have
been applied as UF pre-treatment including coagulation/flocculation with/without sedimentation
(Crittenden et al., 2012), and in-line coagulation (Neubrand et al., 2010; Wang and Wang, 2006;
Zheng et al., 2012). Some studies reported improvement in UF fouling mitigation when applying
coagulation upstream (Choi and Dempsey, 2004; Li et al., 2013), while others did not (Howe and
Clark, 2006; Neubrand et al., 2010). Howe and Clark (2006) observed that coagulation was
effective for UF fouling control at an enhanced dose but not at lower doses. Wray et al. (2014) did
not observe an improvement when applying coagulation (< 15 mg/L alum, below enhanced
dosages) as a pre-treatment for UF membranes and found the point of diminishing return for
biopolymer removal to be 0.1 mg/L.
77
Applying biofiltration as a UF pre-treatment to reduce organic fouling has been explored
by others (Basu and Huck, 2004; Hallé et al., 2009; Huck et al., 2011). Hallé et al. (2009) reported
an increase of 9 psi at 2000 L/m2 in UF transmembrane pressure (TMP) when using raw water.
However, when using biofilter effluent with EBCT of 5 and 14 minutes, a decrease in TMP rates
of 4 and 1 psi at a permeate volume of 7500 L/m2, respectively, were reported. Peldszus et al.
(2011) found that pilot-scale biofilters operated at 5, 10 and 15 minutes were effective for fouling
control even at low temperatures (2-14°C). In contrast, Geismar et al. (2012) reported the impact
of post ozonation lab-scale BAC (EBCT= 11 min) on the unified membrane fouling index (UMFI)
to be statically insignificant (α= 0.05).
The objective of this pilot-scale study was to compare biofiltration to coagulation/
flocculation/sedimentation with/without filtration in terms of NOM removal, DBP precursor
reduction, and ultrafiltration (UF) fouling mitigation. Two parallel pilot-scale conventional
treatment trains using aluminum sulfate (alum) and polyaluminum chloride (PACl) and a
biofiltration train were used for this research. In addition, full-scale plant effluent samples were
collected for comparison.
5.2 Materials and Methods
5.2.1 Source Water Quality
The study was conducted at Peterborough water treatment plant, where the Otonabee River
(Ontario, Canada) was used as source water. The water was pre-chlorinated for zebra mussel
control when the water temperature was > 12˚C. Prior to biofiltration, chlorine (< 0.5 mg/L) was
quenched by applying sodium thiosulfate at 3.5 mass ratio. Raw water DOC ranged from 5.8-7.3
mg/L with turbidities between 0.3 and 1.5 NTU; temperature ranged from 3 to 25˚C during the
study period.
5.2.2 Pilot- and Full-scale Plant Configuration
The pilot-plant consisted of two parallel conventional treatment trains (using alum and
PACl as coagulants) and a biofiltration column. The coagulation train consisted of rapid mix,
tapered flocculation, parallel plate settlers, and a glass dual media filter (Diameter (D)= 15.24 cm,
empty bed contact time (EBCT)= 12-36 min). The biofilter (D= 15.24 cm) was operated at an

78
EBCT of 11 minutes. A general schematic of the pilot-plant configuration is shown in Figure 5.1.
The filters (biological and conventional) contained 50 cm of anthracite (effective size (d10)= 0.85,
uniformity coefficient (UC)= 1.8) on top of 50 cm of sand (d10= 0.5, UC= 1.8); a wedge wire plate
was used to support the media. The water level above each filter was maintained at 90 cm from
the top of the filter media (constant head mode). The conventional filters were backwashed using
chlorinated full-scale plant effluent when the required flow could not be maintained or a maximum
of twice a week. The biofilter was backwashed using its own effluent when the required flow could
not be maintained, or a maximum of three times per week (on Monday, Wednesday, and Friday).
The backwash procedure included a slow backwash with air scour for 2 minutes (30% bed
fluidization) followed by an 8 minutes of fast backwash at collapse pulsing conditions (50% bed
fluidization), and a slow backwash for 4 minutes. The full-scale plant configuration was similar to
that of the pilot; however, the filters contained 37 cm of anthracite on top of 40 cm of sand, and
23 cm of gravel was used for support. Media and non-chlorinated plant effluent samples were
collected from full-scale filter #11. The average full-scale plant alum dosage was applied at the
pilot and was adjusted every two weeks. A PACl dose which provided an equivalent DOC, when
compared to alum, was used as well (Appendix D, Figure 8.13). The conventional pilot treatment
train was off-line from 28th June until 18th October 2013; a transition study took place between
November 8th and 31st, 2013, where coagulants were switched between the pilot-plant conventional
treatment trains. The biofilter’s EBCT varied between 11 and 30 minutes during the month of June
2013, otherwise it was stable at 11 minutes for the rest of the study.
5.2.3 Ultrafiltration Unit and Fouling Quantification
Two automated ultrafiltration pilot systems were adapted for this research work as
discussed in section 4.2.3. The reversible and irreversible fouling was calculated as described in
section 4.2.7.
5.2.4 Analytical Methods
The biofiltration and the two conventional treatment trains were equipped with on-line
water quality instruments and connected to the full-scale plant sophisticated supervisory control
and data acquisition (SCADA) system. These included pH (Hach DPD1P1, Mississauga, ON),
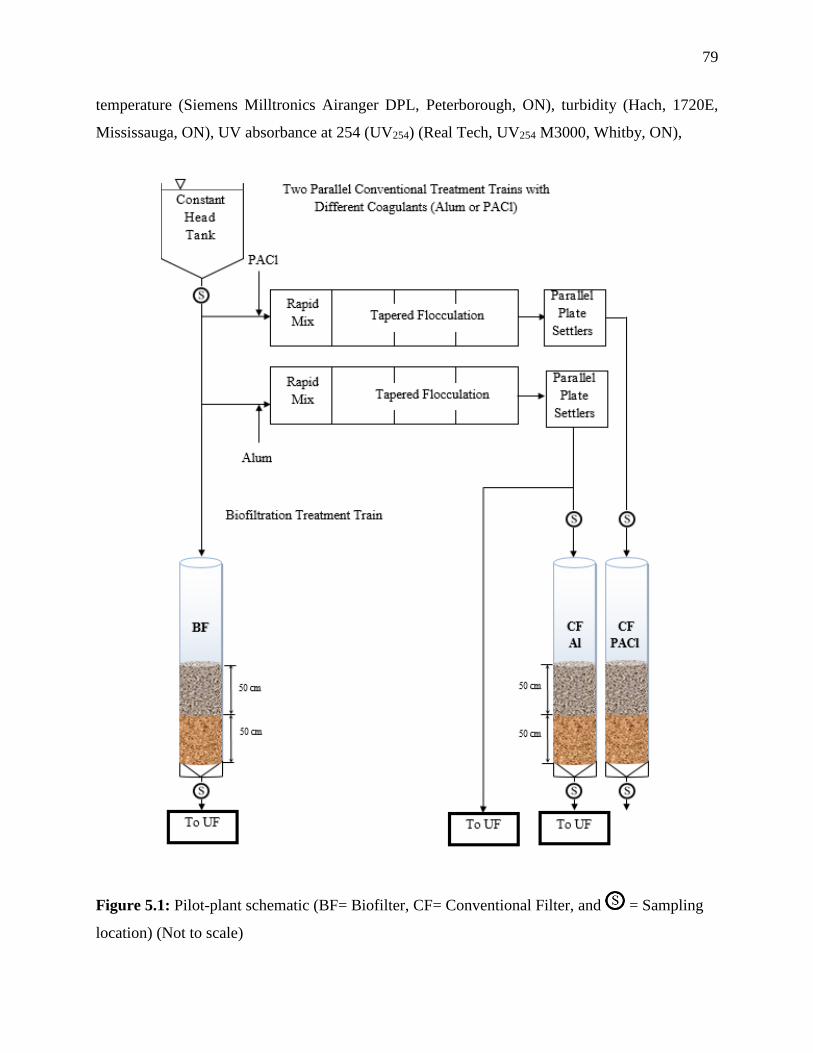
79
temperature (Siemens Milltronics Airanger DPL, Peterborough, ON), turbidity (Hach, 1720E,
Mississauga, ON), UV absorbance at 254 (UV254) (Real Tech, UV254 M3000, Whitby, ON),
Figure 5.1: Pilot-plant schematic (BF= Biofilter, CF= Conventional Filter, and = Sampling
location) (Not to scale)

80
dissolved organic carbon (DOC) (General Electric, 5310 C On-Line TOC analyzer, Colorado,
USA), and differential headloss meters (Siemens, Sitrans P XP/DIP, Peterborough, ON).
The following parameters were measured for raw water, full- and pilot-plant conventional
treatment (alum and PACl), and biofilter effluents (biofiltration samples were obtained 4 hours
after a backwash before Aug 12th, 2013, and 26 hours after a backwash onwards as it was discussed
in section 3.3.3): liquid chromatography-organic carbon detection (LC-OCD), 24 hours
disinfection by-product (DBPs) formation potentials (DBPFP) (trihalomethanes (THMs),
haloacetic acids (HAAs), and absorbable organic halogens (AOX)) as described in section 4.2.5.
Adenosine triphosphate (ATP), polysaccharides (PS) and proteins (Pr) were also measured on filter
media obtained at approximately 48 hours of a given filter run as described in section 4.2.5. Media
samples were collected from the surface of the filters.
DBPs were formed by chlorinating raw water and biofilter effluents. 24 hour chlorine (Cl2)
demands were estimated by dosing the conventional treatment and biofilter samples with 5 and 7
mg/L Cl2, respectively, as discussed in section 4.2.5.
5.2.5 Statistical Analysis
A paired t-test was used to compare DOC, UV254, DBP precursor, turbidity, biopolymer,
and humic substance removals and headloss between the treatment options. All statistical analyses
were performed at the 95% confidence level.
5.3 Results and Discussion
5.3.1 Biofilter Acclimation and Activity
The anthracite/sand filter was installed in October 2012 at the Peterborough Water
Treatment Plant and fed raw unchlorinated water to encourage biological growth. Adenosine tri-
phosphate (ATP) measurements serve as a reliable surrogate for estimating the microbial content
present in filter media (Magic-Knezev and van der Kooij, 2004; Velten et al., 2007). While
biological activity can be inferred from ATP measurements, performance of the biomass was
determined by biodegradation of organic material or DOC removal across the filter. DOC removals
were low (< 2%) during the winter months despite the high ATP concentrations (> 800 ng/g
media), as measured in December 2012 (Table 5.1). DOC removal increased as a function of water

81
temperatures (from 3 to 20°C) and reached 7±2% by June 2013. Biofilter media ATP
concentrations (706±217 ng/g media) were similar to values reported by Lauderdale et al. (2012)
of approximately 800 ng/g media, and were 1-2 orders of magnitude higher than the non-
biological, conventional treatment filters (α= 0.05) (Table 5.1). ATP concentrations on
conventional filters remained below 100 ng/g throughout the study. Pilot- and full-scale filter
media had similar ATP concentrations (α= 0.05).
Table 5.1: ATP concentrations (ng/g media) on biofilter and conventional filters media, NS=
Not sampled. a Transition study: coagulants were switched between trains
Date/Filter Biofilter Full-scale Plant
Filter #11
Pilot-plant filter
(Alum)
Pilot-plant filter
(PACl)
22-Dec-12 889 94 42 10
20-Feb-13 1115 48 35 26
4-Jun-13 708 28 8 7
24-Jul-13 814 76 NS NS
30-Sep-13 493 67 NS NS
23-Oct-13 259 52 NS NS
18-Nov-13a 669 68 8 58
5.3.2 Turbidity Removal
The biofilter was effective (71±11%) at removing raw water turbidity (0.29-1.46 NTU)
(Figure 5.2). Pilot conventional treatment trains (enhanced coagulation/filtration) using both alum
and PACl achieved 94±2% and 93±4% turbidity removal respectively, and maintained filter
effluent values below 0.1 NTU (Figure 5.2). At temperatures > 15ºC, coagulation contributed to
approximately 66-75% of the turbidity removal; however < 15ºC, coagulation increased or did not
significantly (α= 0.05) impact the turbidity.
5.3.3 NOM Removal
During the period of June to November 2013, biofiltration removed 6±2% of the raw water
DOC (initial concentration (C0)= 6.2±0.1 mg/L) as shown in Figure 5.3 (α= 0.05), consistent with
Hallé et al. (2009). DOC removal was directly impacted by temperature; where removal was 6-
10% when the temperature was > 10˚C and decreased to 2-4% below this value. These results are
consistent with Liu et al. (2001) and Emelko et al. (2006) findings.

82
Figure 5.2: Average monthly turbidity trends. NS= Not sampled. a Transition study: coagulants
were switched between trains. Vertical bars present one standard deviation
Conventional treatment with alum and PACl consistently removed 46±1% and 45±1% of
the raw water DOC; full-scale treatment removed 46±1%. DOC removal was not influenced by
temperature as the coagulant dose was adjusted to maximize DOC removal on a bi-weekly basis
(Appendix D, Figure 8.13). In all cases, DOC removal was attributed to coagulation and not
filtration (Table 5.1) since filtration only removed an additional 0-4% of the raw water DOC,
consistent with Volk and Lechevallier (2002). Hence, the application of biofiltration post
coagulation could provide an additional 5-10% DOC removal. Finally, DOC removal in
conventional treatment was 5-6 times higher than biofiltration at temperatures > 10˚C and
approximately an order of magnitude higher at temperatures < 10˚C. Despite the low DOC removal
in comparison to conventional treatment, it is important to keep in mind that biofiltration is not
meant to be applied as a single process but combined with UF and/or pre-ozonation.
0
0.2
0.4
0.6
0.8
1
1.2
1.4
June July Aug Sept Oct 1-7 Nov 7-30 Nov
Turb
idit
y (
NT
U)
Raw water BiofilterPost Full-scale Plant Filter #11 Pre-filter (Alum)Post-filter (Alum) Pre-filter (PACl)Post-filter (PACl)
Transition
study a
NS
NS
NS
NS
NS
NS

83
Figure 5.3: Average monthly DOC concentrations. NS= Not sampled. a Transition study: coagulants were switched between trains.
Vertical bars represent one standard deviation
0
5
10
15
20
25
30
35
0
1
2
3
4
5
6
7
Jun-13 Jul-13 Aug-13 Sep-13 Oct-13 1-7 Nov-13 7-30 Nov-13
Raw
wat
er t
empra
ture
(˚C
)
DO
C (
mg/L
)
Raw Water Biofilter Post Full-scale Plant Filter #11
Post-filter (Alum) Post-filter (PACl) Tempreture
Transition
study a
NS
NS
NS
NS
NS
NS
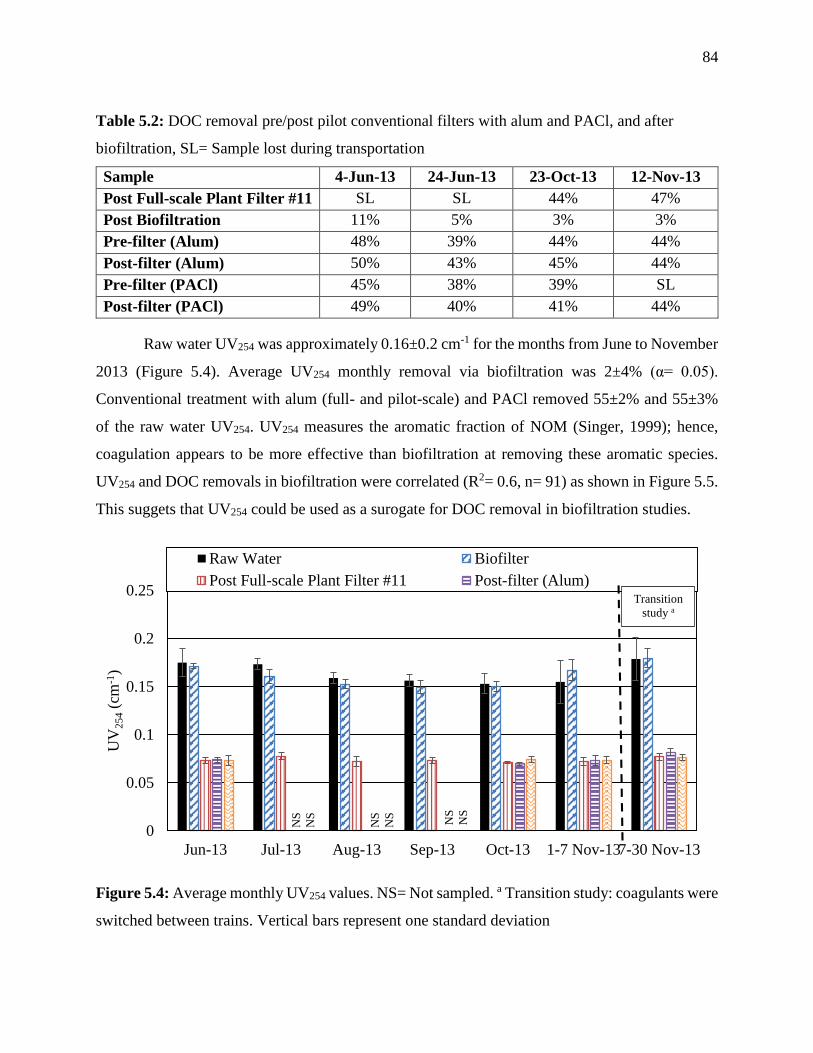
84
Table 5.2: DOC removal pre/post pilot conventional filters with alum and PACl, and after
biofiltration, SL= Sample lost during transportation
Sample 4-Jun-13 24-Jun-13 23-Oct-13 12-Nov-13
Post Full-scale Plant Filter #11 SL SL 44% 47%
Post Biofiltration 11% 5% 3% 3%
Pre-filter (Alum) 48% 39% 44% 44%
Post-filter (Alum) 50% 43% 45% 44%
Pre-filter (PACl) 45% 38% 39% SL
Post-filter (PACl) 49% 40% 41% 44%
Raw water UV254 was approximately 0.16±0.2 cm-1 for the months from June to November
2013 (Figure 5.4). Average UV254 monthly removal via biofiltration was 2±4% (α= 0.05).
Conventional treatment with alum (full- and pilot-scale) and PACl removed 55±2% and 55±3%
of the raw water UV254. UV254 measures the aromatic fraction of NOM (Singer, 1999); hence,
coagulation appears to be more effective than biofiltration at removing these aromatic species.
UV254 and DOC removals in biofiltration were correlated (R2= 0.6, n= 91) as shown in Figure 5.5.
This suggets that UV254 could be used as a surogate for DOC removal in biofiltration studies.
Figure 5.4: Average monthly UV254 values. NS= Not sampled. a Transition study: coagulants were
switched between trains. Vertical bars represent one standard deviation
0
0.05
0.1
0.15
0.2
0.25
Jun-13 Jul-13 Aug-13 Sep-13 Oct-13 1-7 Nov-137-30 Nov-13
UV
25
4(c
m-1
)
Raw Water Biofilter
Post Full-scale Plant Filter #11 Post-filter (Alum)Transition
study a
NS
NS
NS
NS
NS
NS

85
Figure 5.5: UV254 removal as a function of DOC removal
The biofilter consistently removed 20±4% of raw water biopolymers (BP) (C0= 0.41-0.53
mg/L) and 0±2% of humic substances (HS) (C0= 3.0-3.3 mg/L) (Figure 5.6). Biopolymer removals
were lower than values (approximately 50%) reported by Halle et al. (2009) and Peldszus et al
(2012) under the similar temperature conditions. That said, low HS removals (< 2%) were
consistent with Hallé et al. (2009) findings. Conventional treatment (pilot- and full-scale) was
effective for biopolymer (58±9%) and HS (58±7%) removal. Coagulation alone removed the
majority of the BP (42-49%) and HS (52-71%). These removals are consistent with Diemert and
Andrews (2013) where they observed 50-75% and 43-63%, for the same water matrix used in the
present study. The ability of conventional treatment to remove HS when compared to biofiltration
explains the higher DOC removals observed in this study, since HS comprise 54±10% of the raw
water DOC. Higher DBP precursor reductions are expected when applying conventional treatment
as opposed to biofiltration, since humic substances have been identified as major precursors for
DBPs (Wassink et al. 2011). Unlike PACl, coagulation with alum followed by filtration actually
added HS to the effluent by (6-10% lower). This might be attributed to the release of humic
substances via alum floc breakage during filtration (Jarvis et al., 2005; Yu et al., 2009).
y = 0.74x - 0.0044
R² = 0.60
0%
1%
2%
3%
4%
5%
6%
7%
8%
9%
0% 2% 4% 6% 8% 10% 12%
UV
25
4R
emo
val
DOC removal

86
Figure 5.6: Biopolymer (BP) and humic substance (HS) removals. NS= Not sampled. SL=Sample
lost during transportation. UFS= UF experiment samples. a Transition study: coagulants were
switched between trains.
5.3.4 Headloss (LOH)
Biofiltration headloss was 75-90% higher when compared to pilot- and full-scale alum
treatment, but similar (α= 0.05) to the PACl filter at temperatures > 20˚C (Figure 5.7 and 5.8a).
When temperatures were < 20˚C, headloss through the biofilter and alum filter were the same (α=
0.05) but slightly higher than PACl (Figure 5.8b). PACl was shown to be superior to alum at
temperatures < 15˚C as can be observed from the steady turbidity removals (Figure 5.3) which
explains the lower headloss when compared to alum. Headloss for biofiltration showed high
variability (relative standard deviation= 52-143%) which was attributed to variability in raw water
turbidity (0.29-1.46 NTU), as described earlier. Microbial activity in biofilters is thought to
increase filter headloss by clogging the filter pores and voids (Kim et al., 2009). The increase in
headloss might also be attributed to EPS excreted by microorganisms (Lauderdale et al., 2012).
EPS (proteins and polysaccharides) in the biofilters were significantly higher when compared to
conventional treatment as a result of the biological activity (Figure 5.9). EPS concentrations
decreased as a function of temperature, similar to ATP.
-10%
0%
10%
20%
30%
40%
50%
60%
70%
80%
BP HS BP HS BP HS BP HS BP HS
16-Jun-13 12-Aug-13 24-Sep-13 12-Nov-13 29-Nov-13
Hum
ic a
nd B
ipoly
mer
Rem
oval
Biofilter Post Full-scale Plant Filter #11Pre-filter (Alum) Post-filter (Alum)Pre-filter (PACl) Post-filter (PACl)
Transition study a
NS
NS
NS
NS
NS
NS
NS
NS
SL
SL
UF
S
UF
S
UF
S
UF
S

87
Figure 5.7: Average hourly filter headloss. NS= Not sampled. a Transition study: coagulants were
switched between trains. Vertical bars represent one standard deviation
Figure 5.8: Typical headloss curves for the biofilter and pilot-plant (alum and PACl) filters during
summer 2003 (a: 24th June 2013, T=22˚C) and winter 2013 (b: 25th October 2013, T=12˚C)
-0.01
0
0.01
0.02
0.03
0.04
0.05
0.06
June July Aug Sept Oct 1-7 Nov 7-30 Nov
Avar
age
hourl
y L
OH
(m
/hour)
Biofilter Full-scale Plant Filter #11
Pilot-plant Filter (Alum) Pilot-plant Filter (PACl)
0
0.2
0.4
0.6
0.8
1
1.2
1.4
1.6
0 50 100
LO
H (
m)
Time following backwash (hr)
Pilot-plant Filter (Alum)Pilot-plant Filter (PACl)Biofilter
0
0.2
0.4
0.6
0.8
1
1.2
1.4
1.6
0 50 100
LO
H (
m)
Time following backwash (hr)
Pilot-plant Filter (Alum)Pilot-plant Filter (PACl)Biofilter
Transition
study a
NS
NS
NS
NS
NS
NS
a) b)

88
Figure 5.9: Protein and polysaccharide concentrations for biofilter and conventional filter media
(PS= Polysaccharides, Pr= Proteins), single sample analyzed duplicate and triplicate for PS and
Pr, respectively. Test error < 10%. a Transition study: coagulants were switched between trains
5.3.5 DBP Precursor Removal
Biofiltration reduced DBPFP, as measured by THMs, HAAs, and AOX (Figure 5.9). THMs
consisted of TCM and BDCM whereas HAAs comprised of BCAA and TCAA. THMs and HAAs
comprised 49±10% of the total AOX. Raw water THM formation potential (C0=179-255 µg/L)
was reduced by 13±11% through biofiltration (α= 0.05), and HAAs (C0=110-202 µg/L) decreased
by 9±13% (not significant at α= 0.05). Similarly, raw water AOX (C0= 425-551 ug/L) was reduced
by 2±5% by biofiltration (not significant). These removals are similar but slightly lower than
removals reported by others (Chaiket et al., 2002; Wang et al., 1995). The biofilter effluent THM
and HAA concentrations are higher than the EPA’s guidelines (EPA, 2009), and they are not
expected to be significantly decreased by UF because it is incapable of removing humic
substances, which are the major DOC constituents (data not shown). Therefore, water with high
humic substances concentration (> 3 mg/L) is not expected to conform to DBP guidelines when
treated with biofiltration/ultrafiltration without applying coagulation.
Conventional treatment reduced THM, HAA, and AOX by 57-72%, 49-76%, and 48-73%,
respectively. Alum and PACl provided similar DBP precursor removal (α= 0.05). Filtration
contributed to THM, HAA, and AOX removal by 0-2%, 6-8% and 3-19%, respectively, when the
0
100
200
300
400
500
600
700
800
PS Pr PS Pr PS Pr PS Pr
4-Jun-13 24-Jul-13 30-Sep-13 18-Nov-13
Pro
tein
and P
oly
sacc
hri
de
Conce
ntr
atio
n (
µg/g
med
ia)
Biofilter Full-scale plant filter 11
Pilot-plant Filter (Alum) Pilot-plant Filter (PACl)
a Transition
study
NS
NS
NS
NS
NS
NS
NS
NS

89
Figure 5.10: 24 hour DBP formation potentionals. NS= Not sampled. SL=Sample lost during transportation. a Transition study:
coagulants were switched between trains. Vertical bars represent one standard deviation
0
100
200
300
400
500
600T
HM
, H
AA
and A
OX
Conce
ntr
atio
n (
µg/L
as
Cl- )
THMs HAAs Unknown AOX
24-Sept-13 4-June-13 23-Oct-13 a Transition study
12-Nov-13
NS
NS
NS
NS
SL
90
temperature was > 10˚C, and by 22%, 30%, and 34%, respectively when temperate was <
10˚C. The lower removal by filtration at temperatures > 10˚C was attributed to the increase
of HS following filtration as discussed in section 5.3.3. The higher DBP precursor control
by conventional treatment as compared to biofiltration was attributed to the higher DOC,
biopolymer, and humic substance removal. These parameters have been previously
correlated with DBPs in the same water matrix (Wassink et al., 2011). Also, the lower pH
(approximately 7.5 for coagulation and 8 for biofiltration) as a result of coagulant addition
may have contributed to the lower DBP formation potentials.
5.3.6 Ultrafiltration Fouling Mitigation
As discussed in section 4.3.6, biofiltration was capable of reducing UF irreversible
fouling by approximately 60% when compared to raw water. An evaluation of biofiltration
vs. coagulation with/without filtration was performed to compare both strategies for
fouling control. Coagulation (29.1-30.1 mg/L alum) resulted in approximately 25% higher
UF irreversible fouling mitigation, and approximately an order of magnitude higher
reversible fouling control when compared to biofiltration (Figure 5.11). Superior
biopolymer removal by coagulation (56% compared to 10% by biofiltration) was thought
to be responsible for reducing irreversible UF fouling. However, the increased turbidity, as
discussed earlier, may have adversely impacted irreversible fouling. Therefore, turbidity-
biopolymer interactions are a critical parameter for reduction UF fouling. These findings
are consistent with Peldszus et al. (2011) where irreversible fouling was attributed to
interaction between biopolymer and particulate matter. Also, fouling due to aluminum ions
may have masked the impact of biopolymer removal (not measured).
Prendiville and Chung (1992) reported that turbidity and alum carry-over could
impact membrane fouling. To isolate this impact, dual media filter effluent following
coagulation (30.0 mg/L alum) was compared to biofiltration as a UF pre-treatment strategy
(Figure 5.12). The filtered effluent resulted in approximately an order of magnitude lower
reversible and irreversible fouling when compared to biofiltration. The reduction of
turbidity and alum residual post filtration decreased reversible and irreversible fouling
confirming the importance of the biopolymer and turbidity interaction. Both coagulation

91
and biofiltration have the potential to be applied as pre-treatments for UF with preference
given to coagulation because of its ability to decrease DBP precursors.
Figure 5.11: Normalized UF resistance profile comparing coagulation (29.1-30.1 mg/L
alum) to biofiltration (Biofiltration: November 27th,2013, T= 3ºC. Pre-filter alum:
December 2nd, 2013, T= 4.5 ºC)
Figure 5.12: Normalized UF resistance profile comparing coagulation (30.0 mg/L alum)
with filtration to biofiltration (Biofiltration: November 8th,2013, T= 9 ºC. Post-filter
alum: November 8th, 2013, T= 9.5 ºC)
5.4 Summary
Biofiltration as a stand-alone treatment was found to be effective for removal of
turbidity (71±11%), biopolymers (20±4%), as well as THM (13±11%) and HAA (9±13%)
0
2
4
6
8
0 5 10 15 20 25 30
No
rmal
ized
mem
bra
ne
resi
stan
ce @
20
˚C (
×1
01
2 m
-1)
Permeation Time (hr)
Pre-filter (Alum) Biofiltration
0
2
4
6
8
0 5 10 15 20 25 30
Norm
aliz
ed m
embra
ne
resi
stan
ce @
20˚C
(×
10
12
m-1
)
Permeation Time (hours)
Post-filter (Alum) Biofiltration

92
precursor reduction, and to provide irreversible UF fouling control. However, it fell short
when compared to coagulation where significantly higher DOC (up to 50%), biopolymer
(42-72%), and DBP precursor removals (48-76%) were observed. Biofiltration provided
similar irreversible fouling control when compared to coagulation, however unlike
biofiltration coagulation was also able to control reversible fouling. Conventional
treatment prior to ultrafiltration provided superior irreversible and reversible fouling
control, which emphasizes the importance of turbidity along with biopolymers when
considering UF fouling control strategies. From this study, it is evident that by allowing
conventional filters to work in a biological mode, significant improvements in NOM
removal could be achieved as well as UF fouling control. Table 5.3 summarizes the study
findings.
Table 5.3: Impact of biofiltration and conventional treatment on the removal of the
variables in this study (↑=positive impact, ↓=adverse impact, ●=no impact, =
statistically significant, = not statistically significant difference at the 95% confidence
level, Where symbols not present= statistical analysis was not possible, NS= Not
Sampled)
Biofilter
Post Full-scale
Plant Filter
#11
Pre-
filter
(Alum)
Post-
filter
(Alum)
Pre-
filter
(PACl)
Post-
filter
(PACl)
Turbidity ↑ ↑ ↓ ↑ ↓ ↑
DOC ↑ ↑ ↑ ↑ ↑ ↑
BP ↑ ↑ ↑ ↑ ↑ ↑
HS ● ↑ ↑ ↓ ↑ ↑
THMs ↑ ↑ ↑ ↑ ↑ ●
HAAs ↑ ↑ ↑ ↑ ↑ ↑ AOX ↑ ↑ ↑ ↑ ↑ ↑ Irreversible
UF fouling
↑ NS ↑ ↑ NS NS
Reversible
UF fouling
● NS ↑ ↑ NS NS

93
6. Overall Summary, Conclusions and
Recommendations
6.1 Summary
The impact of phosphorus, nitrogen, peroxide, and alum addition on biofiltration to
control NOM (DOC, UV254, and LC-OCD), DBP precursors (THMs, HAAs, and AOX),
and UF fouling was investigated via a pilot-scale experiment. In addition, the impact of
media type (anthracite vs. GAC) was examined. The study was conducted using parallel
biofiltration treatment trains with two large (D= 15.24 cm) glass, and four small (D= 7.62
cm) acrylic biofilters which were installed at the Peterborough Water Treatment Plant.
Nutrients (phosphorus and nitrogen), alum, and hydrogen peroxide were incrementally
added to each biofilter influent during three stages, each ranging from 24 to 69 days.
Furthermore, a parallel comparison to conventional treatment (alum and PACl) was
conducted.
6.2 Conclusions
Results indicated that biofiltration was capable of reducing turbidity, biopolymers
(major UF foulant), and DBP precursors, as well as UF irreversible fouling. Nutrient
addition (phosphorus and nitrogen at C:N:P ratios of 100:30:2, 100:40:2, and 100:40:20)
did not improve biofilter performance in terms of the measured parameters. Peroxide (at
0.1 and 0.5) increased biofilter runtime without adversely affecting removal of NOM or
DBP precursors. However, Peroxide addition at 1 mg/L decreased THM and AOX
formation potentials, and resulted in higher UF irreversible fouling when compared to a
control. The addition of low alum dosages (< 0.5 mg/L) was found to improve biopolymer
removal and DBP precursor reduction. It also resulted in lower UF irreversible fouling,
with a higher impact at low doses (0.1 and 0.25 mg/L) and at temperatures > 15˚C.
Exhausted GAC provided higher DOC, and DBP precursor removal when compared to
anthracite.
When compared to biofiltration, conventional treatment resulted in a significant
reduction in NOM, DBP precursors and UF reversible and irreversible fouling. However,
94
coagulation without filtration provided similar UF irreversible fouling control when
compared to biofiltration. Furthermore, biofiltration was observed to improve biopolymer
and DBP precursor removal when compared to conventional filtration which shows its
potential to be applied post coagulation. Biofiltration was more effective at temperatures
>10˚C, but even at low temperatures (3-10˚C), provided NOM and turbidity reduction as
well as UF fouling mitigation.
6.3 Recommendations
The results of this work warrant further investigation as follows:
1- While this work has shown the potential ability of alum addition (< 0.5 mg/L) to
improve UF fouling control, and the adverse impact of peroxide addition (1 mg/L)
on irreversible fouling, duplicate UF runs could not be performed. Therefore,
further trials are required to validate these findings. In addition, more dosages and
the use of other cationic and polymeric coagulants should be explored.
2- This study only explored the application of biofiltration as a single process in
comparison to conventional treatment, while the application of biofiltration as a
part of treatment process such as ozone/biofiltration/UF or coagulation/biofiltration
is of interest.
3- The study was conducted at temperatures ranging from 3-25˚C; hence, further
investigation during winter conditions (< 3˚C) to evaluate biofilter performance
year-round. Also, the effectiveness of coagulation as a pre-treatment for UF at these
temperatures should be directly compared to biofiltration.
4- The focus of this work was biofiltration optimization; however, further
characterization of membrane foulants, their interaction with each other and with
the membrane surface, and their removal during biofiltration is required.
5- The combination of the enhancement methods applied in this study along with pH
adjustment should be studied.

59
7. References
Ahmad, R., A. Amirtharajah, A. Al-Shawwa, and P. M. Huck. 1998. Effects of backwashing on
biological filters. Journal / American Water Works Association, 90(12), 62-73
Allen, M. J., S. C. Edberg, and D. J. Reasoner. 2004. Heterotrophic plate count bacteria - What is
their significance in drinking water? International Journal of Food Microbiology, 92(3),
265-274
Andersson, A., P. Laurent, A. Kihn, M. Prévost Michèle, and P. Servais. 2001. Impact of
temperature on nitrification in biological activated carbon (BAC) filters used for drinking
water treatment. Water Research, 35(12), 2923-2934
Baghoth, S. A., M. Dignum, A. Grefte, J. Kroesbergen, and G. L. Amy. 2009. Characterization
of NOM in a drinking water treatment process train with no disinfectant residual. Water
Science and Technology: Water Supply, 9(4), 379-386
Barrett, S. E., S. W. Krasner, and G. L. Amy. 2000. Natural organic matter and disinfection by-
products: Characterization and control in drinking water - An overview. ACS Symposium
Series, 761, 2-14
Basu, O. D. and P. M. Huck. 2004. Integrated biofilter-immersed membrane system for the
treatment of humic waters. Water Research, 38(3), 655-662
Boon, N., B. F. G. Pycke, M. Marzorati, and F. Hammes. 2011. Nutrient gradients in a granular
activated carbon biofilter drives bacterial community organization and dynamics. Water
Research, 45(19), 6355-6361
Brinkman, B. M. and R. M. Hozalski. 2011. Temporal variation of NOM and its effects on
membrane treatment. Journal / American Water Works Association, 103(2), 98-106
Carlson, K. H. and G. L. Amy. 2001. Ozone and biofiltration optimization for multiple
objectives. Journal / American Water Works Association, 93(1), 88-98

96
Chaiket, T., P. C. Singer, A. Miles, M. Moran, and C. Pallotta. 2002. Effectiveness of
coagulation, ozonation, and biofiltration in controlling DBPs. Journal / American Water
Works Association, 94(12), 81-95
Chellam, S., J. G. Jacangelo, T. P. Bonacquisti, and B. A. Schauer. 1997. Effect of pretreatment
on surface water nanofiltration. Journal / American Water Works Association, 89(10), 77-89
Chen, C., X. Zhang, L. Zhu, W. He, and H. Han. 2011. Changes in different organic matter
fractions during conventional treatment and advanced treatment. Journal of Environmental
Sciences, 23(4), 582-586
Choi, K. Y. and B. A. Dempsey. 2004. In-line coagulation with low-pressure membrane
filtration. Water research, 38(19), 4271-4281
Chow, C. W. K., R. Fabris, and M. Drikas. 2004. A rapid fractionation technique to characterise
natural organic matter for the optimisation of water treatment processes. Journal of Water
Supply: Research and Technology - AQUA, 53(2), 85-92
Crittenden, J. C., R. R. Trussell, D. W. Hand, K. J. Howe, and G. Tchobanoglous. 2012. Water
treatment: principles and design.
Croft, J., 2012. Natural Organic Matter Characterization of Different Source and Treated Waters;
Implications for Membrane Fouling Control. University of Waterloo
Diemert, S. and R. C. Andrews. 2013. The impact of alum coagulation on pharmaceutically
active compounds, endocrine disrupting compounds and natural organic matter. Water
Science and Technology: Water Supply, 13(5), 1348-1357
Drioli, E., 2009. Membrane Operations: Innovative Separations and Transformations. WILEY-
VCH Verlag GmbH & Co. KGaA
Dussert, B. W. and W. G. Tramposch. 1997. Impact of support media on the biological treatment
of ozonated drinking water. Ozone: Science and Engineering, 19(2), 97-108
97
Edzwald, J. K., W. C. Becker, and S. J. Tambini. 1987. Organics, polymers and performance in
direct filtration. Journal of Environmental Engineering, 113(1), 167-185
Edzwald, J. K. and J. E. Tobiason. 1999. Enhanced coagulation: US requirements and a broader
view. Water Science and Technology, 40(9), 63-70
Egashira, K., K. Ito, and Y. Yoshiy. 1992. Removal of musty odor compound in drinking water
by biological filter. Water Science and Technology, 25(2), 307-314
Elhadi, S. L. N., P. M. Huck, and R. M. Slawson. 2006. Factors affecting the removal of geosmin
and MIB in drinking water biofilters. Journal / American Water Works Association, 98(8),
108-119
Elhadi, S., P. Huck, and R. Slawson. 2004. Removal of geosmin and 2-methylisoborneol by
biological filtration. Water Science and Technology, 49(9), 273-280
Ellis, K. V., 1985. Slow sand filtration. Critical Reviews in Environmental Control, 15(4), 315-
354
Emelko, M. B., P. M. Huck, B. M. Coffey, and E. F. Smith. 2006. Effects of media, backwash,
and temperature on full-scale biological filtration. Journal / American Water Works
Association, 98(12), 61-73
EPA, 2009. National Primary Drinking Water Regulations. US EPA, 2013, 6
Escobar, I. C. and A. A. Randall. 2001. Assimilable organic carbon (AOC) and biodegradable
dissolved organic carbon (BDOC): Complementary measurements. Water Research, 35(18),
4444-4454
Escobar, I. C., S. Hong, and A. A. Randall. 2000. Removal of assimilable organic carbon and
biodegradable dissolved organic carbon by reverse osmosis and nanofiltration membranes.
Journal of Membrane Science, 175(1), 1-17

98
Gao, W., H. Liang, J. Ma, M. Han, Z. L. Chen, Z. S. Han, et al. 2011. Membrane fouling control
in ultrafiltration technology for drinking water production: A review. Desalination, 272(1-
3), 1-8
Geismar, N., P. R. Bérubé, and B. Barbeau. 2012. Variability and limits of the unified membrane
fouling index: Application to the reduction of low-pressure membrane fouling by ozonation
and biofiltration. Desalination and Water Treatment, 43(1-3), 91-101
Gibert, O., B. Lefèvre, M. Fernández, X. Bernat, M. Paraira, and M. Pons. 2013. Fractionation
and removal of dissolved organic carbon in a full-scale granular activated carbon filter used
for drinking water production. Water Research, 47(8), 2821-2829
Hallè, C., 2010. Biofiltration in drinking water treatment: reduction of membrane fouling and
biodegradation of organic trace contaminants.
Hallé, C., P. M. Huck, S. Peldszus, J. Haberkamp, and M. Jekel. 2009. Assessing the
performance of biological filtration as pretreatment to low pressure membranes for drinking
water. Environmental Science and Technology, 43(10), 3878-3884
Hammes, F., M. Berney, Y. Wang, M. Vital, O. Koster, and T. Egli. 2008. Flow-cytometric total
bacterial cell counts as a descriptive microbiological parameter for drinking water treatment
processes. Water Research, 42(1-2), 269-277
Hammes, F., S. Velten, T. Egli, and T. Juhna. 2011. Biotreatment of drinking water.(6.4), 517-
530
Health Canada, 2009. Guidelines for Canadian Drinking Water Quality: Guideline Technical
Document: Trihalomethanes., 2013(December)
Henderson, R. K., N. Subhi, A. Antony, S. J. Khan, K. R. Murphy, G. L. Leslie, et al. 2011.
Evaluation of effluent organic matter fouling in ultrafiltration treatment using advanced
organic characterisation techniques. Journal of Membrane Science, 382(1-2), 50-59
Howe, K. J. and M. M. Clark. 2006. Effect of coagulation pretreatment on membrane filtration
performance. Journal / American Water Works Association, 98(4), 133-146+12
99
Howe, K. J. and M. M. Clark. 2002. Fouling of microfiltration and ultrafiltration membranes by
natural waters. Environmental Science and Technology, 36(16), 3571-3576
Hozalski, R. M., E. J. Bouwer, and S. Goel. 1999. Removal of natural organic matter (NOM)
from drinking water supplies by ozone-biofiltration. Water Science and Technology, 40(9),
157-163
Hozalski, R. M., S. Goel, and E. J. Bouwer. 1995. TOC removal in biological filters. Journal /
American Water Works Association, 87(12), 40-54
Huang, G., F. Meng, X. Zheng, Y. Wang, Z. Wang, H. Liu, et al. 2011. Biodegradation behavior
of natural organic matter (NOM) in a biological aerated filter (BAF) as a pretreatment for
ultrafiltration (UF) of river water. Applied Microbiology and Biotechnology, 90(5), 1795-
1803
Huang, H., N. Lee, T. Young, A. Gary, J. C. Lozier, and J. G. Jacangelo. 2007. Natural organic
matter fouling of low-pressure, hollow-fiber membranes: Effects of NOM source and
hydrodynamic conditions. Water Research, 41(17), 3823-3832
Huang, H., K. Schwab, and J. G. Jacangelo. 2009. Pretreatment for low pressure membranes in
water treatment: A review. Environmental Science and Technology, 43(9), 3011-3019
Huber, S. A., A. Balz, and M. Abert. 2011a. New method for urea analysis in surface and tap
waters with LC-OCD-OND (liquid chromatography-organic carbon detection-organic
nitrogen detection). Journal of Water Supply: Research and Technology - AQUA, 60(3),
159-166
Huber, S. A., A. Balz, M. Abert, and W. Pronk. 2011b. Characterisation of aquatic humic and
non-humic matter with size-exclusion chromatography – organic carbon detection – organic
nitrogen detection (LC-OCD-OND). Water Research, 45(2), 879-885
Huber, S. A. and F. H. Frimmel. 1994. Direct gel chromatographic characterization and
quantification of marine dissolved organic carbon using high-sensitivity DOC detection.
Environmental Science and Technology, 28(6), 1194-1197

100
Huck, P. M., S. Peldszus, C. Hallé, H. Ruiz, X. Jin, M. Van Dyke, et al. 2011. Pilot scale
evaluation of biofiltration as an innovative pre-treatment for ultrafiltration membranes for
drinking water treatment. Water Science and Technology: Water Supply, 11(1), 23-29
Huck, P. M. and M. M. Sozański. 2008. Biological filtration for membrane pre-treatment and
other applications: Towards the development of a practically-oriented performance
parameter. Journal of Water Supply: Research and Technology - AQUA, 57(4), 203-224
Jacangelo, J. G., J. DeMarco, D. M. Owen, and S. J. Randtke. 1995. Selected processes for
removing NOM: An overview. Journal / American Water Works Association, 87(1), 64-77
Jarvis, P., B. Jefferson, and S. A. Parsons. 2004. Characterising natural organic matter flocs.
Water Science and Technology: Water Supply, 4(4), 79-87
Jarvis, P., B. Jefferson, and S. A. Parsons. 2005. Breakage, regrowth, and fractal nature of
natural organic matter flocs. Environmental Science and Technology, 39(7), 2307-2314
Kennedy, M. D., H. K. Chun, V. A. Quintanilla Yangali, B. G. J. Heijman, and J. C. Schippers.
2005. Natural organic matter (NOM) fouling of ultrafiltration membranes: fractionation of
NOM in surface water and characterisation by LC-OCD. Desalination, 178(1-3), 73-83
Kim, J. S., M. J. Kim, J. Vilagos, B. Pickard, P. Lowe, J. Gordy, et al. 2009. Chloramine auto
decomposition and stability of BAC filtered water. Water Quality Technology Conference
and Exposition 2009, 3360-3380
Klymenko, N. A., I. P. Kozyatnyk, and L. A. Savchyna. 2010. Removing of fulvic acids by
ozonation and biological active carbon filtration. Water Research, 44(18), 5316-5322
Lauderdale, C., P. Chadik, M. Kirisits, and J. Brown. 2012. Engineered biofiltration: enhanced
biofilter performancethrough nutrient and peroxideaddition. Journal American Water Works
Association, 104(73), E289-E309
Lee, N., G. Amy, J. P. Croue, and H. Buisson. 2004. Identification and understanding of fouling
in low-pressure membrane (MF/UF) filtration by natural organic matter (NOM). Water
Research, 38(20), 4511-4523

101
Leenheer, J. A. and J. P. Croué. 2003. Characterizing aquatic dissolved organic matter.
Environmental Science and Technology, 37(1), 18A-26A
Leenheer, J. A., J. P. Croué, M. Benjamin, G. V. Korshin, C. J. Hwang, A. Bruchet, et al. 2000.
Comprehensive isolation of natural organic matter from water for spectral characterizations
and reactivity testing. ACS Symposium Series, 761, 68-83
Li, K., H. Liang, T. J. Ye, W. X. Luo, R. -. Lai, X. Z. Lin, et al. 2013. Effect of in-line
coagulation on treated water quality and membrane fouling for immersed ultrafiltration.
Beijing Gongye Daxue Xuebao/Journal of Beijing University of Technology, 39(2), 287-291
Liu, X., P. M. Huck, and R. M. Slawson. 2001. Factors affecting drinking water biofiltration.
Journal / American Water Works Association, 93(12), 90-101
Madrid, R. E. and C. J. Felice. 2005. Microbial biomass estimation. Critical reviews in
biotechnology, 25(3), 97-112
Magic-Knezev, A. and D. van der Kooij. 2004. Optimisation and significance of ATP analysis
for measuring active biomass in granular activated carbon filters used in water treatment.
Water Research, 38(18), 3971-3979
Malievialle, J., P. Odendaal, and M. Wiesner. 1996. Water treatment membrane processes.
Matilainen, A., E. T. Gjessing, T. Lahtinen, L. Hed, A. Bhatnagar, and M. Sillanpää. 2011. An
overview of the methods used in the characterisation of natural organic matter (NOM) in
relation to drinking water treatment. Chemosphere, 83(11), 1431-1442
Matilainen, A., M. Vepsäläinen, and M. Sillanpää. 2010. Natural organic matter removal by
coagulation during drinking water treatment: A review. Advances in Colloid and Interface
Science, 159(2), 189-197
McDowall, B., D. Hoefel, G. Newcombe, C. P. Saint, and L. Ho. 2009. Enhancing the
biofiltration of geosmin by seeding sand filter columns with a consortium of geosmin-
degrading bacteria. Water Research, 43(2), 433-440

102
Miltner, R. J., R. S. Summers, and J. Z. Wang. 1995. Biofiltration performance: part 2, effect of
backwashing. Journal / American Water Works Association, 87(12), [d]64-70
Moll, D. M., R. S. Summers, and A. Breen. 1998. Microbial characterization of biological filters
used for drinking water treatment. Applied and Environmental Microbiology, 64(7), 2755-
2759
Moll, D. M., R. S. Summers, A. C. Fonseca, and W. Matheis. 1999. Impact of temperature on
drinking water biofilter performance and microbial community structure. Environmental
Science and Technology, 33(14), 2377-2382
Mosqueda-Jimenez, D. B., P. M. Huck, and O. D. Basu. 2008. Fouling characteristics of an
ultrafiltration membrane used in drinking water treatment. Desalination, 230(1-3), 79-91
Neubrand, W., S. Vogler, M. Ernst, and M. Jekel. 2010. Lab and pilot scale investigations on
membrane fouling during the ultrafiltration of surface water. Desalination, 250(3), 968-972
Nguyen, S. T. and F. A. Roddick. 2010. Effects of ozonation and biological activated carbon
filtration on membrane fouling in ultrafiltration of an activated sludge effluent. Journal of
Membrane Science, 363(1-2), 271-277
Okei, I., Y. Akagami, K. shimizu, Q. Xue, C. Sato, M. Utsumi, et al. 2009. Removal
characteristics of musty odor "geosmin" by biofiltration using various carriers.
Paar, H., J. Benecke, M. Ernst, and M. Jekel. 2011. Pre-coagulation and ultrafiltration of effluent
impaired surface water for phosphorus removal and fouling control. Water Science and
Technology: Water Supply, 11(2), 211-218
Peiris, R. H., C. Hallé, H. Budman, C. Moresoli, S. Peldszus, P. M. Huck, et al. 2010a.
Identifying fouling events in a membrane-based drinking water treatment process using
principal component analysis of fluorescence excitation-emission matrices. Water Research,
44(1), 185-194
Peiris, R. H., H. Budman, C. Moresoli, and R. L. Legge. 2010b. Understanding fouling
behaviour of ultrafiltration membrane processes and natural water using principal

103
component analysis of fluorescence excitation-emission matrices. Journal of Membrane
Science, 357(1-2), 62-72
Peldszus, S., J. Benecke, M. Jekel, and P. M. Huck. 2012. Direct biofiltration pretreatment for
fouling control of ultrafiltration membranes. Journal - American Water Works Association,
104(7), E430-E445
Peldszus, S., C. Hallé, R. H. Peiris, M. Hamouda, X. Jin, R. L. Legge, et al. 2011. Reversible and
irreversible low-pressure membrane foulants in drinking water treatment: Identification by
principal component analysis of fluorescence EEM and mitigation by biofiltration
pretreatment. Water Research, 45(16), 5161-5170
Penru, Y., X. Simon, A. Guastalli, S. Esplugas, J. Llorens, and S. Baig. 2011. Characterization of
natural organic matter from Mediterranean coastal seawater. IWA Specialty Conference on
Natural Organic Matter, CA, USA
Persson, F., G. Heinicke, W. Uhl, T. Hedberg, and M. Hermansson. 2006. Performance of direct
biofiltration of surface water for reduction of biodegradable organic matter and biofilm
formation potential. Environmental Technology, 27(9), 1037-1045
Plakas, K. V. and A. J. Karabelas. 2012. Removal of pesticides from water by NF and RO
membranes - A review. Desalination, 287, 255-265
Prendiville, P. W. and P. Y. Chung. 1992. The reduction of aluminium carryover into
distribution systems by the careful control of coagulation and filtration. Water Supply,
10(4), 77-81
Qian, J. and K. Mopper. 1996. Automated high-performance, high-temperature combustion total
organic carbon analyzer. Analytical Chemistry, 68(18), 3090-3097
Rana, D., B. Scheier, R. M. Narbaitz, T. Matsuura, S. Tabe, S. Y. Jasim, et al. 2012. Comparison
of cellulose acetate (CA) membrane and novel CA membranes containing surface
modifying macromolecules to remove pharmaceutical and personal care product
micropollutants from drinking water. Journal of Membrane Science, 409-410, 346-354

104
Richardson, M. L. and J. M. Bowron. 1985. The fate of pharmaceutical chemicals in the aquatic
environment. Journal of Pharmacy and Pharmacology, 37(1), 1-12
Richardson, S. D., M. J. Plewa, E. D. Wagner, R. Schoeny, and D. M. DeMarini. 2007.
Occurrence, genotoxicity, and carcinogenicity of regulated and emerging disinfection by-
products in drinking water: A review and roadmap for research. Mutation Research-Reviews
in Mutation Research, 636(1-3), 178-242
Richardson, S. D., 2009. Water analysis: emerging contaminants and current issues. Analytical
Chemistry, 81(12), 4645-4677
Richardson, S. D. and T. A. Ternes. 2011. Water analysis: emerging contaminants and current
issues. Analytical Chemistry, 83(12), 4614-4648
Rittmann, B. E., D. Stilwell, and A. Ohashi. 2002. The transient-state, multiple-species biofilm
model for biofiltration processes. Water Research, 36(9), 2342-2356
Rittmann, B. E., 2001. Environmental biotechnology : principles and applications.
Rizzo, L., V. Belgiorno, and S. Meriç. 2004. Organic THMs precursors removal from surface
water with low TOC and high alkalinity by enhanced coagulation. Water Science and
Technology: Water Supply, 4(5-6), 103-111
Sang, J., X. Zhang, L. Li, and Z. Wang. 2003. Improvement of organics removal by bio-ceramic
filtration of raw water with addition of phosphorus. Water Research, 37(19), 4711-4718
Siebel, E., Y. Wang, T. Egli, and F. Hammes. 2008. Correlations between total cell
concentration, total adenosine tri-phosphate concentration and heterotrophic plate counts
during microbial monitoring of drinking water. Drinking Water Engineering and Science,
1(1), 1-6
Singer, P. C., 1999. Humic Substances as Precursors for Potentially Harmful Disinfection By-
Products. Water Science and Technology, 40(9), 25-30

105
Singh, R., 2006. Hybrid membrane systems for water purification : technology, systems design
and operation.
Srinivasan, R. and G. A. Sorial. 2011. Treatment of taste and odor causing compounds 2-methyl
isoborneol and geosmin in drinking water: A critical review. Journal of Environmental
Sciences-China, 23(1), 1-13
Stedmon, C. A., B. Seredyńska-Sobecka, R. Boe-Hansen, N. Le Tallec, C. K. Waul, and E.
Arvin. 2011. A potential approach for monitoring drinking water quality from groundwater
systems using organic matter fluorescence as an early warning for contamination events.
Water Research, 45(18), 6030-6038
Tian, J. Y., Z. L. Chen, H. Liang, X. Li, Z. Z. Wang, and G. B. Li. 2009. Comparison of
biological activated carbon (BAC) and membrane bioreactor (MBR) for pollutants removal
in drinking water treatment. Water Science and Technology, 60(6), 1515-1523
Tihomirova, K., J. Rubulis, and T. Juhna. 2010. Changes of NOM fractions during conventional
drinking water treatment process in Riga, Latvia. Water Science and Technology: Water
Supply, 10(2), 157-163
Tsujimoto, W., H. Kimura, T. Izu, and T. Irie. 1998. Membrane filtration and pre-treatment by
GAC. Desalination, 119(1-3), 323-326
Tufenkji, N., J. N. Ryan, and M. Elimelech. 2002. Bank filtration. Environmental Science and
Technology, 36(21), 422A-428A
Urfer, D. and P. M. Huck. 1997. Effects of hydrogen peroxide residuals on biologically active
filters. Ozone: Science and Engineering, 19(4), 371-386
Urfer, D. and P. M. Huck. 2000. A study of the impacts of periodic ozone residuals on
biologically active filters. Ozone: Science and Engineering, 22(1), 77-97
Urfer, D., 1998. Effects of Oxidants on drinking water biofilters. University of Waterloo
106
Urfer, D. and P. M. Huck. 2001. Measurement of biomass activity in drinking water biofilters
using a respirometric method. Water Research, 35(6), 1469-1477
Vahala, R., V. Moramarco, R. M. Niemi, J. Rintala, and R. Laukkanen. 1998. The effects of
nutrients on natural organic matter (NOM) removal in biological activated carbon (BAC)
filtration. Acta Hydrochimica et Hydrobiologica, 26(3), 196-199
Van Benschoten, J. E. and J. K. Edzwald. 1990. Chemical aspects of coagulation using
aluminum salts - I. Hydrolytic reactions of alum and polyaluminum chloride. Water
research, 24(12), 1519-1526
Van der kooij, D., 1992. Assimilable organic-carbon as an indicator of bacterial regrowth.
Journal American Water Works Association, 84(2), 57-65
Velten, S., M. Boller, O. Köster, J. Helbing, H. -. Weilenmann, and F. Hammes. 2011a.
Development of biomass in a drinking water granular active carbon (GAC) filter. Water
Research, 45(19), 6347-6354
Velten, S., F. Hammes, M. Boller, and T. Egli. 2007. Rapid and direct estimation of active
biomass on granular activated carbon through adenosine tri-phosphate (ATP) determination.
Water Research, 41(9), 1973-1983
Velten, S., D. R. U. Knappe, J. Traber, H. Kaiser, U. von Gunten, M. Boller, et al. 2011b.
Characterization of natural organic matter adsorption in granular activated carbon adsorbers.
Water research, 45(13), 3951-3959
Volk, C. J. and M. W. Lechevallier. 2002. Effects of conventional treatment on AOC and BDOC
levels. Journal / American Water Works Association, 94(6), 112-123
Wahman, D. G., L. E. Katz, and G. E. Speitel. 2011. Performance and biofilm activity of
nitrifying biofilters removing trihalomethanes. Water Research, 45(4), 1669-1680
Wang, J. and X. C. Wang. 2006. Ultrafiltration with in-line coagulation for the removal of
natural humic acid and membrane fouling mechanism. Journal of Environmental Sciences
(China), 18(5), 880-884

107
Wang, J. Z., R. S. Summers, and R. J. Miltner. 1995. Biofiltration performance: part 1,
relationship to biomass. Journal / American Water Works Association, 87(12), [d]55-63
Wang, Y., F. Hammes, K. De Roy, W. Verstraete, and N. Boon. 2010. Past, present and future
applications of flow cytometry in aquatic microbiology. Trends in Biotechnology, 28(8),
416-424
Wassink, J. K., R. C. Andrews, R. H. Peiris, and R. L. Legge. 2011. Evaluation of fluorescence
excitation-emission and LC-OCD as methods of detecting removal of NOM and DBP
precursors by enhanced coagulation. Water Science and Technology: Water Supply, 11(5),
621-630
Wert, E. C., J. J. Neemann, D. J. Rexing, and R. E. Zegers. 2008. Biofiltration for removal of
BOM and residual ammonia following control of bromate formation. Water Research, 42(1-
2), 372-378
Wray, H. E., R. C. Andrews, and P. R. and Bérubé. 2014. Ultrafiltration organic fouling control:
comparison of air sparging and coagulation. Journal - American Water Works Association
Wu, F. C., R. D. Evans, and P. J. Dillon. 2003. Separation and characterization of NOM by high-
performance liquid chromatography and on-line three-dimensional excitation emission
matrix fluorescence detection. Environmental Science and Technology, 37(16), 3687-3693
Wu, S. H., B. Z. Dong, T. J. Qiao, and J. S. Zhang. 2008. Effect of a biological activated carbon
filter on particle counts. Journal of Zhejiang University: Science A, 9(11), 1576-1581
Yang, B. M., J. K. Liu, C. C. Chien, R. Y. Surampalli, and C. M. Kao. 2011. Variations in AOC
and microbial diversity in an advanced water treatment plant. Journal of Hydrology, 409(1-
2), 225-235
Yavich, A. A., K. Lee, K. Chen, L. Pape, and S. J. Masten. 2004. Evaluation of biodegradability
of NOM after ozonation. Water Research, 38(12), 2839-2846
Yu, W., G. Li, Y. Xu, and X. Yang. 2009. Breakage and re-growth of flocs formed by alum and
PACl. Powder Technology, 189(3), 439-443

108
Zhang, D., W. Li, K. Wang, L. Zhang, and H. Gong. 2010. Bacterial community dynamics and
its effects during biological activited carbon filter process for drinking water treatment. 2nd
International Conference on Chemical, Biological and Environmental Engineering,
Proceedings, 137-142
Zhang, D., W. Li, S. Zhang, M. Liu, X. Zhao, and X. Zhang. 2011a. Bacterial community and
function of biological activated carbon filter in drinking water treatment. Biomedical and
Environmental Sciences, 24(2), 122-131
Zhang, W., X. Zhang, C. Chen, J. Wang, and Y. Liu. 2011b. Pilot study on hybrid biological
filter-coagulation-submerged ultrafiltration membrane for drinking water treatment. 5th
International Conference on Bioinformatics and Biomedical Engineering, iCBBE 2011
Zheng, L., N. Gao, Y. Deng, E. Du, M. Sui, and S. Liu. 2011. The effect of backwashing in the
structure of microbial community on biological activated carbon (BAC) in a water treatment
plant. Fresenius Environmental Bulletin, 20(7A), 1741-1748
Zheng, X., M. Ernst, P. M. Huck, and M. Jekel. 2010. Biopolymer fouling in dead-end
ultrafiltration of treated domestic wastewater. Water Research, 44(18), 5212-5221
Zheng, X., S. Plume, M. Ernst, J. -. Croué, and M. Jekel. 2012. In-line coagulation prior to UF of
treated domestic wastewater - foulants removal, fouling control and phosphorus removal.
Journal of Membrane Science, 403-404, 129-139
Zhu, I. X., T. Getting, and D. Bruce. 2010. Review of biologically active filters in drinking water
applications. Journal / American Water Works Association, 102(12), 67-77

109
8. Appendices
8.1 Appendix A (Calibration Curves)
Figure 8.1: Sample DOC calibration curve
Figure 8.2: Sample THM calibration curve (June 2013)
y = 4954.3x + 6133.7
R² = 0.9997
0
10000
20000
30000
40000
50000
60000
0 2 4 6 8 10 12
Are
a C
ounts
DOC (mg/L)
y = 0.3634x + 2.7418
R² = 0.9964
y = 2.8648x - 5.9451
R² = 0.9945
y = 3.3806x - 5.3124
R² = 0.9967
y = 1.5847x + 0.146
R² = 0.9992
-50
0
50
100
150
200
250
0 10 20 30 40 50 60 70
Are
a C
ounts
Concentration (μg/L)
TCM BDCM CDBM TBM

221
Figure 8.3: HAA calibration curves (June-September 2013)
y = 0.0045x - 0.0011
R² = 0.9965
y = 0.0412x + 0.0353
R² = 0.9992
y = 0.0456x + 0.0545
R² = 0.9986
y = 0.0917x + 0.2212
R² = 0.9896
y = 0.084x + 0.1187
R² = 0.9969
y = 0.0649x + 0.2813
R² = 0.9732
y = 0.059x - 0.1198
R² = 0.9953
y = 0.0316x - 0.0806
R² = 0.9888
y = 0.0167x - 0.0687
R² = 0.931
0
1
2
3
4
5
6
7
0 10 20 30 40 50 60 70
Are
a C
ounts
Concentration (ug/L)
MCAA MBAA DCAA TCAA BCAA DBAA BDCAA CDBAA TBAA

222
Figure 8.4: Sample PS calibration curve (June 2013)
Figure 8.5: Sample Pr. calibration curve (June 2013)
y = 0.0125x + 0.014
R² = 0.9993
0.0
0.2
0.4
0.6
0.8
1.0
1.2
1.4
0 20 40 60 80 100 120
Abso
rban
ce (
OD
) at
492nm
Glucose concentration (ug/mL)
y = 0.0035x + 0.0014
R² = 0.9991
0.0
0.1
0.2
0.3
0.4
0.5
0.6
0.7
0.8
0.9
1.0
0 50 100 150 200 250 300
Ab
sorb
ance
(O
D)
at 7
50 n
m
BSA concentration in ug/mL

221
8.2 Appendix B (Raw Data)
Table 8.1: Water quality and DOC results (Raw) (- indicate that the data is not available)
Sample Date pH Turbidity (NTU) UV254 (cm-1) DOC (mg/L)
Alum CF 4-Jun-13 7.3 0.150 0.053 3.5
Alum CF 4-Jun-13 - 0.205 - 3.5
PACl CF 4-Jun-13 7.7 0.120 0.055 3.6
PACl CF 4-Jun-13 - 0.170 - 3.6
FSP 4-Jun-13 7.9 0.128 0.051 -
FSP 4-Jun-13 - 0.157 - -
Alum SW 4-Jun-13 7.1 0.196 0.053 3.7
Alum SW 4-Jun-13 - 0.192 - 3.7
PACl SW 4-Jun-13 7.9 0.225 0.057 3.9
PACl SW 4-Jun-13 - 0.247 - 3.9
BF1 4-Jun-13 7.8 0.240 0.141 6.2
BF1 4-Jun-13 - 0.253 - 6.3
BF2 4-Jun-13 7.8 0.226 0.140 6.2
BF2 4-Jun-13 - 0.222 - 6.1
BF3 4-Jun-13 7.8 0.384 0.143 6.5
BF3 4-Jun-13 - 0.384 - 6.5
BF4 4-Jun-13 7.9 0.535 0.151 6.4
BF4 4-Jun-13 - 0.578 - 6.5
BF5 4-Jun-13 8.2 0.383 0.151 6.5
BF5 4-Jun-13 - 0.400 - 6.5
RW 4-Jun-13 8.2 0.535 0.141 7.0
RW 4-Jun-13 - 0.592 - 7.0
Alum CF 24-Jun-13 - - - 3.1
Alum CF 24-Jun-13 - - - 3.1
PACl CF 24-Jun-13 - - - 3.3
PACl CF 24-Jun-13 - - - 3.3
FSP 24-Jun-13 - - - -
FSP 24-Jun-13 - - - -
Alum SW 24-Jun-13 - - - 3.4
Alum SW 24-Jun-13 - - - 3.3
PACl SW 24-Jun-13 - - - 3.4
PACl SW 24-Jun-13 - - - 3.4
BF1 24-Jun-13 - - - 5.2
BF1 24-Jun-13 - - - 5.3
BF2 24-Jun-13 - - - 5.3

113
Table 8.1: Water Quality and DOC results (cont.) (- indicate that the data is not available)
Sample Date pH Turbidity (NTU) UV254 (cm-1) DOC (mg/L)
BF2 24-Jun-13 - - - 5.4
BF3 24-Jun-13 - - - 5.4
BF3 24-Jun-13 - - - 5.3
BF4 24-Jun-13 - - - 5.5
BF4 24-Jun-13 - - - 5.3
BF5 24-Jun-13 - - - 5.4
BF5 24-Jun-13 - - - 5.5
BF6 24-Jun-13 - - - 5.4
BF6 24-Jun-13 - - - 5.4
RW 24-Jun-13 - - - 5.4
RW 24-Jun-13 - - - 5.6
FSP 24-Jul-13 7.5 0.105 0.040 2.9
FSP 24-Jul-13 7.5 0.115 0.050 2.9
BF1 24-Jul-13 8.0 0.507 0.120 5.2
BF1 24-Jul-13 8.0 0.506 0.120 5.2
BF2 24-Jul-13 8.1 0.455 0.112 5.1
BF2 24-Jul-13 8.2 0.456 0.112 5.2
BF3 24-Jul-13 8.1 0.878 0.112 5.3
BF3 24-Jul-13 8.1 0.877 0.110 5.3
BF4 24-Jul-13 8.1 0.647 0.109 5.3
BF4 24-Jul-13 8.2 0.668 0.110 5.3
BF5 24-Jul-13 8.2 0.681 0.111 5.4
BF5 24-Jul-13 8.2 0.682 0.111 5.3
BF6 24-Jul-13 8.0 1.070 0.105 5.1
BF6 24-Jul-13 8.8 1.040 0.104 5.1
RW 24-Jul-13 8.7 1.530 0.127 5.5
RW 24-Jul-13 8.8 1.520 0.128 5.5
FSP 12-Aug-13 8.1 0.095 0.050 2.9
FSP 12-Aug-13 8.1 0.090 0.049 2.8
BF1 12-Aug-13 7.6 0.222 0.126 4.9
BF1 12-Aug-13 7.7 0.226 0.128 4.9
BF2 12-Aug-13 7.7 0.241 0.126 4.9
BF2 12-Aug-13 7.7 0.245 0.124 5.0
BF3 12-Aug-13 7.8 0.405 0.124 4.9
BF3 12-Aug-13 7.8 0.391 0.126 4.9
BF4 12-Aug-13 7.8 0.385 0.124 4.9
BF4 12-Aug-13 7.8 0.384 0.124 4.9

114
Table 8.1: Water Quality and DOC results (cont.) (- indicate that the data is not available)
Sample Date pH Turbidity (NTU) UV254 (cm-1) DOC (mg/L)
BF5 12-Aug-13 7.8 0.374 0.125 4.9
BF5 12-Aug-13 7.8 0.395 0.124 5.0
BF6 12-Aug-13 7.6 0.367 0.120 4.9
BF6 12-Aug-13 7.6 0.370 0.118 4.0
RW 12-Aug-13 7.0 0.894 0.127 4.9
RW 12-Aug-13 6.9 0.790 0.127 5.0
BF1 24-Sept-13 - - - 4.9
BF1 24-Sept-13 - - - 4.9
BF2 24-Sept-13 - - - 4.9
BF2 24-Sept-13 - - - 4.9
BF3 24-Sept-13 - - - 4.9
BF3 24-Sept-13 - - - 4.8
BF4 24-Sept-13 - - - 4.9
BF4 24-Sept-13 - - - 5.1
BF5 24-Sept-13 - - - 5.0
BF5 24-Sept-13 - - - 4.9
BF6 24-Sept-13 - - - 4.8
BF6 24-Sept-13 - - - 4.8
RW 24-Sept-13 - - - 5.2
RW 24-Sept-13 - - - 5.2
Alum SW 23-Oct-13 6.7 0.139 0.046 3.1
Alum SW 23-Oct-13 6.7 0.125 0.048 3.1
Alum CF 23-Oct-13 6.8 0.063 0.046 3.1
Alum CF 23-Oct-13 6.8 0.061 0.048 3.1
PACl SW 23-Oct-13 7.5 0.188 0.052 3.3
PACl SW 23-Oct-13 7.5 0.193 0.054 3.4
PACl CF 23-Oct-13 7.5 0.058 0.053 3.3
PACl CF 23-Oct-13 7.5 0.06 0.054 3.3
FSP 23-Oct-13 6.8 0.062 0.047 3.1
FSP 23-Oct-13 6.8 0.055 0.051 3.1
BF1 23-Oct-13 7.5 0.178 0.113 5.5
BF1 23-Oct-13 7.6 0.17 0.109 5.5
BF2 23-Oct-13 7.5 0.153 0.110 5.2
BF2 23-Oct-13 7.6 0.158 0.105 5.2
BF3 23-Oct-13 7.5 0.162 0.107 5.2
BF3 23-Oct-13 7.6 0.164 0.109 5.2
BF4 23-Oct-13 7.5 0.17 0.105 5.1

115
Table 8.1: Water Quality and DOC results (cont.) (- indicate that the data is not available)
Sample Date pH Turbidity (NTU) UV254 (cm-1) DOC (mg/L)
BF4 23-Oct-13 7.6 0.167 0.110 5.2
BF5 23-Oct-13 7.5 0.168 0.106 5.1
BF5 23-Oct-13 7.5 0.168 0.110 5.1
BF6 23-Oct-13 7.5 0.166 0.102 5.1
BF6 23-Oct-13 7.5 0.16 0.106 5.1
RW 23-Oct-13 7.7 0.542 0.119 5.4
RW 23-Oct-13 7.8 0.566 0.121 5.3
Alum SW 12-Nov-13 7.1 0.143 0.064 3.0
Alum SW 12-Nov-13 7.1 0.142 0.064 3.1
Alum CF 12-Nov-13 7.2 0.063 0.063 3.1
Alum CF 12-Nov-13 7.2 0.065 0.063 3.1
PACl CF 12-Nov-13 7.9 0.067 0.063 3.1
PACl CF 12-Nov-13 7.8 0.067 0.063 3.1
FSP 12-Nov-13 7.0 0.071 0.058 2.9
FSP 12-Nov-13 7.0 0.07 0.058 2.9
BF1 12-Nov-13 7.6 0.2 0.142 5.3
BF1 12-Nov-13 7.6 0.192 0.145 5.3
BF2 12-Nov-13 7.6 0.219 0.143 5.3
BF2 12-Nov-13 7.6 0.215 0.144 5.2
BF3 12-Nov-13 8.0 0.256 0.144 5.2
BF3 12-Nov-13 8.0 0.26 0.145 5.2
BF4 12-Nov-13 8.0 0.249 0.146 5.2
BF4 12-Nov-13 8.0 0.246 0.147 5.2
BF5 12-Nov-13 7.9 0.269 0.145 5.2
BF5 12-Nov-13 7.9 0.271 0.146 5.3
BF6 12-Nov-13 7.8 0.286 - -
BF6 12-Nov-13 - - - -
RW 12-Nov-13 8.1 0.383 0.148 5.4
RW 12-Nov-13 8.1 0.375 0.148 5.5
More DOC results are shown in Table 8.8

116
Table 8.2: THM and AOX results (Raw) (- indicate that the data is not available)
Sample Date
TCM
(μg/L)
BDCM
(μg/L)
CDBM
(μg/L)
TBM
(μg/L)
THMs
(μg/L)
AOX
(μg/L)
Alum CF 4-Jun-13 54 14 ND ND 68 143
Alum CF 4-Jun-13 54 14 ND ND 68 153
PACl CF 4-Jun-13 73 17 ND ND 90 212
PACl CF 4-Jun-13 70 16 ND ND 86 158
FSP 4-Jun-13 50 13 ND ND 63 172
FSP 4-Jun-13 49 13 ND ND 62 155
Alum SW 4-Jun-13 58 15 ND ND 73 251
Alum SW 4-Jun-13 59 16 ND ND 75 254
PACl SW 4-Jun-13 80 19 ND ND 99 254
PACl SW 4-Jun-13 83 19 ND ND 102 268
BF1 4-Jun-13 153 29 ND ND 182 488
BF1 4-Jun-13 158 29 ND ND 187 508
BF2 4-Jun-13 157 29 ND ND 186 485
BF2 4-Jun-13 158 29 ND ND 187 495
BF5 4-Jun-13 154 29 ND ND 183 518
BF5 4-Jun-13 147 30 ND ND 177 529
RW 4-Jun-13 160 33 ND ND 195 550
RW 4-Jun-13 169 34 ND ND 204 551
Alum CF 24-Jun-13 69 17 ND ND 85 -
Alum CF 24-Jun-13 68 16 ND ND 84 -
PACl CF 24-Jun-13 103 24 ND ND 127 -
PACl CF 24-Jun-13 101 23 ND ND 124 -
Alum SW 24-Jun-13 75 26 ND ND 101 -
Alum SW 24-Jun-13 71 25 ND ND 96 -
PACl SW 24-Jun-13 99 26 ND ND 125 -
PACl SW 24-Jun-13 114 30 ND ND 144 -
BF1 24-Jun-13 180 40 ND ND 220 -
BF1 24-Jun-13 140 31 ND ND 171 -
BF2 24-Jun-13 169 40 ND ND 209 -
BF2 24-Jun-13 155 36 ND ND 191 -
BF3 24-Jun-13 190 42 ND ND 232 -
BF3 24-Jun-13 175 38 ND ND 213 -
BF4 24-Jun-13 183 40 ND ND 224 -
BF4 24-Jun-13 202 43 ND ND 245 -
BF5 24-Jun-13 193 41 ND ND 234 -
BF5 24-Jun-13 207 43 ND ND 250 -

117
Table 8.2: THM and AOX results (Raw) (cont.) (- indicate that the data is not available)
Sample Date
TCM
(μg/L)
BDCM
(μg/L)
CDBM
(μg/L)
TBM
(μg/L)
THMs
(μg/L)
AOX
(μg/L)
BF6 24-Jun-13 163 35 ND ND 199 -
BF6 24-Jun-13 165 35 ND ND 201 -
RW 24-Jun-13 207 45 ND ND 252 -
RW 24-Jun-13 201 43 ND ND 244 -
BF1 24-Jul-13 143 27 ND ND 171 407
BF1 24-Jul-13 135 26 ND ND 160 412
BF2 24-Jul-13 153 29 ND ND 182 400
BF2 24-Jul-13 163 32 ND ND 195 400
BF3 24-Jul-13 166 33 ND ND 199 361
BF3 24-Jul-13 152 29 ND ND 180 411
BF4 24-Jul-13 180 33 ND ND 213 423
BF4 24-Jul-13 170 32 ND ND 202 416
BF5 24-Jul-13 152 32 ND ND 184 375
BF5 24-Jul-13 144 32 ND ND 175 406
BF6 24-Jul-13 140 30 ND ND 171 365
BF6 24-Jul-13 136 30 ND ND 165 365
RW 24-Jul-13 192 42 ND ND 234 500
RW 24-Jul-13 198 44 ND ND 242 538
FSP 24-Sept-13 86 18 ND ND 104 237
FSP 24-Sept-13 80 16 ND ND 96 237
BF1 24-Sept-13 153 28 ND ND 181 398
BF1 24-Sept-13 136 25 ND ND 161 395
BF2 24-Sept-13 150 28 ND ND 178 394
BF2 24-Sept-13 151 26 ND ND 177 388
BF3 24-Sept-13 189 36 ND ND 225 397
BF3 24-Sept-13 165 31 ND ND 196 378
BF4 24-Sept-13 177 33 ND ND 210 374
BF4 24-Sept-13 175 32 ND ND 207 378
BF5 24-Sept-13 173 31 ND ND 203 399
BF5 24-Sept-13 168 30 ND ND 197 375
BF6 24-Sept-13 171 32 ND ND 204 380
BF6 24-Sept-13 161 33 ND ND 195 379
RW 24-Sept-13 193 36 ND ND 230 439
RW 24-Sept-13 203 38 ND ND 240 411
BF1 23-Oct-13 155 35 ND ND 190 484
BF1 23-Oct-13 152 34 ND ND 186 465

118
Table 8.2: THM and AOX results (Raw) (cont.)
Sample Date
TCM
(μg/L)
BDCM
(μg/L)
CDBM
(μg/L)
TBM
(μg/L)
THMs
(μg/L)
AOX
(μg/L)
BF2 23-Oct-13 145 33 ND ND 178 454
BF2 23-Oct-13 136 30 ND ND 167 451
BF3 23-Oct-13 128 29 ND ND 156 477
BF3 23-Oct-13 133 29 ND ND 162 447
BF4 23-Oct-13 133 30 ND ND 163 433
BF4 23-Oct-13 125 28 ND ND 153 441
BF5 23-Oct-13 142 32 ND ND 174 458
BF5 23-Oct-13 142 31 ND ND 173 435
BF6 23-Oct-13 124 28 ND ND 152 415
BF6 23-Oct-13 121 28 ND ND 149 424
RW 23-Oct-13 186 43 ND ND 229 507
RW 23-Oct-13 181 43 ND ND 225 444
FSP 23-Oct-13 55 15 ND ND 70 244
FSP 23-Oct-13 55 15 ND ND 70 241
Alum SW 23-Oct-13 60 17 ND ND 77 246
Alum SW 23-Oct-13 55 15 ND ND 70 253
Alum CF 23-Oct-13 54 16 ND ND 70 232
Alum CF 23-Oct-13 58 17 ND ND 75 233
PACl SW 23-Oct-13 78 20 ND ND 98 296
PACl SW 23-Oct-13 80 21 ND ND 101 287
PACl CF 23-Oct-13 78 20 ND ND 98 247
PACl CF 23-Oct-13 76 20 ND ND 96 248
BF1 12-Nov-13 139 25 ND ND 164 513
BF1 12-Nov-13 129 24 ND ND 152 537
BF2 12-Nov-13 130 21 ND ND 151 489
BF2 12-Nov-13 139 22 ND ND 161 464
BF3 12-Nov-13 131 21 ND ND 152 475
BF3 12-Nov-13 131 21 ND ND 152 475
BF4 12-Nov-13 139 23 ND ND 162 535
BF4 12-Nov-13 134 22 ND ND 156 533
BF5 12-Nov-13 131 22 ND ND 154 533
BF5 12-Nov-13 133 23 ND ND 519 156
BF6 12-Nov-13 127 22 ND ND 404 148
BF6 12-Nov-13 131 22 ND ND 430 152
RW 12-Nov-13 143 25 ND ND 506 168
RW 12-Nov-13 146 24 ND ND 505 171
FSP 12-Nov-13 45 8 ND ND 53 218

119
Table 8.2: THM and AOX results (Raw) (cont.)
Sample Date
TCM
(μg/L)
BDCM
(μg/L)
CDBM
(μg/L)
TBM
(μg/L)
THMs
(μg/L)
AOX
(μg/L)
FSP 12-Nov-13 44 8 ND ND 52 229
Alum SW 12-Nov-13 86 17 ND ND 103 419
Alum SW 12-Nov-13 78 15 ND ND 93 437
Alum CF 12-Nov-13 51 10 ND ND 61 260
Alum CF 12-Nov-13 50 10 ND ND 60 253
PACl CF 12-Nov-13 61 11 ND ND 72 251
PACl CF 12-Nov-13 62 11 ND ND 73 251

211
Table 8.3: HAA results (Raw) (ND=Not Detected)
Sample Date MCAA
(μg/L)
MBAA
(μg/L)
DCAA
(μg/L)
TCAA
(μg/L)
BCAA
(μg/L)
DBAA
(μg/L)
BDCAA
(μg/L)
CDBAA
(μg/L)
TBAA
(μg/L)
HAAs
(μg/L)
Alum CF 4-Jun-13 ND ND 20 23 ND ND ND ND ND 43
Alum CF 4-Jun-13 ND ND 23 25 ND ND ND ND ND 48
PACl CF 4-Jun-13 ND ND 23 27 ND ND ND ND ND 50
PACl CF 4-Jun-13 ND ND 22 27 ND ND ND ND ND 49
FSP 4-Jun-13 ND ND 20 24 ND ND ND ND ND 44
FSP 4-Jun-13 ND ND 19 23 ND ND ND ND ND 42
Alum SW 4-Jun-13 ND ND 25 30 ND ND ND ND ND 55
Alum SW 4-Jun-13 ND ND 22 29 ND ND ND ND ND 51
PACl SW 4-Jun-13 ND ND 29 36 ND ND ND ND ND 65
PACl SW 4-Jun-13 ND ND 26 35 ND ND ND ND ND 61
BF1 4-Jun-13 ND ND 56 66 ND ND ND ND ND 122
BF1 4-Jun-13 ND ND 51 61 ND ND ND ND ND 117
BF2 4-Jun-13 ND ND 45 59 ND ND ND ND ND 104
BF2 4-Jun-13 ND ND 43 58 ND ND ND ND ND 101
BF5 4-Jun-13 ND ND 41 57 ND ND ND ND ND 98
BF5 4-Jun-13 ND ND 44 58 ND ND ND ND ND 102
RW 4-Jun-13 ND ND 52 59 ND ND ND ND ND 110
RW 4-Jun-13 ND ND 51 59 ND ND ND ND ND 110
Alum CF 24-Jun-13 ND ND 20 15 ND ND ND ND ND 35
Alum CF 24-Jun-13 ND ND 21 16 ND ND ND ND ND 37
PACl CF 24-Jun-13 ND ND 22 19 ND ND ND ND ND 41
PACl CF 24-Jun-13 ND ND 23 20 ND ND ND ND ND 43
Alum SW 24-Jun-13 ND ND 28 28 ND ND ND ND ND 56
Alum SW 24-Jun-13 ND ND 28 29 ND ND ND ND ND 57
PACl SW 24-Jun-13 ND ND 28 32 ND ND ND ND ND 60

121
Table 8.3: HAA results (Raw) (ND=Not Detected) (cont.)
Sample Date MCAA
(μg/L)
MBAA
(μg/L)
DCAA
(μg/L)
TCAA
(μg/L)
BCAA
(μg/L)
DBAA
(μg/L)
BDCAA
(μg/L)
CDBAA
(μg/L)
TBAA
(μg/L)
HAAs
(μg/L)
PACl SW 24-Jun-13 ND ND 27 31 ND ND ND ND ND 58
BF1 24-Jun-13 ND ND 46 69 ND ND ND ND ND 115
BF1 24-Jun-13 ND ND 43 63 ND ND ND ND ND 106
BF2 24-Jun-13 ND ND 44 64 ND ND ND ND ND 108
BF2 24-Jun-13 ND ND 43 62 ND ND ND ND ND 105
BF3 24-Jun-13 ND ND 47 66 ND ND ND ND ND 113
BF4 24-Jun-13 ND ND 48 68 ND ND ND ND ND 116
BF4 24-Jun-13 ND ND 49 70 ND ND ND ND ND 119
BF5 24-Jun-13 ND ND 47 66 ND ND ND ND ND 113
BF5 24-Jun-13 ND ND 47 67 ND ND ND ND ND 114
BF6 24-Jun-13 ND ND 46 65 ND ND ND ND ND 111
BF6 24-Jun-13 ND ND 45 66 ND ND ND ND ND 111
RW 24-Jun-13 ND ND 46 64 ND ND ND ND ND 110
RW 24-Jun-13 ND ND 46 68 ND ND ND ND ND 114
BF1 24-Jul-13 ND ND 35 56 ND ND ND ND ND 91
BF1 24-Jul-13 ND ND 35 57 ND ND ND ND ND 92
BF2 24-Jul-13 ND ND 36 58 ND ND ND ND ND 94
BF2 24-Jul-13 ND ND 36 55 ND ND ND ND ND 91
BF3 24-Jul-13 ND ND 37 60 ND ND ND ND ND 97
BF3 24-Jul-13 ND ND 34 54 ND ND ND ND ND 88
BF4 24-Jul-13 ND ND 39 59 ND ND ND ND ND 98
BF4 24-Jul-13 ND ND 35 55 ND ND ND ND ND 90
BF5 24-Jul-13 ND ND 40 60 ND ND ND ND ND 100
BF5 24-Jul-13 ND ND 40 61 ND ND ND ND ND 101
BF6 24-Jul-13 ND ND 38 59 ND ND ND ND ND 97
BF6 24-Jul-13 ND ND 36 56 ND ND ND ND ND 92
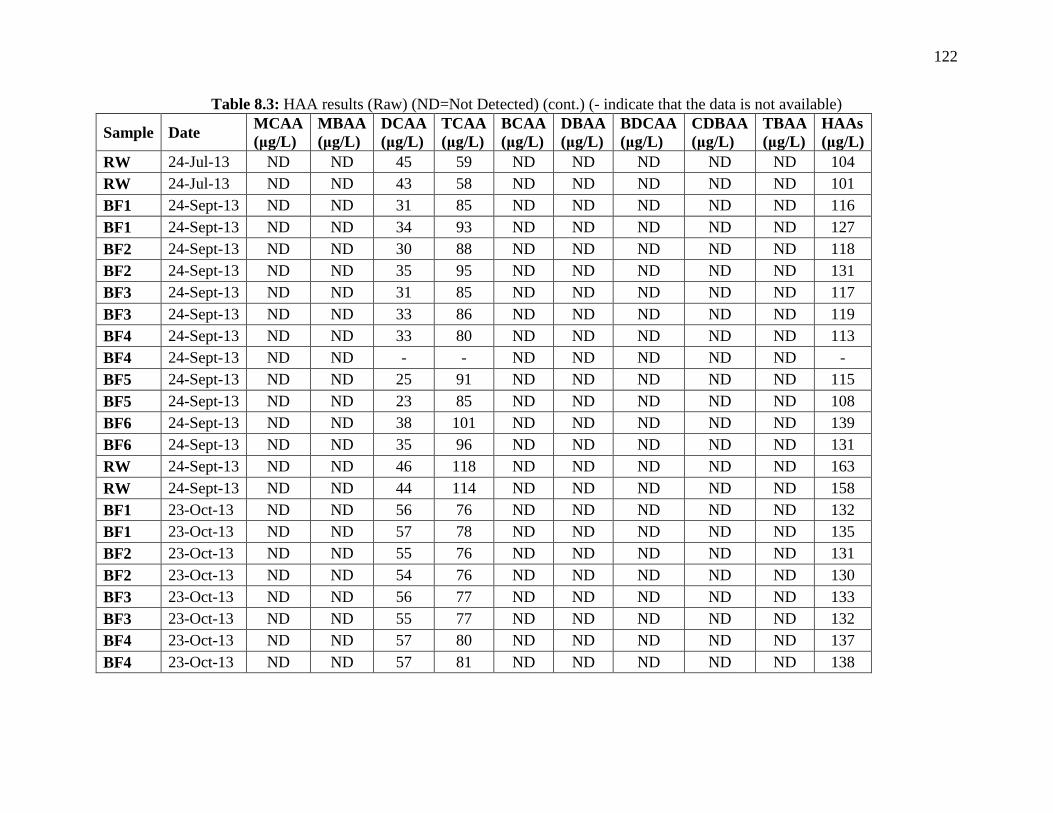
122
Table 8.3: HAA results (Raw) (ND=Not Detected) (cont.) (- indicate that the data is not available)
Sample Date MCAA
(μg/L)
MBAA
(μg/L)
DCAA
(μg/L)
TCAA
(μg/L)
BCAA
(μg/L)
DBAA
(μg/L)
BDCAA
(μg/L)
CDBAA
(μg/L)
TBAA
(μg/L)
HAAs
(μg/L)
RW 24-Jul-13 ND ND 45 59 ND ND ND ND ND 104
RW 24-Jul-13 ND ND 43 58 ND ND ND ND ND 101
BF1 24-Sept-13 ND ND 31 85 ND ND ND ND ND 116
BF1 24-Sept-13 ND ND 34 93 ND ND ND ND ND 127
BF2 24-Sept-13 ND ND 30 88 ND ND ND ND ND 118
BF2 24-Sept-13 ND ND 35 95 ND ND ND ND ND 131
BF3 24-Sept-13 ND ND 31 85 ND ND ND ND ND 117
BF3 24-Sept-13 ND ND 33 86 ND ND ND ND ND 119
BF4 24-Sept-13 ND ND 33 80 ND ND ND ND ND 113
BF4 24-Sept-13 ND ND - - ND ND ND ND ND -
BF5 24-Sept-13 ND ND 25 91 ND ND ND ND ND 115
BF5 24-Sept-13 ND ND 23 85 ND ND ND ND ND 108
BF6 24-Sept-13 ND ND 38 101 ND ND ND ND ND 139
BF6 24-Sept-13 ND ND 35 96 ND ND ND ND ND 131
RW 24-Sept-13 ND ND 46 118 ND ND ND ND ND 163
RW 24-Sept-13 ND ND 44 114 ND ND ND ND ND 158
BF1 23-Oct-13 ND ND 56 76 ND ND ND ND ND 132
BF1 23-Oct-13 ND ND 57 78 ND ND ND ND ND 135
BF2 23-Oct-13 ND ND 55 76 ND ND ND ND ND 131
BF2 23-Oct-13 ND ND 54 76 ND ND ND ND ND 130
BF3 23-Oct-13 ND ND 56 77 ND ND ND ND ND 133
BF3 23-Oct-13 ND ND 55 77 ND ND ND ND ND 132
BF4 23-Oct-13 ND ND 57 80 ND ND ND ND ND 137
BF4 23-Oct-13 ND ND 57 81 ND ND ND ND ND 138

123
Table 8.3: HAA results (Raw) (ND=Not Detected) (cont.)
Sample Date MCAA
(μg/L)
MBAA
(μg/L)
DCAA
(μg/L)
TCAA
(μg/L)
BCAA
(μg/L)
DBAA
(μg/L)
BDCAA
(μg/L)
CDBAA
(μg/L)
TBAA
(μg/L)
HAAs
(μg/L)
BF5 23-Oct-13 ND ND 56 79 ND ND ND ND ND 136
BF5 23-Oct-13 ND ND 57 80 ND ND ND ND ND 137
BF6 23-Oct-13 ND ND 51 75 ND ND ND ND ND 127
BF6 23-Oct-13 ND ND 53 78 ND ND ND ND ND 131
RW 23-Oct-13 ND ND 59 78 ND ND ND ND ND 136
RW 23-Oct-13 ND ND 58 78 ND ND ND ND ND 136
FSP 23-Oct-13 ND ND 55 15 ND ND ND ND ND 70
FSP 23-Oct-13 ND ND 55 15 ND ND ND ND ND 70
Alum SW 23-Oct-13 ND ND 60 17 ND ND ND ND ND 77
Alum SW 23-Oct-13 ND ND 55 15 ND ND ND ND ND 70
Alum CF 23-Oct-13 ND ND 54 16 ND ND ND ND ND 70
Alum CF 23-Oct-13 ND ND 58 17 ND ND ND ND ND 75
PACl SW 23-Oct-13 ND ND 78 20 ND ND ND ND ND 98
PACl SW 23-Oct-13 ND ND 80 21 ND ND ND ND ND 101
PACl CF 23-Oct-13 ND ND 78 20 ND ND ND ND ND 98
PACl CF 23-Oct-13 ND ND 76 20 ND ND ND ND ND 96
BF1 12-Nov-13 ND ND 68 98 ND ND ND ND ND 165
BF1 12-Nov-13 ND ND 68 100 ND ND ND ND ND 167
BF2 12-Nov-13 ND ND 73 111 ND ND ND ND ND 184
BF2 12-Nov-13 ND ND 73 109 ND ND ND ND ND 182
BF3 12-Nov-13 ND ND 69 103 ND ND ND ND ND 172
BF3 12-Nov-13 ND ND 78 117 ND ND ND ND ND 195
BF4 12-Nov-13 ND ND 74 111 ND ND ND ND ND 185
BF4 12-Nov-13 ND ND 76 114 ND ND ND ND ND 190
BF5 12-Nov-13 ND ND 78 115 ND ND ND ND ND 192
BF5 12-Nov-13 ND ND 76 115 ND ND ND ND ND 191

124
Table 8.5: HAA results (Raw) (ND=Not Detected) (cont.)
Sample Date MCAA
(μg/L)
MBAA
(μg/L)
DCAA
(μg/L)
TCAA
(μg/L)
BCAA
(μg/L)
DBAA
(μg/L)
BDCAA
(μg/L)
CDBAA
(μg/L)
TBAA
(μg/L)
HAAs
(μg/L)
BF6 12-Nov-13 ND ND 81 119 ND ND ND ND ND 201
BF6 12-Nov-13 ND ND 78 116 ND ND ND ND ND 194
RW 12-Nov-13 ND ND 81 123 ND ND ND ND ND 203
RW 12-Nov-13 ND ND 79 121 ND ND ND ND ND 200
FSP 12-Nov-13 ND ND 20 29 ND ND ND ND ND 49
FSP 12-Nov-13 ND ND 20 29 ND ND ND ND ND 49
Alum SW 12-Nov-13 ND ND 59 67 ND ND ND ND ND 126
Alum SW 12-Nov-13 ND ND 58 65 ND ND ND ND ND 123
Alum CF 12-Nov-13 ND ND 24 36 ND ND ND ND ND 60
Alum CF 12-Nov-13 ND ND 26 39 ND ND ND ND ND 65
PACl CF 12-Nov-13 ND ND 32 37 ND ND ND ND ND 69
PACl CF 12-Nov-13 ND ND 35 40 ND ND ND ND ND 75

219
Table 8.4: Raw ATP and EPS data
Date ATP (ng/g media) Pr (μg/g media) PS (μg/g media)
Alum CF 4-Jun-13 8 19 6
PACl CF 4-Jun-13 7 0 0
FSP 4-Jun-13 28 52 14
BF1 4-Jun-13 708 741 60
BF2 4-Jun-13 757 734 73
BF3 4-Jun-13 103 156 1
BF4 4-Jun-13 156 359 13
BF5 4-Jun-13 124 224 3
FSP 24-Jul-13 76 12 7
BF1 24-Jul-13 814 465 54
BF2 24-Jul-13 693 567 80
BF3 24-Jul-13 1040 497 65
BF4 24-Jul-13 828 547 73
BF5 24-Jul-13 1071 421 45
BF6 24-Jul-13 2087 461 55
FSP 30-Sept-13 67 12 6
BF1 30-Sept-13 493 426 32
BF2 30-Sept-13 446 463 37
BF3 30-Sept-13 567 280 24
BF4 30-Sept-13 867 380 32
BF5 30-Sept-13 480 258 23
BF6 30-Sept-13 423 399 21
FSP 23-Oct-13 52 - -
BF1 23-Oct-13 259 - -
BF2 23-Oct-13 302 - -
BF3 23-Oct-13 510 - -
BF4 23-Oct-13 303 - -
BF5 23-Oct-13 269 - -
BF6 23-Oct-13 153 - -
BF1 18-Nov-13 669 287 32
BF2 18-Nov-13 956 323 34
BF3 18-Nov-13 775 329 27
BF4 18-Nov-13 672 156 25
BF5 18-Nov-13 780 191 22
BF6 18-Nov-13 410 439 36
FSP 18-Nov-13 68 207 71
Alum CF 18-Nov-13 58 105 29
PACl CF 18-Nov-13 8 64 15

126
Table 8.5: LC-OCD results (Raw)
Date BP
(μg/L)
HS
(μg/L)
BB (μg/L) LMWN
(μg/L)
LMWA
(μg/L)
Alum CF 16-Jun-13 207 1294 832 299 137
PACl CF 16-Jun-13 177 1310 711 456 142
Alum SW 16-Jun-13 230 953 281 377 151
PACl SW 16-Jun-13 154 1584 753 372 142
BF1 16-Jun-13 316 3217 863 564 145
BF2 16-Jun-13 460 3373 767 923 125
BF3 16-Jun-13 377 3184 771 490 135
BF5 16-Jun-13 386 3161 731 545 147
BF6 16-Jun-13 337 3180 709 384 136
RW 16-Jun-13 408 3315 777 576 151
FSP 12-Aug-13 121 1654 259 390 259
BF1 12-Aug-13 343 3058 727 493 146
BF2 12-Aug-13 318 2898 892 415 161
BF3 12-Aug-13 396 3135 716 428 159
BF4 12-Aug-13 378 3142 647 462 166
BF5 12-Aug-13 406 3146 679 409 149
BF6 12-Aug-13 434 3014 738 413 143
RW 12-Aug-13 436 3013 781 452 137
FSP 24-Sept-13 219 1310 742 433 174
BF1 24-Sept-13 420 3190 833 400 157
BF2 24-Sept-13 415 3094 855 404 155
BF3 24-Sept-13 409 3150 826 416 150
BF4 24-Sept-13 404 2968 787 414 151
BF5 24-Sept-13 397 3046 909 423 154
BF6 24-Sept-13 403 3118 803 420 149
RW 24-Sept-13 534 3191 861 382 144
BF1 18-Nov-13 418 3263 1112 381 127
BF2 18-Nov-13 435 3448 889 336 137
BF3 18-Nov-13 416 3241 1093 337 128
BF4 18-Nov-13 444 3287 1056 343 130
BF5 18-Nov-13 398 3247 1092 357 130
BF6 18-Nov-13 408 3338 1031 329 133
RW 18-Nov-13 489 3277 1122 310 140
FSP 18-Nov-13 192 1051 902 306 125
Alum SW 18-Nov-13 283 1228 908 295 125
Alum CF 18-Nov-13 251 1256 887 328 140
PACl CF 18-Nov-13 206 1366 695 393 184

127
8.3 Appendix C (QA/QC)
8.3.1 THMs
Table 8.6: Sample THMs control chart warning and control limits
TCM (μg/L) BDCM (μg/L) CDBM (μg/L) TBM (μg/L)
Mean (n = 7) 20.9 21.1 25.1 25.3
SD (n = 7) 1.6 1.5 19.4 1.4
UWL 24 24 25.1 28.1
LWL 17.7 18.2 19.4 22.5
UCL 25.6 25.5 26.5 29.5
LCL 16.1 16.7 17.9 21.0
Figure 8.6: TCM control chart (June 2013)
Figure 8.7: TCM control chart (July-Nov 2013)
5
10
15
20
25
30
0 2 4 6 8 10 12 14
TC
M C
once
ntr
atio
n (
ug/L
)
5
10
15
20
25
30
35
0 2 4 6 8 10 12 14
TC
M C
once
ntr
atio
n
(μg/L
)
June 2013
Mean
UWL
LWL LCL
UCL
LWL
LCL
UCL
Mean
UWL
July 2013 Nov 2013 Sept 2013

128
Figure 8.8: BDCM control chart (June 2013)
Figure 8.9: BDCM control chart (July-Nov 2013)
10
12
14
16
18
20
22
24
26
28
0 2 4 6 8 10 12 14
BD
CM
Conce
ntr
atio
n (
μg/L
)
10
12
14
16
18
20
22
24
26
28
0 2 4 6 8 10 12 14
BD
CM
Conce
ntr
atio
n (
μg/L
)
LWL
LCL
UCL
Mean
UWL
June 2013
LWL
LCL
UCL
Mean
UWL
July 2013 Nov 2013 Sept 2013

129
8.3.2 HAAs
Table 8.7: HAA control chart warning and control limits
MCAA MBAA DCAA TCAA BCAA DBAA BDCAA CDBAA TBAA
Mean
(n=8) 38.51 39.54 40.23 44.71 42.12 46.69 52.47 61.97 73.10
Standard
deviation
(n=8) 1.74 1.89 1.86 1.72 1.85 2.05 3.77 6.47 8.36
UWL 41.99 43.33 43.95 48.15 45.82 50.78 60.01 74.92 89.81
LWL 35.03 35.75 36.51 41.26 38.41 42.60 44.93 49.02 56.39
UCL 43.73 45.22 45.81 49.87 47.68 52.82 63.78 81.39 98.17
LCL 33.28 33.85 34.65 39.54 36.55 40.55 41.16 42.55 48.03
Figure 8.10: DCAA control chart (June-Nov 2013)
Figure 8.11: TCAA control chart (June-Nov 2013)
30
32
34
36
38
40
42
44
46
48
0 2 4 6 8 10 12 14 16
DC
AA
(μ
g/L
)
35
37
39
41
43
45
47
49
51
0 2 4 6 8 10 12 14 16
TC
AA
(μ
g/L
)
LWL
LCL
UCL
Mean
UWL
LWL
LCL
UCL
Mean
UWL
July 2013 Nov 2013 Sept 2013 Oct 2013 June 2013
July 2013 Nov 2013 Sept 2013 Oct 2013 June 2013
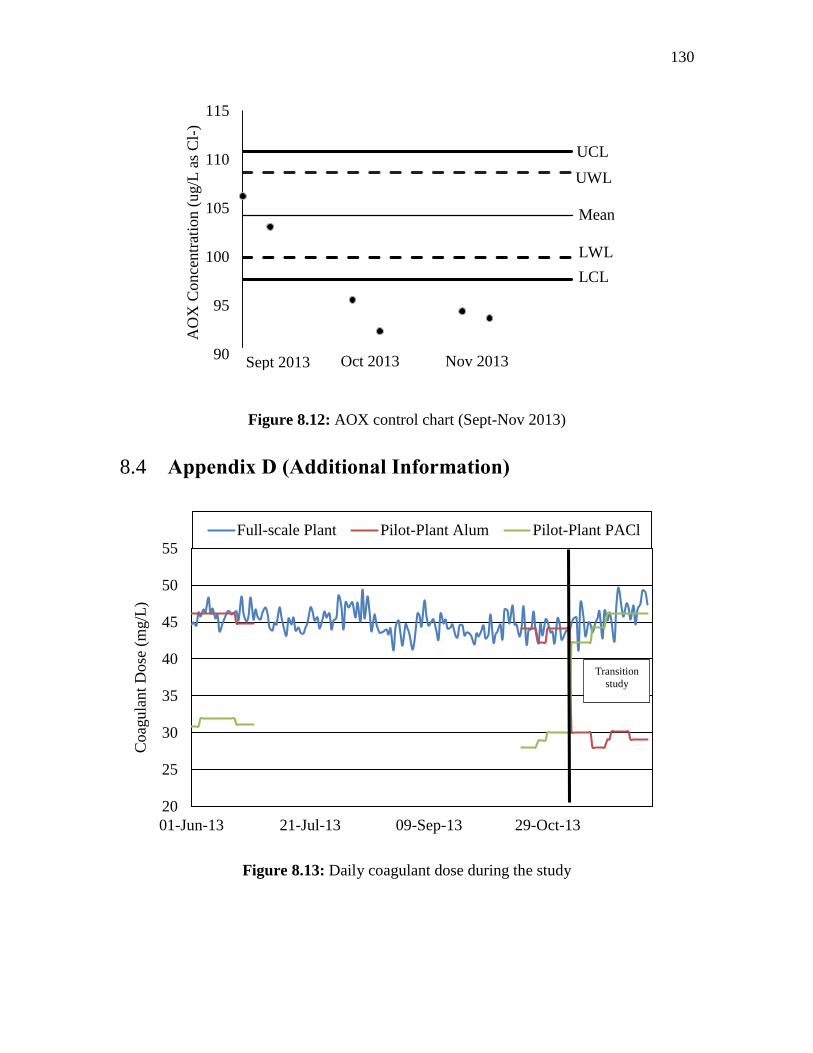
130
Figure 8.12: AOX control chart (Sept-Nov 2013)
8.4 Appendix D (Additional Information)
Figure 8.13: Daily coagulant dose during the study
90
95
100
105
110
115
0 2 4 6 8 10 12 14
AO
X C
once
ntr
atio
n (
ug/L
as
Cl-
)
20
25
30
35
40
45
50
55
01-Jun-13 21-Jul-13 09-Sep-13 29-Oct-13
Coag
ula
nt
Dose
(m
g/L
)
Full-scale Plant Pilot-Plant Alum Pilot-Plant PACl
Transition
study
Sept 2013 Oct 2013 Nov 2013
LWL
LCL
UCL
Mean
UWL

131
Figure 8.14: Avarage daily raw water tempreture at the peterborough water treatment
plant
Figure 8.15: Average daily DOC concentration in raw water, conventional, biofilter
effluent
0
5
10
15
20
25
30
35
5/6/2013 6/25/2013 8/14/2013 10/3/2013 11/22/2013 1/11/2014
Avar
age
Dai
ly R
aw W
ater
Tem
pre
ture
(˚C
)
0
1
2
3
4
5
6
7
6-May-13 25-Jun-13 14-Aug-13 3-Oct-13 22-Nov-13 11-Jan-14
DO
C (
mg/L
)
Raw Water Full-scale plant filter 11
Post-filter Al Post-filter PACl
Biofilter (large control) BF2 (Nutrient Enhanced)

132
Figure 8.16: Average daily UV254 in raw water, conventional, biofilter effluent
Figure 8.17: Normalized UF resistance profile comparing small vs large control biofilter
effluent (BF1: September 16th,2013, T = 18 ºC. BF3: September 30th, 2013, T = 18 ºC)
0
0.05
0.1
0.15
0.2
0.25
6-May-13 25-Jun-13 14-Aug-13 3-Oct-13 22-Nov-13 11-Jan-14
UV
25
4(c
m-1
)Raw Water Full-scale plant filter 11
Post-filter Al Post-filter PACl
Biofilter (large control) BF2 (Nutrient Enhanced)
0
2
4
6
8
0 5 10 15 20 25 30
Norm
aliz
ed m
embra
ne
resi
stan
ce @
20˚C
(×
10
12
m-1
)
Permeation Time (hr)
BF1 (Large Control)
BF3 (Small Control)

133
Table 8.8: DOC concentrations in raw water and biofilter effluent (- indicate that the data is not available)
BF1 (Control
Large)
BF2 (Nutrient
Enhancement)
BF3 (Control
Small)
BF4 (Peroxide
Addition)
BF5 (Alum
Addition)
BF6
(GAC)
Raw
Water
4-Jun-13 6.2 6.2 6.5 6.5 6.5 - 7.0
24-Jun-13 5.2 5.3 5.4 5.4 5.4 5.4 5.5
24-Jul-13 5.2 5.2 5.3 5.3 5.3 5.1 5.5
12-Aug-13 4.9 4.9 4.9 4.9 5.0 4.9 5.0
27-Aug-13 5.0 5.0 5.1 5.1 5.1 5.1 5.4
24-Sep-13 4.9 4.9 4.9 5.0 4.9 4.8 5.2
26-Sep-13 5.6 5.6 5.5 5.4 5.5 5.5 5.9
2-Oct-13 5.4 5.4 - 5.4 5.3 5.2 5.7
4-Oct-13 5.5 5.3 5.3 5.4 5.5 5.3 5.8
8-Oct-13 5.2 5.2 5.3 5.5 5.4 5.3 5.7
10-Oct-13 5.3 5.2 5.1 5.2 5.2 5.0 5.6
16-Oct-13 5.2 5.3 5.2 5.3 5.3 5.1 5.6
23-Oct-13 5.4 5.2 5.2 5.1 5.1 5.1 5.5
24-Oct-13 5.3 5.4 5.3 5.3 5.3 5.3 5.6
29-Oct-13 5.3 5.4 5.3 5.5 5.2 5.2 5.5
5-Nov-13 5.2 5.3 5.2 5.3 5.2 5.2 5.3
7-Nov-13 5.2 5.5 5.3 5.4 5.3 5.3 5.4
12-Nov-13 5.3 5.2 5.2 5.2 5.3 - 5.5