Embed Size (px)
Citation preview

Energy-transfer and charge-separation pathways in the reaction center ofphotosystem II revealed by coherent two-dimensional opticalspectroscopy
Darius Abramaviciusa� and Shaul Mukamelb�
Department of Chemistry, University of California, Irvine, Irvine, California 92697-2025, USA
�Received 8 July 2010; accepted 7 September 2010; published online 10 November 2010�
The excited state dynamics and relaxation of electrons and holes in the photosynthetic reactioncenter of photosystem II are simulated using a two-band tight-binding model. The dissipativeexciton and charge carrier motions are calculated using a transport theory, which includes a strongcoupling to a harmonic bath with experimentally determined spectral density, and reduces to theRedfield, the Förster, and the Marcus expressions in the proper parameter regimes. The simulatedthird order two-dimensional signals, generated in the directions −k1+k2+k3, k1−k2+k3, andk1+k2−k3, clearly reveal the exciton migration and the charge-separation processes.© 2010 American Institute of Physics. �doi:10.1063/1.3493580�
I. INTRODUCTION
Charge separation in the core of pigment-proteinreaction-center �RC� complexes is the first energy conversionstep in photosynthesis. The subsequent electron transferacross a thylakoid membrane of chloroplasts triggers a pro-ton transfer reaction, creating a charge gradient that drives achain of chemical reactions, leading eventually to the stablestorage of solar energy.1 Photosystem II �PS-II�, which is themost abundant photosynthetic complex in Nature,2 is respon-sible for water splitting. Its 2.9 Å resolution RC structureshows two branches of pigments, D1 and D2, each made upof two chlorophyll molecules �Chl� and one pheophytin�Phe�, and other pigments that are separated from these sixcore pigments either energetically or spatially.3 All six chro-mophores are tightly packed within an �303 Å3 volume andshow strong �50–200 cm−1� resonant exciton interactions.
The Frenkel exciton model has often been used to de-scribe collective electronic excitations in molecularcomplexes.4 This model and the system-bath coupling hasbeen parametrized for PS-II by Raszewski et al. using a nu-merical optimization algorithm, which yields good agree-ment with linear optical properties.5 A more elaborate spec-tral density of the system-bath coupling was used byNovoderezhkin et al.6 by employing 48 vibrational bathmodes extracted from low-temperature fluorescence line-narrowing data. The extended model includes charge transfer�CT� states coupled to other molecular excitations. It canadequately describe absorption, fluorescence, and Stark spec-trum, which depend only on singly excited states. Despite theextensive studies of electron separation and transfer timescales, the primary charge-separation site in PS-II RC is stillnot clearly identified: several radical pair �RP� evolution sce-
narios fit the existing experiments.7 The model parameterswere refined6 by including fluorescence and Stark spectros-copy data. The strong dependence of the Stark spectrum onCT states helped determine some of the parameters.
The absorption spectrum is not very sensitive to the CTstates. This is to be expected since the isolated CT statescarry no oscillator strength from the ground state. This selec-tion rule is broken by mixing the CT with the Frenkel exci-ton states, leading to a weak absorption of the CT state. Dueto large static dipole of a CT state, the Stark spectrum issensitive to electron transfer. However, for the same reason,CT states are strongly coupled to the medium causing largebroadening, which makes them harder to resolve.
An optical excitation creates an electron-hole pair local-ized on the same chromophore. In the CT state, they resideon different molecules. Charge separation from a molecularexcited state corresponds to a quantum transition between amolecular excited state and a CT state. The above phenom-enological hybrid �Frenkel+CT exciton� model misses somecharacteristics of CT states, such as electron-hole Coulombinteraction, electron affinities, and ionization energies, aswell as fermionic properties of electrons and holes. There-fore, it cannot be directly used to compute double-excitonstates.
In this paper, we develop a tight-binding two-bandmodel for the core RC complex of PS-II and use it to simu-late the energy-transfer and charge-separation dynamics.We account for strong CT state coupling with the bath byusing a modified Redfield rate expression for the energy andcharge hopping, which treats diagonal fluctuationsnonperturbatively.8 Closed expressions are derived for thethird order optical signals with Gaussian lineshapes that ac-count for static inhomogeneities of the system without theneed to sample the ensemble realizations explicitly. The sig-natures of CT states in various two-dimensional �2D� opticalsignals are identified.
a�Electronic mail: [email protected]�Electronic mail: [email protected].
THE JOURNAL OF CHEMICAL PHYSICS 133, 184501 �2010�
0021-9606/2010/133�18�/184501/13/$30.00 © 2010 American Institute of Physics133, 184501-1

II. TIGHT-BINDING TWO-BAND HAMILTONIAN FOREXCITON AND CHARGE-TRANSFER DYNAMICS
We consider an aggregate where each chromophore hastwo frontier orbitals: the highest occupied molecular orbital�HOMO� and the lowest unoccupied molecular orbital�LUMO�.9 Neglecting spin, each chromophore then has fourstates: the ground state �0�, where the HOMO is occupiedand the LUMO is not; the negatively charged electron statecm
† �0�, where both are occupied; the positively charged holestate dm
† �0� �both unoccupied�; and a single electron-hole pair�Frenkel excited� state cm
† dm† �0�, when HOMO electron is
transferred to the LUMO. The model is shown in Fig. 1. The
operators, cm† and dn
†, create an electron on site m and a hole
on n, respectively �cm and dn are the corresponding annihi-lation operators�. They satisfy the Fermi commutations
cm, cn† = cmcn
† + cn†cm = �mn, �1�
dm, dn† = dmdn
† + dn†dm = �mn. �2�
We adopt the following tight-binding Hamiltonian for elec-trons and holes in the monopole approximation, used insemiconductor optics. It neglects quartic electronic exchangeterms,10,11
HS = �m,n
tmn�1�cm
† cn + �m,n
tmn�2�dm
† dn + �mn
m�n
Wmn�f� cm
† dm† dncn
− �mn
Wmn�c� cm
† dn†dncm +
1
2 �mn
m�n
Vmn�1�cm
† cn†cncm
+1
2 �mn
m�n
Vmn�2�dm
† dn†dndm. �3�
The Hamiltonian parameters are as follows. tmn�1� �tmn
�2�� is theelectron �hole� hopping rate between LUMO �HOMO�orbitals, Vmn
�1� =V�e���rm−rn�� is the electron-electron Coulombrepulsion between molecules m and n, Vmn
�2� =V�h���rm−rn�� isthe hole-hole Coulomb repulsion between molecules m andn, Wmn
�f� is the dipole-dipole type resonance interactionbetween two excitons on sites m and n, and finallyWmn
�c� =V�eh���rm−rn�� is the Coulomb attraction energybetween the electron and the hole.
The system is further coupled to a harmonic phonon bathdescribed by a Hamiltonian,
HB = ��
w��b�† b� + 1/2� , �4�
where w� is the frequency of the phonon mode � and b�† �b��
are the creation �annihilation� boson operators,
�b�, b��† � = b�b��
† − b��† b� = ����. �5�
The electron and hole energies fluctuate due to �linear� cou-pling with the bath
HSB = ����
m
f�,m�1� cm
† cm + �m
f�,m�2� dm
† dm �b�† + b�� . �6�
Here, f�,m�1� and f�,m
�2� are the coupling strengths between theelectron and the hole orbitals at site m and the bath coordi-nate. To describe the optical response, we couple the systemto a classical external optical �electric� field
HSF = − �m
��m� dmcm + �mcm
† dm† � · E�t� . �7�
This dipole interaction can only create an electron-hole pair�exciton� on the same molecule: the CT states are dark.
The total Hamiltonian is given by
HT = HS + HSB + HB + HSF. �8�
The lowest manifold of single �one electron and one hole�excited states will be denoted by �emhn�� cm
† dn†�0�. The
Hamiltonian matrix elements for these states are
�emhn�HS�ekhl� = �nltmk�1� + �mktnl
�2� + �kl�mn�1 − �mk�Wmk�f�
− �mk�nlWmn�c� . �9�
This includes the state energies �diagonal part��emhn�HS�emhn�= tmm
�1� + tnn�2�−Wmn
�c� and the off-diagonal cou-plings. The Coulomb interaction potential is defined forcharge pairs, i.e., Wmn
�c� =e2�4��0�rm−rn��−1, when m�n. Wmm�c�
is the intrinsic property of a molecule under consideration.
HOMO
LUMO
HOMO
LUMO
groundst.
excitationof2
CTstate
molecule 1 molecule 2
c†|0
d†|0
d†|0
c†|0
FIG. 1. Tight-binding model of molecular aggregates. Two molecules areshown. First row: the ground �0� state. Second row: excitation of molecule 2corresponds to creation of hole and electron on that molecule. Third row:CT state corresponds to creation of hole on molecule 2 and an electron onmolecule 1. Electrons are marked by solid circles and holes by open circles.
184501-2 D. Abramavicius and S. Mukamel J. Chem. Phys. 133, 184501 �2010�

States where the electron and the hole reside on the same
molecule, cm† dm
† �0�, represent molecular excitations. TheFrenkel exciton model is thus recovered by neglecting thecharged molecular states, where the electron and hole resideon different molecules. Each molecule is then a two-levelsystem and the molecular transition energy is �m= tmm
�1� + tmm�2�
−Wmm�c� and the intermolecular interaction is Jmn=Wmn
�f� .
We next turn to the doubly-excited two electron-hole
pair manifold, �emenhkhl�� cm† cn
†dk†dl
†�0�. A complete basis setis obtained by using the constraints m�n and k� l �note thatm=n and k= l are excluded by Pauli blocking�. This gives�N�N−1� /2�2 double-pair states with the followingHamiltonian matrix elements:
�emenhkhl�HS�em�en�hk�hl�� = �tmm��1� �nn� + tmn�
�1� �nm� + tnm��1� �mn� + tnn�
�1� �mm���kk��ll� + �tkk��2� �ll� + tkl�
�2��lk� + tlk��2��kl� + tll�
�2��kk���mm��nn�
+ �Vmn�1� + Vkl
�2� − Wmk�c� − Wml
�c� − Wnk�c� − Wnl
�c���mm��nn��kk��ll�
+ �Wmm��f� �nn���mk�ll� + �ml�kl�� + Wnm�
�f� �mn���nk�ll� + �nl�kl����m�k�
+ �Wmm��f� �nn���mk�lk� + �ml�kk�� + Wnm�
�f� �mn���nk�lk� + �nl�kk����m�l�
+ �Wmn��f� �nm���mk�ll� + �ml�kl�� + Wnn�
�f� �mm���nk�ll� + �nl�kl����n�k�
+ �Wmn��f� �nm���mk�lk� + �ml�kk�� + Wnn�
�f� �mm���nk�lk� + �nl�kk����n�l�. �10�
The singly excited,
�e� = �mk
�mk,ecm† dk
†�0� , �11�
and doubly excited,
�f� = �mn
m�n
�kl
k�l
�mn��kl�,fcm† cn
†dk†dl
†�0� , �12�
eigenstates are calculated by diagonalizing the correspondingblocks of the Hamiltonian matrix.
III. MODELING THE ENERGY AND ELECTRONTRANSFER
All bath-induced relaxation and transport properties ofour model are determined by the following matrices of spec-tral densities:12
C��11�mm,nn�� = ��
�
f�,m�1� f�,n
�1� ��� − w�� − �� + w��� ,
�13�
C��12�mm,nn�� = ��
�
f�,m�1� f�,n
�2� ��� − w�� − �� + w��� ,
�14�
C��22�mm,nn�� = ��
�
f�,m�2� f�,n
�2� ��� − w�� − �� + w��� .
�15�
These satisfy C���=−C��−�. Here, the pairs of indicesdenote energy �diagonal� fluctuations of the local states. Foran infinite number of bath degrees of freedom, the spectraldensity is a smooth function.
We shall transform these matrices into the eigenstate ba-sis, thus mapping the local correlations to correlations offluctuations of the exciton eigenstates. The single-excitonmanifold is described by a tetradic spectral densityC�e4e3,e2e1
��. Fluctuations involving the double-excitonstates have the spectral densities C�e1e2,f1f2
�� andC�f1f2,f1�f2�
��. Fluctuations of eigenstate transition energies,
C�ee,e�e���, cause pure dephasing, and the fluctuations of
couplings, C�ee�,e�e��, are responsible for the energy andcharge transport. The double-exciton fluctuations are respon-sible for the broadening of transitions involving the double-exciton states. The transformation between the real space andthe eigenstate fluctuation spectral densities is given in theAppendix.
To describe exciton dephasing and transport, and the cor-responding optical response in the eigenstate basis, we intro-duce two auxiliary bath functions. The first is the lineshapefunction,
gab,cd�t� =� d
2�
C�ab,cd��2 �coth��/2��1 − cos�t��
+ i sin�t� − it� , �16�
where the indices abcd run over the manifolds g, e, and fand �= �kBT�−1. Its second derivative,
gab,cd�t� � Mab,cd�+� �t� =� d
2�C�ab,cd��
��coth��/2�cos�t� − i sin�t�� ,
�17�
is the correlation function of fluctuations.12
Transport in the single-exciton manifold will be de-scribed by the Pauli master equation13
184501-3 Energy transfer and charge separation in PS-II J. Chem. Phys. 133, 184501 �2010�

ee = − Kee,ee ee + �e�
e��e
Kee,e�e� e�e�. �18�
The energy and charge transport rates can be calculated byincluding diagonal fluctuations nonperturbatively using thecumulant expansion. Off-diagonal fluctuations are treated us-ing second order perturbation theory. The transfer rate be-tween an initial e� and a final e state �e�e�� is obtained byassuming bath thermal equilibrium with respect to the initialstate8
Kee,e�e� = 2 Re�0
�
d�Fee���� , �19�
where
Fee���� = Fee��0� ����gee�,e�e��� − �ge�e,e�e���� − ge�e,ee���
+ 2i�e�e,e�e���ge�e�,ee���� − gee,ee����
+ 2i�ee�,e�e��� �20�
and
Fee��0� ��� = exp�− iee�� − gee,ee��� − ge�e�,e�e����
+ ge�e�,ee��� + gee,e�e����
− 2i���e�e�,e�e� − �ee,e�e��� . �21�
Here,
�ab,cd =� d
2�
C�ab,cd��
�22�
is a reorganization-energy matrix. The diagonal elements of
the rate matrix are given by Kee,ee=�e�e��eKe�e�,ee.
Detailed balance ensures thermal equilibrium at long times.When the diagonal and off-diagonal fluctuations areuncorrelated, we get Kee,e�e� /Ke�e�,ee=exp���e�−�e
− ��e�e�,e�e�−�ee,ee���kBT�−1�.This model uses the rotating-wave-approximation
�RWA� �also known as the secular approximation� for thedensity matrix evolution. It has been shown that the nonsecu-lar terms are responsible for the temperature-dependence ofthe absorption spectrum.14,15 Nonsecular density matrix dy-namics has been recently observed in conjugated polymers.16
We have shown that the nonsecular terms are the source ofthe quantum transport.17,18 In this paper, we invoke the RWAand focus on the overall peak pattern of CT states. Quantumelectron transport can be included as was done in Ref. 18.
Equations �19�–�21� interpolate between several theoriesthat are obtained as limiting cases. Consider weakly interact-ing donor �d� and acceptor �a� molecules. The system eigen-states are then direct products of the donor and acceptorstates. We denote Uee�= �e�HSB�e��, where e and e� run over aor d states. Uee� is still a bath operator. Weak donor andacceptor coupling is characterized by the thermally averagedcorrelation function gad,da�t�= �Uad�t�Uda�0��. The lineshapefunctions gaa,aa�t�� �Uaa�t�Uaa�0��, gdd,dd�t�� �Udd�t�Udd�0��,and gaa,dd�t�� �Uaa�t�Udd�0�� describe fluctuations of transi-tion energy of acceptor, donor, and the correlation between
the two, respectively. gaa,ad�t�� �Uaa�t�Uad�0�� �and othersimilar terms in Eq. �20�� characterize the correlation be-tween the transition energy fluctuations of the acceptor andthe fluctuations of donor-acceptor coupling.
We first neglect diagonal fluctuations and assume thatthe off-diagonal donor-acceptor couplings are very slow�static�
gad,da = �Uad�2. �23�
Here, gaa,ad, gaa,dd, and gaa,aa vanish. Substituting this intoEqs. �19�–�22�, we get
Fad��� = �Uad�2e−iad�. �24�
This second order perturbative rate expression implies en-ergy conservation �Fermi’s golden rule in the case of thesingle acceptor state�
Kdd,aa�G� = Kaa,dd
�G� = 2��Uad�2��ad� . �25�
Note that the correlation function �17� depends on tem-perature. To include realistic bath spectral properties for off-diagonal fluctuations at finite temperature, we have to useEq. �17� instead of Eq. �23�. Neglecting diagonal fluctuationsin Eq. �20�, we get
Fad��� = Fad�0����gad,da��� = gad,da���e−iad�. �26�
Upon substituting Eq. �17� into Eq. �26� and then into rateexpression �19�, we obtain the Redfield formula19
Kaa,dd�R� = C�ad,da�ad��coth��ad/2� − 1� . �27�
The overdamped Brownian oscillator spectral density,
C�ad,da�� = 2�ad,da�
2 + �2 , �28�
is often used for describing energy transport between delo-calized exciton eigenstates, weakly perturbed by environ-ment fluctuations: � is the bath relaxation time and � is thereorganization-energy matrix.12
Next, we consider the Förster model for energy transferbetween the donor and the acceptor molecules with electro-static interactions.20 We assume that their transition energyfluctuations are independent. The intermolecular coupling isgiven by Eq. �23�. The transition energy and coupling fluc-tuations correspond to the diagonal and off-diagonal ele-ments of the lineshape functions in Eq. �19�. In this expres-sion, we only need the following elements: gaa,aa, gdd,dd, andgad,da=gda,ad; all other combinations of indices vanish. Wethen have
Fad��� = Fad�0�����Uad�2 �29�
and
Fad�0���� = exp�− iad� − gaa,aa��� − gdd,dd��� − 2i�dd,dd�� .
�30�
Substituting these relations into Eqs. �19�–�21�, we obtainthe Förster rate formula:21,22
Kad�F� = �Uad�2� d
2�Aa��Fd�� . �31�
184501-4 D. Abramavicius and S. Mukamel J. Chem. Phys. 133, 184501 �2010�

Here,
Aa�� =� d� exp�i� − �a�� − gaa,aa���� �32�
and
Fd�� =� d� exp�i� − ��d − 2�dd,dd��� − gdd,dd� ����
�33�
are the acceptor absorption and donor fluorescence line-shapes, respectively, normalized to unit area. The symmetryg���=g��−�� ensures that Aa�� and Fd�� are real.Equation �31� is commonly applied by using experimentalnormalized absorption and emission spectra, and the inter-molecular coupling is calculated using the dipole-dipolemodel between transition densities.
The electron transfer theory of Marcus23 is another spe-cial case of Eq. �19�. It is obtained by assuming a singleclassical Gaussian bath reaction coordinate and parabolic do-nor and acceptor potentials for the reaction coordinate, asshown in Fig. 2. The ground, donor, and acceptor potentialsurfaces are Ugg=wq2 /2, Udd=�d
�0�+w�q−qd�2 /2, and Uaa
=�a�0�+w�q−qa�2 /2, respectively; q is dimensionless taken to
be zero at the ground state equilibrium �other quantities aredefined by Fig. 2�. We define the donor �d=e� in Eq. �19��reorganization energy as �d��e�e�,e�e�=wqd
2 /2 and the ac-ceptor �a=e� as �a��ee,ee=wqa
2 /2. ad=�a−�d, �a=�a�0�
+�a, and �d=�d�0�+�d in Eq. �21� are defined with respect to
the ground state equilibrium q=0. These � parameters rep-resent optical absorption/emission reorganization energieswith respect to the ground state. �ee,e�e���aa,dd and gee,e�e��gaa,dd characterize the correlated donor and acceptor stateenergy fluctuations around the equilibrium of the groundstate.
Consider the fluctuations along the reaction coordinate�q in Fig. 2. The fluctuations of the ground state around theground state equilibrium �q→0� are �Ugg=0, the donor state
fluctuations are �Udd=−wqd�q, and the acceptor state �Uaa
=−wqa�q. We define the correlation functions
��Uaa�t��Uaa�0�� = w2qa2��q�t��q�0�� �34�
and
��Uaa�t��Udd�0�� = w2qaqd��q�t��q�0�� . �35�
The lineshape functions and the reorganization energies areproportional to these correlation functions, and we getgaa,aagdd,dd=gaa,dd
2 and �aa,dd���a�d.The Marcus electron transfer rate is obtained by assum-
ing Gaussian fluctuations along the reaction coordinate. Thiscorresponds to the overdamped Brownian oscillator spectraldensity �Eq. �28�� in the slow fluctuation limit24 for the di-agonal fluctuations. We then get gaa,aa�t�=kBT�at2, gdd,dd�t�=kBT�dt2, and gaa,dd�t�=kBT��a�dt2. Substituting these line-shape functions into Eq. �19�, we obtain
Fad��� = Fad�0�����Uad�2 �36�
and
Fad�0���� = exp�− iad� − kBT��M��2 − 2i���d − ��a�d�� ,
�37�
where ��M�=�a+�d−2��a�d is a reorganization energy forthe electron transfer, defined as the energy of the donor po-tential at the position of acceptor bath configuration alongthe reaction coordinate, ��M�=w�qa−qd�2 /2. Equation �19�now becomes a Gaussian integral that can be carried out,leading finally to the celebrated Marcus rate:
Kad�M� = 2��Uad�2� 1
4���M�kBT�1/2
exp�−���M� − �G�0��2
4��M�kBT� .
�38�
Here, �G�0�=�d−�a− ��d−�a� is the free energy differencebetween equilibrium positions of electron donor and acceptorpotential surfaces.
The above derivation assumes positively correlatedenergy fluctuations of the acceptor and donor states. Suchcorrelation is obtained when the equilibrium configuration ofelectron donor qd and of acceptor qa satisfies qdqa�0 �theground state potential equilibrium is at q=0�. In general, wehave ��M�=�a+�d+2���a�d, where �=1 for positivelycorrelated energy fluctuations of d and a and �=−1 foranticorrelated fluctuations.
IV. HAMILTONIAN PARAMETERS FOR THEREACTION CENTER OF PS-II
The single-exciton Hamiltonian and bath parameters forthe PS-II reaction center have been obtained using evolution-ary optimization by Novoderezhkin and Raszewski.5–7,25,26
We used the model in Ref. 6, which includes an experimen-tally determined bath spectral density. We also used addi-tional information from Refs. 5, 25, and 26.
We have simulated the energy and charge transport inthe PS-II RC core consisting of six chromophores �see Fig.3� in two branches D1 and D2. Two chlorophyll molecules,PD1 and PD2, make the special pair. Two accessory chloro-
FIG. 2. Ground state, donor, and acceptor state potentials along the reactioncoordinate. �a and �d are defined with respect to the ground state. �a=�a
−�a�0� and �d=�d−�d
�0� are optical absorption reorganization energies. �G�0�
and ��M� used in Marcus theory are defined with respect to equilibrium ofthe donor and the acceptor states.
184501-5 Energy transfer and charge separation in PS-II J. Chem. Phys. 133, 184501 �2010�

phylls, AccD1 and AccD2, and two pheophytins, PheD1 andPheD2, are in close proximity to the special pair. We neglecttwo distal chlorophyll molecules considered in Ref. 6 sincethey interact only weakly with the core and do not perturb itsexcited state dynamics. Our model includes all molecularexcitations of the 6 molecules. For CT states, we allow theelectron to reside on any of the D1 branch molecules. Thehole is allowed to reside on PD1, PD2, and AccD1. The CTstate AccD1
+ PD1− is excluded since its dipole points in the op-
posite direction to the observed electron transfer. Altogetherwe thus have 12 single-exciton states �6 molecular excita-tions and 6 CT states�. The molecular excitation energies aregiven by
�m � �emhm�HS�emhm� = tmm�1� + tmm
�2� − Wmm�c� . �39�
For the electron-hole Coulomb interaction, we take
Wmn�c� =
ke
�rm − rn� + �, �40�
where ke=e2�4���0�−1 and � is a cut-off parameter, whichrepresents screening, induced by finite charge-density distri-bution at short �down to zero� distances. We set �=1.3 for themedium dielectric constant. For chlorophyll molecules,�=9 Å was estimated from the length of the conjugated areaof Chl and Phe.
The exciton parameters obtained in Ref. 6 determine themolecular excitation energies and the one CT state energy.We have converted them to the orbital parameters of thepresent model. However, the Frenkel exciton Hamiltoniandoes not fully specify the tight-binding model: to get theelectron and hole hopping parameters and the electron andhole orbital energies, we made some additional assumptionsas outlined below.
References 5, 25, and 26 give the following primary CT�radical pair� states: RP1=AccD1
+ PheD1− and RP2=PD1
+ PheD1− .
The RP1 state energy �RP1 is estimated in Ref. 6 to be insidethe exciton band, while the energy of RP2 is not determined.According to Ref. 25, the free energy difference betweenRP1 and RP2 was estimated as 25 meV �200 cm−1�. We thustake �RP2=�RP1−200 cm−1. This information becomes suffi-cient to determine all diagonal parameters for the D1 branch.We denote the following Coulomb interaction energies:W�0�=ke�
−1 is the CT pair stabilization energy �Coulombenergy within a molecule�, WRP2
�c� =ke��RPD1−RPheD1
�+��−1
and WRP1�c� =ke��RPheD1
−RAccD1�+��−1, where RPheD1
is themass center of N atoms of PheD1 molecule and the same is
assumed for other molecules central coordinates. These areCoulomb energies between PD1 and PheD1, and PheD1 andAccD1, respectively. From Eq. �39�, we have
�RP1 = tPheD1,PheD1
�1� + tAccD1,AccD1
�2� − WRP1�c� , �41�
�RP2 = tPheD1,PheD1
�1� + tPD1,PD1
�2� − WRP2�c� . �42�
We can now relate the hole energies tAccD1,AccD1
�2� and tPD1,PD1
�2�
to tPheD1,PheD1
�1� . Using excitation transition energies of D1branch molecules P, Acc, Phe, and value of W�0�, we get allelectron and hole level energies of the D1 branch as a func-tion of tPheD1,PheD1
�1� . This parameter provides an absolute en-ergy reference point, all optical properties are given in termsof electron-hole pairs. The D2 branch energies are taken tobe the same as D1. The hole energies are obtained from themolecular exciton energies.
The off-diagonal elements tmn define the electron andhole hopping energies, which determine the couplings be-tween neutral excitations �denoted by AccD1
� � and CT states.In Ref. 6, the coupling of RP1 to an exciton state is assumedto be 35 cm−1. We let the electrons and holes hop betweenall available states. The electron and hole orbital wave func-tions vary exponentially with distance,
tmn�1� = tmn
�2� = A exp�− �rm − rn�/ � . �43�
We assumed A=350 cm−1 and =4.5 Å, which is half themolecular size �, gives AccD1
� and RP1 coupling of 34 cm−1.The resulting single-exciton Hamiltonian is given in Table I.
To determine the system-bath coupling, we start with themodel of Ref. 28, which assumes that each molecular exci-tation �and CT states� is coupled to its own independent bath,consisting of 48 high-frequency underdamped modes and asingle overdamped low-frequency mode. We extend it to ourtight-binding Hamiltonian as follows. We assume that theelectron and hole levels of different molecules fluctuate in-dependently. The spectral densities can then be written asC��11�
mm,nn��=�mnd�11�C��, C��12�mm,nn��=�mnd�12�C��,
and C��22�mm,nn��=�mnd�22�C��, where C�� is given by Eq.
�D2� of Ref. 28 and is shown in Fig. 3. By taking d�11�
=d�22�=0.8 and d�12�=−0.3, we find that all molecular exci-tation transition energies fluctuate according to C�� and allCT states have a spectral density 1.6C��.6
Equation �10� defines the double-exciton states and theirfluctuation properties are given by Eqs. �A2� and �A3�. Thedouble-exciton basis set is constructed out of the allowedelectron-hole configurations taking into account that each or-bital can only accommodate one electron �Pauli blocking�.This yields the 41 double-exciton states listed in the supple-mentary material.29
The single- and the double-exciton eigenstates were ob-tained by numerical diagonalization of the correspondingHamiltonian blocks, and the spectral densities were trans-formed to the eigenstate basis. The exciton transport andcharge transfer rates for single-exciton eigenstates were cal-culated using Eqs. �19�–�22�.
PheD2 PheD1
AccD2
PD2
PD1
AccD1
scheme
0 200 400 600 800 1000 1200 1400 1600 1800
101
102
103
104
ω / cm-1
C"(ω)/cm
-1
bath spectral density
FIG. 3. Left: the RC of PS-II. Transition dipoles are represented by arrows.Right: the bath spectral density used in the simulations �Refs. 6 and 7�.
184501-6 D. Abramavicius and S. Mukamel J. Chem. Phys. 133, 184501 �2010�

V. OPTICAL 2D SIGNALS WITH INHOMOGENEOUSBROADENING
2D optical signals represent the response of the systemto three ultrashort chronologically ordered laser pulses withwavevectors k1, k2, and k3: k1 comes first, followed by k2,and then k3. The third order signals are generated in the�k1�k2�k3 directions. The three time intervals betweenpulses, t1, t2, and t3, serve as the control parameters. Variouscontributions to the third order response function may beobserved by signals in different directions. We first considerthe photon echo kI=−k1+k2+k3. The 2D spectrum is ob-tained by performing two-dimensional Fourier transformwith respect to the first and third intervals �t1→�1 and t3
→�3; all time delays between pulses are positive� and thesecond time interval, t2, is varied as a parameter. Thisrephasing 2D signal shows correlations of single excitonsbetween absorbed, �1, and emitted, �3, energies, excitontransport takes place during t2. A different nonrephasing sig-nal is obtained along kII=k1−k2+k3 �in experiment the sig-nal direction is kept the same as in kI, but pulses 1 and 2 areinterchanged�. The 2D signal is again obtained by the Fouriertransform t1→�1 and t3→�3, respectively. Finally, we con-sider the double-quantum coherence signal in the directionkIII=k1+k2−k3. Here, the Fourier transform can be made intwo ways: either t1→�1, t2→�2, holding t3 as a parameter,or t2→�2, t3→�3, holding t1 as a parameter. In this signalthe �2 axis shows double-exciton resonances and their dis-tribution between single excitons on �1 or �3 axes.30 Thesesignals have been described in Ref. 12.
The 2D signals were calculated by summing over vari-ous system-field interaction configurations �Liouville spacepathways� in the eigenstate basis.12,31 Equations �141�–�153�,�166�, and �179� of Ref. 12 were used to calculate the timedomain third order response functions and Eq. �13� for thetime domain linear response function. We assume Gaussianpulses with 14 500 cm−1 central frequency and 20 fs fullwidth at half maximum �fwhm�. The pulse envelopes, E��,were included in the 2D signals32 by extending Eq. �42� ofRef. 12. The absorption spectrum was calculated using Eq.�268� of Ref. 12. The signals calculated this way will bedenoted homogeneous: SkI
�hom�, SkII
�hom�, and SkIII
�hom� for the 2D
signals and �A�hom� for the absorption. Uncorrelated diagonal
disorder in transition energies was included in Ref. 6 tosimulate inhomogeneous broadening �static fluctuations�.This involves numerical statistical averaging of the final sig-nal over the fluctuations. However, the protein-induced elec-trostatic fields should have long correlation distance, longerthan the intermolecular distances in the RC core. In that casethe molecular transition energies are more likely to experi-ence correlated fluctuations. For Gaussian statistics, suchfluctuations can be accounted for by a cumulant expansiontechnique with a line-broadening function g�t�=�e
2t2 /2; here,�e denotes the variance of fluctuations. For fully correlatedfluctuations of molecular transition energies, we get in theeigenstate basis for all single excitons,
gee,e�e��inh� �t� = 1
2�e2t2. �44�
For the double-exciton transitions, we then similarly getgee,f f
�inh� =2gee,e�e��inh� �t� and g
f f ,f�f��inh� =4g
ee,e�e��inh� �t�. The total third or-
der 2D time domain signal including inhomogeneous broad-ening is finally given by
SkI�t3,t2,t1� = SkI
�hom��t3,t2,t1�exp�−�e
2
2�t1 − t3�2� , �45�
SkII�t3,t2,t1� = SkII
�hom��t3,t2,t1�exp�−�e
2
2�t1 + t3�2� , �46�
SkIII�t3,t2,t1� = SkIII
�hom��t3,t2,t1�exp�−�e
2
2�t1 + 2t2 + t3�2� .
�47�
Numerical Fourier transforms were performed on the timedomain signals to get 2D spectra as described above. Theabsorption spectrum is given by
�A�� =1
�2��e� d1�A
�hom��1�exp�−�1 − �2
2�e2 � .
�48�
We used �e=51 cm−1, which gives inhomogeneous absorp-tion linewidth of 80 cm−1 fwhm.6 This approach consider-
TABLE I. Single-exciton Hamiltonian in �cm−1� calculated using 2.9 resolution structure parameters �Ref. 3� �Protein Data Bank �PDB� database file3BZ1.pdb�. The intermolecular Wmn
�f� dipole-dipole interactions were computed using transition dipole directions taken from Ref. 27 and transition amplitudes��Chl�=4.4D and ��Phe�=3.4D.
P1� P1
−P2+ P2
� Acc1−P1
+ Acc1−P2
+ Acc1� Acc2
� Phe1−P1
+ Phe1−P2
+ Phe1−Acc1
+ Phe1� Phe2
�
P1� 15 190
P1−P2
+ 63.7 19 744.7P2
� 160 63.7 15 180Acc1
−P1+ 37.8 0 0 19 083.3
Acc1−P2
+ 0 37.8 23.7 63.7 19 543.2Acc1
� 4.78 0 �39.6 37.8 23.7 15 000Acc2
� �50.4 0 17.9 0 0 15 15 130Phe1
−P1+ 11.1 0 0 34 0 0 0 14 920
Phe1−P2
+ 0 11.1 6.46 0 34 0 0 63.7 15 237.3Phe1
− Acc1+ 0 0 0 0 0 34 0 37.8 23.7 15 120
Phe1� �3.02 0 5.42 0 0 65.9 �3.09 11 6.46 34 15 050
Phe2� 4.39 0 �5.67 0 0 �2.86 60.9 0 0 0 0.65 15 060
184501-7 Energy transfer and charge separation in PS-II J. Chem. Phys. 133, 184501 �2010�

ably reduces the computational cost since explicit averagingover fluctuations is not necessary.
VI. SPECTROSCOPY OF THE CT STATES
All calculations were performed at 77 K. The simulatedabsorption spectrum of the PS-II RC shown in Fig. 4 has astrong peak at �15 000 cm−1 and a higher-energy wing at16 000 cm−1 caused by underdamped bath modes. The mainexciton band has a higher-energy shoulder reflecting adouble-peak structure of the dimeric RC special pair. It isimportant to note that the bath significantly shifts the absorp-tion peaks with respect to the vertical transitions, eg=�e.The absorption reorganization energies are �200 cm−1. Thecalculated reorganization energies for all exciton states �Eq.�22�� are shown in Fig. 4 as well. Few eigenstates have verylarge reorganization energies. These are mostly localized onthe CT states. The eigenstates with smallest reorganizationenergies are mostly Frenkel excitons. The stick spectrum,embedded in the figure, shows the reorganized energies, �e
−�ee,ee. The shoulders at 14 100 and 14 400 cm−1 are mostlyCT states, while the strongest peak is made of several over-lapping exciton bands. The spectra of PS-II RC calculatedusing the Frenkel exciton model by neglecting the CT statesshow that CT states affect the area below 15 000 cm−1. Theyamplify the peak at �14 800 cm−1 and are responsible forthe 14 100 and 14 400 cm−1 shoulders. Indeed, the peaks at14 100 and 14 400 cm−1 are absent for the Frenkel excitonmodel.
Figure 5 shows the simulated exciton population andcharge transfer dynamics according to Pauli master equationbetween 10 fs and 1 ps calculated using the rates of Eq. �19�.The figure reveals tightly coupled dynamics in the RC core:all populations redistribute within 10–500 fs. This leads tothermal equilibrium where the population accumulates in aCT state �state 6�. The final thermal equilibrium does notexactly match the Boltzmann distribution for the reorganizedenergies �e−�ee,ee since we include correlations between thediagonal and the off-diagonal fluctuations via functionsgee,ee�, which affect the transport rates. A comparison withthe Frenkel exciton model, where CT states are excluded�Fig. 5�, shows that CT states do not strongly alter the energy
relaxation time scale in the core RC. The entire complex,including CT and Frenkel excitons, participates in the chargeseparation.
We next present the 2D signals for the pulse polarizationconfiguration xxyy: k1 and k2 are y polarized, k3 and thedetector have x polarization. This is one of the three primarytensor components yielding the orientationally averaged sig-nal for an isotropic solution. The amplitude of the singleinteraction configuration is
���4 · x���3 · x���2 · y���1 · y��
= 4��4 · �3���2 · �1� − ��4 · �2���3 · �1�
− ��4 · �1���3 · �2� . �49�
We define the signal as the normalized imaginary�absorptive� parts of the calculated inhomogeneous signals,
S = 10 Im�S�/S�N�, �50�
where S�N� is a real normalization constant. All 2D spectraare then plotted using the nonlinear scale,
arcsinh�S� = ln�S + �1 + S2� �51�
which reveals both strong and weak features: for �S��1,arcsinh�S��S and arcsinh�S���S�S�−1�ln�2�S�� otherwise.The color code is shown in the figures.
The 2D kI spectra are shown in Fig. 6. The main excitonresonances appear at 14 500–15 500 cm−1, resembling theabsorption. Peaks are elongated along the diagonal due toinhomogeneous broadening. At zero delay, blue diagonalpeaks denote the fundamental exciton transitions. Only onediagonal peak can be clearly resolved. The 14 100 cm−1
peak represents the primary CT state since it is not present inthe corresponding simulations without CT states �middle col-umn�. The broad high-energy �16 000 cm−1 wing does notappear on the diagonal of the 2D spectrum, but it is mappedon the off-diagonal cross-peak regions along �1 and �3.
In the right column of Fig. 6 we display the correspond-ing 2D difference spectrum of the full model and the Frenkelexciton model normalized to its maximum. CT states
CT CT CT
CT
FIG. 4. Left: simulated absorption spectra of PS-II RC core at 77 K. Solidblack—full model; dotted black—model without CT states. Red curve—square root of pulse power spectrum E�� used in nonlinear optical signalsimulations. Vertical lines denote positions of single excitons after reorga-nization. Contributions of CT states to these eigenstates �from left to right�are 0.94, 0.98, 0.63, 0.07, 0.35, 0, 0.03, 0, and 0. Right: the single-excitoneigenstates below 18 000 cm−1 and their reorganization shifts; three addi-tional dark CT states at �19 000 cm−1 are not shown. Exciton eigenener-gies, �e, and reorganization-energy shifts, �e−�ee,ee, are shown.
10 100 10000
0.5
1
1.5
2
t / fs
123456789
10 100 1000
t / fs
no CT states
popu
latio
ns
FIG. 5. Exciton population dynamics when all states are initially equallypopulated, ee=1 �the three high-energy, �19 000 cm−1 CT states are notshown�. The states are numbered by their energy �e; color code is the sameas in Fig. 4.
184501-8 D. Abramavicius and S. Mukamel J. Chem. Phys. 133, 184501 �2010�

strongly influence the exciton band as seen at 0 fs delay. Atlater times, the different relaxation results in a vertical peakdistribution. The positive peaks at the diagonal around15 000 cm−1 show that in the Frenkel model the energy re-mains in this area at long time. In the full model, the energyis transferred to lower-lying CT states below the diagonal��3�14 000 cm−1�.
We mark three regions on the diagonal �A–C� and onecross-peak region �B-C�. These correspond to the two exci-ton bands and the CT state. In Fig. 7 we show the timeevolution of these regions. The diagonal regions grow stron-ger. Peaks A and B change most strongly on an absolutescale. However, the relative change of these areas with re-spect to their initial amplitudes is different: A changes by30%, B changes by 24% and C changes by 146%. All peaksdo grow and the internal redistribution of energy between theregions is as follows: A and B �Frenkel exciton bands� decayinto C �CT exciton�. The absolute peak growth is related tothe pulse-envelope since the pulse is centered at14 500 cm−1. The CT peak C is poorly resolved on the di-agonal, similar to the absorption. The dynamics in the B-Ccross-peak region is a significantly new feature not availablefrom linear optical techniques, which reveals the charge-separation process.
To trace the origin of the 2D peaks, in Fig. 8 we plotseparately the three contributions: ground state bleaching�GSB�, excited state emission �ESE�, and excited state ab-
sorption �ESA�. The corresponding Feynman diagrams areshown on the right. ESE is much weaker than the GSB orESA. This is because the absorption and emission frequen-cies are different due to the Stokes shift induced by under-
14
15
16
14
15
16
500 fs
1 ps
14 15 16 14 15 16
50 fs
0 fs
1 ps
500 fs
50 fs
0 fs No CT states
No CT states
No CT states
No CT states
14
15
16
14
15
16
-Ω1 / 103 cm-1
Ω3/1
03cm
-1
AB
C B-C
14 15 16
1 psDiff
500 fsDiff
50 fsDiff
0 fsDiff
0.40.20-0.2-0.4 1.0-1.0
FIG. 6. 2D photon echo �rephasing� signal. Left—full model, middle—Frenkel model �no CT states�, and right—the difference. Each plot is scaledaccording to Eq. �51� and normalized �Eq. �50�� as follows: for left andmiddle columns, S�N� is the maximum at zero delay time; for the rightcolumn, S�N� is the maximum of each signal.
0 100 200 300 400 500
0
ABCB-C
t2 / fs
FIG. 7. Time dependence of integrated amplitudes in regions A–C and theircross-peaks �marked by squares in Fig. 6�. The traces are shifted verticallyto make the initial amplitude 0.
GSB
ESE
ESA
0 fs 500 fs
14
15
16
14
15
16
Ω3/1
03cm
-1
-Ω1 / 103 cm-1
14 15 16 14 15 16
x0.63
x0.12
x0.75
x0.11
GSB
ESE
ESA
14
15
16
14
15
16
total total 0.40.2
0
-0.2-0.4
1.0
-1.0
FIG. 8. The three components contributing to the 2D kI spectra at two t2
delay times. The amplitudes of the ESE and ESA components have beenmultiplied by the factors given in each panel. The signal is scaled accordingto Eq. �51� and S�N� �Eq. �50�� is the maximum of each plot.
184501-9 Energy transfer and charge separation in PS-II J. Chem. Phys. 133, 184501 �2010�
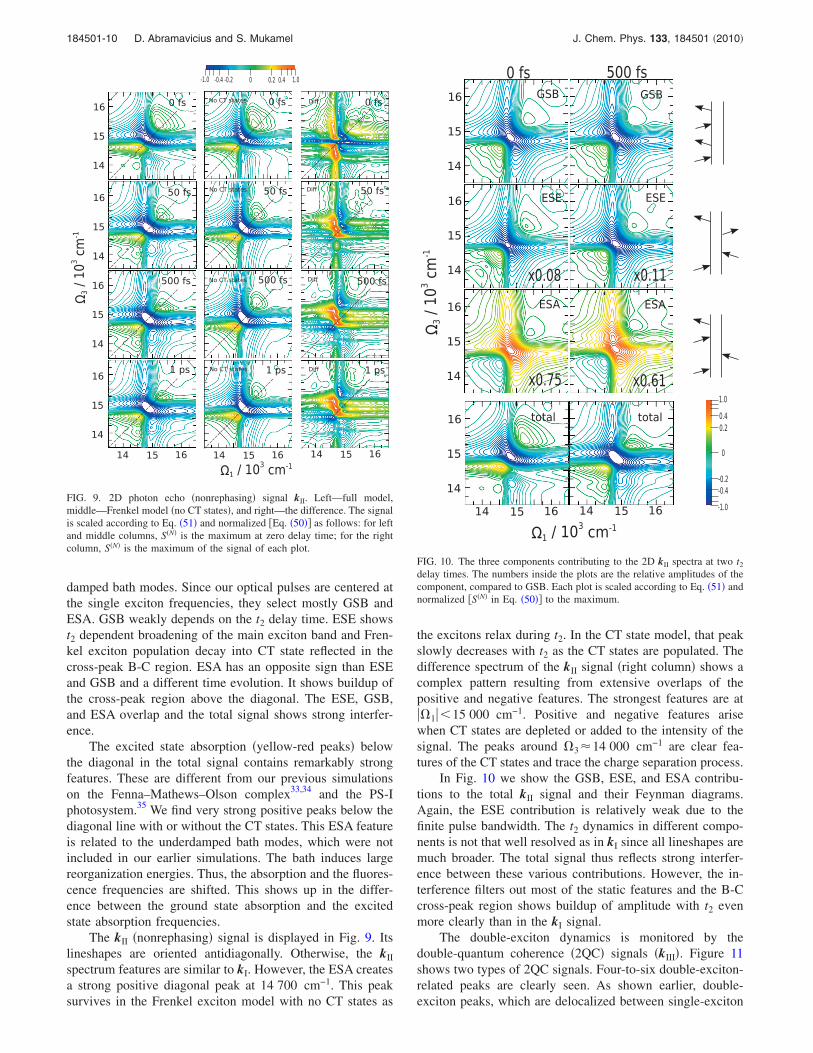
damped bath modes. Since our optical pulses are centered atthe single exciton frequencies, they select mostly GSB andESA. GSB weakly depends on the t2 delay time. ESE showst2 dependent broadening of the main exciton band and Fren-kel exciton population decay into CT state reflected in thecross-peak B-C region. ESA has an opposite sign than ESEand GSB and a different time evolution. It shows buildup ofthe cross-peak region above the diagonal. The ESE, GSB,and ESA overlap and the total signal shows strong interfer-ence.
The excited state absorption �yellow-red peaks� belowthe diagonal in the total signal contains remarkably strongfeatures. These are different from our previous simulationson the Fenna–Mathews–Olson complex33,34 and the PS-Iphotosystem.35 We find very strong positive peaks below thediagonal line with or without the CT states. This ESA featureis related to the underdamped bath modes, which were notincluded in our earlier simulations. The bath induces largereorganization energies. Thus, the absorption and the fluores-cence frequencies are shifted. This shows up in the differ-ence between the ground state absorption and the excitedstate absorption frequencies.
The kII �nonrephasing� signal is displayed in Fig. 9. Itslineshapes are oriented antidiagonally. Otherwise, the kII
spectrum features are similar to kI. However, the ESA createsa strong positive diagonal peak at 14 700 cm−1. This peaksurvives in the Frenkel exciton model with no CT states as
the excitons relax during t2. In the CT state model, that peakslowly decreases with t2 as the CT states are populated. Thedifference spectrum of the kII signal �right column� shows acomplex pattern resulting from extensive overlaps of thepositive and negative features. The strongest features are at��1��15 000 cm−1. Positive and negative features arisewhen CT states are depleted or added to the intensity of thesignal. The peaks around �3�14 000 cm−1 are clear fea-tures of the CT states and trace the charge separation process.
In Fig. 10 we show the GSB, ESE, and ESA contribu-tions to the total kII signal and their Feynman diagrams.Again, the ESE contribution is relatively weak due to thefinite pulse bandwidth. The t2 dynamics in different compo-nents is not that well resolved as in kI since all lineshapes aremuch broader. The total signal thus reflects strong interfer-ence between these various contributions. However, the in-terference filters out most of the static features and the B-Ccross-peak region shows buildup of amplitude with t2 evenmore clearly than in the kI signal.
The double-exciton dynamics is monitored by thedouble-quantum coherence �2QC� signals �kIII�. Figure 11shows two types of 2QC signals. Four-to-six double-exciton-related peaks are clearly seen. As shown earlier, double-exciton peaks, which are delocalized between single-exciton
14
15
16
14
15
16
500 fs
1 ps
14 15 16 14 15 16
50 fs
0 fs
1 ps
500 fs
50 fs
0 fs No CT states
No CT states
No CT states
No CT states
14
15
16
14
15
16
Ω3/1
03cm
-1
Ω1 / 103 cm-1
14 15 16
1 psDiff
500 fsDiff
50 fsDiff
0 fsDiff
0.40.20-0.2-0.4 1.0-1.0
FIG. 9. 2D photon echo �nonrephasing� signal kII. Left—full model,middle—Frenkel model �no CT states�, and right—the difference. The signalis scaled according to Eq. �51� and normalized �Eq. �50�� as follows: for leftand middle columns, S�N� is the maximum at zero delay time; for the rightcolumn, S�N� is the maximum of the signal of each plot.
GSB
ESE
ESA
0 fs 500 fs
14
15
16
14
15
16
Ω3/1
03cm
-1
Ω1 / 103 cm-1
14 15 16 14 15 16
x0.61
x0.11
x0.75
x0.08
GSB
ESE
ESA
14
15
16
14
15
16
total total 0.40.2
0
-0.2-0.4
1.0
-1.0
FIG. 10. The three components contributing to the 2D kII spectra at two t2
delay times. The numbers inside the plots are the relative amplitudes of thecomponent, compared to GSB. Each plot is scaled according to Eq. �51� andnormalized �S�N� in Eq. �50�� to the maximum.
184501-10 D. Abramavicius and S. Mukamel J. Chem. Phys. 133, 184501 �2010�

product states dominate the 2D spectra30 since the underlyingsystem is made of two-level molecules. The CT states do notchange this picture since they have no transition dipole mo-ment. The strongest peaks lie within the main exciton bandclose to the dashed line, which marks �2=2�1 or �2=2�3.CT states again show up in the �1 ,�2 plot as additionalpeaks especially at �1=14 100 cm−1. Signatures of CTstates in the �2 ,�3 plot are less visible. The difference spec-trum shows the sensitivity of the spectrum to the CT statesand helps determine the specific peaks related to the CTstates: they span the whole exciton band and may not beisolated opposite from kI and kII.
In Fig. 12 we display the two pathways contributing tothe 2D peaks in kIII and their Feynman diagrams. Again, thetotal signal contains positive and negative contributions withextensive overlap. The most prominent peaks show up in themain Frenkel exciton area ��1=14 500–15 000 cm−1�, indi-cating that double excitons in this region are highly delocal-ized between the Frenkel excitons and the CT states.
VII. SUMMARY AND DISCUSSION
In this paper, we have simulated three third order two-dimensional spectra of the PS-II RC core complex. Thesecover all possible exciton density matrix evolution pathways,induced by three weak laser pulses. The simulated 2D signalsshow clear signatures of charge transfer. These are usuallyweak in absorption since CT eigenstates only borrow oscil-lator strength from molecular excitations. However, thecross-peaks are amplified in the 2D spectra by other strongdiagonal peaks, making CT transitions easy to resolve. TheCT cross-peak amplitudes allow one to monitor the charge-separation process and its time scale, and may help identifythe primary CT state configuration when comparing to ex-periments. The double-quantum-coherence signal contains a
complex pattern of interfering contributions. It shows strongcouplings inside the core of RC of the PS-II through delo-calization of double-exciton eigenstates.
Several novel theoretical developments were used in thesimulations. First, we have incorporated charge transferstates into the molecular complex model. Frenkel excitons,CT states, their couplings, and the double-exciton manifoldare defined microscopically. The tight-binding model re-quires more information about the system than contained inthe Frenkel exciton model. These parameters include mo-lecular HOMO and LUMO wave functions and the corre-sponding charge distributions. These may be readily obtainedfrom ab initio simulations. Here, we compiled the parameterset using previous model simulations.
The second important feature is the interplay of under-damped and overdamped bath modes. This has been usedpreviously in the modeling of linear optical signals and trans-port rates. The effect of one underdamped vibrational modeof a two-level electronic system in 2D spectroscopy has beenanalyzed.36 However, how the underdamped bath vibrationsaffect the 2D optical signals of an excitonic aggregate is anopen question. We find that absorption bands coming fromvibrational high-energy transitions affect the off-diagonal�cross-peak� regions and do not appear on the diagonal. Thisis interesting since it allows one to determine the origin ofoptical absorption transitions: electronic transitions appearon the diagonal in the 2D spectra, while additional vibra-tional bands appear on the off-diagonal region.
Previous studies accounted for the inhomogeneousbroadening by using uncorrelated diagonal disorder. This ap-proach is very well suited for extended molecular aggregatesin solutions. The protein environment is the main cause ofstatic inhomogeneities in photosynthetic aggregates. How-ever, since proteins extend over distances longer than thedistances within pigment molecules in the RC core, all inho-
14 15 16 14 15 16
28
30
32 t3=10 fs t3=10 fs
No CT states
28
30
32
14 15 16 14 15 16
No CT states
t1=0 t1=0
Ω3 / 103 cm-1
Ω1 / 103 cm-1
Ω2/1
03cm
-1Ω
2/1
03cm
-1
14 15 16
Diff
14 15 16
Diff
t3=10 fs
t1=0
0.40.20-0.2-0.4 1.0-1.0
FIG. 11. 2D double-quantum-coherence signals. Left—full model, middle—Frenkel exciton model �no CT states�, and right—the difference. Each plot isscaled according to Eq. �51� and normalized �S�N� in Eq. �50�� to themaximum.
28
30
32 t3=10 fs
28
30
32 t1=0
Ω3 / 103 cm-1
14 15 16 14 15 16 14 15 16
14 15 16 14 15 16 14 15 16Ω1 / 10
3 cm-1
Ω2/1
03cm
-1Ω
2/1
03cm
-1
total
total
0.40.20-0.2-0.4 1.0-1.0
t3=10 fs
t1=0
FIG. 12. The two pathways of the kIII signals and their corresponding Feyn-man diagrams. Each plot is scaled according to Eq. �51� and normalized�S�N� in Eq. �50�� to the maximum.
184501-11 Energy transfer and charge separation in PS-II J. Chem. Phys. 133, 184501 �2010�

mogeneities are expected to show some degree of correla-tion. Here, we assumed completely correlated fluctuations,where static energy shifts of all molecules are identical.Energy gaps between different excitons in the same band arenot affected by such shifts. This model therefore does notaffect intraband exciton dephasing and transport rates.
The applicability of uncorrelated vs. correlated disordermodels depends on the system under consideration. Forsmall compact aggregates embedded in large proteins, thecorrelated disorder model may be applicable. For a largebulk system, we expect the uncorrelated disorder model tohold. However, more advanced models should define the cor-relation distance so that the degree of correlation depends onhow far are the molecules from each other, as was done inRefs. 37 and 38. Determining the correlation distance in ex-citonic aggregates is an interesting topic for future studies.
In the case of fully correlated Gaussian diagonal disor-der, the compact time-domain expressions �Eqs. �45�–�47��apply. This approach avoids the explicit ensemble averag-ings. Our simulated features in 2D signals show typical di-agonally elongated peak shapes, which signify inhomoge-neous broadening. The spectral dynamics with the third, t2,axis is not affected by the correlated disorder.
It is important to note that a homogeneous peak mayshow elongations in 2D plots as well. This happens since theshape of an absorptive part of the peak, made of two Lorent-zians �one along one axis and the other along the other axis�,has single sign in one diagonal direction and it shows twosign flips across that diagonal. However, the absolute valuesignal �Re2+Im2� has a symmetric crosslike feature, which
has no elongation along the diagonal. Inhomogeneities in-duce additional diagonal elongation, which is larger than theelongation of the homogeneous signal, when the inhomoge-neous broadening is large. Our simulations �not shown� re-veal that the inhomogeneities-induced elongation shows upeven in the absolute value plot.
ACKNOWLEDGMENTS
The support of the National Science Foundation GrantNo. CHE0745892 and Grant No. DARPA BAA-10-40QUBE is gratefully acknowledged.
APPENDIX: TRANSFORMATION OF THE SPECTRALDENSITIES
Here, we provide expressions that transform the spectraldensities defined in Eqs. �13�–�15� into the eigenstates basisand connect local energy correlations to correlations of thefluctuations of exciton eigenstates.
For the single-exciton manifold, we have
C�e4e3,e2e1�� = �
mn�kl
�mn,e4
� �mn,e3�kl,e2
� �kl,e1
� �C��11�mm,kk�� + C��12�
mm,ll��
+ C��12�kk,nn�� + C��22�
nn,ll��� . �A1�
Fluctuations of the eigenstate transition energies,C�ee,e�e�
��, cause pure dephasing, and the induced fluctua-tions of couplings, C�ee�,e�e��, are responsible for energyand charge transport. The correlated single and double-exciton fluctuations are
C�e1e2,f1f2�� = �
m1n1
�m2n2
m2�n2
�k2l2
k2�l2
�m1n1,e1
� �m1n1,e2�m2n2��k2l2�,f1
� �m2n2��k2l2�,f2�C��11�
m1m1,m2m2�� + C��12�
m1m1,n2n2��
+ C��11�m1m1,k2k2
�� + C��12�m1m1,l2l2
�� + C��12�m2m2,n1n1
�� + C��22�n1n1,n2n2
�� + C��12�k2k2,n1n1
��
+ C��22�n1n1,l2l2
��� . �A2�
Finally, the double-exciton fluctuations are given by
C�f4f3,f2f1�� = �
m1n1
m1�n1
�k1l1
k1�l1
�m2n2
m2�n2
�k2l2
k2�l2
�m1n1��k1l1�,f4
� �m1n1��k1l1�,f3�m2n2��k2l2�,f2
� �m2n2��k2l2�,f1�C��11�
m1m1,m2m2��
+ C��12�m1m1,n2n2
�� + C��11�m1m1,k2k2
�� + C��12�m1m1,l2l2
�� + C��12�m2m2,n1n1
�� + C��22�n1n1,n2n2
��
+ C��12�k2k2n1n1
�� + C��22�n1n1,l2l2
�� + C��11�k1k1,m2m2
�� + C��12�k1k1,n2n2
�� + C��11�k1k1,k2k2
��
+ C��12�k1k1,l2l2
�� + C��12�m2m2,l1l1
�� + C��22�l1l1,n2n2
�� + C��12�k2k2,l1l1
�� + C��22�l1l1,l2l2
��� . �A3�
184501-12 D. Abramavicius and S. Mukamel J. Chem. Phys. 133, 184501 �2010�

1 R. E. Blankenship, Molecular Mechanisms of Photosynthesis �BlackwellScience Ltd, Oxford, 2002�.
2 G. Renger and T. Renger, Photosynth. Res. 98, 53 �2008�.3 A. Guskov, J. Kern, A. Gabdulkhakov, B. M. A. Zouni, and W. Saenger,Nat. Struct. Mol. Biol. 16, 334 �2009�.
4 H. van Amerogen, L. Valkunas, and R. van Grondelle, PhotosyntheticExcitons �World Scientific, Singapore, 2000�.
5 G. Raszewski, B. A. Diner, E. Schlodder, and T. Renger, Biophys. J. 95,105 �2008�.
6 V. Novoderezhkin, J. Dekker, H. van Amerongen, and R. van Grondelle,Biophys. J. 93, 1293 �2007�.
7 V. I. Novoderezhkin, M. A. Palacios, H. van Amerongen, and R. vanGrondelle, J. Phys. Chem. B 109, 10493 �2005�.
8 W. M. Zhang, T. Meier, V. Chernyak, and S. Mukamel, J. Chem. Phys.108, 7763 �1998�.
9 T. van Voorhis, T. Kowalczyk, B. Kaduk, L.-P. Wang, C.-L. Cheng, andQ. Wu, Annu. Rev. Phys. Chem. 61, 149 �2010�.
10 H. Haug and S. W. Koch, Quantum Theory of the Optical and ElectronicProperties of Semiconductors, 4th ed. �World Scientific, Singapore,2004�.
11 T. Meier, P. Thomas, and S. W. Koch, Coherent Semiconductor Optics:From Basic Concepts to Nanostructure Applications �Springer, Berlin,Heidelberg, 2006�.
12 D. Abramavicius, B. Palmieri, D. V. Voronine, F. Šanda, and S. Mukamel,Chem. Rev. �Washington, D.C.� 109, 2350 �2009�.
13 N. G. van Kampen, Stochastic Processes in Physics and Chemistry, 3rded. �Elsevier, Amsterdam, 2007�.
14 T. Renger, Phys. Rev. Lett. 93, 188101 �2004�.15 T. Mancal, L. Valkunas, and G. R. Fleming, Chem. Phys. Lett. 432, 301
�2006�.16 E. Collini and G. D. Scholes, Science 323, 369 �2009�.17 B. Palmieri, D. Abramavicius, and S. Mukamel, J. Chem. Phys. 130,
204512 �2009�.
18 D. Abramavicius and S. Mukamel, J. Chem. Phys. 133, 064510 �2010�.19 A. G. Redfield, IBM J. Res. Dev. 1, 19 �1957�.20 T. Förster, Annalen der Physik. 437, 55 �1948�.21 M. Yang and G. R. Fleming, Chem. Phys. 282, 163 �2002�.22 S. Mukamel and V. Rupasov, Chem. Phys. Lett. 242, 17 �1995�.23 R. A. Marcus, J. Phys. Chem. 67, 853 �1963�.24 S. Mukamel, Principles of Nonlinear Optical Spectroscopy �Oxford Uni-
versity Press, New York, 1995�.25 G. Raszewski and T. Renger, J. Am. Chem. Soc. 130, 4431 �2008�.26 G. Raszewski, W. Saenger, and T. Renger, Biophys. J. 88, 986 �2005�.27 R. Simonetto, M. Crimi, D. Sandonà, R. Croce, G. Cinque, J. Breton, and
R. Bassi, Biochemistry 38, 12974 �1999�.28 V. I. Novoderezhkin, E. G. Andrizhiyevskaya, J. P. Dekker, and R. van
Grondelle, Biophys. J. 89, 1464 �2005�.29 See supplementary material at http://dx.doi.org/10.1063/1.3493580 for
the full list of the double-exciton states in molecular basis set.30 D. Abramavicius, D. V. Voronine, and S. Mukamel, Proc. Natl. Acad. Sci.
U.S.A. 105, 8525 �2008�.31 D. Abramavicius, L. Valkunas, and S. Mukamel, Europhys. Lett. 80,
17005 �2007�.32 I. V. Schweigert and S. Mukamel, Phys. Rev. A 77, 033802 �2008�.33 D. Abramavicius, D. V. Voronine, and S. Mukamel, Biophys. J. 94, 3613
�2008�.34 D. Abramavicius, B. Palmieri, and S. Mukamel, Chem. Phys. 357, 79
�2009�.35 D. Abramavicius and S. Mukamel, J. Phys. Chem. B 113, 6097 �2009�.36 T. Mančal, A. Nemeth, F. Milota, V. Lukeš, H. F. Kauffmann, and J.
Sperling, J. Chem. Phys. 132, 184515 �2010�.37 D. Abramavicius and L. Valkunas, Phys. Rev. B 68, 245203 �2003�.38 D. Abramavicius, L. Valkunas, and R. van Grondelle, Phys. Chem.
Chem. Phys. 6, 3097 �2004�.
184501-13 Energy transfer and charge separation in PS-II J. Chem. Phys. 133, 184501 �2010�


![SMS - GuruRaghavendra.orggsmag/pdf/Chaitra.pdf · 56 + ! 3˚ ! 4 .$ +˚ * W! X Y"?AˆZ Cˆ 3 ˘˚9˘˚ [Cˆ ˘˚$ ˚ [˚ ˜ ˆ ˜! ˜ " #$ JFJ/K q˝!ˆ˛ ˚; Kv>r - ! ]:w ˛!&](https://img.dokumen.tips/doc/110x75/5f91c54d67c10e5ba329e1cc/sms-gsmagpdfchaitrapdf-56-3-4-w-x-yaz-c-3-9.jpg)


