Embed Size (px)
Citation preview

Nottingham City Council
EnergyStrategy2010-2020April 2010
page | 2
Contents Page
1. Foreword ...................................................................................................... 3
2. Executive summary .................................................................................... 5
3. Introduction ................................................................................................. 83.1. Purpose of the Sustainable Energy Strategy3.2. Nottingham’s achievements3.3. National and local energy generation targets3.4. Social and environmental effects of energy use
3.4.1. Peak oil and energy security3.4.2. Fuel poverty and energy costs3.4.3. Climate change mitigation3.4.4. Climate change adaptation
4. Vision and objectives for energy in Nottingham ....................................... 234.1. Energy vision for Nottingham4.2. Scope of the Strategy4.3. Aims and objectives of the Strategy4.4. Strategic priorities4.5. Achieving the aims and delivering the
objectives
5. Energy supply and use in Nottingham ....................................................... 665.1. Historical context, current energy
use and generation patterns
6. Financing the strategy ................................................................................. 74
7. Communication, monitoring& review ..........................................................................................................76 76
8. References and further reading ................................................................... 77
9. Contributors credits ..................................................................................... 81

page | 3
1. Foreword by Councillors Graham Chapman andKatrina Bull
This Strategy and the associated Action Plan identifies the keytechnologies and programmes required to enable Nottingham toplay its part in meeting the national and local targets on carbonreduction and low or zero carbon energy generation. The Strategysets the headline targets and key strategic priorities; the Action Plandetails how the City can meet these targets. Implementation of theStrategy will accelerate Nottingham’s development as the UK’sleading City in low carbon energy security.
It is clear that rising energy and carbon costs over the coming years will create significant risksand significant opportunities in Nottingham. As energy prices rise there will also be secondaryimpacts with regards to the cost of food, goods and services, inflation, and potentially localeconomic activity.
Conversely, there is also the potential togenerate revenue, economic activity andjobs from investment in, and delivery of,sustainable energy generation, fuelsupply, low carbon infrastructure,technology supply chains and energyservices.
Significant and sustained investment willbe required to achieve the Government’s2020 and 2050 carbon reduction targetsand ensure the City’s public services,households and economy are protectedfrom the expected energy price inflationof the coming decade.
Investment will be required across all sectors and in all areas of energy use, generation andsupply to ensure the necessary improvements in energy efficiency and use of renewables.
As well as increasing energy efficiency and energy generation through the use of technology, wealso need positive, practical community wide behaviour change and educational initiatives. Weneed to support community initiatives wherever possible.
In addressing energy supply and consumption issues, the City will reduce carbon emissions andthe impact of fuel poverty. The City has the opportunity to create an energy environment thatprotects key services, the economy and households from the impacts of declining energysecurity, rising costs and some inevitable climate change, while meeting carbon reductiontargets.

page | 4
Through adopting a robust Energy Strategy that follows the national Low Carbon TransitionStrategy, Nottingham will provide a stable, low carbon energy environment and an attractiveplace in which to live and do business even in challenging times.
The Strategy also underpins the City’s developing profile to attract and support businesses in theemerging low carbon sector with a focus on low carbon building and construction.
For more than a 100 years social and economic development has been set against a backgroundof cheap energy, underpinned by abundant crude oil and natural gas; this is not the world inwhich we will be operating in future years. Nottingham recognises the major challenge ahead.The aim of the Energy Strategy is to ensure sustained investment of time and money into energysaving and generation measures, to avoid major repercussions for households, businesses andservices.
“The challenge is not the technical feasibility of a low-carbon economy but making it happen.Ensuring action will require strong leadership from government and a concerted response fromindividuals and businesses”1.
Nottingham as a City is starting the low carbon transition from aleading position. If any city in the UK can meet its part of the Government’s national
targets, it is Nottingham, but there is still a very long way to go. Nottingham is howeverexceptionally well placed to remain the UK’s most energyself-sufficient city.
Cllr Graham Chapman Cllr Katrina Bull
1 CCC, 2009. Available at: http://www.theccc.org.uk/

page | 5
2. Executive Summary
This Strategy provides an overarching framework for the City’splans, programmes and initiatives relating to sustainable energysupply and use to 2020: cutting emissions, maintaining energysecurity, maximising economic opportunities, and protecting themost vulnerable. The Strategy and the associated action plan willensure that Nottingham accelerates the development, use and valueof its energy resource and energy efficiency potential.
The Strategy responds to a number of key drivers; climate change, peak oil and energy security.These drivers are recognised locally and nationally through policies and challenging targets thatneed to be delivered within given timescales.
Targets
The Action Plan prioritises the delivery of:• A 26% reduction of carbon dioxide emissions against 2005 levels,• 20% of the City’s own energy generated from low or zero carbon sourcesby the target date of 2020, as set out in the local Sustainable Community Strategy2.
At a national level the Government’s Low Carbon Transition Plan3 and Renewable EnergyStrategy4 in particular provide very challenging targets. The Strategy details how we will meet ourproportional ‘pro rata per capita’ contribution to the national Renewable Energy Strategy targets,which is estimated in the City at:• 2% (37GWh) generation from small scale sources• 12% (342.7GWh) generation from renewable heat sources
Nottingham’s Current Status
Nottingham is starting the low carbon transition from the front, with a considerable lead.Between 2003 and 2006 the City reduced domestic gas consumption by 16%; the greatest fall ofall Local Authorities in the East Midlands and of all the Core Cities.
In 2006 we generated 3% of our own heat and power from renewables and waste, makingNottingham the most energy self-sufficient City in the UK.
2 City of Nottingham Sustainable Community Strategy 2020, Strategic Objective 2, 2020 Headline Targets (page 21).Available at: http://www.nottinghamcity.gov.uk/onenottingham/CHttpHandler.ashx?id=10663&p=03 The UK Low Carbon Transition Plan (2009). Available at:http://www.decc.gov.uk/en/content/cms/publications/lc_trans_plan/lc_trans_plan.aspx4 The UK Renewable Energy Strategy (2009). Available at:http://www.decc.gov.uk/en/content/cms/publications/lc_trans_plan/lc_trans_plan.aspx

page | 6
We also generated 11.45% of our own heat and power from gas CHP (combined heat and power)and renewables. Nottingham is the leading City in the country in distributed energy generation.Generation of 11.45% of our own energy from low or zero carbon sources, against the 20%Sustainable Communities Strategy target is a remarkable achievement and a very strong startingpoint for the challenge ahead.
Key Actions
To meet the national and local targets for heat and power will be very challenging, even givenNottingham’s leading position. This will require the development of all the City’s major renewableand low carbon energy resources from large scale biomass to a rapid increase in the uptake ofdomestic renewable energy systems.
Figure 1: Total targets for energy generation from Low or Zero Carbon sources – including gas CHP
The Action Plan alongside in the Energy Strategy represents a detailed map to achieve our localand national 2020 targets. National targets for small scale electricity generation and renewableheat steer us towards biomass fuel and renewable electricity generation.
In particular, to meet national and local targets for heat and power will require;• More than doubling the size of the City district heating network• Development of a local biomass processing and transfer site• Significant capacity of new biomass CHP plant with associated district heating• Consideration of a City anaerobic digester.
page | 7
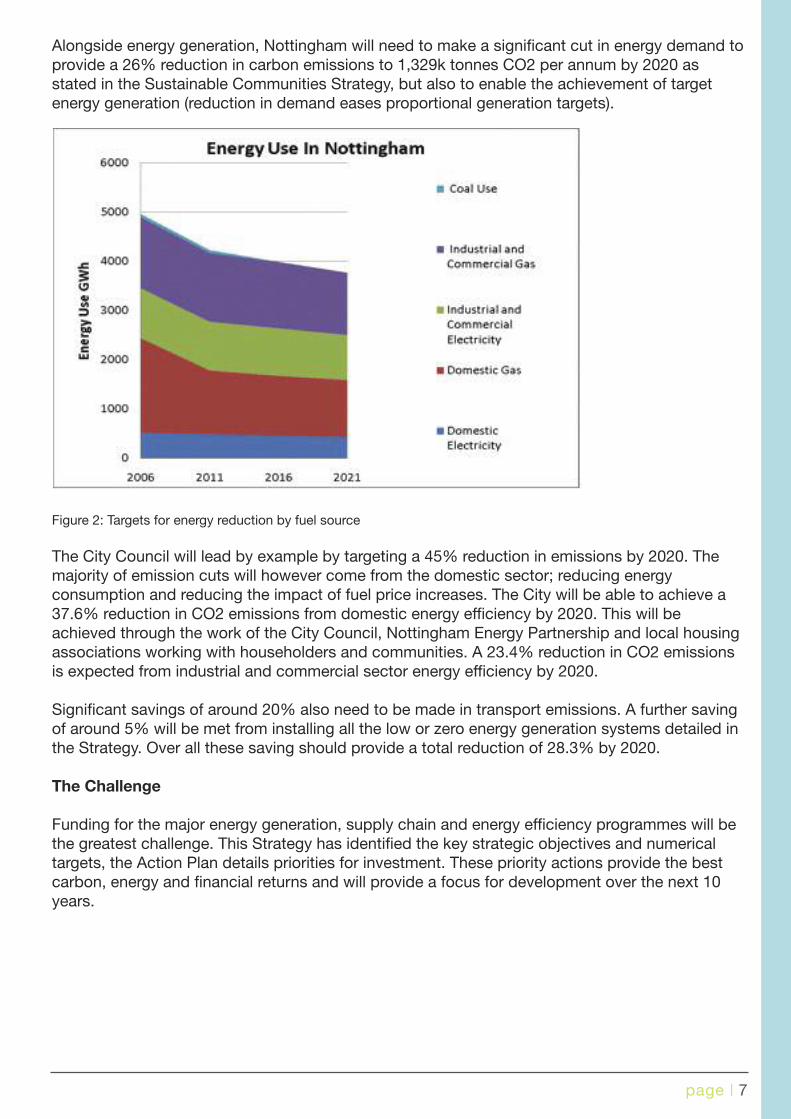
Alongside energy generation, Nottingham will need to make a significant cut in energy demand toprovide a 26% reduction in carbon emissions to 1,329k tonnes CO2 per annum by 2020 asstated in the Sustainable Communities Strategy, but also to enable the achievement of targetenergy generation (reduction in demand eases proportional generation targets).
Figure 2: Targets for energy reduction by fuel source
The City Council will lead by example by targeting a 45% reduction in emissions by 2020. Themajority of emission cuts will however come from the domestic sector; reducing energyconsumption and reducing the impact of fuel price increases. The City will be able to achieve a37.6% reduction in CO2 emissions from domestic energy efficiency by 2020. This will beachieved through the work of the City Council, Nottingham Energy Partnership and local housingassociations working with householders and communities. A 23.4% reduction in CO2 emissionsis expected from industrial and commercial sector energy efficiency by 2020.
Significant savings of around 20% also need to be made in transport emissions. A further savingof around 5% will be met from installing all the low or zero energy generation systems detailed inthe Strategy. Over all these saving should provide a total reduction of 28.3% by 2020.
The Challenge
Funding for the major energy generation, supply chain and energy efficiency programmes will bethe greatest challenge. This Strategy has identified the key strategic objectives and numericaltargets, the Action Plan details priorities for investment. These priority actions provide the bestcarbon, energy and financial returns and will provide a focus for development over the next 10years.

page | 8
3. Introduction
3.1. Purpose of the Sustainable Energy Strategy
National policy, strategy and targets on energy supply and low carbon transition have alladvanced rapidly in the last 12 months5. There has been a step change in policies relating tocarbon reduction and energy security. This has been underpinned by the interdependent issuesof climate change, power supply security and peak oil. There is now a small window ofopportunity to meet the parallel global challenges of avoiding dangerous climate change,preparing for peak oil and, against the national picture of potential power supply insecuritytowards 2017, ensuring continuity of affordable energy supply in Nottingham.
Nottingham City Council is the only Local Authority in the UK to have adopted a motionrecognising the need to respond to the forthcoming impact of Peak Oil6. The City is well placedto take fast decisive action at local authority level to protect citizens, whilst ensuring that wecontinue to reduce our carbon emissions.
The City Council has also recently adopted, though the Sustainable Communities Strategy, twochallenging 2020 targets:
• 20% of energy used to be produced within the Greater Nottingham area from renewable orlow/zero carbon sources7;
• 26% reduction in CO2 emissions to 1,329k Tonnes CO2 per annum by 20208.
The Energy Strategy details how the City can meet these 2 targets.
Nottingham is also signed up to the European Covenant of Mayors9 which requires the city tohave a sustainable energy strategy and action plan by the end of 2009.
5 In July 2009, the Department for Energy and Climate Change (DECC) published the UK Low Carbon TransitionPlan. This comprehensive plan sets out how the country will meet the cut in emissions set out in the 2009Budget of 34% on 1990 levels by 2020. It aims to plot the UK’s move onto a permanent low carbon footing andto maximise economic opportunities, growth and jobs along the way. Alongside this and on the same date,DECC published the national Renewable Energy Strategy which maps out how the Government will deliver theUK’s target of getting 15% of all energy (electricity, heat and transport) from renewables by 2020, and theDepartment for Transport (DfT) published the Low Carbon Transport Plan which sets out how to reduce carbonemissions from domestic transport by up to 14% over the next decade. All of these key documents areavailable at: http://www.decc.gov.uk/en/content/cms/publications/lc_trans_plan/lc_trans_plan.aspx
6 Nottingham City Council (NCC) (2008). Motion in the name of Councillor Bull – Forthcoming impact of Peak Oil.Internal minutes of the meeting of the Nottingham City Council, held at the Council House, Nottingham, onMonday 8th December 2008 at 3:15pm, pages 141-143.
7 City of Nottingham Sustainable Community Strategy 2020, Strategic Objective 2, 2020 Headline Targets (page21). Available at: http://www.nottinghamcity.gov.uk/onenottingham/CHttpHandler.ashx?id=10663&p=0
8 City of Nottingham Sustainable Community Strategy 2020, Strategic Objective 1, 2020 Headline Targets (page16). Available at: http://www.nottinghamcity.gov.uk/onenottingham/CHttpHandler.ashx?id=10663&p=0
9 The Covenant of Mayors is a commitment by EU signatory towns and cities to go beyond the objectives of EUenergy policy in terms of reduction in CO2 emissions through enhanced energy efficiency and cleaner energyproduction and use. The city of Nottingham became a signatory to the Covenant when the City Council publiclyadhered to it on 8th December 2008. Further information at:http://www.eumayors.eu/covenant_cities/city_341/index_en.htm

page | 9
The timing of the Nottingham Sustainable Energy Strategy, Climate Change Strategy, WasteStrategy and Local Development Framework planning process enable us to respond quickly andeffectively to the new national and international policies, setting Nottingham on the path tomeeting, and potentially exceeding, its responsibilities and taking a national lead in many areas inrelation to carbon and energy.
3.2. Nottingham’s achievements
Nottingham is already leading the UK in a number of key energy areas, particularly through thework of the Nottingham Energy Partnership (NEP), EnviroEnergy10 (the district heating operator)and the forward-thinking energy strategies of major local companies. From 2003-2007 domesticgas consumption in the city fell by 16%; the largest fall of any local authority in the East Midlandsand of all the Core Cities. This puts Nottingham in the top 8% of local authorities in the UK fordomestic energy efficiency.
Nottingham is by far the most energy self-sufficient city in the UK. The city is also the 8th mostenergy self-sufficient local authority.
In 2008, the UK as a whole generated 2.7% of non-transport energy from renewables andwaste11. In 2006, Nottingham City provided almost 155 GWh, just under 3% of non-transportenergy consumption, from renewables and waste; largely due to the ‘Energy from Waste’ plantincinerator at Eastcroft. A further 39.2 GWh of electricity was exported to the national grid fromthe Beeston weir hydro scheme and the City’s gas CHP heat station at Enviroenergy. The secondmost energy self-sufficient city, Coventry, generated only 0.74% of its own non-transport energyfrom renewables and waste in 2006 (Coventry has a smaller ‘Energy from Waste’ plant).
10 http://www.enviroenergy.co.uk/11 Figures taken from: http://www.decc.gov.uk/en/content/cms/statistics/publications/ecuk/ecuk.aspx

page | 10
Nottingham City also hosts 38.3MWeof installed gas Combined Heat andPower (CHP) capacity across 4 largeand 6 small sites. This represents 51%of the installed CHP capacity in theEast Midlands.
In 2006 the City’s gas CHPplants generated an estimated191 GWh of power and 372GWh of heat. This means that11.45% of Nottingham’s totalenergy consumption12 and14.3% of total electricityconsumption was generatedwithin the City in 2006. Thisenergy generation was largely from theAlliance Boots complex, ImperialTobacco, The Queens Medical Centre(QMC) and the City Enviroenergy heatstation. The actual percentage couldbecome even higher, as a considerableamount of power generated in the Cityis currently exported to the NationalGrid.
These figures are remarkable; they place Nottingham in a leadingposition in the UK and make the City a strong competitor with otherleading European ‘low energy’ cities.
Our leading position is bolstered by the City district heating network; the largest and longestestablished heat network in the UK. And on top of that our high profile partnerships have enabledsignificant success in demand reduction, particularly in domestic energy, and are set to continuee.g. Nottingham Warm Zone, Community Energy Saving Programme.
Significant improvements in low carbon transport have also been achieved throughimplementation of the first two Greater Nottingham Transport Plans, overseen by the GreaterNottingham Transport Partnership. Modern bus fleets, together with the growing city tramnetwork evidence Nottingham’s commitment to low carbon transport.
The City Council also worked in partnership to develop the ‘Nottingham Declaration on ClimateChange’13, putting the City’s name firmly at the heart of the local authority Climate Changeagenda.
12 Total energy consumption includes domestic, industrial and commercial energy, and transport-related energy; this% reflects our progress as a city against the 20% Sustainable Communities Strategy target.13 Available at: http://www.energysavingtrust.org.uk/nottingham

page | 11
Figure 3: The City of Nottingham’s average annual CO2 emissions per capita (in green), represented against that ofother cities (all emissions measured in tonnes of CO2). Source: Local and Regional CO2 Emissions Estimates for2005-2007 06/11/2009 AEA technology.

page | 12
3.3. National and local energy generation targets
The UK's energy policy aims to meet the challenge of reducing carbon emissions as well asproviding a secure and safe supply of affordable energy. Renewable energy is seen as one of thekey elements of the national strategy. In particular the national strategy will work towardsdecarbonising the energy supply, which will help to meet long term climate change targets. Aspart of the EU Climate and Energy package, the UK has committed to sourcing 15% of its energy(both heat and power) from renewable sources by 202014.
The target of sourcing 15% of energy from renewable sources nationally needs to take intoaccount the changes to demand for energy. It is expected that even while the population grows,national energy consumption will decrease from 1695 TWh in 2008 to 1590 TWh by 2020, a totalfall of 6.2% or a per capita fall of 13.7%15. Energy efficiency is therefore also an important part ofthe overall national, regional and Nottingham City energy policies.
Nationally the renewable energy targets could be achieved from different sectors. TheGovernment has decided to take the following16 as the lead scenario:• 30% of electricity demand met by renewables (2% from small-scale sources and 28% from
large scale renewables);• 12% of heat demand from renewables;• 10% of transport demand from renewables.
If the small scale power and heat targets are apportioned per capita (with a 2008 baselinepopulation), by 2020 Nottingham will need to generate and supply locally around 37 GWh ofelectricity per annum from small scale renewable generation and 342.7 GWh of heat fromrenewables. Within Nottingham, already in 2006:• 8 GWh of our electricity came from small scale sources, such as solar electric systems and
the Beeston weir hydro scheme (i.e. 22% of our ‘national’ target)• around 127 GWh of our annual heat demand was met by renewables and waste, through the
district heating network (i.e. 37% of our ‘national’ target)
While totalling 56 GWh in 2006, electricity generated from the district heating CHP scheme fromrenewables and waste is not ‘small scale’. Local small scale generation will need to expandrapidly to meet our part of the national 2020 targets.
Nottingham as a City is starting the low carbon transition from a leading position. If any city in theUK can meets its part of the Government’s national targets, it is Nottingham, but there is still avery long way to go. Nottingham is however exceptionally well placed to remainthe UK’s most energy self-sufficient city.
14 The UK Renewable Energy Strategy (2009). Page 10. Available at:http://www.decc.gov.uk/en/content/cms/publications/lc_trans_plan/lc_trans_plan.aspx15 Population projections by the Office for National Statistics (ONS): http://www.statistics.gov.uk16 The UK Renewable Energy Strategy (2009). Page 8. Available at:http://www.decc.gov.uk/en/content/cms/publications/lc_trans_plan/lc_trans_plan.aspx

page | 13
The Government has set a series of interim targets and carbon budgets from 2011 to 2018 toensure the UK is on track to meet the overall 2020 target17. Regionally, there are 2011, 2016 and2021 targets. The City Sustainable Energy Strategy also provides ambitious, practicable targetsfor each of the 5-year carbon periods to 2021 (set by the Committee on Climate Change, CCC18,in respect of the national 80% CO2 reduction target and ratified in the 2009 budget up to 2020).
Figure 4: The Nottingham Sustainable Energy Strategy provides a blueprint for how we will realise and maximise theCity’s energy resources to 2020.
This City-wide Sustainable Energy Strategy will enable Nottingham to takeand maintain a leading role in the UK in energy security and carbon reduction.
17 The UK’s Climate Change Act (CCA, 2008) creates a new approach to managing and responding to climatechange in the UK. At the heart of the Act is a legally binding target to reduce the UK’s greenhouse gas emissions toat least 80 % below 1990 levels by 2050, to be achieved through action at home and abroad. To drive progresstowards this target, the Act introduces five year “carbon budgets”, which define the emissions pathway to the 2050target by limiting the total greenhouse gas emissions allowed in each five year period, beginning in 2008. AlongsideBudget 2009, the Government announced that it agreed with the Committee on Climate Change (CCC)'s approachon carbon budgets and intended to set the levels of the budgets now for the period 2008-2022. These ‘interim’budgets require a reduction in greenhouse gas emissions by at least 34% by 2020, relative to 1990 levels. The firstthree carbon budgets were designated as 2008-12, 2013-17, and 2018-22. Further details available at:http://www.hm-treasury.gov.uk/bud_bud09_carbon.htm18 The Committee on Climate Change (CCC) is an independent body established under the Climate Change Act(CCA, 2008) to advise the UK Government on setting carbon budgets, and to report to Parliament on the progressmade in reducing greenhouse gas emissions. Further information at: http://www.theccc.org.uk/

page | 14
3.4. Social and environmental effects of energy use
3.4.1. Peak oil and energy security
“Energy reserves are concentrated in some of the most unstable parts of the world. That’s anissue of national security. There is no crisis but we can never be complacent. As we move out ofrecession, the global grab for energy will resume in earnest, consumption is predicted to rise, andwith it, prices”19.
“Complete energy independence is an unrealistic goal but there is much we can do to insulateourselves from the risks, in large part by driving our climate policies even further, quicker. Wemust be far smarter with the energy we use and invest in home grown energy sources, such asnew nuclear and renewables without delay20.”
By 2025, the UK will be importing 57% of its oil up from 15% in 201021. There has been noappreciable increase in global conventional crude oil output since 2005 despite increases indrilling rig activity (see Figure 5 and 6). The economic crisis over the last 12 months has alsoreduced global crude oil output and investment in new exploration. This issue has beenrecognised by Nottingham City Council in the December 2008 motion22 acknowledging theforthcoming impact of Peak Oil.
Figure 5: Global crude oil output between 1997 and 2009 (measured in million barrels per day).Source: EIA, 2009.
19 DECC (2009). Energy Security: A national challenge in a changing world. Report by Malcolm Wicks MP. Availableat: www.decc.gov.uk/en/content/cms/what_we_do/change_energy/int_energy/security/security.aspx20 DECC (2009). Energy Security […] Available at:www.decc.gov.uk/en/content/cms/what_we_do/change_energy/int_energy/security/security.aspx21 Analytical Annex, Table 19, UK Low Carbon Transition Plan (2009). Available at:http://www.decc.gov.uk/en/content/cms/publications/lc_trans_plan/lc_trans_plan.aspx22 Nottingham City Council (NCC) (2008). Motion in the name of Councillor Bull – Forthcoming impact of Peak Oil.Internal minutes of the meeting of the Nottingham City Council, held at the Council House, Nottingham, on Monday8th December 2008 at 3:15pm, pages 141-143.

page | 15
Figure 6: Number of active oil rigs worldwide between 1997 and 2009. Source: EIA, 2009.
The International Energy Agency (IEA) now believe that we will pass geological peak oil forconventional crude oil within 10 years, then all oil, including non conventional sources, within 20years. The IEA also predict a supply crunch due to industry underinvestment in 5 years withtightening demand and supply pressures pushing up prices from as soon as 2010. It can also beseen from Figure 523 that we may already have reached the peak of conventional oil output, giventhat the amount of crude oil available worldwide has not increased since 2005, despite demandand exploration growth.
Actual global crude oil output is limited by political and economic factors well before geologicalpeak oil is reached. Many credible sources including several governments, independent expertbodies and major oil companies believe we will reach peak oil well in advance of IEA projections.We will see the economic impacts of falling global crude oil supply well before 2020; in reality,with an oil price spike of $147 in 2008, we are already experiencing them.
Spikes in the price of crude oil (see Fig.7), followed by those in energy, food and inflation asexperienced in 2008, will become more frequent and more severe, as global oil supply falls andcompetition for energy resources increases. The IEA has pointed out that any recovery of theglobal economy will inevitably lead to a recovery in oil demand and consequential steep energycommodity price rises.
As reflected in the Nottingham City Council’s Peak Oil motion24, these impacts will clearly havesignificant effects on the residents and the economy of Nottingham.
23 Data from the US Energy Information Administration (EIA): http://www.eia.doe.gov/24 Nottingham City Council (NCC) (2008). Motion in the name of Councillor Bull – Forthcoming impact of Peak Oil.Internal minutes of the meeting of the Nottingham City Council, held at the Council House, Nottingham, on Monday8th December 2008 at 3:15pm, pages 141-143.

page | 16
Figure 7: Global crude oil price between 1997 and 2009 (measured in $ per barrel). Source: EIA, 2009.
In the UK, over the coming 15 years, we also face a far heavier reliance on imported gas by 2020.Varying estimates suggest that the UK will be importing 45-80% of its gas25 up from 31% in2010. Gas prices and supply security in Europe have proved volatile in recent years withincreased friction with Russia, Europe’s largest single gas supplier. While the UK has recentlyincreased pipeline connections to access Norwegian gas and has developed new supplyagreements and infrastructure to import liquefied natural gas, we will still feel the sting of a coldwind blowing from Russia, if Eastern European gas supply is again restricted.
Peak oil and security of fossil fuel supply represent an urgent cross cutting risk, with social andeconomic impacts from rising commodity prices, including inflation and potential furthereconomic stagnation. A stable economic environment is essential in the City, while we make thetransition to a low carbon economy. This can only be achieved through intense work on energyefficiency, generation and low carbon sector growth.
In terms of security of energy supply, the UK is also facing a potential electricity generation gap,as a significant proportion of the UK’s electricity generating capacity needs to be replaced overthe next 10 years. This is identified in the supporting documents to the Government Low CarbonTransition Plan26. Under EU legislation27 around one-third of the UK’s coal and oil fired powergenerating capacity will need to be decommissioned by 2020. Several nuclear power stations arealso due for decommissioning in the same timeframe.
The intention is to fill this gap by increasing the UK’s gas powered generation in the short termand lifting renewable energy capacity from a current 5.5% to 28% over the next 10 years, largelyfrom wind power.
25 DECC (2009). Energy Security […] Available at:www.decc.gov.uk/en/content/cms/what_we_do/change_energy/int_energy/security/security.aspx26 Implementation of the EU 2020 Renewables Target in the UK Electricity Sector. RO Reform, June 2009. Availableat: http://www.berr.gov.uk/files/file46778.pdf)27 EU Large Combustion Plants Directive (LCPD) (LCPD 2001/80/EC). Available at:http://eur-lex.europa.eu/LexUriServ/site/en/oj/2001/l_309/l_30920011127en00010021.pdf

page | 17
This intensive investment required to increase the UK’s renewable capacity almost five-fold overa 10-year period gives rise to concerns over spare capacity. By 2017 we can expect only 5-10%spare capacity, as opposed to 15% today. Unexpected power station shutdowns could have amore serious impact on the UK grid power supply. If the country cannot build wind capacity atthe rates proposed, and the intended plant closures go ahead, then Nottingham, along with therest of the country would need to plan for a far less reliable power supply from the UK grid.
Nottingham is already the UK’s most energy secure City, due to the largedistrict heat and private wire network. Given the uncertain future energysecurity background, we intend to build on our leading position by increasingthe use of private wire power supply, backup generation and distributedpower in the City of Nottingham, as a key strategic aim. Private wire powersupply should be focussed on supporting key infrastructure and public sectorbuildings, while homes and businesses will be actively supported to invest inrenewable energy technologies, energy efficiency and increasingly be offeredconnection to the City’s district heating network.
3.4.2. Fuel poverty and energy costs
“The era of cheap energy is over”28. With peak oil and a heavier reliance on gas poweredgeneration, we can expect further retail energy cost rises over the coming years, above thoseexpected through the need to deliver the UK’s low carbon transition. This will impact all fuel typesincluding petrol, diesel, gas, electricity, oil, liquid petroleum gas (LPG) and even wood fuel costsas demand rises for alternatives.
Higher energy prices have had a universal impact but have been particularly severe on lowincome households in ‘hard to heat’ homes. These households spend a disproportionate amountof their income on fuel, and are said to be in ‘fuel poverty’ – a fuel poor household needs tospend more than 10% of its income on fuel in order to heat the home to an adequate standard.
The Governments Fuel Poverty Strategy set a target to eradicate fuel poverty by 2016. Theunprecedented increase in the price of energy has put this target in doubt.
The latest ‘Annual Report on Fuel Poverty Statistics’ (DECC Oct 2009) includes the following;
* Since the fuel poverty low of 2004, domestic energy prices have risen by 80% between 2004and 2008, driving the trend in fuel poverty in recent years.
* Projections for England indicate a likely upper bound of around 4.6m households in 2009, upfrom 2.4m in 2006.
These figures represent a 90% increase in fuel poverty in 3 years, with a 21%fuel poverty rate for England.
28 John Hutton, Business Secretary - Sept 08

page | 18
Energy prices have now stabilised. The next priceincreases will be in response to Government policyand economic recovery. The Government estimatesthat, taken in isolation (i.e. before the impact ofscarcity, competition and energy efficiencymeasures), the investment outlined in the nationalRenewable Energy Strategy will increase householdelectricity costs by 15% and gas costs by 23% by202029. Non-domestic bills could rise by up to 21%30.
However, Ofgem's review of Britain’s energy markets,Project Discovery31 takes market factors into accountand models 4 different scenarios, of which their worstcase scenario admits the possibility of the averageannual bill rising from £1,247 in 2009 to £1,995 in2016, a further 60% increase in domestic fuel bills.The other scenarios point to a more modest 14% to25% increase above the level of inflation by 2020.
Whichever model proves to be right we cannotescape rising energy cost. We can however minimisethe impact through targeted energy efficiencymeasures and local generation.
The Government response to rising energy prices and fuel poverty is the extension of existingenergy efficiency programmes and funding of new schemes.
The major existing schemes (CERT – Carbon Emissions Reduction Target - and Warm Front) aretargeted to the basic measures of cavity wall and loft insulation, with heating repairs andimprovements for the most vulnerable. The basic measures will be completed by 2015.
A major problem remains with existing solid wall properties as identified in the Government’sHousehold Energy Management Strategy. This strategy outlines the need to insulate 7 millionhomes by 2020 with expensive solid wall insulation (i.e. more than 10 times the cost of cavity wallinsulation). There has been much discussion on how to identify methods of funding for muchmore costly measures including for microgeneration.
Nottingham has maximised national funding opportunities for domestic energy efficiency workthrough the development of local programmes, and we will continue to develop fundedprogrammes wherever possible:• The Greater Nottingham Healthy Housing Service has concentrated on the fuel poor over the
last 10 years,• Nottingham Warm Zone offers the best prices in the East Midlands for insulation,• Other projects under consideration include a major solid wall insulation programme and a
pilot to test methods of financing renewables and insulation in the private sector.
29 The UK Renewable Energy Strategy (2009). Page 19, Section 5.2. Available at:http://www.decc.gov.uk/en/content/cms/publications/lc_trans_plan/lc_trans_plan.aspx30 The UK Renewable Energy Strategy (2009). Page 184, Section 7. Available at:http://www.decc.gov.uk/en/content/cms/publications/lc_trans_plan/lc_trans_plan.aspx31 Available at:http://www.ofgem.gov.uk/markets/whlmkts/discovery/Documents1/Discovery_Scenarios_ConDoc_FINAL.pdf

page | 19
Rising energy prices impact on all sectors. Theimportance of energy issues in relation toNottingham’s public buildings in particular, asessential social infrastructure, should not beunderestimated. Not all communities will be wellequipped financially or socially to adapt to climaticand energy cost changes, however it is essential thatkey public services are not also eroded by risingcosts, at times when they may be needed most.
As well as offering energy savingmeasures to every household inNottingham, the City Council will showleadership in demonstrating carbonreduction, energy self-reliance andsustainability within its own buildings andoperations.
3.4.3. Climate change mitigation
Climate change mitigation refers to actions that reduce our contribution to the causes of climatechange. This means reducing our emissions of greenhouse gases (GHGs), such as carbondioxide (CO2), through energy efficiency and using alternative forms of transport and energy32.
It is now widely accepted amongst the scientific community that if the world continues emittinggreenhouse gases due to human activity at today’s levels, then average global temperaturescould rise by 4°C by as early as 2060 and up to 6°C by the end of this century33. Alongsidefrequent and unpredictable extreme weather events, these temperature rises will bring severe andpermanent changes to regional climates with impacts on global economies and socio-politicalinstability; resulting in growing conflicts, public health related deaths and migration of peoples. Itis important to note that early action could prevent some of the worst excesses of climatechange.
To avoid the most dangerous impacts of climate change, average global temperaturesmust rise by no more than 2°C , and that means that global emissions muststart falling before 2020 and then fall to at least 50% below 1990 levels by 2050.
In recognition of the above, the UK has committed to cut its own greenhouse gas emissions by34% from 1990 levels by 202035, and potentially by 42% if other countries play their part at theglobal climate negotiations. The UK will make an above average contribution within the EU,
32 http://www.ukcip.org.uk/index.php?option=com_content&task=view&id=73&Itemid=18633 United Nations Environment Programme (UNEP) (2009). Climate Change Science Compendium. Available at:http://www.unep.org/compendium2009/34 At the G8 summit held in L’Aquila, Italy, in July 2009, world leaders agreed that the increase in global averagetemperatures should not exceed 2 degrees Celsius over pre-industrial levels by 2020.http://www.unep.org/Documents.Multilingual/Default.asp?DocumentID=593&ArticleID=6245&l=en35 Climate Change Act, 2008.
page | 20
reflecting our relatively high income and by 2050 cut CO2 emissions by 80%. This commitmenthas resulted in the Government setting detailed carbon budgets nationally and, effectively, forlarge organisations, through the Climate Change Act36.
The City of Nottingham will have to play its part in achieving these challenging cuts, to be feddirectly into the national picture. Action to reduce CO2 emissions at local level will also help toreduce fossil fuel reliance and enhance energy security, create new economic opportunities andbring wider environmental benefits.
The direct and indirect dangers of climate change cannot be overestimated37.The window of opportunity to take effective action to avoid catastrophicclimate change is rapidly closing. The consequences of inaction will endangerthe livelihoods of current generations, and condemn generations to come toan uncertain future of widespread human adversity, ecological disasters andpolitical, social and economic instability.
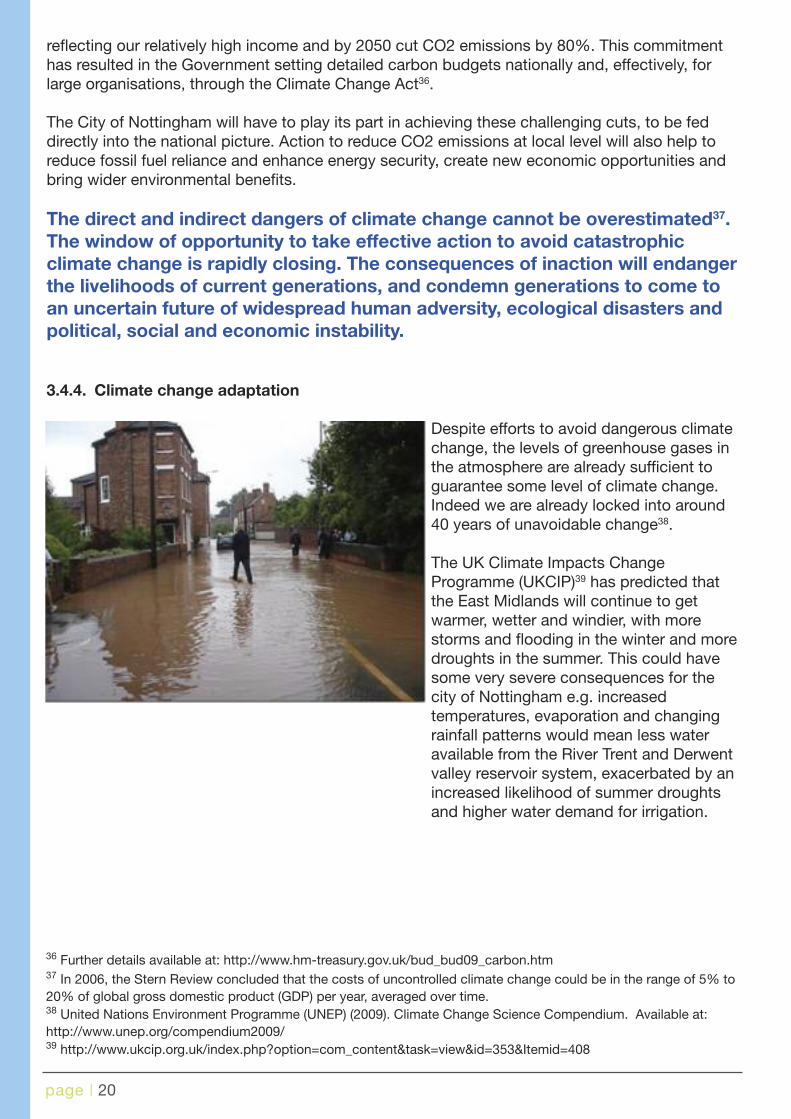
3.4.4. Climate change adaptation
Despite efforts to avoid dangerous climatechange, the levels of greenhouse gases inthe atmosphere are already sufficient toguarantee some level of climate change.Indeed we are already locked into around40 years of unavoidable change38.
The UK Climate Impacts ChangeProgramme (UKCIP)39 has predicted thatthe East Midlands will continue to getwarmer, wetter and windier, with morestorms and flooding in the winter and moredroughts in the summer. This could havesome very severe consequences for thecity of Nottingham e.g. increasedtemperatures, evaporation and changingrainfall patterns would mean less wateravailable from the River Trent and Derwentvalley reservoir system, exacerbated by anincreased likelihood of summer droughtsand higher water demand for irrigation.
36 Further details available at: http://www.hm-treasury.gov.uk/bud_bud09_carbon.htm37 In 2006, the Stern Review concluded that the costs of uncontrolled climate change could be in the range of 5% to20% of global gross domestic product (GDP) per year, averaged over time.38 United Nations Environment Programme (UNEP) (2009). Climate Change Science Compendium. Available at:http://www.unep.org/compendium2009/39 http://www.ukcip.org.uk/index.php?option=com_content&task=view&id=353&Itemid=408

page | 21
Figure 9

page | 22
The actions we take now, if sufficient, will ensure that towards the end of the next 40 years theclimate may start to stabilise. However we will still have to adapt to cope with some level ofchange, which could potentially affect all systems that support our current lifestyle and on whichwe directly depend, such as water supply, agriculture and farming, manufacturing, industry,transport, health provision, tourism and recreation, etc.
In terms of delivery of a City-wide Energy Strategy, we need to consider if the actions proposedwill work in a hotter, wetter, windier and all-in-all more unpredictable environment.
Buildings constructed now cannot be built to the average climate of the last 20 years; they mustbe built to the next 20 years’ climate. This will, for example, require the capacity for comfortcooling to be considered in schools, health centres and offices.
Having to retrofit cooling later will increase energy consumption, running costs and carbonemissions in the City and would not be as efficient as having designed buildings and systemsthat would require minimum cooling from the start.
The above highlights the urgent need to place adaptation at the heart of the planning, design andbuilding processes for new infrastructure, across all areas; from the national picture via theBuilding Regulations, to the regional and local levels via the planning and strategic regenerationframeworks, and through to the various capital investment programmes to deliver development.
page | 23
4. Vision and aims for energy in Nottingham
4.1. Energy vision for Nottingham
4.2. Scope of the Strategy
Setting SMART40 targets and identifying key strategic objectives, programmes and technologiesto meet those targets across:
• Low or zero carbon energy generation;• Domestic energy efficiency;• Education and behaviour change;• Business and public sector energy efficiency;• Growth in energy and energy services sector economic activity and employment• Transport energy.
4.3. Aims of the Strategy
Aim 1 – Reduce energy use in public sector infrastructure.Aim 2 – Reduce energy use in domestic properties and tackle fuel poverty.Aim 3 – Support increased energy efficiency in city businesses.Aim 4 – Develop alternative energy sources, supply chains and services.Aim 5 – Support low carbon transport infrastructure.Aim 6 – Create local jobs and opportunities in energy sector businesses.Aim 7 – Develop strong external & community partnerships.Aim 8 – Support local community energy initiatives.
To make sure Nottingham is a future-proof city, including:
• A city insulated against high energy prices.• Secure, low carbon energy supply and services available for business, public
and domestic sector.• A city prepared for climate change and peak oil.• A city leading on growth in low carbon jobs, industries, services and
training.• A city exemplar of integrated low carbon heat, power and transport.• An exemplar of neighbourhood community energy solutions.• A smart city where energy flows are planned, mapped and monitored.
These key energy ambitions will reinforce and help to deliver the long-term vision of theNottingham Sustainable Community Strategy (p.9, Nottingham’s Long Term Vision, SCS, 2009).
“We will do this by being radical, bold and daring to be different”.
40 SMART: Specific, Measureable, Attainable, Realistic and Timely.

page | 24
4.4. Strategic objectives
There are a number of key strategic objectives that are essential to ensure the delivery of theaims of the Sustainable Energy Strategy:
1. The city’s unique strength in energy self-sufficiency will be used to promote Nottingham inthe UK and Europe as the first choice for location of sustainable energy related and greentech business, innovation and growth.
2. Major capital investments detailed within the Energy Strategy and its associated Action Planto be assessed for delivery through innovative partnerships, including with Enviroenergy, theCity’s Energy Services Co (ESCO) and district heating provider. This will enable Enviroenergyto build a mixed portfolio of generation and income for continuous re-investment in energyefficiency and generation in Nottingham.
3. To develop the City’s installed low or zero carbon energy generation and distribution capacityin line with the detailed targets in the Sustainable Energy Strategy.
4. To reduce local authority, domestic and ‘industrial and commercial’ energy consumption inNottingham in line with the detailed targets.
5. NCC will work to ensure local planning policy, and local authority capital procurementsupports the timely delivery of the Sustainable Energy Strategy, through developing andsetting rigorous, evidenced, local targets for carbon and energy sustainability in newdevelopment.
6. To develop resource and maintain a prioritised Action Plan and delivery managementstructure including key partners and technical experts to deliver the Strategy, with an annualreview cycle for the Action Plan and review cycles aligned with national carbon budgetingperiods for the Strategy.
7. To set transport related carbon emissions reduction and technology targets in theforthcoming 3rd Local Transport Plan which are aligned with the Energy Strategy and aim toexceed the national Low Carbon Transition Plan targets by 2020. At this stage an indicativetarget of 20% reduction is recommended.
8. To work closely in partnership with business, universities and technology partners to ensureNottingham accelerates the process and maximises the impact of demand led innovation inenergy technology and management within the city
9. The City and partners will support the development of local and grass roots organisationsseeking to enable their communities to reduce carbon footprints, energy bills and adapt toinevitable climate change and peak oil.

page | 25
4.5.
Achieving
theaimsanddeliveringtheobjectives
Table
1:S
umm
ary
ofth
eke
yta
rget
sfo
ren
ergy
effic
ienc
yto
2020
.A
ims
1to
4an
dth
eiras
soci
ated
targ
ets
focu
son
ener
gy
effic
ienc
y.A
figur
eof20
%fr
om
tran
sport
reduc
tions
has
bee
nal
low
edfo
rin
rela
tion
toA
im5.
The
stat
utory
targ
etw
illne
edto
be
com
mitt
edto
via
the
pre
par
atio
nan
dad
optio
nofth
e3r
dLo
calT
rans
port
Pla
n.
Table1:Sum
maryofNottinghamSustainableEnergyStrategy’skeytargets1-7forenergyefficiency,2006
to2020.
41A
ssum
esel
ectr
icity
grid
inte
nsity
has
falle
nto
0.43
kgC
O2e
/kW
h(th
ecu
rren
tgr
idm
argi
nalf
acto
r)w
ithla
rge
scal
ero
llou
tof
rene
wab
les,
nucl
ear
and
CC
GT.
42N
ottin
gham
City
‘ind
ustr
iala
ndco
mm
erci
al’f
igur
esin
clud
e‘N
ottin
gham
City
Cou
ncil’
.
SE
STa
rget
No.
Cons
umptio
nTa
rget
2006
(GW
h)To
nnes
CO
220
11(G
Wh)
Tonn
esC
O2
2016
(GW
h)To
nnes
CO
220
21(G
Wh)
Tonn
esC
O2
41
1C
ityC
oun
cilE
lect
rici
ty45
.524
,923
39.4
21,5
8031
.617
,295
28.4
012
,212
2C
ityC
oun
cilG
as11
223
,078
101
20,7
9876
.515
,767
68.9
14,1
89
3D
om
estic
Ele
ctrici
ty52
2.5
286,
330
490
268,
520
459.
725
1,91
643
5.5
187,
265
4D
om
estic
Gas
1,91
9.0
395,
314
1,29
6.1
267,
003
1,21
8.9
251,
085
1,15
7.1
238,
354
5N
on-
dom
estic
Ele
c.(in
c.C
ityC
oun
cil)
421,
007.
955
2,32
998
2.7
538,
520
957.
552
4,71
090
7.1
390,
053
6N
on-
dom
estic
Gas
(inc.
City
Coun
cil)
421,
447.
429
8,16
41,
399.
628
8,31
81,
351.
827
8,47
11,
269.
326
1,47
6
7C
oal
57.5
318
927.
3757
.53
1892
7.37
0.00
0.00
0.00
0.00
Oil
231
64,6
8023
164
,680
231
64,6
8023
164
,680
Tota
l5,
185
1,61
5,74
54,
457
1,44
5,96
74,
219
1,37
0,86
24,
000
1,12
8,40
2
%sa
ving
on
2006
0.0%
0.0%
14.0
%10
.5%
18.6
%15
.2%
22.9
%30
.2%
Nott
ingha
mC
itytr
ansp
ort
ener
gy
use
1,39
7.20
377,
940
TB
CTB
CTB
CTB
C1,
117.
7030
2,35
2
%sa
ving
0%0%
TB
CTB
CTB
CTB
C20
%20
%
Gra
ndTo
tal
6,58
31,
993,
685
TB
CTB
CTB
CTB
C5,
118
1,43
0,75
4

page | 26
Figure 10: Targets for energy reduction by fuel source
NoteIf the indicative 2020 20% reduction target for transport CO2 emissions in Aim 5 and the 30.2%target for CO2 emissions implied within targets 3, 4, 5, 6, 7 and 8 are delivered, the City will beable to reduce its emissions to 1,431Kt CO2 per annum, a 21% reduction on the SustainableCommunities Strategy 2005 baseline (1810Kt); the SCS target is a 26% saving on 2005 to1,329Kt CO2 per annum by 2020.
Additional carbon savings of around 6.2% on the SCS 2005 baseline will be associated withincreasing the amount of low carbon energy installed. This will enable the City to reach a 27%carbon saving against SCS 2005 baseline; this would represent a 33% saving against the 2006energy strategy baseline. This is possible as not all city emissions sources were counted in the2005 SCS baseline.

page | 27
AIM 1: REDUCE ENERGY USE IN PUBLIC SECTORINFRASTRUCTURE
With rising energy prices, a tighter public purse and a need to show strong community leadershipin carbon reduction, it is essential that public sector buildings and services become lean, cleanenergy users.
National Government and the wider publicsector are expected to lead the way in carbonreduction and energy saving. Targets havebeen set to reduce the carbon emissions fromthe whole Government’s own estate by 30%by 202043.
Ensuring the security of affordable, reliablelow carbon energy supplies for key publicservices such as health, fire, police andschools is essential.
Many local public services now fall under theGovernments’ mandatory Carbon ReductionCommitment (CRC)44. Nottingham CityCouncil is a full participant in the CRC carbontrading mechanism and will have itsperformance shown on a league tableannually.
43 Sustainable Operations in the Government Estate (SOGI) targets. Available at:http://www.defra.gov.uk/sustainable/government/gov/estates/index.htm44 The CRC Energy Efficiency Scheme (formerly known as the Carbon Reduction Commitment) is the UK'smandatory climate change and energy saving scheme, due to start in April 2010. It is central to the UK’s strategy forimproving energy efficiency and reducing carbon dioxide (CO2) emissions, as set out in the Climate Change Act2008. It has been designed to raise awareness in large organisations, especially at senior level, and encouragechanges in behaviour and infrastructure. The scheme amended title serves to better reflect the CRC’s focus onincreasing energy efficiency, and is designed to tackle CO2 emissions not already covered by Climate ChangeAgreements and the EU Emissions Trading Scheme. The scheme will cover large public and private sectororganisations, who are responsible for about 10% of the UK’s emissions. This will affect around 20,000 organisationssuch as schools, large NHS trusts and local authorities.Further information available at: http://www.decc.gov.uk/en/content/cms/what_we_do/lc_uk/crc/crc.aspx
Strategic Objective 4: To reduce local authority, domestic and ‘industrial and commercial’energy consumption in Nottingham in line with the detailed targets.

page | 28
The City Council also has a duty to report on national indicator 185 (NI185) which represents thelocal authority’s own emissions45.
➢ Target 1: Reduction in electricity use from City Council’s own estate.
➢ Target 2: Reduction in gas use from City Council’s own estate.
Both Targets 1 and 2 are reflected in the City Council’s internal Local Authority CarbonManagement Plan (LACM), and are summarised in the following table:
Table 2: NCC’s electricity and gas consumption for 2006 and predicted/targeted for futureyears. Source: NCC.
Year1. Nottingham City Council’sElectricity consumption (GWh)
2. Nottingham City Council’s Gasconsumption (GWh)
2006 45.48 112.03
2011 39.38 100.96
2016 31.56 76.54
2021 28.40 68.88
45 National Indicator NI 185: CO2 reduction from local authority operations:http://www.decc.gov.uk/en/content/cms/what_we_do/lc_uk/loc_reg_dev/ni185_186/ni185_186.aspx

page | 29
AIM 2: REDUCE ENERGY USE IN DOMESTIC PROPERTIES ANDTACKLE FUEL POVERTY
Between 2003 and 2007 Nottingham’s domestic gas consumption fell by 16%, one of the largestfalls in domestic gas consumption of any local authority in the UK and the largest fall for a localauthority in the in the East Midlands. Nottingham is currently in the top 8% of local authorities fordomestic energy efficiency improvement.
Electricity use in the city fell by 3.48%,a little less than the UK average of4.5%.
In 2006 domestic energy consumptionrepresented 36% of Nottingham’s totalenergy use.
In 2007 average energy use in the city’sdomestic properties was 16,488kWhgas and 4,119kWh electricity perannum. This is significantly lower thanthe national and regional averages46.This is due in part to the success oflong running energy efficiencyprogrammes such as those run byNottingham City Homes and theGreater Nottingham Healthy HousingService (GNHHS); the latter funded byCity and County NHS and delivered bythe Nottingham Energy Partnership.
The most cost effective way of savingenergy and carbon is through physicalenergy efficiency measures supportedby behaviour change and education.
➢ Target 3: Reduction in domestic electricity consumption by 2021.
➢ Target 4: Reduction in domestic gas consumption by 2021.
Strategic Objective 4: To reduce local authority, domestic and ‘industrial and commercial’energy consumption in Nottingham in line with the detailed targets.
46 2007 national average of 17,530kWhs gas and 4,832kWhs electricity, and regional average of 17,823kWhs gas and4,602kWhs electricity.

page | 30
Savings from 2006 to the end of 2011 are based on the current and planned programmes beingdelivered in Nottingham by NEP, including the WarmZone, CESP47 and GNHSS. Savingspost-2011 are extrapolated from the supporting documents for the national Heat and EnergySaving Strategy consultation48 (and using a per capita proportional allocation for savings of0.47% based on 2008 City population versus UK 2008 population).
Table 3: Nottingham’s domestic electricity and gas consumption for 2006 andpredicted/targeted for future years. Source: NEP, 2009.
These targets represent a 20% reduction in power consumption per household and a 51%reduction in gas consumption per household by 2020.
Reduced energy consumption will fall into 3 main areas within the action plan:• Energy efficient new build• Energy efficient retrofit• Behaviour change
3. Nottingham’sdomestic electricityconsumption (GWh)
Average electricityconsumption perhousehold (MWh)
4. Nottingham’sdomestic gasconsumption(GWh)
Average gasconsumption perhousehold (MWh)
2006 522.5 3.95 1,919 17.03
2011 490 3.82 1,296 10.12
2016 459.7 3.46 1,219 9.16
2021 435.5 3.16 1,157 8.38
47 On 11/09/08 the Prime Minister announced a package of initiatives designed to help people to reduce their fuelbills whilst also ensuring that the most vulnerable receive help this winter. One element of this package was theCommunity Energy Saving Programme. In early 2009, the Government publicly consulted on policy proposals forCESP, and then re-published on 10/07/09 its response to the consultation on 30/06/09. The scheme basically aims todeliver around £350m of energy efficiency packages in domestic properties across the whole of the UK.The Community Energy Saving Programme (CESP). Relevant documents, including the Government’s response tothe consultation on CESP policy proposals and background to the programme, are available at:http://www.decc.gov.uk/en/content/cms/consultations/open/cesp/cesp.aspx48 http://hes.decc.gov.uk/download?filename=hes-partial-ia-delivery-mechanisms-for-supplier-obligation-20090128.pdf pages 20-21.

page | 31
AIM 3: SUPPORT INCREASED ENERGY EFFICIENCY IN CITYBUSINESSES
In 2006 industrial and commercial energy consumption represented 43% of Nottingham’s totalenergy use.
The most cost effective way in which to save energyand carbon is through physical energy efficiencyimprovements backed up by behaviour change. TheCity has found it difficult to successfully engage withbusiness and industry around energy efficiency. Thisis clearly evidenced by our below averageperformance in reducing industrial and commercialgas use and increasing electricity consumption inthis sector.
Analysis of the DEFRA data on local authority area energy consumption49 shows that in 20071,447GWh of gas, 27.9% less than in 2003, and 948.2GWh of electricity, 10.7% more than in2003, were consumed by commercial and industrial activity in Nottingham city.
Between 2003 and 2007 commercial and industrial gas use per customer fell by 10.6%. This isless than the UK average fall of 12.7%. In the same period electricity use per customer increasedby 9.8%; a little less than the UK wide increase of 11.2%.
➢ Target 5: Reduction in industrial and commercial electricity consumptionby 2021.
➢ Target 6: Reduction in industrial and commercial gas consumption by2021.
➢ Target 7: Reduction in industrial and commercial coal consumption by2021.
Strategic Objective 4: To reduce local authority, domestic and ‘industrial and commercial’energy consumption in Nottingham in line with the detailed targets.
49 Available at http://www.decc.gov.uk/en/content/cms/statistics/regional/total_final/total_final.aspx

page | 32
Table 4: Nottingham’s commercial and industrial electricity and gas consumption for 2006 andpredicted/targeted for future years. Source: UK Low Carbon Transition Plan, 2009.
Gas and electricity targets are extrapolated from the Analytical Annex of the UK Low CarbonTransition Plan (pgs. 69-71), which implies reductions in non-domestic gas use in mediumconsumers of 6.6% by 2015, 12.3% by 2020 and reductions in non-domestic powerconsumption of 5% by 2015, 10% by 2020.
The coal target is dependent on fuel switching at the City Hospital energy centre which currentlyburns around 8000 tonnes of coal per annum; making up 1% of the City’s carbon footprint.
5. Commercial andIndustrial electricity use(GWhs)
6. Commercial andIndustrial gas use (GWhs)
7. Commercial andIndustrial coal use (GWhs)
2006 1007.9 1447.4 57GWh
2011 982.7 1399.6 57GWh
2016 957.5 1351.8 0
2021 907.1 1269.3 0

page | 33
AIM 4: DEVELOP ALTERNATIVE ENERGY SOURCES, SUPPLYCHAINS AND SERVICES
Nottingham is already the UK’s most energy self-sufficient city, by a considerable margin. Wegenerate 11.45% of the all the energy we consume within the city from low or zero carbonsources.
• 2.98% of the energy we consume is generated from renewables and waste.
• The city is also the 8th most energy self-sufficient local authority in the UK.
The city’s leading position in the UK in local distributed power generation must be celebrated andwill become central to Nottingham’s future development.
The Government has set out a commitment to deliver 15% of final energy consumption fromrenewables by 2020. The lead scenario for meeting this entails over 30% (117 TWh) of electricitybeing generated by renewables in 2020; 28% from large scale, mainly wind power andbio-energy, and 2% (7.8TWh) from small-scale generation. 12% of heat demand (72 TWh) willalso need to be met from renewables.
If the national small-scale and heat targets are apportioned to the city per capita (Nottinghamrepresents 0.47% of the UK 2008 population) by 2020 Nottingham will need to generate andsupply around 37GWh of electricity per annum, from small-scale generation. By 2020 we will alsoneed to generate and supply 342.7GWh of heat from renewables. Nottingham also has achallenging target through the local Sustainable Communities Strategy of ‘20% of energy used tobe produced within the Greater Nottingham area from renewable or low/zero carbon sources’50.
Strategic Objective 1: The city’s unique strength in energy self-sufficiency will be used topromote Nottingham in the UK and Europe as the first choice for location of sustainableenergy related and green tech business, innovation and growth.
50 City of Nottingham Sustainable Community Strategy 2020, Strategic Objective 2, 2020 Headline Targets (page 21).Available at: http://www.nottinghamcity.gov.uk/onenottingham/CHttpHandler.ashx?id=10663&p=0

page | 34
Our large district heating network already supplies around 145GWh of heat locally, 127GWh ofwhich comes from renewables and waste. Further expansion, along with a significant expansionof biomass heat and power and increasing use of solar water heating, will help us achieve ourproportional obligations with regards to heat.
The City already supplies around 20GWh of electricity locally from the heat and power network.There is the capacity to potentially expand this to 60GWh currently and more with thedevelopment of the 3rd line at the Eastcroft incinerator. This system is however too large toqualify as a contributor to the national targets for small-scale electricity generation. Hence, thesetargets will need to be met through other smaller installations including wind, hydropower,photovoltaics and/or biomass combined heat and power (CHP) units as detailed below.
With the targets detailed above, the expected expansion of the incinerator and an increase in theenergy available for use in district heating, we can expect Nottingham to maintain its leadingposition as the UK’s most energy self-sufficient city over the coming years.
All of the City’s top level targets are possible; however they will require thedevelopment of all of the City’s renewable energy resources, a 73% increasein the size of our district heating scheme and the importing of a significantvolume of biomass.
Strategic Objective 5: NCC will work to ensure local planning policy, and local authoritycapital procurement supports the timely delivery of the Sustainable Energy Strategy,through developing and setting rigorous, evidenced, local targets for carbon and energysustainability in new development.

page | 35
A summary for the technology targets is detailed in Table 5. While it is clearthat the main priority for the city needs to be the expansion of the districtheating network, Ernst and Young were commissioned to evaluate which ofthe other leading large scale opportunities should also be given priority, interms of carbon savings and value for money.
From this work and NEP’s recent ‘Tree Station’ study51, it is clear that thedevelopment of the city’s woody biomass resources and a significant growthin local biomass CHP plant are both essential to meeting the targets withinthe Energy Strategy.
Strategic Objective 2: Major capital investments detailed within the Energy Strategy andits action plan to be assessed for delivery through innovative partnerships, including withEnviroenergy, the City’s ESCO and district heating provider. This will enable Enviroenergyto build a mixed portfolio of generation and income for continuous re-investment inenergy efficiency and generation in Nottingham.
Strategic Objective 3: To develop the City’s installed low or zero carbon energy generationand distribution capacity in line with the detailed targets in the Nottingham SustainableEnergy Strategy.
Strategic Objective 8: To work closely in partnership with business, universities andtechnology partners to ensure Nottingham accelerates the process and maximises theimpact of demand led innovation in energy technology and management within the City.
51 NEP (2009). Nottingham TreeStation: A Research report on the analysis of the energy potential, processing optionsand possible end use of waste woody biomass arising from the city of Nottingham. A report for Nottingham EnergyPartnership (NEP), prepared by ReNU Ltd et al. Available at: http://www.nottenergy.com/renewable-energy/biomass

page | 36
Table
5:S
umm
ary
ofen
ergy
tech
nolo
gy
targ
ets.
Note
:all
figur
espre
sent
edin
GW
h.
Tech
nolo
gyH
eatpro
duc
edS
mal
lSca
leP
ow
er(<
10M
We)
Larg
eS
cale
Pow
er(>
10M
We)
Year
2011
2016
2021
2011
2016
2021
2011
2016
2021
Ene
rgy
from
Was
te(E
fW)
127
150
220
00
030
6080
Ana
erob
icD
iges
tion
(AD
)9.
726.
23
Win
dp
ower
00
00.
633.
79.
80
00
Pho
tovo
ltaic
s0
00
0.29
1.17
4.61
00
0
Sol
arw
ater
heat
ing
1.14
3.25
7.72
00
00
00
Hea
tp
ump
s0.
52
4.5
00
00
00
Bio
mas
sC
HP
345
.410
0.7
00
00
8.6
19.1
Hyd
rop
ower
00
07.
87.
811
00
0
Tota
lRen
ewab
les
131.
6420
0.7
342.
68.
712
.731
.630
.068
.699
.1
Nat
iona
ltar
get
72,0
007,
800
Ap
por
tione
dlo
calt
arge
t@
0.47
%34
2.7
37
Larg
ega
sC
HP
>1M
We
356.
3535
6.35
356.
3518
2.7
182.
718
2.7
Sm
allg
asC
HP
<1M
We
15.6
115
.61
15.6
18.
048.
048.
04
Tota
lLow
orze
roca
rbon
gen
erat
ion
(GW
h)50
3.86
572.
6271
4.61
16.7
620
.71
39.6
821
2.66
251.
2628
1.76
Tota
lene
rgy
used
in20
20fr
omta
ble
151
1820
%b
y
2020
Sus
tain
able
Com
mun
ities
Str
ateg
yta
rget
for
low
orze
roca
rbon
gene
ratio
n10
23.6
20%
2020
Sus
tain
able
Ene
rgy
Str
ateg
yta
rget
1,03
6.1
20.2
%
Itcanbeseen
fromTable5thatforus
tocomeclose
toour
per
capitacontributionto
thenationalsmall-scale
electricitygenerationtargets,wewillneed
toinstallalltheenergygenerationtechnologiesdetailedinthisEnergy
Strategyandmore.These
arechallengingtargets.To
ensure
thatwealso
meetboththe2020
Sustainable
CommunitiesStrategytargetforloworzero
carbonenergygeneration,andour
per
capitaproportionofthe
national2020targetsforrenewableheatgeneration,wewillneed
toincrease
thecapacityofthecity’sdistrictheat
network
by73%,developthe3rdlineattheEastcroftincineratorandensure
asignificantandrapidexpansionin
biomassheat.Thiswillrequire
importinglargevolumes
ofbiomassinto
theCityandthedevelopmentofa
significantcapacityofbiomassheatorheatandpower
plant,w
ithdistrictheating.

page | 37
Figure 11: Targets for electricity generation from Low or Zero Carbon sources - excluding gasCHP
Figure 12: Targets for heat generation from Low or Zero Carbon sources - excluding gas CHP

page | 38
Figure 13: Total targets for energy generation from Low or Zero Carbon sources – includinggas CHP
Assessment matrix for large scale technologies
The expansion of the district heating network, a rapid expansion in large biomass plant andincreased use of Enviroenergy generated electricity locally are key strategic priorities alongsidethe likely addition of the 3rd line at Eastcroft incinerator. A number of specific energy generatingtechnologies were scored in terms of carbon saved and energy generated for investment toestablish strategic priorities.
Table 6: Total CO2e saving potential (t CO2e p.a.) from each technology. Please note that the capitalcost per lifetime (£/t CO2e) of photovoltaics has been calculated excluding the Feed-In-Tariffs (FITs) structure whichwould bring the cost per lifetime down considerably.
Capital costper lifetime tCO2(£/t CO2e)
Total CO2esaving(t CO2e p.a)
Pre-taxproject return(%)
Council return(free cashequity IRR %)
Council pureequityrequirement(£000)
Biomass CHP 26 5755 21.8 36.4 604
Hydro 36 1305 36.8 64.2 185
Wind 79 2434 9.6 12.2 771
Solar PV 459 482 4.2 2.5 2105
BiomassAggregation
3 6276 48 92.6 70

page | 39
Ernst and Young’s evaluation:
• Overall, the projects producing the best returns appear to be the biomass aggregation,biomass CHP and hydro projects.
• The biomass projects also seem to provide the largest CO2 savings available to the Councilout of the projects considered.
• The returns identified for the biomass projects and hydro would be likely to be of interest toprivate developers and investors.
• The wind project provides returns which are likely to be below those required by the privatesector. However, this is largely dependent upon the wind-speed, which appears to be low.Further investigation may show a higher wind-speed on site which would increase energyyields and therefore increase the overall returns.
Figure 14: Calculations exclude Feed in Tariffs

page | 40
Ernst and Young’s conclusions:
• The financial modelling exercise suggests that the biomass projects and hydro projectappear to provide sufficient returns and should be investigated further.
• We understand that the biomass aggregation and hydro projects are further advanced andtherefore it would appear sensible to progress these initially.
• The biomass CHP is likely to require a housing or commercial development to provide a heatload and therefore may need to be followed at a later stage. It could, however, provide alarge customer for the biomass aggregation project.

page | 41
Energy from Waste District Heating Network
➢ Target 8: Increased electricity and heat generated from waste.
Table 7: Electricity and heat generation from the Nottingham Energy-from-Waste (EfW) plant.
Heat targets are based on the development of a 3rd line at the Eastcroft incinerator, theupgrading of the plant at the London Road heat station to provide increased CHP and gasbackup capacity and the expansion of the district heating network to distribute all the arising heatto new and established developments around the South and East of the city.
GWh electricity from waste GWh heat from waste
2006 20 127
2011 30 127
2016 60 150
2021 80 220

page | 42
Electricity targets are based on an increasing use of Enviroenergy generated electricity beingused locally through private wire contracts.
It is clear that incineration is not a true renewable energy source. Around 30% of the energyarising from incineration is due to burning plastics and a proportion of the biomass that is burntcould be recycled or composted.
With a changing waste stream and peak oil approaching, plastics will increase in value and willpotentially make up a smaller and smaller fraction of residual wastes.
While not the lowest carbon energy source, Energy from Waste, with combined heat and power(CHP) and district heating, does represent a very significant carbon saving versus natural gas andmains electricity supply. This will help to dramatically reduce the City’s carbon emissions. Localenergy generation will also increase the City’s energy self-sufficiency. Over time it may also bepossible to diversify the heat sources used in the enlarged district network to include morerenewables.

page | 43
Anaerobic Digestion
The City generates around 30,000 tonnes of food and garden waste per annum; this could beused to fuel a City AD plant generating up to 4.2GWh of biogas annually. This would give thepotential for a generation of 6.23GWh of renewable electricity and 9.72GWh renewable heat. Andwith increasing fertilizer costs, production of usable compost would be a potentially valuableadditional benefit.
While there are significant waste management cost implications in collection and disposal ofgreen waste, the development and analysis of the potential for a City AD plant needs to be apriority. Only with this plant as well as the other elements detailed in the Energy Strategy willNottingham be able to meet its part of the national targets for 2020 and the SustainableCommunities Strategy target, particularly the targets for small scale renewable electricity.
If sited appropriately, generating biogas could be of use in supporting local gas intensivebusinesses to reduce their carbon emissions and increase local energy supply and price security.
Wind
➢ Target 9: Increasedelectricity generationfrom wind.
This is based on 3 X 1.3MWturbines and 1 X 330kW turbineon the Meadows Embankment,plus 20 X 5kW turbines in theCity. Preliminary work by NEPhas established the possiblelocation of these turbines at sitessituated along the wind corridorof the River Trent.
Table 8: Electricity generation from wind
GWh electricity from large wind GWh electricity from small wind Total GWh
2006 0 0 0
2011 0.6 0.03 0.63
2016 3.6 0.1 3.7
2021 9.6 0.2 9.8

page | 44
Photovoltaics
By 2009 0.27MWe of PV had been installed in Nottingham city, whereas by 2008, 0.64MWe hadbeen installed across the whole of the East Midlands region52. It can be fairly assumed thatNottingham is leading the region in installed PV capacity with 42% of the total East Midlandsinstalled capacity within the city and many more installations planned or underway.
PVs are capital intensive, however the technology will be required to take a significant role inmeeting the City’s small scale renewable electricity targets.
The 2008 Faber Maunsell study53 suggest a regional target for microgeneration based onFeed-In-Tariffs (FITs)54, Building Regulations and new build rates. The regional target suggestedfor 2020 is an annual output of 65MWhe from microgeneration. In Nottingham, PVs are the onlysuitable market ready microgeneration renewable energy technology able to make anyconsiderable contribution. A 65GWhe target pro rata per capita (based on 2001 census data forNottingham and the East Midlands) gives the city a 3.9GWhe 2020 microgeneration target. This isa target of around 3,060 typical domestic PV systems by 2020.
52 The East Midlands Regional Assembly (EMRA) (2009). Reviewing Renewable Energy and Energy Efficiency Targetsfor the East Midlands. Report for EMRA produced by Faber Maunsell. Available at:http://www.emra.gov.uk/files/reviewing-renewable-and-energy-efficiency-targets.pdf
53 Available at: http://www.emra.gov.uk/files/reviewing-renewable-and-energy-efficiency-targets.pdf
54 The Energy Act 2008 provides broad enabling powers for the introduction of feed-in tariffs (FITs) for small-scalelow-carbon electricity generation, up to a maximum limit of 5 megawatts (MW) capacity - 50 kilowatts (kW) in thecase of fossil-fuelled CHP. The FITs will be introduced through changes to electricity distribution and supply licences.
These provisions are intended to encourage the uptake of small-scale low-carbon energy technologies while theRenewables Obligation (RO) continues to be the main support mechanism for large-scale renewables deployment.FITs guarantee a price for a fixed period for electricity generated using small-scale low carbon technologies. Theincreased certainty that this will provide should encourage individual households, communities, businesses, schools,hospitals, local authorities, universities and a host of other organisations to consider installing small-scale low carbonelectricity generation technologies.
The Renewable Electricity Financial Incentives Consultation, launched on 15 July by DECC, sets out how theGovernment intends the FITs scheme to work, including the proposed tariff levels. These proposals have beendeveloped with input from stakeholders including energy industry trade associations, energy suppliers, Ofgem andNGOs, and the consultation constitutes a more formal opportunity for all interested parties to have their say on thedetails of the FITs mechanism. DECC’s website on Feed-in-Tariffs (FITs) available at:http://www.decc.gov.uk/en/content/cms/what_we_do/uk_supply/energy_mix/renewable/policy/feedin_tarriff/feedin_tarriff.aspx
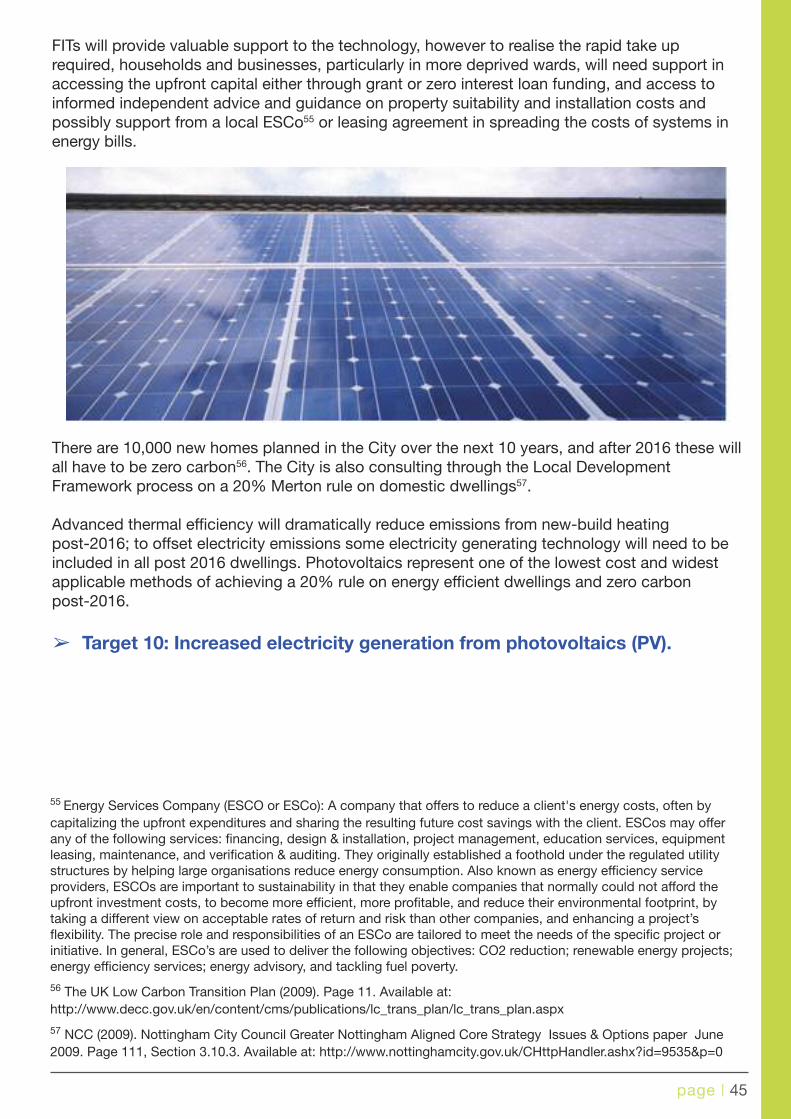
page | 45
FITs will provide valuable support to the technology, however to realise the rapid take uprequired, households and businesses, particularly in more deprived wards, will need support inaccessing the upfront capital either through grant or zero interest loan funding, and access toinformed independent advice and guidance on property suitability and installation costs andpossibly support from a local ESCo55 or leasing agreement in spreading the costs of systems inenergy bills.
There are 10,000 new homes planned in the City over the next 10 years, and after 2016 these willall have to be zero carbon56. The City is also consulting through the Local DevelopmentFramework process on a 20% Merton rule on domestic dwellings57.
Advanced thermal efficiency will dramatically reduce emissions from new-build heatingpost-2016; to offset electricity emissions some electricity generating technology will need to beincluded in all post 2016 dwellings. Photovoltaics represent one of the lowest cost and widestapplicable methods of achieving a 20% rule on energy efficient dwellings and zero carbonpost-2016.
➢ Target 10: Increased electricity generation from photovoltaics (PV).
55 Energy Services Company (ESCO or ESCo): A company that offers to reduce a client's energy costs, often bycapitalizing the upfront expenditures and sharing the resulting future cost savings with the client. ESCos may offerany of the following services: financing, design & installation, project management, education services, equipmentleasing, maintenance, and verification & auditing. They originally established a foothold under the regulated utilitystructures by helping large organisations reduce energy consumption. Also known as energy efficiency serviceproviders, ESCOs are important to sustainability in that they enable companies that normally could not afford theupfront investment costs, to become more efficient, more profitable, and reduce their environmental footprint, bytaking a different view on acceptable rates of return and risk than other companies, and enhancing a project’sflexibility. The precise role and responsibilities of an ESCo are tailored to meet the needs of the specific project orinitiative. In general, ESCo’s are used to deliver the following objectives: CO2 reduction; renewable energy projects;energy efficiency services; energy advisory, and tackling fuel poverty.
56 The UK Low Carbon Transition Plan (2009). Page 11. Available at:http://www.decc.gov.uk/en/content/cms/publications/lc_trans_plan/lc_trans_plan.aspx
57 NCC (2009). Nottingham City Council Greater Nottingham Aligned Core Strategy Issues & Options paper June2009. Page 111, Section 3.10.3. Available at: http://www.nottinghamcity.gov.uk/CHttpHandler.ashx?id=9535&p=0

page | 46
This is split between domestic PVs, and non-domestic PVs on public sector buildings,businesses, schools and community facilities, and commercial PV arrays on large car parks or‘PV farms’.
Table 9: Electricity generation from PV
GWhelectricityfromdomesticPV
No ofsystems
GWhelectricityfrom non-domesticPV
No ofsystems
GWh fromcommercialPVs
No ofsystems
Total GWh
2009 0.01 27 0.1 10 0 0 0.11
2011 0.09 75 0.2 20 0 0 0.29
2016 0.6 500 0.5 50 0.07 1 1.17
2021 3.6 3000 0.8 80 0.21 34.61

page | 47
Solar water heating (SWH) / Solar thermal
The large proportion of the city’s heat targets will be met through the district heating network andbiomass heat; that said, there is an exceptionally important role to be played by solar waterheating, in terms of total heat output. SWH ensures that buildings that cannot access the districtheating system are able to access zero carbon heat for hot water. Solar water heatingrepresents the lowest cost and widest applicable method of achieving a 20%Merton Rule on energy efficient dwellings.
The legally binding national 80% carbon cut by 2050 infers that all UK dwellings, new build andexisting will need to be almost or totally zero carbon by then58. All new build after 2016 will haveto be ‘zero carbon’. Within the city, this will only be possible with the inclusion of solar waterheating on the majority of dwellings.
The 2008 Faber Maunsell study59 suggest a regional target based on a Renewable Heat Incentive(now due to commence in 2011), Building Regulations and new build rates. The regional targetsuggested for 2020 is an annual microgeneration heat output of 122GWht. In Nottingham solarwater heating is the leading market-ready thermal microgeneration technology and simplest toretrofit. A 122GWht target pro rata per capita (based on 2001 census data for Nottingham and theEast Midlands) gives the city a 7.32GWht 2020 target. If met by solar water heating alone thiswould represent a target of almost 6000 typical domestic systems by 2020.
There are already active installers in the city, and inclusion of tough targets and mechanisms toenable them will increase economic activity and employment in this sector.
58 “By 2050, the UK will need to have cut its greenhouse gas emissions by four-fifths overall. Looking across theoptions available, that means we will need to radically reduce demand for energy and decarbonise the energy we usein our homes almost totally by 2050. Our homes need to become much more energy efficient and we need toproduce more of our heat and electricity from low carbon sources, such as ground and air-source heat pumps andsolar power” (UK Low Carbon Transition Plan, 2009. Page 86).59 “Three quarters of the energy we use in our homes is for heating our rooms and water, most of which comes fromgas-fired boilers. Together this accounts for 13% of the UK’s greenhouse gas emissions, and by 2050 emissions fromhomes need to be almost zero by using energy more efficiently and using more low carbon energy. The plan to 2020will cut emissions from homes by 29% on 2008 levels, introduce further measures to protect the most vulnerable,and improve the security of our gas supplies, a third of which is used in our homes. Two thirds of the homes we willlive in by 2050 have already been built, so we will need to make our existing homes much more energy efficient andheat and power them from low carbon sources” (UK Low Carbon Transition Plan, 2009. Page 10).
Available at: http://www.emra.gov.uk/files/reviewing-renewable-and-energy-efficiency-targets.pdf

page | 48
➢ Target 11: Heat generation from solar water heating60.
Installed systems in 2011 is an estimate based on pro rata 2008 national figure plus 3 yearsgrowth
Table 10: Heat generation from solar water heating
Heat Pumps
Heat pumps use grid or private wire electricity to draw heat from the ground, air or water. Groundand water sourced heat pumps are particularly useful in buildings that will require cooling as theycan also offer this with minimal additional cost.
Heat pumps are far simpler andcheaper to fit at build stage and alsooffer a valuable level of adaptation tofuture hotter temperatures expectedwith climate change.
The office development for Spirita atRaleigh Square in Nottingham housesone of the first non-domestic groundheat pump systems in the country toprovide both heating and cooling.There are 10 domestic groundsystems installed in a social housingdevelopment on Broxtowe Estate(again by Spirita) and a large watersourced system, using the Trent,installed in the River Crescentdevelopment.
GWh heatfrom domestic
SWH
No of systems GWh heatfrom
non-domesticSWH
No of systems TotalGWh
2006 0.08 65 0 0 0.08
2011 0.441 400 0.7 5 1.14
2016 1.85 1500 1.4 10 3.25
2021 4.92 4000 2.8 20 7.72
60 Numbers of microgeneration units installed in England, Wales, Scotland, and Northern Ireland - Final Report ForBERR 17/11/2008.

page | 49
A building designed for low carbon using heat pumps could actually exhibit a falling carbonfootprint over time, as national policies adjust the UKs power generation mix. Further increasedenergy security and lower bills can be realised at a later date with retrofitted onsite electricitygeneration e.g. PVs.
The canal and river in Nottinghamare ideal sources for watersourced heat pumps. The RiverTrent is warmed by the waste heatfrom Radcliffe-on-Soar powerplant and even the canal iswarmed slightly by waste heatfrom the London Road heatstation. The warmer water in boththe River Trent and the canalwould increase the efficiency ofany heat pump system usingthese as a source. The river wateris already used by the RiverCrescent development as a heatsource for their swimming pool.
Air sourced heat pumps arecurrently only suitable if used toreplace electric heating in off-gasgrid developments, such as highrise flats. Nottingham City Homesare currently running trials to testthe viability of air source heatpumps for their tenants in anumber high rise flats in the City.There are around 17,000 domesticproperties in the City with anelectricity supply but no gasmeter; 4,600 of these are on theheat network. This leaves around 12,400 that may be suitable for air sourced heat pumps.
➢ Target 12: Heat harvested from heat pumps.
Table 11: heat generation from heat pumps
61 Trent Park Developments, developers of the River Crescent complex. More details available at:http://www.trentpark.co.uk/
GWh heatfrom domesticheat pumps
Number ofsystem
GWh heatfromnon-domestic
heat pumpsNumber ofsystems
Total GWh
2006 0.125 10 0.26 1 0.4
2011 0.163 13 0.33 2 0.5
2016 0.75 60 1.3 5 2
2021 1.87 150 2.6 10 4.5

page | 50
Biomass
Biomass alongside the expansion of the EfW district heating network iscentral to Nottingham achieving its national targets for renewable heat andthe 20% Sustainable Communities Strategy target for low or zero carbonenergy.
Work has been carried out by NEP, funded by Greater Nottingham Partnership (GNP) and theEast Midlands Development Agency (EMDA), to establish the level of sustainable local supplyavailable for clean biomass and the most efficient route to processing this. All biomass hasassociated carbon emissions and costs related to transportation and processing. Locally sourcedclean wood has the lowest carbon intensity.
Creating a local processing and supply chain, using locally sourced waste wood, will increaseenergy supply and cost security in Nottingham, whilst also reducing carbon emissions if used in aCity based energy plant. With a good return on investment in economic and carbon saving termsand the clear benefit to local energy security. This project and the construction of the firstbiomass CHP plant are incorporated into the Strategic Priorities.
Work carried out by Ernst and Young to establish the priorities for local investment in carbonreduction identified the development of a local biomass processing site and a biomass CHP plantas offering the most cost effective carbon savings of all the technologies evaluated.
The 16,000 tonnes of biomass available within the City from urban wood waste will however onlyrepresent around 23% of the biomass required to meet our local and national targets. Asignificant volume of woodchip or other biomass will need to be imported into the City and usedto fuel large scale combined heat and power plant.
Moving this volume of biomass into the city will require consideration of delivery logistics to andwithin the City and appropriate storage sites. Connections to the river, rail and canal for themovement of bulk dry masses will need to be assessed.

page | 51
The canal and river are both suitable potential delivery routes for this type of freight62.
➢ Target 13: Heat and electricity generation from woody biomass.
Table 12: Heat and electricity generation from biomass
(Based on figures from the Nottingham Tree Station report63)
GWh heat frombiomass
GWh elec. frombiomass
Total GWh
2006 0.74 0 0.74
2011 3 0 3
2016 45.4 8.6 54
2021 100.7 19.1 119.8
62 Moving freight the green way on the River Trent, 2009, British Waterways and EMDA.63 NEP (2009). Nottingham TreeStation: A Research report on the analysis of the energy potential, processing optionsand possible end use of waste woody biomass arising from the city of Nottingham. A report for Nottingham EnergyPartnership (NEP), prepared by ReNU Ltd et al. Available at: http://www.nottenergy.com/renewable-energy/biomass

page | 52
Hydropower
Beeston Weir is currently the only developed hydropower site within the City and at 1.68MW isthe largest hydro power station in the East Midlands however there is scope to develop HolmeSluices to add additional capacity.
➢ Target 14: Electricity generation from hydro power.
Table 13: Elec. Generation fromHydropower
GWh electricity fromhydro
2006 7.8
2011 7.8
2016 11
2021 11

page | 53
CHP
While not a renewable energy source, Gas CHP is an established small and large scale energygeneration technology and an emerging microgeneration technology. Fuel cell CHP is also closeto market.
As of 2006 in Nottingham there was 38.3MWe of installed CHP across 10 sites. This includes the14.4MWe Gas CHP district heating backup at the London Road heat station, 15MWe at Bootsmain site, 4.9MWe at the QMC and 4MWe at Imperial Tobacco plus 6 other small sites64. Thistotal represents 51% of the entire East Midlands installed CHP capacity.
While the use of natural gas CHP is appropriate in new large developments, and permitted tocontribute to low or zero carbon targets in planning policy, the City will not set targets for thistechnology. In the UK, over the coming 15 years, we face a far heavier reliance on imported gas.By 2020, varying estimates suggest that the UK will be importing 45-80% of its gas65 up from31% in 2010.
Gas is easier to deliver and use within a City, but increasing insecurity in gas supply with fallingoutput from the North Sea and an increased dependence on imported gas makes furtherincreases in Nottingham’s reliance on gas for power, as well as for heat, a potentially risky step.
Whilst Gas CHP offers more energy security in terms of continuity of power supply, the expectedfalling carbon intensity of grid electricity over the coming years will mean that the carbon savingpotential of natural gas CHP will become more and more marginal.
There are also other reasons for not setting a Gas CHP target for the City.
Nottingham already has a very large installed gas CHP capacity providing heat and power tomany of the city’s large employers and backup for the City district heating network. As an interimmeasure Gas CHP with district heating is a step towards a low carbon energy supply; it is moreefficient and lower carbon to generate electricity close to the point of use than using grid power.However there are still considerable carbon emissions associated with burning natural gas.
64 The European Co-generation Directive defines small-scale CHP as all units with an electrical capacity of less than1 MW.65 Energy Security: A national challenge in a changing world 2009, Malcolm Wicks MP

page | 54
To 2020 the challenging national targets for renewable heat will require a rapid expansion inrenewable fuel supply and installed renewable heat capacity. This cannot be met throughincreased Gas CHP capacity. The focus for low carbon heat supply within the City EnergyStrategy thus needs to be placed on energy from biomass and waste.
Nottingham has an opportunity now to take a leap forward beyond gas. This will only happen ifwe are quick to develop infrastructure and partnerships to ensure we have access to thenecessary biomass resources to provide for the City’s heat and power demands.
Gas CHP is an interim measure on the road towards sustainable low carbon energyinfrastructure.
Gas CHP will still have a role as backup capacity for biomass and Energy from Waste. It will alsoplay a role as technology develops with new fuel cell and small CHP units in specific high heatload applications such as nursing homes, swimming pools and schools. These installations willhowever not be promoted through the Energy Strategy with targets and are expected to rise innumber naturally though pressure from the national Building Regulations and the City’s Mertonrule.
Bio-fuels
There are no targets for energy generating biofuel technologies, such as biodiesel CHP,bioethanol or pure plant oil as the carbon savings and sustainability of these energy sourcesexcept in transport applications are at the moment highly questionable.
These fuel sources are not eligible to contribute towards developers’ Merton Rule obligationsexcept in specific unusual circumstances, detailed within the City Merton Rule guidelines.
With the advent of second generation biofuels and improved carbon accounting practices it maybecome relevant to include these technologies in a later revision.

page | 55
AIM 5: SUPPORT LOW CARBON TRANSPORT INFRASTRUCTURE.
The Government’s Renewable Energy Strategy has stated an aim that 10% of transport energyshould be met by renewables by 202066.
Figure 15: Carbon Reduction Strategy for Transport. Source: DfT, 2009.
International and national legislation, through the EU67 and the Renewable Transport FuelsObligation68 is increasing the proportion of biofuels in the fuel supply whilst a lot is expected interms of efficiency from research and innovation into vehicle technology.
The publication of the Department for Transport’s Carbon Reduction Strategy for Transportalongside the Low Carbon Transition Strategy sets the themes for future transport solutions in theUK. It can be seen from Figure 8, that there is a significant reliance on an increased role forelectric and plug-in hybrid vehicles. Local infrastructure and policy needs to be developed tosupport recharging electric vehicles.
66 The UK Renewable Energy Strategy (2009). Page 8. Available at:http://www.decc.gov.uk/en/content/cms/publications/lc_trans_plan/lc_trans_plan.aspx67 Directive 2003/30/EC of the European Parliament and of the Council of 8 May 2003 on the promotion of the use ofbiofuels or other renewable fuels for transport. Available at:http://europa.eu/legislation_summaries/internal_market/single_market_for_goods/motor_vehicles/interactions_industry_policies/l21061_en.htm68 The Renewable Transport Fuel Obligation Programme will, from April 2008, place an obligation on fuel suppliers toensure that a certain percentage of their aggregate sales is made up of biofuels. The effect of this will be to require5% of all UK fuel sold on UK forecourts to come from a renewable source by 2010. This will help meet our climatechange objectives as well as contributing to other Government objectives, including security of energy supply. Moreat: http://www.dft.gov.uk/pgr/roads/environment/rtfo/aboutrtfo

page | 56
Key national policy aims towards 2020include promotion of, and developingthe supporting infrastructure to,increase the use of electric vehicles,increased the use and decarbonisationof public transport, and alsosupporting cycling.
Nottingham has been very successfulover the years in increasing thecapacity and use of public transport,cycling, tram and foot traffic overpersonal vehicle use. In 2006 transportrepresented 21% of the City’s totalenergy consumption. Per capitaenergy use for transport across theCity has fallen by 3.2% from 2005 to2007.
As a growing conurbation, GreaterNottingham has been active indelivering a sustainable transportnetwork to provide current and futureresidents with realistic alternatives tothe private car. Greater Nottinghamhas been acknowledged as a ‘Centreof Excellence for Local TransportDelivery’ and awarded Beacon statusfor Accessibility.
The Joint Local Transport Plan for Greater Nottingham (prepared by the City and CountyCouncils) has enabled considerable investment in sustainable travel modes, includingNottingham Express Transit (NET) Phase 1; development of a high quality integrated bus network(with the highest use per head of population and satisfaction levels outside London); prioritymeasures for local buses; ticketing and smartcard initiatives; and marketing and informationinitiatives, including personalised travel planning.
Nottingham has also applied strict parking restrictions in the City centre and is the only City in thecountry which is actively seeking to implement a Workplace Parking Levy (WPL), which willprovide some of the finance for future investment in sustainable transport measures. As a directresult of the sustainable travel initiatives which have been implemented, City traffic levels havegrown at less than 1% per year since 2000.
Against this background, Nottingham is aiming to become an exemplar for urban sustainabletravel in England. This vision will be achieved via:
• A lifecycle approach to encourage and enable people to make sustainable travel choices atkey decision points in their lives;
• Incentivised travel opportunities to motivate hardened car commuters to try out sustainabletravel options and to support disadvantaged communities with limited travel horizons;
• A culture change brought about via extensive community and business engagement throughthe deployment of ‘Smarter Travel Champions’, resulting in walking, cycling and publictransport being modes of choice rather than last resort;

page | 57
• A healthier population resulting from sustainable travel becoming integrated into more activelifestyles.
The vehicle for establishing the City’s statutory transport targets will be the adoption of the nextLocal Transport Plan. This will seek to build on targets proposed in the development of theNottingham Sustainable Travel City programme. The key strategic target for the Energy Strategyis:
The above key target and others, with various initiatives to achieve them, have their own actionsand monitoring arrangement which will be delivered under the transport governance structurescurrently being established.
The 3rd LTP programme will continue to be marketed and promoted as part of the ‘Big Wheel’marketing campaign. Developed by the Greater Nottingham Transport Partnership in 2001, theBig Wheel brand provides an umbrella for all transport activities and in particular has been usedto create awareness and understanding of sustainable and integrated transport and its benefits.
Further to the targets already proposed in the Sustainable Travel City programme and underdevelopment in the 3rd Local Transport Plan there are a number of additional actions that alsohave direct connection to the City’s energy security that will be pursued to 2020.Electricity will increasingly be required for vehicle use, especially in cities where most journeysare shorter and recharging infrastructure can be established to serve a high density of users.
In relation to the Sustainable Energy Strategy, an increased percentage of electric vehicles willalso potentially represent a valuable buffer to a more variable and diverse distributed grid powersupply. Rapidly emerging battery and fuel cell technology could turn cars from simple energyusers to energy vectors.
Strategic Objective 7: To set transport related carbon emissions reduction and technologytargets in the forthcoming 3rd Local Transport Plan which are aligned with the energystrategy and aim to exceed the national Low Carbon Transition Plan targets by 2020. Atthis stage an indicative target of 20% reduction is recommended.

page | 58
The City district heating and power network is a key link between the SES and transport. TheEnviroenergy private wire network has excess power at certain times that is currently sold back tothe grid. This power could be sold on for electric vehicle charging in the City, particularly to CityCouncil fleet vehicles.

page | 59
AIM 6: CREATE LOCAL JOBS AND OPPORTUNITIES IN ENERGYSECTOR BUSINESSES.
Nottingham is the UK’s most energyself-sufficient City. The City ESCO, Enviroenergy,provides heat and in some cases power to a largeproportion of the City centre. This includes thetwo large City shopping centres, the VictoriaCentre and the Broadmarsh Centre, theheadquarters of Her Majesty’s Revenue andCustoms (HMRC), the East MidlandsDevelopment Agency (EMDA) and many CityCouncil offices. Heat is also provided to 4,600homes. Thus low carbon energy security isassured for many City homes, businesses andpublic sector services.
While energy supply is becoming more expensiveand potentially less secure; Nottingham has theunique capacity amongst UK cities of being ableto offer a stable, low carbon energy environment,for many business premises and workforce.
This important selling point for Nottingham,backed up by our geographically central locationwill be of interest to businesses, particularly thoseworking in the energy sector.
We have two major universities with research expertise in low carbon buildings and design. TheUniversity of Nottingham School of the Built Environment is renowned for its work on low carbonbuildings. The universities offer a wealth of academic support and research facilities for energyrelated industry seeking innovative solutions to technical problems, accessible through theuniversities’ Ingenuity programme.
Strategic Objective 1: The City’s unique strength in energy self-sufficiency will be used topromote Nottingham in the UK and Europe as the first choice for location of sustainableenergy related and green tech business, innovation and growth.
Strategic Objective 8: To work closely in partnership with business, universities andtechnology partners to ensure Nottingham accelerates the process and maximises theimpact of demand led innovation in energy technology and management within the City.

page | 60
Carbon footprints within procurement (Scope 3 emissions) are becoming a major target withinpublic sector bodies e.g. procurement emissions made up 60% of the NHS carbon footprint in2008. The demand for lower carbon supply chains from both public and private sector will needto be met through innovative business carbon management practices and improved industrialprocesses. The regional iNets and the universities’ Ingenuity programme, linking businesses withacademic institutions to solve some of these problems, will be essential in ensuring the City andthe region’s businesses are well placed to provide lower carbon services and goods to meetrising demand. If properly supported this should increase the competitivity and growth of localbusinesses, while lowering local carbon emissions.
Nottingham Energy Partnership is providing energy services to domestic properties across thecity. Over the last 10 years through the Greater Nottingham Healthy Housing Service, NEP hasconsistently drawn in more than £1m per annum of national grant funding, enabling theinstallation of physical measures in city properties. This investment has come largely through thegovernments Warm Front programme and utility company CERT69 funding.
The City has already reduced its domestic gas consumption by 16% over the last 5 years,through the work of NEP and local housing associations. This has added £15m per annum to thelocal economy, through reductions in gas bills alone. The City Council with NEP will be working tomaximise the value of the Warm Zone and Community Energy Savings Programme (CESP),building on them to ensure that there is a continually growing and diversifying stream of work forcompanies operating in the domestic sustainable energy sector in the City. Our excellent recordon domestic energy efficiency is good for the city’s economic stability.
69 The Government consulted on proposals to amend the Carbon Emissions Reduction Target (CERT) through theElectricity and Gas (Carbon Emissions Reduction) Order 2008, S.I. 2008/188. This gives effect to a key element of thePrime Minister’s £1 billion Home Energy Saving Programme announcement of 11/09/08. CERT, which commenced inApril 2008, is the Government’s flagship household sector energy and carbon saving scheme. CERT places a 3 year(i.e.: up to March 2011) obligation on energy suppliers to meet ambitious household carbon saving targets. Suppliersmeet their targets by promoting (e.g.: through subsidy) the take-up of energy saving measures, including loft andcavity wall insulation and high-efficiency lighting and appliances.
The Carbon Emissions Reduction Target 2008-2011 (CERT). Relevant documents, including background and scope,are available at: http://www.decc.gov.uk/en/content/cms/consultations/open/cert/cert.aspx

page | 61
Over the next 3 years, through the Warm Zone and CESP programmes, NEP in partnership withthe City Council, Scottish and Southern and Nottingham City Homes will be drawing in £5m to£11m worth of investment into private sector and social housing; upper range dependant on thesuccess of developing CESP programmes. This investment will, through creating demand,support significant employment and training in trades such as insulation installers, plumbers,electricians, solar technology installers and energy surveyors.
With a typical 5-6 year return on investment for energy efficiency work through CERT, Warm Frontand CESP schemes, a £11m investment will represent a further £2.8m per annum in householdbill savings across the City, a large proportion of this money will stay within the city’s economy.With energy prices set to rise substantially over the next 10 years, the enduring and cumulativepositive impact of these measures on the City economy will increase.
The Warm Zone programme offers many opportunities for encouraging local supply chainbusinesses and the mainstreaming or market testing of technological and delivery innovation inthe city.
Many of the large carbon and energy savings required over the next 10 years can be achievedwith readily available technologies; the opportunities in terms of economic growth are in supplychain and in logistics of delivery, rather than technological research and development. Laterincremental savings will however require a new generation of energy efficiency, building materials,processes, energy generation and carbon and energy management technologies; such as phasechange materials, organic LEDs and smart grid management systems.
Nottingham University is at the cutting edge in many areas especially with respect to energy andthe built environment. To ensure that intellectual property developed in Nottingham turns intojobs in Nottingham will require close collaboration between the Universities, city businesses andthe Council. Provision of appropriate local markets for low carbon products, future proofedbusiness facilities with low cost low carbon energy supply, skilled staff and a high city profile forenergy and low carbon business as well as good low carbon, low cost transport links may all helpencourage university spin out businesses to remain within the City.
Strategic Objective 4: To reduce local authority, domestic and ‘industrial and commercial’energy consumption in Nottingham in line with the detailed targets.

page | 62
The business and domestic support programmes will be outlined in the Sustainable EnergyStrategy Action Plan. Alongside national economic incentives, these will increase demand forsmall scale renewable energy technologies from domestic and non-domestic customers in theCity.
Nottingham is host to the global headquarters of Siemens, the leading manufacturer of smartmetering and smart grid solutions in the UK. By 2020 all UK homes and potentially all businesseswill have a smart meter70; Nottingham could take a lead on demonstrating the value of thistechnology.
Nottingham is also host to the headquarters of E.ON UK and E.ON’s UK Research and TrainingCentre.
Locally there are a number of suppliers and installers of renewable and sustainable energytechnologies, many of whom have been supported by the NEP SunGain programme over the last5 years.
Nottingham and the East Midlands also host a large number of companies involved in the windpower supply chain. Romax Technology, based at the Nottingham Science Park, is a majorsupplier of gearbox software and consultancy to the wind industry globally. With wind powertargeted to constitute most of the government’s 28% renewable electricity target by 2020, thisshould be a key area of growth for the city.
In the words of Ed Miliband, Secretary of State of Energy and Climate Change:
“Across business, we can build up the skills to be more resource efficient. Like the internet,saving carbon can become part of how business is done: every financial officer knowing theirsavings and liabilities from carbon, every builder having the skills to build in a way which savesenergy.[...] So alongside the country’s Low Carbon Transition plan, every business, everycommunity will need to be involved. Together we can create a more secure, more prosperous lowcarbon Britain and a world which is sustainable for future generations”. (Foreword, UK LowCarbon Transition Plan, 2009).
70 The Government announced in October 2008 that it intends to mandate electricity and gas smart meters for allhouseholds.For this reason, in May 2009 the Government issued a public consultation making proposals in two areasfundamental to rolling out smart meters to domestic households, these being:• the delivery model or market arrangements for installing and on-going management of smart meters; and
• smart meter functionality.
The consultation also invited views on the type of energy consumption information that should be provided toconsumers to maximise their engagement and on the Government’s expectation that a standalone real-time displaywould be provided with a smart meter.For non-domestic metering, the Government also issued a consultation on advanced/smart metering for small andmedium sized (commercial and public sector) sites in July 2008. DECC’s website on Smart metering for electricityand gas: http://www.decc.gov.uk/en/content/cms/consultations/smart_metering/smart_metering.aspx

page | 63
AIM 7: DEVELOP STRONG EXTERNAL AND COMMUNITYPARTNERSHIPS
To ensure the delivery of the actions and targets set in this Strategy, a City Energy StrategySteering Group will be established, representing business, community and public sectorinterests.
Separate working groups will be established to oversee the delivery of the specific areas of theEnergy Strategy.
Elements of the Strategy will fall under the management of other partnerships; these willcoordinate with and report on progress to the City Energy Strategy Steering Group and TechnicalCoordination group. Communications will play a key part in the success of the Energy Strategyimplementation.
Strategic Objective 8: To work closely in partnership with business, universities andtechnology partners to ensure Nottingham accelerates the process and maximises theimpact of demand led innovation in energy technology and management within the City
Strategic Objective 6: To develop resource and maintain a prioritised action plan anddelivery management structure including key partners and technical experts to deliver theStrategy, with an annual review cycle for the Action Plan and review cycles aligned withnational carbon budgeting periods for the Strategy.

page | 64
AIM 8: SUPPORT LOCAL COMMUNITY ENERGY INITIATIVES
Clear and supportive information, advice and guidance is essential to support energy efficientbehaviour, inform consumer choices and domestic investment in low carbon technologies.
It is essential that provision of technology, subsidy and investment in housing stock is associatedwith support for community groups providing local action at a community and doorstep level.
People will only take up offers if there is a perceived need, and whilst the issues of climatechange, rising energy prices and peak oil are all complex subjects with a national profile, theseissues need to be integrated into peoples’ communities and lifestyle to ensure responsibility istaken at a personal and household level.
Once capacity has been reached in improvingthe thermal and electrical efficiency of buildings,further savings will require a more significantweight to be placed on behaviour change andpromotion of the uptake of efficient appliances.These changes will require a community basedapproach, education support and engagementfor the long term to follow on from investment ininsulation, boilers and renewable energy.
While the City should provide the tools andinvestment to ensure there are no barriers to lowcarbon communities, communities also need tobe able to take ownership of the problems andwork out which solutions are appropriate andworkable for them.
There are a range of local and nationalorganisations such as NEP, TransitionNottingham, Energy Saving Trust, NationalEnergy Action, Global Action Plan, providingadvice, guidance and support to communitiesand individuals.
A number of Nottingham’s communities have Transition Towns groups that raise awareness andsupport action in preparation for peak oil, decreasing energy security and combating climatechange. Existing tenant and resident groups will need to be encouraged to participate ininitiatives as they develop.
Strategic Objective 9: The City and partners will support the development of local andgrass roots organisations seeking to enable their communities to reduce carbonfootprints, energy bills and adapt to inevitable climate change and peak oil.

page | 65
Whilst the message is common to all, communities are complex; geographical, social andeconomic; social mix, different levels of access to money and credit, priorities, and differentlevels of understanding of how these issues relate to everyday life, and different local energyresources. The issues of energy supply, price and climate change alongside the opportunities forsupport will need to be presented and re-presented in many different ways.
To this end support will be provided for local community groups wishing to establish localtargeted energy generating or saving programmes. Communities like the Meadows are alreadytaking a leading role in demonstrating how taking ownership of local energy resources can raisethe profile and local ownership of the issues of climate change and energy supply, soaccelerating local action in energy efficiency and behaviour change. Local communityprogrammes can also attract voluntary sector funding to support more targeted householdsupport, providing opportunities for volunteering and training.

page | 66
5. Energy supply and use in Nottingham
5.1 Historical context, current energy use and generation patterns
Energy use (all figures in GWh)
Table 14: Summary of energy use in Nottingham, broken down by fuel type, by source, and byyear. Note that all figures are provided in gigawatts hour (GWh). Source: NEP, 2009.
Fuel type Detail 2003 2004 2005 2006
Coal Industry & commercial 68.42 60.72 57.55 57.53
Domestic 11.71 2.41 1.27 1.1
Total 80.13 63.13 58.82 58.63
Manufactured fuels Industry & commercial 0.24 0.11 0.55 0.17
Domestic 32.73 0 0.07 0.06
Total 32.97 0.11 0.62 0.23
Petroleumproducts
Industry & commercial 202.23 209.83 221.18 222.35
Domestic 32.79 8.21 8.3 8.48
Road Transport 1,209.77 1,210.11 1,377.20 1,378.53
Rail 8.77 24.12 18.33 18.67
Total Transport 1,218.54 1,234.23 1,395.53 1,397.20
Total ex-transport 235.02 218.04 229.48 230.82
Natural Gas Industry & commercial 2,039.93 1,721.83 1,590.50 1,447.37
Domestic 2,269.82 2,043.27 2,018.72 1,919.22
Total 4,309.75 3,765.10 3,609.22 3,366.59
Electricity Industry & commercial 840.98 961.76 1,054.32 1,007.92
Domestic 501.44 519.96 528.67 522.51
Total 1,342.42 1,481.71 1,582.99 1,530.43
Total energyconsumed inNottingham fromrenewables andwaste
Total 143.61 152.5 139.75 154.67
% 2.39% 2.76% 2.55% 2.98%
Totals byConsuming sector
Industry & commercial 3,151.80 2,954.25 2,924.10 2,735.34
Domestic 2,848.49 2,573.85 2,557.03 2,451.37
Transport 1,218.54 1,234.23 1,395.53 1,397.20
Total energy used 7,218.83 6,762.33 6,876.66 6,583.91

page | 67
Energy Generated (all figures in GWh)
Table 15: Summary of energy generation in Nottingham, broken down by fuel type, by source,and by year. Note that all figures are provided in gigawatts hour (GWh). Source: NEP, 2009
Fuel type Detail 2003 2004 2005 2006
Gas CHP electricity(Total generated -Estimated from EU etsallowances)
Industry & commercial 191.79 190.42 192.02 190.71
Gas CHP heat (Totalgenerated- Estimatedfrom Eu ets allowances)
Industry & commercial 375.96 371.99 382.49 371.97
Total power generatedin city (Renewable andwaste)
Total 59.11 63.63 43.9 64.05
% city electricity use 4.40% 4.29% 2.77% 4.19%
Total heat generated incity (Renewable andwaste)
Total 128.08 133.6 121.89 127.22
% of total nonelectric/non transportenergy demand
2.75% 3.30% 3.13% 3.48%
Total power generatedin city (gas CHP,Renewable and waste)
Total 250.9 254.05 235.92 254.76
% Total power demand(assuming all usedlocally)
15.75% 14.64% 12.97% 14.27%
Total heat generated incity (gas CHP,Renewable and waste)
Total 504.04 505.59 504.37 499.19
% of total nonelectric/non transportenergy demand
10.82% 12.49% 12.94% 13.65%
Total energy generatedin city
Total 754.94 759.64 740.29 753.95
% of total energyconsumption
10.46% 11.23% 10.77% 11.45%

page | 68
The Sustainable Community Strategy target of 20% of energy to be produced within theGreater Nottingham area from renewable or low/zero carbon sources relates to the final 2 rows inthe table above. Nottingham currently generates 11.45% of its total energy use from low or zerocarbon sources.
Figure 16: Nottingham’s total electricity and gas consumption between 2003 and 2007 (5-yearperiod), broken down into end consumer type. Note that all figures are provided in gigawattshour (GWh). Source: NEP, 2009.
Nottingham’s overall gas and electricity consumption has been falling year on year since 2003.This has been largely due to significant reductions in gas consumption, a 28% fall in industrialand commercial gas use and a 17.4% fall in domestic gas use. Domestic energy savings are wellabove national trends. Electricity use has grown in both domestic and non-domestic consumers,broadly in line with national trends.

page | 69
Figure 17: Nottingham’s totalnon-transport energy usebetween 2003 and 2006 (4-yrperiod), broken down intoenergy source and percentagewithin the total mix. Source:NEP, 2009.
Gas use has fallen faster thanelectricty use. Electricity use isnow a larger proportion of thefinal energy use in Nottingham.The amount of energy consumedfrom renewables and waste hasremained unchanged since 2003,however as total energy use from
fossil fuels and electricty has fallen, renewables and waste are making a growing proportion ofthe residual energy use. Energy consumed from renewables and waste is largely that which isdistributed by the City district heating network.
Figure 18: Nottingham’s total energy use during 2006, broken down proportionally into endconsumer type. Source: NEP, 2009.

page | 70
Figure 19: Nottingham’s totalenergy use during 2006,broken down proportionallyinto energy use type. Source:NEP, 2009.
Electricity demand is not falling as fast as gas. There are a number of reasons for this. There hasbeen an increased use of cooling in the UK, both in commercial and domestic buildings.
Electrical air conditioning now accounts for 4% of final electricity consumption and is predictedto rise further with rising global temperatures. Cooling demand in the service sector alone couldaccount for 6% of final electricity consumption by 202071. In the commercial sector, coolingconsumes more energy than heating, and climate change is likely to lead to even more demandfor cooling both in homes and workplaces.
71 Department for Environment Food and Rural Affairs: Policy Brief: Improving the Energy Performance ofAir Conditioning Products, (2008) July LMMhttp://www.mtprog.com/spm/files/download/byname/file/2006-07-10%20Policy_Brief_Air_Con_doc%20fin.pdf
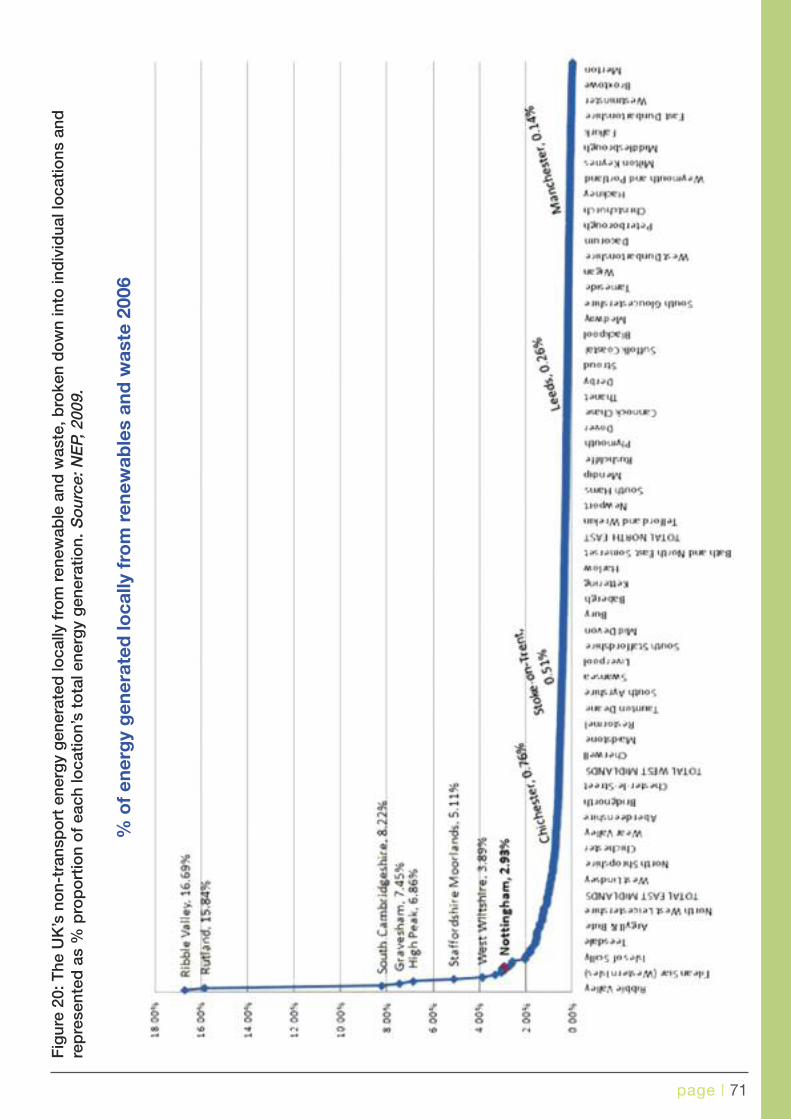
page | 71
Fig
ure
20:T
heU
K’s
non-
tran
sport
ener
gy
gen
erat
edlo
cally
from
rene
wab
lean
dw
aste
,bro
ken
dow
nin
toin
div
idua
lloca
tions
and
repre
sent
edas
%pro
port
ion
ofea
chlo
catio
n’s
tota
lene
rgy
gen
erat
ion.
Sou
rce:
NEP,
2009
.
%ofenergygenerated
locally
fromrenewablesandwaste2006

page | 72
Fig
ure
21:T
heU
K’s
reduc
tion
indom
estic
ener
gy
gas
cons
umptio
nbet
wee
n20
03an
d20
07(5
-yrper
iod),
bro
ken
dow
nin
toin
div
idua
llo
catio
nsan
dre
pre
sent
edas
%re
duc
tion
achi
eved
atea
chlo
catio
n.S
ourc
e:N
EP,
2009
.
%reductionondomesticgas
consum
ption2003-2007

page | 73
Transport
Table 16: Total fuel consumption in Nottingham between 2003 and 2007 (5-yr period), brokendown by different types of road transport systems. Note that figures are represented inthousands of tonnes of fuel. Source: NEP, 2009.
2003 2004 2005 2006 2007
Buses 6.0 5.5 4.8 4.9 5.0
Diesel Cars 10.3 11.1 14.4 15.4 16.2
Petrol Cars 53.7 52.8 57.2 55.8 53.2
Motor Cycles 0.5 0.4 0.6 0.6 0.6
HGV 10.4 10.6 12.4 12.8 12.6
Diesel LGV 11.4 11.9 16.0 16.2 16.7
Petrol LGV 1.5 1.4 1.4 1.4 1.2
Personal (1) 70.5 69.8 77 76.7 75
Freight (2) 23.3 23.9 29.8 30.4 30.5
Total 93.8 93.7 106.8 107.1 105.5
(1) Personal travel includes buses, diesel cars, petrol cars and motorcycles
(2) Freight includes HGV, diesel LGV and petrol LGV
Figure 22: Total fuelconsumption inNottingham between 2003and 2007 (5-yr period),broken down by %proportional contributionof different types of roadtransport systems.Source: NEP, 2009.
While Nottingham’s transport fuel consumption rose between 2004 and 2005, the trend has beenreversed since then, with fuel use falling year on year. Petrol vehicle use in particular is falling withan increase in use of more efficient and lower CO2 emission diesel.

page | 74
6. Financing the strategy
There is a need for several types of finance to ensure the timely implementation of the Strategy.
• Finance for the large capital energy generation projects.• Finance for the major public, business and domestic energy efficiency
programmes.• Finance to support the delivery structures required to ensure the Strategy
is coordinated, delivered and monitored.
The Action Plan associated with the Strategy provides a structure for management and deliveryof the strategic objectives and targets with timescales and priorities.
While there are essential roles in the delivery and management of the Strategy in the areas oftransport, research, industrial growth and employment, and policy, the entitiesdelivering in these areas also have wider roles that stretch beyond the Energy Strategy. That said,each of the partnerships above will need some support and resource to deliver elements from theEnergy Strategy and to ensure that they are able to fund specific energy related projects. Thecoordinating, monitoring and reporting role will also need to be adequately resourced.
The two key entities for direct delivery of the Strategy are Enviroenergy in terms of energygeneration programmes and Nottingham Energy Partnership, in terms of energy savingprogrammes and coordination.
A closer relationship between NEP and Enviroenergy and success in accessing major capitalfunding for energy generating and saving programmes is critical in ensuring the success of theStrategy.
Between Enviroenergy and NEP the City has the essential elements of a city wide ESCO, NEPdelivering significant energy saving across all sectors and Enviroenergy delivering city basedenergy generation, united under a comprehensive city wide Energy Strategy.
With rising energy and carbon costs, homes and businesses in the City may struggle to pay bills.The costs to deliver public services will also rise with fuel and energy costs. Conversely asEnviroenergy grows and diversifies, increasing revenue from higher energy prices and incentivesto generate low carbon heat and power should make Enviroenergy increasingly profitable. Thesereturns will need to be recycled to further energy conservation and generation initiatives to easethe impact of higher prices for residents and business.
While there will be other projects and novel structures delivering some specific innovativeprogrammes, such as Mozes, the community ESCO within the Meadows, NEP and Enviroenergywill act as the main delivery vehicles for ensuring the key targets of the Energy Strategy are met.
Many of the energy generating technologies covered in the Energy Strategy represent attractiveinvestment opportunities. Enviroenergy is the ideal vehicle to own and manage these assets,either wholly or in a Joint Venture with others. The Council will consider the use of prudentialborrowing to purchase capital assets for Enviroenergy to ensure revenue from energy generationand distribution is retained to support the further expansion of the heat network and fund energyefficiency measures in the City.

page | 75

page | 76
7. Communication, monitoring & review
The Sustainable Energy Strategy will be reviewed on a 5 year cycle in line with the end of each ofthe national carbon budget cycles to ensure that all targets and objective are still relevant,realistic and are being met. The 1st review will be in 2 years, at the end of 2011, as the currentcarbon budgeting period is already underway. Following reviews will be at the end of 2016 andthe end of 2021. Through 2020 the Strategy for the next 2 carbon budget periods (to 2030) will bedeveloped.
The associated Action Plan will have an annual review cycle to ensure that actions are relevant,timely and prioritised to contribute to the strategic objectives and targets.
A Steering Group will meet bimonthly.
A Technical Coordination group will meet monthly to ensure coordination across the delivery ofthe action plan to meet the specific targets, and sub groups at least bi-monthly to progressspecific areas of the Action Plan.

page | 77
8. References and further reading
➢ HM Government (2009). The UK Renewable Energy Strategy. The Stationary Office (TSO),Norwich. Available at:http://www.decc.gov.uk/en/content/cms/publications/lc_trans_plan/lc_trans_plan.aspx
➢ HM Government (2009). The UK Low Carbon Transition Plan: National Strategy for Climateand Energy. The Stationary Office (TSO), Norwich. Available at:http://www.decc.gov.uk/en/content/cms/publications/lc_trans_plan/lc_trans_plan.aspx
➢ HM Government (2009). The Low Carbon Industrial Strategy. Crown, London. Available at:http://www.decc.gov.uk/en/content/cms/publications/lc_trans_plan/lc_trans_plan.aspx
➢ DECC (2009). Energy Security: A national challenge in a changing world. Report by MalcolmWicks MP. DECC, London. Available at:www.decc.gov.uk/en/content/cms/what_we_do/change_energy/int_energy/security/security.aspx
➢ The Community Energy Saving Programme (CESP). Relevant documents, including theGovernment’s response to the consultation on CESP policy proposals and background to theprogramme, are available at:http://www.decc.gov.uk/en/content/cms/consultations/open/cesp/cesp.aspx
➢ The Carbon Emissions Reduction Target 2008-2011 (CERT). Relevant documents, includingbackground and scope, are available at:http://www.decc.gov.uk/en/content/cms/consultations/open/cert/cert.aspx
➢ DECC’s website on Feed-in-Tariffs (FITs):http://www.decc.gov.uk/en/content/cms/what_we_do/uk_supply/energy_mix/renewable/policy/feedin_tarriff/feedin_tarriff.aspx
➢ Department for Transport (DfT) (2009). Low Carbon Transport: A Greener Future. A CarbonReduction Strategy for Transport. The Stationary Office (TSO), Norwich. Available at:http://www.decc.gov.uk/en/content/cms/publications/lc_trans_plan/lc_trans_plan.aspx
➢ DECC’s website on Smart metering for electricity and gas:http://www.decc.gov.uk/en/content/cms/consultations/smart_metering/smart_metering.aspx
➢ OPSI (2007). The Renewable Transport Fuel Obligations Order – Statutory Instrument No3072. Available at: http://www.opsi.gov.uk/si/si2007/pdf/uksi_20073072_en.pdf
➢ EU Parliament and EU Council (2003). DIRECTIVE 2003/30/EC OF THE EUROPEANPARLIAMENT AND OF THE COUNCIL of 8 May 2003on the promotion of the use of biofuelsor other renewable fuels for transport. Available at:http://ec.europa.eu/energy/res/legislation/doc/biofuels/en_final.pdf

page | 78
➢ Committee on Climate Change (CCC) (2008). Building a low-carbon economy – The UK’scontribution to tackling climate change. The First Report of the Committee on ClimateChange, December 2008. The Stationary Office (TSO), Norwich. Available at:http://www.theccc.org.uk/
➢ The CRC Energy Efficiency Scheme homepage:http://www.decc.gov.uk/en/content/cms/what_we_do/lc_uk/crc/crc.aspx
➢ Sustainable Operations in the Government’s Estate (SOGE) Targets available at:http://www.defra.gov.uk/sustainable/government/gov/estates/index.htm
➢ The East Midlands Regional Assembly (EMRA) (2009). Reviewing Renewable Energy andEnergy Efficiency Targets for the East Midlands. Report for EMRA produced by FaberMaunsell. Available at:http://www.emra.gov.uk/files/reviewing-renewable-and-energy-efficiency-targets.pdf
➢ OPSI (2009). The Carbon Budgets Order 2009 – Statutory Instrument No 1259. Available at:http://www.opsi.gov.uk/si/si2009/pdf/uksi_20091259_en.pdf
➢ OPSI (2009). The Climate Change Act 2008 (2020 Target, Credit Limit and Definitions) Order2009 – Statutory Instrument No 1259. Available at:http://www.opsi.gov.uk/si/si2009/pdf/uksi_20091258_en.pdf
➢ OPSI (2008). The Climate Change Act 2008. Available at:http://www.opsi.gov.uk/acts/acts2008/pdf/ukpga_20080027_en.pdf
➢ HMGO and HM Treasury (2009). Building a low-carbon economy: implementing the ClimateChange Act 2008. Available at: http://www.hmtreasury.gov.uk/bud_bud09_carbon.htm
➢ EU Parliament and EU Council (2001). DIRECTIVE 2001/80/EC OF THE EUROPEANPARLIAMENT AND OF THE COUNCIL of 23 October 2001 on the limitation of emissions ofcertain pollutants into the air from large combustion plants. More information on the revisedLCPD can be found at:http://eur-lex.europa.eu/LexUriServ/site/en/oj/2001/l_309/l_30920011127en00010021.pdf
➢ Office for National Statistics (ONS): http://www.statistics.gov.uk
➢ Nottingham City Council (NCC) (2008). Motion in the name of Councillor Bull – Forthcomingimpact of Peak Oil. Internal minutes of the meeting of the Nottingham City Council, held atthe Council House, Nottingham, on Monday 8th December 2008 at 3:15pm, pages 141-143.
➢ NCC (2009). Nottingham City Council. Greater Nottingham Aligned Core Strategy – Issuesand Options Paper June 2009. Section 3.10.2, page 111. Available at:http://www.nottinghamcity.gov.uk/CHttpHandler.ashx?id=9535&p=0
➢ Nottingham Warm Zone homepage: http://nottinghamwarmzone.com

page | 79
➢ The Nottingham Declaration on Climate Change (2000). Available at:http://www.energysavingtrust.org.uk/nottingham
➢ One Nottingham (2009). City of Nottingham Sustainable Community Strategy 2020. Family,Neighbourhood, City: Raising Aspirations. Full Council Version. July 2009. Available at:http://www.nottinghamcity.gov.uk/onenottingham/CHttpHandler.ashx?id=10663&p=0
➢ The Covenant of Mayors homepage:http://www.eumayors.eu/covenant_cities/city_341/index_en.htm
➢ NEP (2009). Nottingham TreeStation: A Research report on the analysis of the energypotential, processing options and possible end use of waste woody biomass arising from thecity of Nottingham. A report for Nottingham Energy Partnership (NEP), prepared by ReNU Ltdet al. Available at:http://www.nottenergy.com/renewable-energy/biomass
➢ The Big Wheel homepage: http://www.thebigwheel.org.uk/
➢ Trent Park Developments, developers of the River Crescent complex. More details availableat: http://www.trentpark.co.uk/
➢ Enviroenergy homepage: http://www.enviroenergy.co.uk/
➢ Transition Towns homepage: http://www.transitiontowns.org/
➢ The Transition Nottingham homepage: http://www.transitionnottingham.org.uk/
➢ United Nations Environment Programme (UNEP) (2009). Climate Change ScienceCompendium. http://www.unep.org/compendium2009/
➢ The Committee on Climate Change (CCC) homepage: http://www.theccc.org.uk/
➢ The US Energy Information Administration (EIA): http://www.eia.doe.gov/
➢ The Met Office Hadley Centre, Exeter, UK:http://www.metoffice.gov.uk/climatechange/science/hadleycentre/
➢ uSwitch.com Press Room(2009). Fuel poverty: will the government ever get a grip? Pressrelease, 21/10/09. Available at: http://www.uswitch.com/press-room/
➢ Office for Gas and Electricity Markets (OfGEM) (2009). Project Discovery – Energy MarketScenarios. Consultation paper No 122/09. Available at:http://www.ofgem.gov.uk/markets/whlmkts/discovery/Documents1/DiscoveryScenarios_ConDoc_FINAL.pdf
➢ Hulme, M., et al. (2002). Climate Change Scenarios for the United Kingdom: The UKCIP02Scientific Report. Tyndall Centre for Climate Change Research, School of Environmental

page | 80
Sciences, University of East Anglia, Norwich, UK. 120pp. Available at:http://www.ukcip.org.uk/index.php?option=com_content&task=view&id=353&Itemid=408
➢ UKCIP (2009). The UK Climate Projections (UKCP09). All resources available at:http://www.ukcip.org.uk/index.php?option=com_content&task=view&id=163
Images
➢ Kim Stutchbury, Southwell flooding image, page 20. Available at:http://www.bbc.co.uk/nottingham/content/image_galleries/flooding_june_2007_gallery.shtml?141
➢ Strawsons Energy, producers of Kool Energy. Provided biomass images situated on pages40 and 50. www.strawsonenergy.co.uk
➢ Wind and Sun, installers of wind and solar systems provided Colwick Park wind and PVsystem image, page 43. www.windandsun.co.uk
➢ Beeston Weir image, page 52. Taken by ‘Thax’. Available at:http://www.panoramio.com/photo/11123498
➢ All images featured in this document, other than those referenced above, are copyright ofNEP.

page | 81
9. Contributor’s credit
Steering group
• Cllr Graham Chapman (Deputy Leader Nottingham City Council)• Cllr Katrina Bull (Portfolio Holder for Sustainability, NCC)• Barry Horne (Corporate Director - Environment and Regeneration)• Andy Vaughan (Director of Environmental Services)• Neil Horsley (Chief Executive, Nottingham Development Enterprise)• Alan Swales (Stewart Regeneration Partnership)• Julia Dale (Nottingham Trent University)• Philip Angus (General Manager, Nottingham Energy Partnership)
Lead
• Jerome Baddley (Sustainable Energy Development Manager, Nottingham EnergyPartnership)
Technical group
• Cllr David Smith (NCC)• Grant Butterworth (Head of Planning, Transport and Intelligence Strategy, NCC)• Paul Riley (Head of Waste Management, NCC)• Antony Greener (Waste Strategy & Development Manager, NCC)• Keith Elliot (Team Leader Energy, Mechanical Services and Health and Safety)
Advice, Technical Excellence and Reactive Maintenance, NCC)
• Mathew Easter (Sustainable Development Manager, NCC)• Andrew Estrop (Director, Enviroenergy)• Richard Wood (Planning, Transport & Intelligence Strategy, NCC)• Miranda Cumberbatch (Affordable Warmth Programme Manager, Nottingham Energy
Partnership)• Eric Rennie (Planning, NCC)• Dr Robin Wilson (Nottingham University)• John Beardmore (Director-T4 Sustainability)• Laura Mayhew Manchon (Project support, NEP)

page | 82
Nott
ingha
mC
ityC
oun
cil:
Ene
rgy
Str
ateg
yA
ctio
nP
lan
Deliverystructure
The
stra
tegy
will
be
del
iver
edun
der
the
One
Not
tingh
amst
ruct
ure,
alon
gsid
eth
eC
limat
eC
hang
eS
trat
egy.
The
del
iver
yst
ruct
ure
bel
oww
illb
eus
edto
pro
vid
est
eerin
g,te
chni
cals
upp
ort
and
over
sigh
tto
ensu
reth
eta
rget
sw
ithin
clim
ate
and
sust
aina
ble
ener
gyst
rate
gies
are
met
tosu
pp
ort
the
key
loca
land
natio
nalt
arge
ts.A
ctio
nsw
ithin
the
pla
nar
egi
ven
ana
med
lead
,tim
esc
ale
and
det
aile
dag
ains
ta
del
iver
ygr
oup
.Th
egr
oup
sb
elow
will
be
resp
onsi
ble
for
mee
ting
regu
larly
toen
sure
sup
por
tan
dco
ord
inat
ion
inth
ed
eliv
ery
ofth
eir
actio
nsan
dan
nual
lyre
view
ing
thei
rac
tions
tod
eter
min
efu
rthe
rke
yp
riorit
ies
inth
eir
area
.Num
ber
edgr
oup
sha
veac
tions
det
aile
dag
ains
tth
emin
the
pla
n.

page | 83
Nott
ing
ha
mC
ity
Co
uncil:
En
erg
yS
trate
gy
Actio
nP
lan
Gro
up
:1.
Govern
ance
Gro
up
Le
ad
:C
limate
and
Energ
yS
trate
gy
Ste
eri
ng
Gro
up
,re
port
ing
toG
ree
nN
ott
ingh
am
(On
eN
ott
ing
ha
mLS
Pth
em
egro
up)
Re
fn
o.
Re
late
s
toA
ims
Acti
on
Bri
ef
Acti
on
Le
ad
Pri
ori
ty
(hig
he
st,
hig
h,
me
diu
m,
low
)
Targ
et
date
Revie
w
date
SO
6
7
To
de
ve
lop
res
ou
rce
an
dm
ain
tain
ap
rio
riti
se
da
cti
on
pla
n
an
dd
eli
very
ma
na
ge
me
nt
str
uctu
rein
clu
din
gk
ey
part
ners
an
dte
ch
nic
al
ex
pert
sto
deli
ve
rth
es
trate
gy,
wit
ha
n
an
nu
al
revie
wcy
cle
for
the
acti
on
pla
na
nd
rev
iew
cycle
s
ali
gn
ed
wit
hn
ati
on
al
ca
rbo
nb
ud
ge
tin
gp
eri
od
sfo
rth
e
str
ate
gy.
Clim
ate
and
Ene
rgy
Str
ate
gy
Ste
erin
g
Gro
up
hig
h
Sep-1
0S
ep-1
1
Nott
ingha
mC
ityC
oun
cil:
Ene
rgy
Str
ateg
yA
ctio
nP
lan

page | 84
Nott
ing
ha
mC
ity
Co
uncil:
En
erg
yS
trate
gy
Actio
nP
lan
Gro
up
:2.
Energ
yS
avin
gs
Pro
gra
mm
es
-Public
secto
r
Gro
up
Le
ad
:N
ott
ingh
am
City
Cou
ncil
Ref
no
.
Re
late
s
toA
ims
Acti
on
Bri
ef
Le
ad
Pri
ori
ty
(hig
he
st,
hig
h,
me
diu
m,
low
)
Ta
rge
t
date
Revie
w
date
SO
4
To
red
uc
eL
A,
Do
me
sti
ca
nd
'In
du
str
ial
an
dc
om
me
rcia
l'
en
erg
yc
on
su
mp
tio
nin
No
ttin
gh
am
inli
ne
wit
hth
e
de
tail
ed
targ
ets
2.1
1
City
Co
uncil
top
lan
an
dm
on
itor
its
inte
rna
lcarb
on
reductio
n
(NI
185)
targ
ets
thro
ug
ha
Clim
ate
Cha
nge
Pan
el
NC
Chig
hS
ep-1
0
2.2
1
City
Co
uncil
tore
locate
an
dcentr
alis
eserv
ices
toenerg
y
eff
icie
nt
build
ings
i.e.
Loxle
yH
ouse
NC
Chig
h201
0
2.3
1
To
reduce
the
City
NH
Sene
rgy
con
su
mption
thro
ugh
a
pla
nn
ed
Carb
on
Re
duction
Pro
gra
mm
e
City
NH
Shig
hA
ug-1
0
2.4
6,7
Esta
blis
ha
pu
blic
and
volu
nta
rysecto
rorg
an
isatio
nalca
rbo
n
footp
rinting
and
carb
on
reductio
nsup
po
rtpro
gra
mm
e.
NE
Phig
hD
ec-1
0
2.5
1,4
,5
City
council
toesta
blis
hele
ctr
icvehic
lecha
rgin
gp
oin
tsfo
r
fleet,
connecte
dto
Envir
oe
nerg
ylo
wcarb
on
private
wir
e
supp
ly
NC
Cm
ediu
mJu
n-1
1
2.6
1,4
,5
City
council
toconn
ect
Loxle
yH
ouse
po
wer
sup
ply
to
Envir
oen
erg
ylo
wcarb
on
private
wire
su
pp
ly
NC
Chig
hJu
n-1
1
Nott
ingha
mC
ityC
oun
cil:
Ene
rgy
Str
ateg
yA
ctio
nP
lan

page | 85
Gro
up
:3.
Energ
yS
avin
gs
Pro
gra
mm
es-
Do
mestic
an
dvo
lunta
rysecto
r
Gro
up
Le
ad
:N
ott
ingh
am
Energ
yP
art
ners
hip
Ref
no
.
Re
late
s
toA
ims
Acti
on
Bri
ef
Le
ad
Pri
ori
ty
(hig
he
st,
hig
h,
me
diu
m,
low
)
Ta
rge
t
date
Revie
w
date
SO
4
To
red
uc
eL
A,
Do
me
sti
ca
nd
'In
du
str
ial
an
dc
om
me
rcia
l'
en
erg
yc
on
su
mp
tio
nin
No
ttin
gh
am
inli
ne
wit
hth
e
de
tail
ed
targ
ets
SO
9T
he
cit
ya
nd
part
ne
rsw
ill
su
pp
ort
the
de
ve
lop
me
nt
of
loc
al
an
dg
ras
sro
ots
org
an
isa
tio
ns
se
ek
ing
toe
na
ble
the
irc
om
mu
nit
ies
tore
du
ce
ca
rbo
nfo
otp
rin
ts,
en
erg
y
bil
lsa
nd
ad
ap
tto
ine
vit
ab
lecli
ma
tec
ha
ng
ea
nd
pe
ak
oil
.
3.1
2,6
Co
mple
teall
cavity
and
loft
insu
latio
nm
ea
sure
sin
all
tenure
s
thro
ug
hare
ab
ase
d,
co
mm
unity
an
dta
rgete
dpro
gra
mm
es
NE
Phig
hest
Ja
n-1
2
3.2
2,6
,7,8
Esta
blis
hpilo
tsolid
wa
llin
su
latio
npro
jects
usin
gC
om
munity
Ene
rgy
Savin
gs
Pro
gra
mm
e(C
ES
P)
fundin
gacro
ss
tenure
s
NE
Phig
hest
Apr-
10
3.3
2
Ensu
reth
at
energ
ycu
rre
nt
cost
mon
itors
are
ava
ilable
fro
m
all
the
City
sle
ndin
glib
raries
NE
Phig
hA
pr-
10
3.4
2,4
,6
Sourc
efu
ndin
gto
esta
blis
han
IAG
,m
ark
etin
gan
dcusto
mer
supp
ort
pro
gra
mm
eto
accele
rate
upta
ke
of
do
me
stic
and
com
munity
PV
inth
ecity,
capitaliz
ing
on
the
govern
ments
Fe
ed
inT
ariff
s.
NE
Pm
ediu
mS
ep-1
0
3.5
2,6
,8E
xpa
nd
the
CE
SP
pilo
tare
as
toall
su
itab
leho
mes
inth
ecity
NE
Phig
hJa
n-1
2
3.6
2,4
,8E
sta
blis
ha
cityw
ide
inte
rest
free
gre
en
loans
pro
gra
mm
eN
EP
mediu
mA
pr-
11
3.7
2,4
,6,8
Sourc
efu
ndin
gto
Supp
ort
Sung
ain
IAG
,m
ark
etin
gan
d
custo
mer
su
pp
ort
pro
gra
mm
eto
acce
lera
teupta
ke
of
do
mestic
and
co
mm
un
ity
SW
Hin
the
city
NE
Pm
ediu
mA
pr-
11
3.8
2,6
,8
Work
with
volu
nta
rysecto
rpa
rtners
todevelo
pco
mm
unity
energ
ysavin
gs
su
pp
ort
pro
gra
mm
es
tom
atc
hca
pitalgra
nts
and
fundin
gfo
re
nerg
yeff
icie
ncy
pro
vid
ed
thro
ug
hC
ES
Pand
Warm
Zo
ne
NE
Pm
ediu
mS
ep-1
0
Nott
ingha
mC
ityC
oun
cil:
Ene
rgy
Str
ateg
yA
ctio
nP
lan
3.9
2,6
,8
Th
ecity
council
will
sup
port
and
part
icip
ate
inth
edevelo
pm
ent
of
Me
ad
ow
sO
zo
ne
Co
mm
unity
Energ
yltd
(MO
ZE
S)
NC
Cm
ediu
mJu
l-1
0

page | 86
Gro
up
:4.
Energ
yS
avin
gs
Pro
gra
mm
es-
Busin
ess
secto
r
Gro
up
Le
ad
:N
ott
ingh
am
City
Co
un
cil
Ref
no
.
Re
late
s
toA
ims
Acti
on
Bri
ef
Le
ad
Pri
ori
ty
(hig
he
st,
hig
h,
me
diu
m,
low
)
Ta
rge
t
date
Revie
w
date
SO
4
To
reduce
LA
,D
om
estic
and
'Industr
ialand
co
mm
erc
ial'
energ
yconsu
mption
inN
ott
ingh
am
inlin
ew
ith
the
deta
iled
targ
ets
3,6
,7
Esta
blis
ha
busin
ess
susta
ina
ble
energ
ysup
port
serv
ice
to
pro
vid
eIA
Ga
rou
nd
ca
rbo
nm
ana
ge
ment,
ren
ew
able
energ
y
and
ene
rgy
savin
gs
op
port
unitie
sto
en
sure
Nott
ingha
m
busin
esses
are
well
pla
ce
din
term
sof
energ
ysecurity
and
in
pro
vid
ing
their
serv
ices
NC
Chig
hS
ep-1
0
3,7
Esta
blis
ha
City
Busin
ess
Energ
yT
ask
Gro
up
NC
Cm
ediu
mJa
n-1
1
4,7
Work
with
bu
sin
esses
tod
ete
rmin
ein
dustr
ialor
reta
ilsites
in
the
city
suitable
for
bio
mass
CH
P,
localis
ed,
dis
tric
tor
part
ners
hip
ene
rgy
solu
tions.
NC
Chig
hA
pr-
11
3
Encou
rage
and
su
ppo
rta
rapid
sw
itch
over
tosm
art
mete
rin
g
for
gas
and
ele
ctr
icity
am
ongst
non-d
om
estic
en
erg
yusers
in
the
city
.
NC
Chig
hA
pr-
11
Nott
ingha
mC
ityC
oun
cil:
Ene
rgy
Str
ateg
yA
ctio
nP
lan

page | 87
Nott
ing
ha
mC
ity
Co
uncil:
En
erg
yS
trate
gy
Actio
nP
lan
Gro
up
:5.
Energ
yG
enera
tion
Pro
gra
mm
es
Le
ad
:N
ott
ingh
am
City
Cou
ncil
Ref
no
.
Re
late
s
toA
ims
Acti
on
Bri
ef
Le
ad
Pri
ori
ty
(hig
he
st,
hig
h,
me
diu
m,
low
)
Ta
rge
t
date
Re
vie
w
date
SO
3T
od
ev
elo
pth
ecit
ys
insta
lle
dlo
wo
rzero
carb
on
en
erg
yg
en
era
tio
na
nd
dis
trib
uti
on
ca
pa
cit
yin
lin
ew
ith
the
de
tail
ed
targ
ets
inth
eN
ott
ing
ha
mS
us
tain
ab
le
En
erg
yS
trate
gy.
Envir
oen
erg
y0
SO
2M
ajo
rca
pit
al
inv
es
tme
nts
de
tail
ed
wit
hin
the
En
erg
y
Str
ate
gy
an
dit
sacti
on
pla
nto
be
as
se
ss
ed
for
deli
ve
ry
thro
ug
hin
no
va
tiv
ep
art
ne
rsh
ips
,in
clu
din
gw
ith
En
vir
oe
nerg
y,
the
Cit
ys
ES
CO
an
dd
istr
ict
he
ati
ng
pro
vid
er.
Th
isw
ill
en
ab
leE
nvir
oe
ne
rgy
tob
uil
da
mix
ed
po
rtfo
lio
of
ge
ne
rati
on
an
din
co
me
for
co
nti
nu
ou
sre
-in
ve
stm
en
tin
en
erg
ye
ffic
ien
cy
an
d
ge
ne
rati
on
inN
ott
ing
ha
m.
NC
C0
5.1
2,4
,6
Develo
pa
localbio
mass
aggre
gation,
pro
cessin
gand
transfe
rsite
tosupp
ort
the
localsup
ply
ch
ain
of
bio
mass
fuelfr
om
waste
and
su
sta
inab
lym
an
ag
ed
wo
od
sourc
es.
Envir
oen
erg
yhig
hest
De
c-1
1
5.2
Work
with
City
PC
Ta
nd
Nott
ingh
am
Un
ivers
ity
Ho
spitals
to
supp
ort
conve
rsio
nof
the
city
hospitalco
al-
fire
dheat
sta
tion
toa
low
er
carb
on
fuel
Envir
oen
erg
y/
Nu
H
hig
hest
De
c-1
2
5.3
2,4
,6B
uild
ala
rge
exe
mp
lar
Bio
mass
CH
Pp
lant.
Envir
oen
erg
yhig
hD
ec-1
2
5.4
3,4
,5
Develo
pth
ecap
acity
of
Envir
oen
erg
yto
maxim
ise
opp
ort
un
itie
sin
localele
ctr
icity
sale
svia
pri
vate
wir
e,
inclu
din
gevalu
ation
of
the
use
of
Enviroe
ne
rgy
ele
ctr
icity
to
po
we
rele
ctr
icve
hic
les
e.g
.:C
ity
Cou
ncil
fleet,
tra
m.
Envir
oen
erg
yhig
hA
pr-
11
5.5
4
Esta
blis
ha
case
and
locatio
nfo
ran
an
aero
bic
dig
este
r
pla
nt
totu
rnth
ecity
sgre
en
and
foo
dw
aste
into
energ
yan
d
co
mp
ost.
NC
Cm
ediu
mA
pr-
11
Nott
ingha
mC
ityC
oun
cil:
Ene
rgy
Str
ateg
yA
ctio
nP
lan
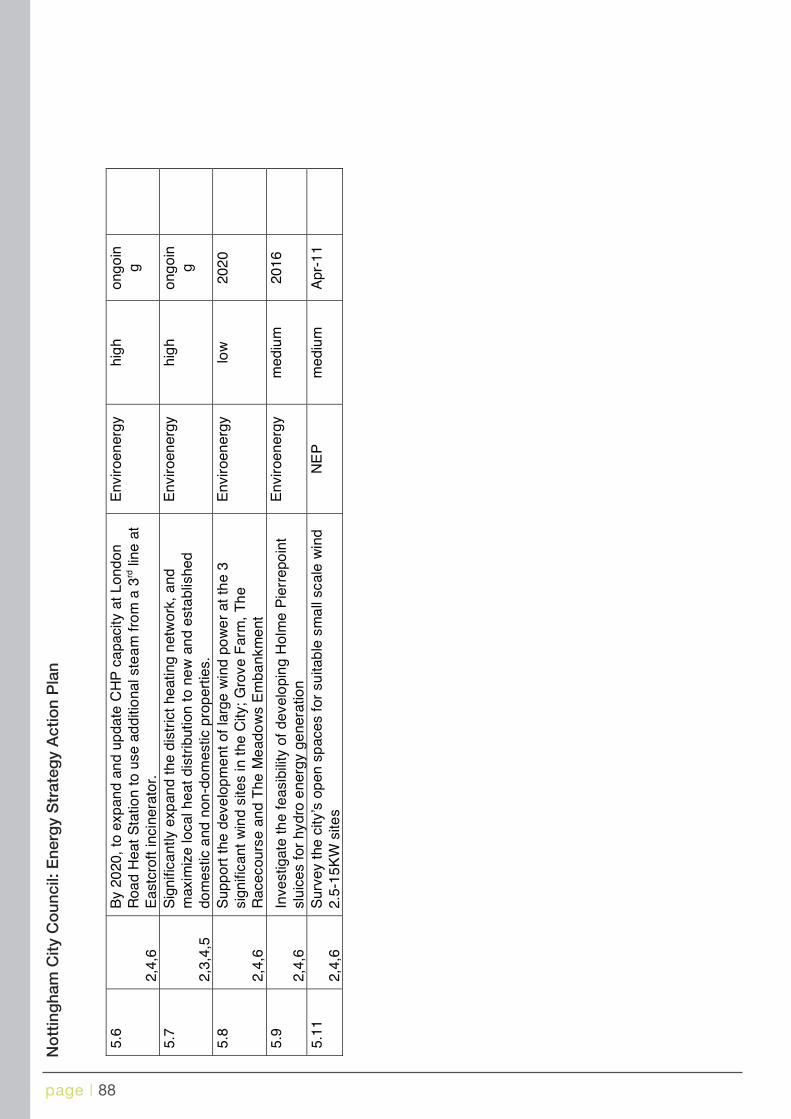
page | 88
Nott
ing
ha
mC
ity
Co
uncil:
En
erg
yS
trate
gy
Actio
nP
lan
5.6
2,4
,6
By
20
20,
toexp
an
dan
dup
date
CH
Pca
pacity
at
Lond
on
Roa
dH
eat
Sta
tio
nto
use
ad
ditio
nalste
am
fro
ma
3rd
line
at
Eastc
roft
incin
era
tor.
Envir
oen
erg
yhig
hong
oin
g
5.7
2,3
,4,5
Sig
nific
antly
exp
an
dth
edis
tric
theating
netw
ork
,a
nd
maxim
ize
localh
eat
dis
trib
ution
tone
wan
desta
blis
hed
do
mestic
and
non
-do
mestic
pro
pert
ies.
Envir
oen
erg
yhig
hong
oin
g
5.8
2,4
,6
Supp
ort
the
deve
lop
me
nt
of
larg
ew
ind
po
we
rat
the
3
sig
nific
ant
win
dsites
inth
eC
ity;
Gro
ve
Farm
,T
he
Racecours
ean
dT
he
Me
ad
ow
sE
mba
nkm
ent
Envir
oen
erg
ylo
w202
0
5.9
2,4
,6
Investigate
the
feasib
ility
of
develo
pin
gH
olm
eP
ierr
epo
int
slu
ices
for
hydro
energ
yge
nera
tio
n
Envir
oen
erg
ym
ediu
m201
6
5.1
1
2,4
,6
Surv
ey
the
city
sop
en
sp
aces
for
su
itab
lesm
all
scale
win
d
2.5
-15
KW
site
s
NE
Pm
ediu
mA
pr-
11
Nott
ingha
mC
ityC
oun
cil:
Ene
rgy
Str
ateg
yA
ctio
nP
lan

page | 89
Gro
up
:6.
Gre
en
Tech
Gro
wth
Le
ad
:N
ott
ing
ha
mS
cie
nce
City
Re
f
no
.
Re
late
s
toA
ims
Acti
on
Bri
ef
Le
ad
Pri
ori
ty
(hig
he
st,
hig
h,
me
diu
m,
low
)
Targ
et
date
Revie
w
date
SO
1T
he
cit
ys
un
iqu
estr
en
gth
ine
nerg
ys
elf
-su
ffic
ien
cy
wil
l
be
us
ed
top
rom
ote
No
ttin
gh
am
inth
eU
Ka
nd
Eu
rop
e
as
the
firs
tc
ho
ice
for
loca
tio
no
fs
usta
ina
ble
en
erg
y
rela
ted
an
dg
ree
nte
ch
bu
sin
es
s,
inn
ova
tio
na
nd
gro
wth
.
NS
C201
0
6.1
3,4
,6,7
Build
ing
on
the
city
sre
puta
tion
for
ene
rgy
securi
ty,
the
city
will
aim
toesta
blis
ha
nen
erg
yp
ark
tosup
po
rtne
wa
nd
relo
cating
energ
yre
late
dbusin
esses
tobase
their
opera
tio
ns
he
re.
NS
C
hig
h
201
3
6.2
3,4
,6,7
Develo
pa
localG
ree
nT
ech
Industr
yS
trate
gy
tofo
rma
key
ele
me
nt
of
the
Nott
ing
ha
mE
ne
rgy
Str
ate
gy
NS
C
hig
h
Ja
n-1
1
6.3
3,4
,6,7
To
su
pp
ort
the
Nott
ing
ha
mS
cie
nce
Park
inatt
racting
more
SM
Ean
dsta
rt-u
pbusin
esses
inth
een
erg
yand
low
ca
rbo
n
se
cto
r.
NS
C
hig
h
201
0
6.4
3,4
,6,7
Colle
ctively
lobby
EM
DA
for
an
En
erg
yiN
et
/or
mecha
nis
m
topro
vid
eC
om
panie
saccess
toE
ne
rgy
Busin
ess
Advis
ors
with
specific
secto
rexpe
rie
nce
and
expert
ise
NS
C
hig
h
Sep-1
0
6.5
3,4
,6,7
Clo
sely
mo
nitor
the
develo
pm
ent
of
EM
DA
sE
nerg
y
Co
nnections
Pro
gra
mm
ein
ord
er
tolin
klo
ca
lco
mpa
nie
sto
this
sup
port
packag
e
NS
C
mediu
m
ong
oin
g
6.6
3,4
,6,7
Supp
ort
the
Univ
ers
ity
of
Nott
ing
ha
min
the
develo
pm
ent
of
an
Energ
yre
se
arc
han
dte
st
bed
de
mo
nstr
atio
nfa
cili
tyat
the
Jubile
eC
am
pus
and
link
SM
Es
toth
isre
so
urc
e
NS
C
hig
h
ong
oin
g
6.7
3,4
,6,7
Develo
pand
main
tain
inte
llige
nce
on
localC
om
pa
nie
sin
the
em
erg
ing
En
erg
ysecto
r
NS
C
mediu
m
ong
oin
g
Nott
ingha
mC
ityC
oun
cil:
Ene
rgy
Str
ateg
yA
ctio
nP
lan

page | 90
Nott
ing
ha
mC
ity
Co
uncil:
En
erg
yS
trate
gy
Actio
nP
lan
6.8
3,4
,6,7
Investigate
the
issue
of
skill
san
dpro
vis
ion
inth
isfield
in
rela
tio
nto
cre
ating
the
rig
ht
skill
ba
se
acro
ss
all
levels
of
a
futu
reG
ree
nT
ech
Secto
r.In
clu
din
gd
esig
nin
novation,
consulta
ncy,
man
ufa
ctu
rea
nd
insta
llatio
n.
NS
C
hig
h
Ju
l-1
0
6.9
6
Evolv
ea
nd
modify
the
Cle
ante
ch
YE
SP
ost
Gra
d
pro
gra
mm
eto
off
er
an
Envir
o-e
ntr
epre
neu
rsm
aste
rcla
ss
busin
ess
develo
pm
ent
pro
gra
mm
eto
app
lica
nts
acro
ss
the
City
an
dC
ounty
NS
C
mediu
m
Sep-1
0
Gro
up
:7.
Polic
ya
nd
pla
nnin
g
Gro
up
Le
ad
:N
ott
ingh
am
City
Cou
ncil
Re
f
no
.
Re
late
s
toA
ims
Acti
on
Bri
ef
Le
ad
Pri
ori
ty
(hig
he
st,
hig
h,
me
diu
m,
low
)
Targ
et
date
Revie
w
date
SO
5N
CC
wil
lw
ork
toe
ns
ure
loc
al
pla
nn
ing
po
licy
,a
nd
loca
l
au
tho
rity
ca
pit
al
pro
cu
rem
en
ts
up
po
rts
the
tim
ely
deli
ve
ryo
fth
ecit
ys
us
tain
ab
lee
nerg
ystr
ate
gy
,th
rou
gh
de
ve
lop
ing
an
ds
ett
ing
rig
oro
us,
ev
ide
nc
ed
,lo
ca
lta
rge
ts
for
ca
rbo
na
nd
en
erg
ys
usta
ina
bil
ity
inn
ew
de
velo
pm
en
t.
NC
C
7.1
2,4
Th
rou
gh
the
Loca
lD
eve
lop
ment
Fra
me
wo
rkpro
ce
ss,
the
City
will
consu
lton
the
tig
hte
nin
gof
localpla
nnin
gp
olic
y,
with
rega
rds
tore
ne
wab
les
and
energ
yeff
icie
ncy,
tod
eliv
er
on
sm
all
sca
lere
ne
wable
en
erg
yta
rgets
inth
ew
ider
conte
xt
of
via
ble
susta
ina
ble
develo
pm
ent
ob
jectives.
The
city
will
esta
blis
hw
heth
er
there
isan
evid
ence
base
tore
co
mm
end
hig
her
targ
ets
inth
eLD
F,
with
incert
ain
zo
nes
of
the
city
e.g
.:
toencoura
ge
conn
ection
tod
istr
ict
heating
netw
ork
s.
NC
C
hig
h
201
2
Nott
ingha
mC
ityC
oun
cil:
Ene
rgy
Str
ateg
yA
ctio
nP
lan

page | 91
Nott
ing
ha
mC
ity
Co
uncil:
En
erg
yS
trate
gy
Actio
nP
lan
7.2
2
Th
eC
ity
Cou
ncil
will
se
ek
toaccele
rate
the
Co
de
for
Susta
inable
Ho
mes
and
Build
ing
Regula
tio
ns,
on
the
road
to
zero
carb
on
ne
wbuild
by
20
16.
Th
eC
SH
leve
lw
illbe
revie
we
das
Cod
eLeve
lre
quire
ments
incre
ase
to201
6,
an
d
will
be
su
bje
ct
tovalu
efo
rm
on
ey
tests
an
dvia
bili
ty
assessm
ent
thro
ug
hth
esta
tuto
rypla
nnin
gpro
ce
ss.
NC
C
hig
h
201
2
7.3
2
Th
rou
gh
the
pla
nnin
gan
ddevelo
pm
ent
pro
cess,
encoura
ge
develo
pe
rsto
meet
zero
carb
on
ho
mes
sta
nd
ard
and
toseek
toensure
that
all
ne
who
usin
gdevelo
pm
ent
will
be
capa
ble
of
feasib
lybein
gre
trofitt
ed
toachie
ve
the
ze
rocarb
on
sta
nd
ard
.
NC
C
mediu
m
7.4
2,7
,8
Pro
mote
the
develo
pm
ent
of
the
Mea
do
ws
are
aa
s
Nott
ingh
am
sfirs
tlo
wcarb
on
action
zo
ne
.
NC
C
mediu
m
7.5
Where
possib
leto
de
man
dth
rou
gh
NC
Cco
mm
issio
nin
gcod
e
levels
1in
advance
of
natio
nalbuild
ing
reg
ula
tion
fro
mall
ne
who
usin
gbu
ilton
NC
Cla
nd
NC
C
mediu
m
7.6
To
requir
eth
roug
hN
CC
co
mm
issio
nin
g,
that
all
new
pub
lic
secto
rin
frastr
uctu
reis
desig
ne
dto
an
ap
pro
pri
ate
maxim
um
'inuse'carb
on
inte
nsity
(kgC
O2
e/m
2)
an
ddesig
ne
dto
main
tain
this
sta
nd
ard
within
specifie
dfu
ture
clim
ate
chan
ge
and
ene
rgy
costs
risk
limits.
NC
C
hig
h
7.7
Evalu
ate
the
pote
ntialfo
resta
blis
hin
ga
Co
mm
unity
Infr
astr
uctu
reL
evy
fun
dfo
rth
epu
rch
ase
of
Lo
wo
rZ
ero
Ca
rbo
nte
ch
nolo
gie
sw
ithin
the
city
NC
C
hig
h
7.8
Encou
rage
all
ne
wn
on-d
om
estic
deve
lop
ments
,n
ot
alre
ady
'Zero
carb
on',
tobe
su
itable
for
late
r'Z
ero
carb
on'
retr
ofit
NC
C
mediu
m
Nott
ingha
mC
ityC
oun
cil:
Ene
rgy
Str
ateg
yA
ctio
nP
lan

page | 92
Gro
up
:8.
Rese
arc
han
dD
evelo
pm
ent
Le
ad
:T
BC
Re
fn
o.
Re
late
s
toA
ims
Acti
on
Bri
ef
Le
ad
Pri
ori
ty
(hig
he
st,
hig
h,
me
diu
m,
low
)
Targ
et
date
Revie
w
date
SO
8T
ow
ork
clo
se
lyin
part
ners
hip
wit
hb
usin
es
s,
un
ive
rsit
ies
an
dte
ch
no
log
yp
art
ners
toe
ns
ure
No
ttin
gh
am
ac
ce
lera
tes
the
pro
ce
ss
an
dm
axim
ise
s
the
imp
ac
to
fd
em
an
dle
ad
inn
ov
ati
on
ine
ne
rgy
tec
hn
olo
gy
an
dm
an
ag
em
en
tw
ith
inth
ecit
y
8.1
1,4
To
assess
econ
om
ics
of
insta
lling
low
or
zero
ca
rbon
energ
ysourc
es
on
the
city
council
esta
tein
the
light
of
Fe
ed
inT
ariff
s
NC
Chig
hS
ep-1
0
8.2
1,4
,5
To
dete
rmin
eth
efe
asib
ility
of
run
nin
gcity
council
fleet,
on
Envir
oen
erg
ye
lectr
icity
NC
Cm
ediu
mS
ep-1
0
8.3
4,5
To
co
nduct
acity
wid
ehe
at
and
co
olin
gde
ma
nd
and
sourc
em
ap
pin
gexcerc
ise
Envir
oen
erg
yhig
hest
Sep-1
0
8.4
4,7
Co
nduct
deta
iled
feasib
ility
stu
dy
into
use
of
city
open
air
car
pa
rkin
gare
as
for
PV
topo
we
rzero
carb
on
tra
nsp
ort
initia
tive
s
NE
Pm
ediu
mA
pr-
11
8.5
1,4
,5,7
Work
with
Un
ivers
itie
sto
evalu
ate
the
pote
ntialfo
rth
euse
of
the
river
and
ca
nalas
he
at
sourc
es
for
Wate
rS
ourc
ed
NE
Pm
ediu
mA
pr-
11
Nott
ingha
mC
ityC
oun
cil:
Ene
rgy
Str
ateg
yA
ctio
nP
lan
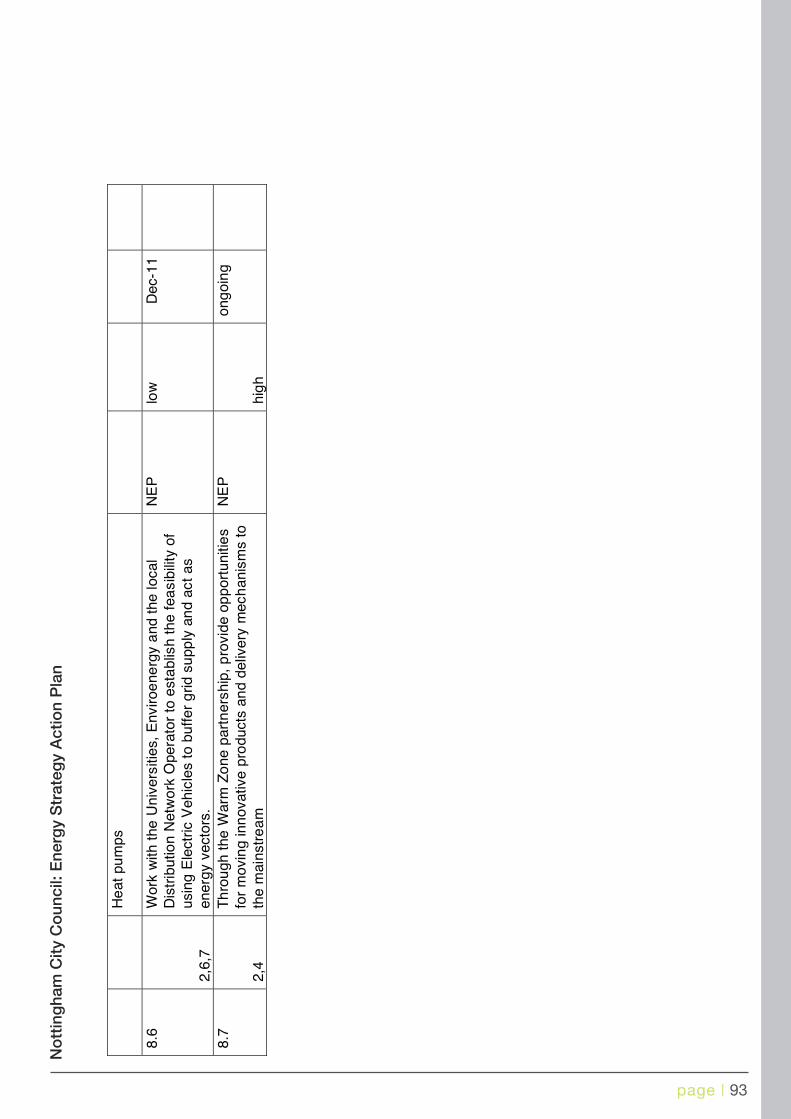
page | 93
Nott
ing
ha
mC
ity
Co
uncil:
En
erg
yS
trate
gy
Actio
nP
lan
He
at
pu
mps
8.6
2,6
,7
Work
with
the
Univ
ers
itie
s,
Enviroe
ne
rgy
and
the
local
Dis
trib
utio
nN
etw
ork
Opera
tor
toesta
blis
hth
efe
asib
ility
of
usin
gE
lectr
icV
ehic
les
tobuff
er
grid
su
pp
lyan
dact
as
energ
yvecto
rs.
NE
Plo
wD
ec-1
1
8.7
2,4
Th
rou
gh
the
Warm
Zo
ne
part
ners
hip
,p
rovid
eop
port
unitie
s
for
movin
gin
novative
pro
ducts
an
ddeliv
ery
mech
anis
ms
to
the
main
str
ea
m
NE
P
hig
h
ong
oin
g
Nott
ingha
mC
ityC
oun
cil:
Ene
rgy
Str
ateg
yA
ctio
nP
lan

page | 94
Nott
ing
ha
mC
ity
Co
uncil:
En
erg
yS
trate
gy
Actio
nP
lan
Gro
up
:9.
Tra
nsport
Gro
up
Le
ad
:T
he
Gre
ate
rN
ott
ing
ha
mT
ran
spo
rtP
art
ners
hip
Re
f
no
.
Re
late
s
toA
ims
Acti
on
Bri
ef
Le
ad
Pri
ori
ty
(hig
he
st,
hig
h,
me
diu
m,
low
)
Targ
et
date
Revie
w
date
SO
7T
os
et
tra
ns
po
rtre
late
dcarb
on
em
issio
ns
red
uc
tio
na
nd
tec
hn
olo
gy
targ
ets
inth
efo
rth
co
min
g3
rdL
oca
l
Tra
ns
po
rtP
lan
wh
ich
are
ali
gn
ed
wit
hth
ee
ne
rgy
str
ate
gy
an
daim
toex
ce
ed
the
nati
on
al
Lo
wC
arb
on
Tra
nsit
ion
Pla
nta
rge
tsb
y2
020.
At
this
sta
ge
an
ind
icati
ve
targ
et
of
20
%re
du
cti
on
isre
co
mm
en
de
d.
GN
TP
9.1
5
Incentivis
ean
dsup
port
the
incre
ase
dupta
ke
of
ele
ctr
ic
vehic
les
inclu
din
gele
ctr
icbuses,
cars
an
dscoote
rs,
inth
e
city
within
localtr
ansport
polic
ies
GN
TP
mediu
m
201
1
9.2
7
Encou
rage
con
nectio
nof
the
Net2
tra
mexte
nsio
nto
the
Envio
ren
erg
yprivate
wire
ele
ctr
icity
sup
ply
.
GN
TP
hig
h
201
0
9.3
4,5
To
co
nsid
er
futu
reco
nn
ections
with
the
can
ala
nd
river
for
wate
rfr
eig
ht
tobri
ng
bio
mass
fuelin
toth
ecity,
wh
en
develo
pin
gspatia
lpla
ns.
GN
TP
mediu
m
201
1
9.4
5In
cre
ase
pu
blic
tra
nsp
ort
patr
on
age
by
one
mill
ion
extr
atr
ips
GN
TP
hig
h202
0
9.5
5R
ed
uce
sin
gle
occu
pa
ncy
journ
eys
tow
ork
by
20
%G
NT
Phig
h202
0
9.6
5D
ou
ble
the
levelof
cyclin
gw
ithin
targ
ete
da
rea
sG
NT
Phig
h202
0
9.7
5
Reta
inm
od
alshare
of
car-
born
ejo
urn
eys
toscho
olat
belo
w
20
%
GN
TP
hig
h202
0
9.8
1,3
,5
Incre
ase
will
ing
ness
touse
susta
ina
ble
traveloptions
(form
al
targ
et
valu
eto
be
ado
pte
dfo
llow
ing
baselin
esu
rvey)
GN
TP
hig
h202
0
Nott
ingha
mC
ityC
oun
cil:
Ene
rgy
Str
ateg
yA
ctio
nP
lan

page | 95

39448 DES
Prepared by NEPEnergy Services Ltd forNottingham City Council