Embed Size (px)
Citation preview

ENERGY STAR* System Implementation Published by Intel with technical collaboration from the U.S. Environmental Protection Agency Whitepaper February 2007 Revision -001
Document Number: 316478-001

INFORMATION IN THIS DOCUMENT IS PROVIDED IN CONNECTION WITH INTEL® PRODUCTS. NO LICENSE, EXPRESS OR IMPLIED, BY ESTOPPEL OR OTHERWISE, TO ANY INTELLECTUAL PROPERTY RIGHTS IS GRANTED BY THIS DOCUMENT. EXCEPT AS PROVIDED IN INTEL’S TERMS AND CONDITIONS OF SALE FOR SUCH PRODUCTS, INTEL ASSUMES NO LIABILITY WHATSOEVER, AND INTEL DISCLAIMS ANY EXPRESS OR IMPLIED WARRANTY, RELATING TO SALE AND/OR USE OF INTEL PRODUCTS INCLUDING LIABILITY OR WARRANTIES RELATING TO FITNESS FOR A PARTICULAR PURPOSE, MERCHANTABILITY, OR INFRINGEMENT OF ANY PATENT, COPYRIGHT OR OTHER INTELLECTUAL PROPERTY RIGHT. Intel products are not intended for use in medical, life saving, or life sustaining applications.
Intel may make changes to specifications and product descriptions at any time, without notice.
Designers must not rely on the absence or characteristics of any features or instructions marked "reserved" or "undefined." Intel reserves these for future definition and shall have no responsibility whatsoever for conflicts or incompatibilities arising from future changes to them.
Contact your local Intel sales office or your distributor to obtain the latest specifications and before placing your product order.
Intel and the Intel logo are trademarks or registered trademarks of Intel Corporation or its subsidiaries in the United States and other countries.
*Other names and brands may be claimed as the property of others.
Copyright © 2007, Intel Corporation. All rights reserved.
2

Contents 1 Preface............................................................................................................6
2 Introduction .....................................................................................................7 2.1 ENERGY STAR Version 4.0 .......................................................................8 2.2 Taking Advantage of Power Management Settings.......................................8 2.3 Terminology ..........................................................................................9 2.4 ENERGY STAR and Computer Platforms ...................................................11 2.5 ENERGY STAR Common Platform Requirements ........................................13 2.6 Reference Documents ...........................................................................13
3 Notebooks and ENERGY STAR Requirements .......................................................14 3.1 Notebooks, Battery Life and AC Energy....................................................14 3.2 ENERGY STAR Basics for Notebooks ........................................................14 3.3 The Notebook Platform..........................................................................16 3.4 Power Delivery: A System’s Power Amplifier.............................................18 3.5 ENERGY STAR Requirements for the AC Brick ...........................................20 3.6 Power Breakdown of the Notebook..........................................................22 3.7 Power sensitivity to Power Delivery Efficiencies.........................................23 3.8 Optimizing a Notebook for ENERGY STAR.................................................26 3.9 Summary............................................................................................29
4 Desktop Computers and ENERGY STAR Requirements ..........................................30 4.1.1 Category Definitions ................................................................30
4.2 Power Supply Considerations .................................................................31 4.2.1 ENERGY STAR Requirements.....................................................31 4.2.2 Overall Efficiency Measurements................................................31 4.2.3 Power Supply Sizing ................................................................32 4.2.4 5 V Standby (5 VSB) Efficiency..................................................35 4.2.5 External Power Supplies for Desktop Systems..............................36
4.3 Operational Modes................................................................................36 4.3.1 Idle Mode...............................................................................38 4.3.2 Sleep Mode ............................................................................40 4.3.3 Off Mode (Standby) .................................................................41
4.4 Summary............................................................................................42 5 Workstations and Desktop-derived Servers .........................................................43
5.1 ENERGY STAR Workstation and Desktop Derived Server Specification Scope .43 5.2 Desktop Derived Servers and Specification Application...............................44 5.3 Workstation Category and Definition .......................................................45 5.4 Workstation Scalable Specification ..........................................................46 5.5 Measurements .....................................................................................49
5.5.1 Max_Power.............................................................................49 5.5.2 Typical Electricity Consumption .................................................50 5.5.3 Tools and Calibration ...............................................................51
3

5.5.4 Power Management and Settings ...............................................51 6 Future Specification Considerations ...................................................................52
7 Summary ......................................................................................................53
Appendix A Creating a Disk Image .....................................................................................54
A.1 Modifications to the Default User/policy in Rollout Image (i.e.; “Ghosting”) .............54
A.2 Microsoft Windows* XP ....................................................................................55
A.3 Microsoft Windows Vista*.................................................................................57
About the Authors ..............................................................................................................59
Figures
Figure 1: Microsoft Windows* XP Computer and Monitor Sleep Settings ....................9 Figure 2. Typical Type A Notebook System (integrated graphics, UMA Memory) .......17 Figure 3. Typical Type B Notebook (discrete graphics) ..........................................18 Figure 4. Notebook Power Delivery System.........................................................18 Figure 5. Example AC Brick Efficiency over Different Loads....................................21 Figure 6. Typical Notebook Idle Power Breakdown ...............................................22 Figure 7. Typical Notebook Sleep Power Breakdown .............................................23 Figure 8. Idle Power distribution across efficiencies ..............................................24 Figure 9. Sleep Power distribution across efficiencies............................................24 Figure 10. Idle Effects of Low Power States.........................................................26 Figure 11. Percent Spundown Time Operating on Battery......................................28 Figure 12. PSU Efficiency as Percentage of Output ...............................................33 Figure 13. PSU Efficiency per Power for 450 W PSU..............................................34 Figure 14. PSU Efficiency per Power for 250 W PSU..............................................35 Figure 15. Idle Mode System Power State Example ..............................................37 Figure 16. Sleep (S3) Mode System Power State Example.....................................37 Figure 17. Standby (S5) Mode System Power State Example .................................38 Figure 18. System Idle Power Factors ................................................................40 Figure 19. Scaleable Typical Electricity Consumption ............................................47
Tables
Table 1. ENERGY STAR Requirements for Notebooks ............................................15 Table 2. Active Mode Requirements for Average Efficiency ....................................20 Table 3. No Load Requirements.........................................................................20 Table 4: ENERGY STAR Category Wall Power Requirements...................................31 Table 5. Power Supply Sizes for Desktop System Categories .................................35
4

Revision History
Revision Number
Description Revision Date
001 Initial release. February 2007
§
5

Preface
1 Preface
In July of 2007 a new version of the ENERGY STAR* specification for computers will take effect. This new version specifies many new system level requirements that must be met in order to carry the ENERGY STAR logo on computers. As such, Intel and the EPA have collaborated on creating this document that can provide system providers, from the largest to smallest, with key understandings on how to specify and test system configurations that can best meet the required power levels of the new specification.
6

Introduction
2 Introduction
Over the last twenty-five years, computers have become pervasively used tools that have enhanced the productivity in the office and enhanced the entertainment and utility within the home. Their remarkable growth has been fueled by amazing advancements in performance, capability and affordability. As the number of computers has grown, so has the need for delivery and deployment in increasingly energy conscious ways. More energy friendly computers can have an effect on both the available energy capacity as well as on the ecological impacts of generating additional electricity to meet growing demands.
Moving forward, there will continue to be a need for greater levels of computer performance and capability that will also be coupled with the need to manage energy consumption. Intuitively, it would seem that delivering greater performance/capability would be at odds with managing energy consumption. However, innovations by Intel and others in the industry have enabled delivery of technologies that can help offset and, in some cases, even reduce the energy consumed by the computer. These innovations have typically focused on optimizing the energy efficiency and performance when the computer is actively being used while minimizing the actual energy consumption when the computer is in a state of prolonged inactivity.
Today’s computers, such as desktops and notebooks, have many power saving capabilities built into them. Examples are the “sleep” and “hibernate” modes that can significantly reduce the amount of energy consumed during inactive states. When these capabilities are turned on during periods of inactivity, it has been estimated to reduce the overall amount of energy consumed by computers by up to 60%1.
In order to help encourage adoption and use of these energy saving technologies, in 1992 the US Environmental Protection Agency (EPA) established its voluntary program, called ENERGY STAR, to cover first computers and later other categories of office equipment and other products. The ENERGY STAR program for computers has the goal of generating awareness of energy saving capabilities, as well as differentiating the market for more energy-efficient computers and accelerating the market penetration of more energy-efficient technologies.
In the middle of 2007, the EPA will update the ENERGY STAR computer specification to Version 4.0. The new version is intended to define a set of testing criteria and power limits that could reduce the amount of energy consumed at idle (i.e.; when awake but not in active use) by an average of 45%2. As this new specification rolls out, it is expected that that the cost of ENERGY STAR compliant computers will increase slightly. EPA routinely sets a target goal of about twenty-five percent compliance for each of the platform categories and this will also be the case for the Version 4.0 Specification.
1 Assumes baseline configuration consumes ~423 kW-hr/year without power management (Max = 118W (3%) + Sleep = 4W (27%) + idle = 65W (67%) + Off = 3W (3%)) and ~173 kW-hr with power management ((Max = 118W (3%) + Sleep = 4W (74%) + idle = 65W (20%) + Off = 3W (3%) ) 2 Savings Estimates for the ENERGY STAR® Voluntary Labeling Program (2007). Sanchez, Marla, Carrie Webber, Richard Brown and Gregory Homan. Climate Change Action Plan (CCAP) Model version 061121. Lawrence Berkeley National Laboratory.
7

Introduction
The remainder of this document will discuss how the new ENERGY STAR specification applies to Desktop PCs, Notebook PCs, Workstation Computers and Desktop Derived Servers. In particular, this document will describe the key system components that impact energy consumption in general as well as describe ways in which system designers can make choices that decrease a system’s energy draw. Also, this document will relate the impact of those choices to the requirements of the ENERGY STAR specification, as well as how to specify and test system configurations that can best meet the required power levels of the new specification.
2.1 ENERGY STAR Version 4.0
Version 4.0 of the ENERGY STAR specification for computers replaces Version 3.0 of the specification that has been in effect since 2000. Version 4.0 of the specification will be deployed in two phases, called tiers.
The first phase, Tier 1, will go into effect on July 20, 2007 and will require all systems manufactured on, or after, this date to meet the new requirements in order to ship with the ENERGY STAR logo. As such, there is no grandfathering for existing systems that previously met the Version 3.0 specification. Systems will have to be retested and resubmitted, in their ”as-shipped” configuration, in order to continue to carry the logo. In addition, for product models that have multiple configurations, system vendors can qualify the product under a single model that represents the highest power configuration within the ENERGY STAR Desktop and Notebook product categories. For additional information on the logo requirements, please refer to the ENERGY STAR specification.
A second phase, Tier 2, is targeted to go into effect in January of 2009. This second phase will define an enhanced test methodology and will be based upon both energy consumed over time and a performance assessment of products as they are expected to be used.
2.2 Taking Advantage of Power Management Settings
The diagram below shows the power options property sheet for Windows* XP that allows users to control the various power settings. Specific options are: “Turn off monitor”, “Turn off hard disks”, “System standby” and “System hibernates”. ENERGY STAR requirements require that the “Turn off monitor” setting be set (by default) to 15 minutes or less for AC (“Plugged in”) operation, and “System Standby” (PC term for “Sleep”) to be set for 30 minutes or less, when on AC power3.
3 DC power settings are not specified by ENERGY STAR.
8

Introduction
Figure 1: Microsoft Windows* XP Computer and Monitor Sleep Settings4
If rolling out Windows XP or Windows Vista* through the use of images (i.e.; Using Symantec Ghost* or similar) there is a method, albeit lacking centralized control (fire-and-forget option), a system administrator or OEM can set and ensure compliance to monitor power management policies. Please refer to Appendix A for more information.
2.3 Terminology
Some of the terminology used by the EPA in the ENERGY STAR specification is different than the language used in the computer industry. This section provides a definition of commonly used terms in order to prevent confusion of these terms. Other terms used in this document are listed here as well.
Term Description
AC Alternating Current.
CAD Computer Aided Drafting.
CAE Computer Aided Engineering.
Capability A set of features that enhance the usability and/or experience of a (compute) product; or, provides the ability to accomplish tasks or activities.
DC Direct Current.
4 Microsoft* product screen shot(s) reprinted with permission from Microsoft Corporation.
9

Introduction
Term Description
DRAM Dynamic Random Access Memory. This is the primary type of memory used in computer systems today.
ECC Error Correcting Code. Error correcting code is a mechanism for improving the reliability of computer memory that allows the detection and correction of some types of memory errors.
Energy consumption The amount of AC (wall plug) energy consumed by a system over a given period of time (hour, week, year) and is measured in kilowatt-hours (kW-hr).
Energy efficiency The amount of AC (wall plug) energy consumed by a system to run a desired usage-based workload and is measured in kilowatt-hours (kW-hr). Usage-based workloads should include both active and non-active states that are reflective of the end user’s use of the system.
Energy Efficient Performance
The intersection of great performance, expanded capabilities and energy efficiency.
Efficiency Efficiency has two definitions. In the context of power delivery, efficiency is equal to (power out / power in) and can be represented by the symbol η (eta). Another definition is that efficiency is a measure of the production of work versus the cost (time, energy, money, etc.).
Environmental impact An assessment of any change to the environment whether adverse or beneficial, wholly or partially resulting from the activity of creating, using, or disposing of items (we) produce.
GPU Graphics Processing Unit. This is typically a silicon component on the motherboard or on an add-in card that processes graphics information for external display.
Idle Mode For purposes of testing and qualifying computers under the specification, this is the state in which the operating system and other software have completed loading, the machine is not asleep, and activity is limited to those basic applications that the system starts by default. In general this refers to the ACPI G0/S0 working state.
MIPS Millions of Instructions Per Second. MIPS are sometimes used as an indicator of computer or CPU performance.
Network Interface The components (hardware and software) whose primary function is to make the computer capable of communicating over one or more network technologies. For purposes of testing to this specification, Network Interface refers to the IEEE 802.3 wired Ethernet interface.
Performance The compute throughput and responsiveness at a component level – or – Compute throughput and responsiveness at a system level.
OEM Original Equipment Manufacturer. In the context of this paper these are computer manufacturers.
PF Power Factor. This is a ratio of the real power to the apparent power.
10

Introduction
Term Description
PFC Power Factor Correction. This is used in computer power supplies to improve the Power Factor of the system.
Power The measurement of energy consumption in watts at a specific point in time and under a fixed, static condition. Examples: maximum power, active and idle.
Sleep Mode A low power state that the computer is capable of entering automatically after a period of inactivity or by manual selection. A computer with sleep capability can quickly “wake” in response to network connections or user interface devices. For the purposes of this specification, Sleep mode correlates to ACPI System Level S3 (suspend to RAM) state, where applicable.
Standby Mode The power consumption level in the lowest power mode which cannot be switched off (influenced) by the user and that may persist for an indefinite time when the appliance is connected to the main electricity supply and used in accordance with the manufacturer’s instructions. For purposes of this specification, Standby correlates to ACPI System Level S4 or S5 states, where applicable.
UMA Unified Memory Architecture. A computer memory architecture used for integrated graphics implementations where the system memory is used for graphics memory as well.
Wake On LAN (WOL) Functionality which allows a computer to wake from Sleep or Standby when directed by a network request.
2.4 ENERGY STAR and Computer Platforms
The ENERGY STAR specification recognizes and specifies six different types of platforms but then classifies these platforms into three different categories with specific requirements. The six different platforms are:
Desktop: A computer where the main unit is intended to be located in a permanent location, often on a desk or on the floor. Desktops are not designed for portability and utilize an external monitor, keyboard, and mouse. Desktops are designed for a broad range of home and office applications including, email, web browsing, word processing, standard graphics applications, gaming, etc.
Desktop-Derived Server: A desktop-derived server is a computer that typically uses desktop components in a tower form factor, but is designed explicitly to be a host for other computers or applications.
Game Consoles: Stand alone computers whose primary use is to play video games. For the purposes of this specification, game consoles must use a hardware architecture based on typical computer components (e.g., processors, system memory, video architecture, optical and/or hard drives, etc.).
11

Introduction
Integrated Computer: A desktop system in which the computer and display function as a single unit which receives its AC power through a single cable. Integrated computers come in one of two possible forms: (1) a system where the display and computer are physically combined into a single unit; or (2) a system packaged as a single system where the display is separate but is connected to the main chassis by a DC power cord and both the computer and display are powered from a single power supply.
Notebook and Tablet Computers: A computer designed specifically for portability and to be operated for extended periods of time without a direct connection to an AC power source. Notebooks and tablets must utilize an integrated monitor and be capable of operation off an integrated battery or other portable power source. In addition, most notebooks and tablets use an external power supply and have an integrated keyboard and pointing device, though tablets use touch-sensitive screens. Notebook and tablet computers are typically designed to provide similar functionality to desktops except within a portable device.
Workstation: For the purposes of the ENERGY STAR specification, to qualify as a workstation, a computer must at a minimum:
• Be marketed as a workstation;
• Have a mean time between failures (MTBF) of at least 15,000 hours based on either Bellcore TR-NWT-000332, issue 6, 12/97 or field collected data; and
• Support error-correcting code (ECC) and/or buffered memory.
Additionally to be defined as a workstation the system must also have a number of other characteristics (picked from a list) that will be discussed in the workstation section of this paper.
These different platforms are then categorized into three different product types, each with its own requirements: Product Category Category Requirements
Desktops, Integrated Computers, Desktop-Derived Servers and Gaming Consoles
Standby Requirements
Sleep Requirements
Idle Power Requirements (category A, B and C)
Notebooks and Tablets Standby Requirements
Sleep Requirements
Idle Power Requirements (category A and B)
Workstations TEC Power Requirement
This paper will talk about each of the different product categories (e.g. treats the desktop, integrated computers, desktop-derived servers and gaming consoles the same as they have the same requirements). Each section will describe the specific requirements for each unique category in more detail.
12

Introduction
2.5 ENERGY STAR Common Platform Requirements
The ENERGY STAR specification has a number of requirements which are common across all of the platform categories. This section will outline these common attributes.
All systems are tested “as shipped”, unless otherwise specified. In general the tester is not allowed to enable or disable any power management settings specifically for testing purposes, unless the process explicitly calls out to do something.
All systems MUST ship with the following power management features enabled to qualify as ENERGY STAR compliant:
•
•
•
Display’s sleep mode (blank display after idle) should be enabled to activate within 15 minutes or less of idle
Platform’s sleep mode (enter sleep mode when idle) should be enabled to activate within 30 minutes or less of idle
Platform’s Gigabit Ethernet Link should switch to a lower rate mode (100 Mb or 10 Mb) when entering the sleep mode
Additionally systems which ship into an enterprise market are required to ship with Wake On LAN (WOL) capability5 enabled in the sleep state. Systems targeted for consumer channels are not required to enable the higher power WOL in the sleep state.
Other requirements that are specific to a product will be called out in those specific sections.
2.6 Reference Documents
Document Document No./Location
Advanced Configuration and Power Interface (ACPI) Specification
http://www.acpi.info/spec.htm
ENERGY STAR® Program Requirements for Computers http://www.energystar.gov/ia/partners/prod_development/revisions/downloads/computer/Computer_Spec_Final.pdf
ENERGY STAR® Program Requirements for Single Voltage External Ac-Dc and Ac-Ac Power Supplies
http://www.energystar.gov/ia/partners/product_specs/program_reqs/EPS%20Eligibility%20Criteria.pdf
Generalized Internal Power Supply Efficiency Test Protocol http://www.efficientpowersupplies.org
Hybrid Hard Disk And ReadyDrive* Technology: Improving Performance And Power For Windows Vista Mobile PCs
http://download.microsoft.com/download/5/b/9/5b97017b-e28a-4bae-ba48-174cf47d23cd/STO008_WH06.ppt
Power Supply Design Guide for Desktop Platform Form Factors
http://www.formfactors.org
§
5 Set to wake-up on traffic from management workstations is the preferred setting.
13

Notebooks and ENERGY STAR Requirements
3 Notebooks and ENERGY STAR Requirements
3.1 Notebooks, Battery Life and AC Energy
The notebook market has always had an appreciation for low power operation because of the reliance on batteries as a power source; the lower the power, the longer the battery life. AC power is a different story and notebooks traditionally optimize performance, not power, in AC mode. Because many of the battery life optimizations can affect system performance or provide annoyances to the user (like the screen blanking when reading a document), power management features are typically disabled when the notebook is in AC mode.
AC power is becoming more important as energy conservation is seen more and more as a desirable trait and energy costs increase. The key for a notebook designer is to balance which power management techniques to use in AC operation to provide the best performance and usability while meeting the ENERGY STAR energy metrics. The good news for notebook designers is that a host of power management tools are already available, and in most cases it is just a matter of enabling power management features in both battery and AC operating states. Due to the increased industry and end user awareness of energy conservation, the EPA is targeting challenging new energy consumption standards on computers and only 25% of today’s notebooks are expected to pass the new ENERGY STAR logo requirements. These are not easy requirements to meet and you cannot expect to meet all requirements on all product models.
This section will review the requirements for ENERGY STAR notebooks, go over where much of the power is distributed throughout the notebook and review the key areas to investigate in order to meet these new requirements.
3.2 ENERGY STAR Basics for Notebooks
There are four major requirement areas for notebook systems:
1. Requirements for the AC adapter (notebook power brick)
2. Idle power requirements
3. Sleep power requirements, and
4. Standby (Off) power requirements
These requirements are illustrated in Table 1.
14

Notebooks and ENERGY STAR Requirements
Table 1. ENERGY STAR Requirements for Notebooks
Platform Power Supply Idle Sleep Standby
Consumer notebook
Avg eff, no load eff A. ≤ 14 W
B. ≤ 22 W
≤ 1.7 W ≤ 1 W
Enterprise notebook
Avg eff, no load eff A. ≤ 14 W
B. ≤ 22 W
≤ 2.4 W ≤ 1 W, or ≤ 1.7 W with WOL
As mentioned in the introduction, the ENERGY STAR specification requires that notebooks are tested as shipped, and further that they are required to be shipped with the following power management features enabled: System should be set to enter a sleep state after 30 minutes or less of idleness and the display should be set to blank after 15 minutes or less of idleness.
The actual specification does not call out a consumer versus enterprise notebook, but for simplicity we have broken out the table along these lines. An Enterprise notebook additionally requires the enabling of a Wake On LAN (WOL) mode in the sleep state when connected to AC power. This is a feature that allows large company computers to awaken the platform from a sleep state through a network message in order to provide some type of manageability service. Because the network must be on to listen to the network traffic, an additional budget of 0.7 W is allocated for this requirement.
“Power Supply” refers to the AC brick, and will be discussed in the next section. Idle power has two categories: A and B. B refers to notebooks which have a discrete graphics controller that supports a separate 128 MB frame buffer versus category A which refers to an integrated graphics architecture which uses a Universal Memory Access (UMA) memory architecture (the frame buffer exists in main DRAM memory). To understand what the terms Idle, Sleep and Standby mean, its best to describe the testing environments and assumptions.
As with the other platform testing, the power of the notebook is measured at the AC wall socket and is measured with an approved meter as described in Appendix A of the ENERGY STAR specification. The notebook test conditions for idle are:
•
•
•
•
•
Configure the notebook to blank its screen after 1 minute,
Turn off all wireless (radio) devices,
Connect the Ethernet port of the notebook to an active switch which supports the highest supported network throughput (typically a gigabit switch with today’s systems), and
Remove the battery from the system (while leaving the AC cord attached)
Do not plug anything else into the system (as shipped)
Other than what is mentioned, all other configurable parameters of the notebook must remain in the “as-shipped” state
The system is then rebooted, and after reaching a stable state (finished booting) the tester will wait 15 additional minutes and then will start measuring and averaging the power for the next 5 minutes. The system is then placed into the sleep state where the power is again measured and averaged over 5 minutes. And then the system is placed in standby (off) and again measured and averaged over 5 minutes.
15
Notebooks and ENERGY STAR Requirements
This is the extent of the testing involved for notebooks. It is key to remember the testing configuration: screen blanked, wireless devices turned off, and battery removed. It is also key to remember the testing environment: connected to an active Ethernet switch, battery removed, and waiting 15 minutes from boot before taking the idle measurement. This idle time is important as it allows the system to reach an idle condition, and gives time for power management features to activate (display blank, etc.).
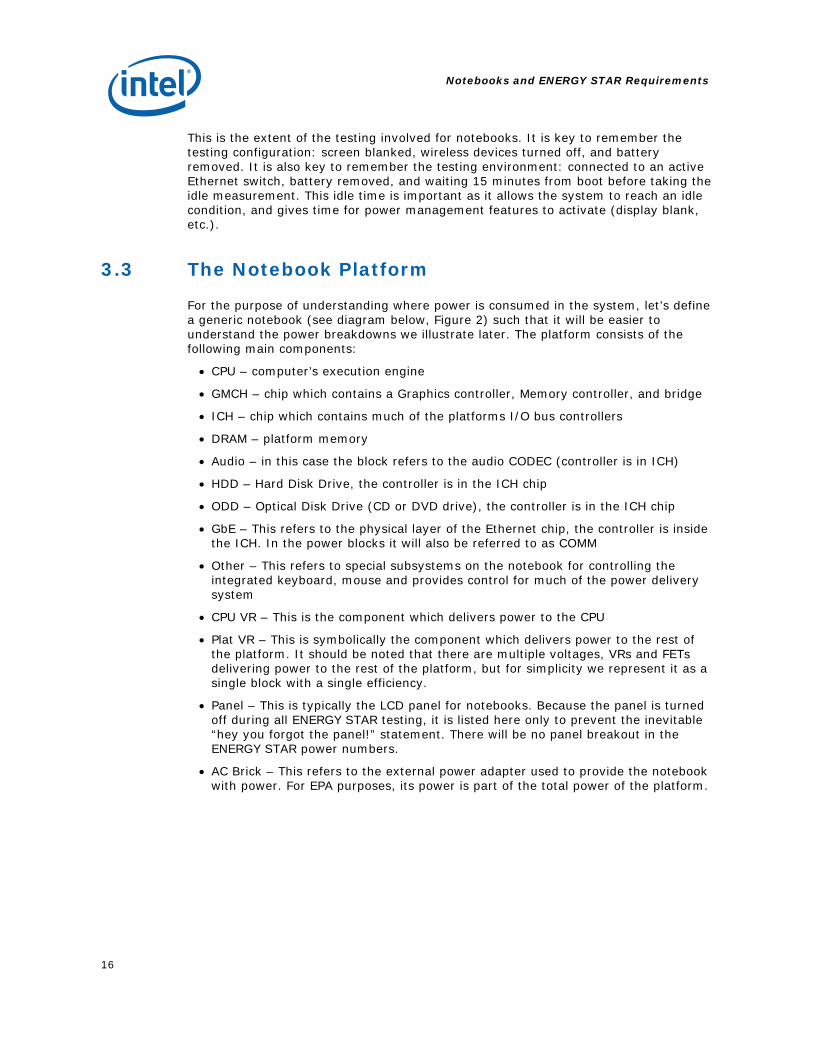
3.3 The Notebook Platform
For the purpose of understanding where power is consumed in the system, let’s define a generic notebook (see diagram below, Figure 2) such that it will be easier to understand the power breakdowns we illustrate later. The platform consists of the following main components:
•
•
•
•
•
•
•
•
•
•
•
•
•
CPU – computer’s execution engine
GMCH – chip which contains a Graphics controller, Memory controller, and bridge
ICH – chip which contains much of the platforms I/O bus controllers
DRAM – platform memory
Audio – in this case the block refers to the audio CODEC (controller is in ICH)
HDD – Hard Disk Drive, the controller is in the ICH chip
ODD – Optical Disk Drive (CD or DVD drive), the controller is in the ICH chip
GbE – This refers to the physical layer of the Ethernet chip, the controller is inside the ICH. In the power blocks it will also be referred to as COMM
Other – This refers to special subsystems on the notebook for controlling the integrated keyboard, mouse and provides control for much of the power delivery system
CPU VR – This is the component which delivers power to the CPU
Plat VR – This is symbolically the component which delivers power to the rest of the platform. It should be noted that there are multiple voltages, VRs and FETs delivering power to the rest of the platform, but for simplicity we represent it as a single block with a single efficiency.
Panel – This is typically the LCD panel for notebooks. Because the panel is turned off during all ENERGY STAR testing, it is listed here only to prevent the inevitable “hey you forgot the panel!” statement. There will be no panel breakout in the ENERGY STAR power numbers.
AC Brick – This refers to the external power adapter used to provide the notebook with power. For EPA purposes, its power is part of the total power of the platform.
16

Notebooks and ENERGY STAR Requirements
Figure 2. Typical Type A Notebook System (integrated graphics, UMA Memory)
Figure 2 represents a type A platform with an integrated graphics solution using UMA (frame buffer is part of system DRAM memory). While we will not be doing a power breakout for a Type B notebook, one is illustrated in Figure 3. Note that the graphics chip is connected to a special graphics bus, and has a separate frame buffer (ENERGY STAR requires a minimum of 128 Mbytes of DRAM). ENERGY STAR has provided an idle requirement of 22 W for the Type B notebook versus the 14 W idle requirements for the Type A notebook. Sleep and standby power are not affected by discrete graphics (as reflected by the ENERGY STAR limits for sleep/standby) as these components are completely powered off in these states.
17

Notebooks and ENERGY STAR Requirements
Figure 3. Typical Type B Notebook (discrete graphics)
3.4 Power Delivery: A System’s Power Amplifier
To meet the ENERGY STAR specification, power delivery is the most critical aspect of the design. While notebooks already optimize power delivery for idle, standby and sleep to maximize battery life, the AC configuration adds one additional layer of power delivery (AC Brick) making power delivery key to an efficient AC design. For notebook designers, it is important to understand the difference between the AC and DC power delivery.
Figure 4. Notebook Power Delivery System
The notebook’s power delivery can be modeled by three major categories (see Figure 4):
18

Notebooks and ENERGY STAR Requirements
1. Load
2. Power Conversion
3. Power Source
For our purposes we will simplify the load into two areas: the CPU and the rest of the platform. The CPU load changes dramatically over time (micro-seconds) and so it is modeled separately. The rest of the platform consists of many different voltage rails (loads), but will be represented as a single load represented by the “Component” block.
The second aspect is power conversion. Here power is converted from the voltage delivered by the power source, to the voltages needed by the loads. The efficiency of this conversion depends on a number of things:
•
•
•
The input voltage (VDC) to the regulator
The quality of the regulator
The load on the output of the regulator
For purposes of this paper, the power conversion is represented by to two voltage regulators to match how the loads are modeled: the first for the CPU load (CPU Voltage Regulator or VR) and the second representing many voltage regulators that supply the rest of the platform (Platform VR). Associated with each power conversion VR is an efficiency represented by the amount of power delivered to the load divided by the amount of power input into the VR in order to deliver that load (Pout/Pin). As shown in the diagram, the efficiency can vary. This efficiency can vary by manufacturing distributions (changes due to manufacturing variations), but more importantly each VR’s efficiency will vary depending on load presented to it.
The input voltage to the power conversion also affects the VR’s efficiency. A higher input voltage typically results in lower conversion efficiency compared to a lower input voltage (VDC). This is important because batteries will have a much lower output voltage than what the AC brick delivers (a fact dependent on the charging circuits), so inherently the power delivery (CPU VR and PLT VR) will be less efficient in AC mode than in DC mode.
For the case of ENERGY STAR, the power source will be the AC brick. Again the AC brick can be thought of providing a power conversion from AC power to some lower AC or DC voltage and therefore as a power conversion efficiency associated with it also.
For example a power conversion component which is 80% efficient will require 1 W to deliver 0.8 W to a load. For purposes of this paper, we will represent the efficiency of the CPU VR by CPUeff, the efficiency of the Platform VR by PLTeff and the efficiency of the AC Brick by ACeff.
Right away you will note that the power of the CPU load is amplified by the efficiency of the CPU VR (1/CPUeff), and then further amplified by the AC Brick (1/ACeff). The total power of the system can then be modeled by the equation:
Equation 1
⎟⎟⎠
⎞⎜⎜⎝
⎛⋅+⋅= PLTLoad
PLTeffCPULoad
CPUeffACeffWAC 111)(
19

Notebooks and ENERGY STAR Requirements
For the CPU, if you assume an 80% efficient regulation, and the AC brick is 80% efficient, then a 1 W CPU load requires 1.3 W of AC power. If you assume 75% efficient load for the platform, then a 1 W platform load would require 1.7 W of AC power. As can be seen the power delivery amplifies the power needed at the load.
3.5 ENERGY STAR Requirements for the AC Brick
For AC power operation, the AC brick is one of the critical factors affecting power in the platform and has an additional set of requirements outlined in a separate ENERGY STAR specification: ENERGY STAR Program Requirements for External Power Supplies. In this section we will review these requirements and analyze how they affect notebook designs.
This document outlines two major requirements:
1. Minimum Average Efficiency in Active Mode
2. Maximum Power at no load
Table 2 and Table 3 represent these requirements.
Table 2. Active Mode Requirements for Average Efficiency
Nameplate Output Power (Pno) Minimum Average Efficiency in Active Mode (expressed as a decimal)
0 to ≤ 1 W ≥ 0.49 * Pno
> 1 to ≤ 49 W ≥ [0.09 * Ln (Pno)] + 0.49
> 49 W ≥ 0.84
Table 3. No Load Requirements
Nameplate Output Power (Pno) Maximum Power in No-Load
0 to < 10 W ≤ 0.5 W
≤ 10 to ≤ 250 W ≤ 0.75 W
For notebooks, which typically have AC bricks rated above 49 watts, the second requirement means that an unplugged AC brick should consume no more than 0.75 W from the wall socket.
For notebooks the first requirement translates into meeting a minimum average efficiency of 84%. Average efficiency is defined by measuring and averaging efficiencies at four different loads (100%*Po, 75%*Po, 50%*Po and 25%*Po); where Po is the maximum rated output power of the AC brick. This is illustrated in Figure 5 (note the blue circles).
20

Notebooks and ENERGY STAR Requirements
Figure 5. Example AC Brick Efficiency over Different Loads
This diagram shows the efficiency of a brick on the vertical axis, and the load (as a percent of the maximum rated load, Po) on the horizontal axis; the red line representing the efficiency of the AC brick over various loads. As noted you can see the efficiency is lower for low loads, and also trails off for very high loads. The four blue circles represent the efficiency/load points to measure and average in order to meet the ENERGY STAR requirement Average Efficiency. For simplicity assume that the Po for this particular AC brick is 100 W (so the percentage and load values are the same).
An issue is highlighted when you note the color shaded areas which represent the notebook loads of interest for meeting the ENERGY STAR notebook requirements: idle load (green for category A, purple for category B), sleep load (yellow) and standby load (blue). The loads of interest are outside what the ENERGY STAR specification requires to be measured for a compliant AC brick. Also note how the efficiency of the brick dramatically starts dropping at these loads of interest.
Do not rely on the ENERGY STAR External Power Supply specification for the AC brick to create an acceptable power brick. This specification is generic and covers any AC brick a consumer device may use and does not require high efficiencies at loads that matter to the notebook ENERGY STAR specification. More specifically, the specification requires high efficiency from 25% to 100% of nameplate load. Because the brick is designed to meet maximum power requirements for simultaneous operation and charging, the laptop will operate at a low fractional load during the ENERGY STAR idle test.
The ENERGY STAR specification for external power supplies (EPS) determines the load fraction by the ratio of current (amps) to nameplate current, the load fractions in the specification (i.e. 25%, 50%, 75%, 100%) do not always match the ratio of power (W) to nameplate power. Because the computer specification is based on power (W) it is important to consider the actual load at idle and the AC brick nameplate power rating.
Therefore, when purchasing or designing AC bricks for notebooks, place low load efficiency requirements that will correspond to the loads of interest (1 W-2.4 W, 14 W and 22 W). Maximizing efficiency at these loads will decrease the overall power draw of your laptop computer (less loss through the AC brick).
As we shall see next, the majority of notebook power (as it concerns ENERGY STAR) is consumed by the power delivery.
21

Notebooks and ENERGY STAR Requirements
3.6 Power Breakdown of the Notebook
For the notebook we described previously, measured in an ENERGY STAR idle configuration, a typical power breakdown for a category A notebook is illustrated in Figure 6.
Figure 6. Typical Notebook Idle Power Breakdown
COMM11%
Audio4%
HDD7%
ODD2%
Other5%
CLK Chip3%
ICH7%
CPU14%GMCH
9%
DRAM3%
CPU VR3%
PLT VR13%
AC Loss19%
Idle Power Breakdown of System under EPA Idle Conditions Power = Efficiency Loss (35%) + Platform (65%)
Power delivery represents 35% of the total power (AC Adapter, PLT VR and CPU VR) assuming a CPU, Platform and AC efficiencies of 80%, 80% and 80% respectively. LCD Panel is not shown as the backlight is blanked and no power is drawn. The power breakdown of the other platform components is also illustrated.
Another major component of power here is represented by the gigabit Ethernet which is represented by 11% COMM power (which represents its PHY power) and some portion of the ICH power (7%).
Note that if a 44 W-hr battery was inserted into the AC powered system, then the power draw could go up substantially as the system would add another 44W load and require an additional 55 W of AC power to charge the battery. This is why we remove the battery when measuring power (if it is not fully charged, it could easily disrupt idle power measurements).
For the notebook we described previously, measured in an ENERGY STAR sleep (S3) configuration (with WOL enabled), a typical power breakdown for a notebook is illustrated in Figure 7. In this case the power delivery consists of over 57% of the power budget, while the WOL represents 26% of the power budget. The normal sleep operation represents the remaining 16% of the power budget (DRAM and “other”). This assumes a 66% PLT VR efficiency and a 65% AC efficiency (CPU is off).
22

Notebooks and ENERGY STAR Requirements
Figure 7. Typical Notebook Sleep Power Breakdown
ICH14%AC Loss
36%
PLT VR22% DRAM
8%
Other8%
COMM12%
EPA S3 WOL Requirement ≤ 1.7W (system) + 0.7W (WOL aka. Ethernet) System (~74%) = Efficiency Loss (~57%) + DRAM (~8%) + Other (~8%) Ethernet (~26%) = Controller (~14%) + PHY (~12%)
We have shown that the power distribution is the major component in the idle and sleep powers, let us next look at the sensitivity of this power to the efficiencies of the power delivery system.
3.7 Power sensitivity to Power Delivery Efficiencies
As we noted already, VR efficiencies change over various loads; they tend to get less efficient at very low loads, or very high loads. Let us look at how the platform power distribution changes based on the power delivery efficiencies changing.
23

Notebooks and ENERGY STAR Requirements
Figure 8. Idle Power distribution across efficiencies
Idle Power Effects by varying efficiency: Idle(CPU%, PLT%, AC%)
0%
10%
20%
30%
40%
50%
60%
70%
80%
90%
100%
Idle(75,65,65) Idle(95,85,85)
AC
PLT VR
CPU VR
Other
ODD
HDD
Audio
COMM
CLK Chip
DDR
ICH
GMCH
CPU
42% Power delta based on different efficiency
Power Delivery56.4%!
Power Delivery25.9%
Power Delivery
In Figure 8 we show the effects of changing the efficiency of the power delivery (CPU VR, PLT VR and AC) efficiencies. The first bar graph shows the platform power breakdown for efficiencies of 75%, 65%, 65% respectively and the second bar graph of 95%, 85%, 85% respectively. As can be seen the total power of the system dropped by 42%. In the first case the power delivery contributed to 56.4% of the platform, while in the more efficient case it only contributed to 26% of the platform power.
In Figure 9 we have modified the sleep power delivery efficiency (PLT VR and AC brick) from 50%, 50% in the first bar graph to 75%, 75% respectively for the second bar graph.
Figure 9. Sleep Power distribution across efficiencies
Sleep Pwr Effects due to efficiencies S3(PLT%, AC%)
0%
10%
20%
30%
40%
50%
60%
70%
80%
90%
100%
S3(50,50) S3(75,75)
AC
PLT VR
Other
COMM
DDR
ICH
40% Power delta based on different efficiency
Power Delivery
75%!Power Delivery
57.8%
Power Delivery
24

Notebooks and ENERGY STAR Requirements
In this case we see that the power varies by 40% between the two configurations where in the first configuration that power delivery contributed to 75% of the total power, while in the second case it dropped to 58% of the total power.
As can be seen, power delivery and the efficiencies of the components have a major impact on platform power (both idle and sleep) and will greatly impact the platform’s ability to meet the ENERGY STAR requirements.
Another area that will greatly affect platform power is altering the load through various power management features. As an example to illustrate this point we show the same system in an idle ENERGY STAR configuration where we change the default CPU idle state.
The computer industry uses C-state terms to describe the activity of the CPU. When it is executing it is said to be in a C0 state, and while it is idle it can be in one of the many Cx states (C1, C2, …) where the higher the number, the lower the power and the higher the exit latency (lower performance). These states are entered and exited hundreds of times each second.
Why have multiple C-states? Each C-state trades off lower power for higher exit latency; so the system is tuned to have the best balance of power and performance (C-state exit latency) for a given configuration.
For this example we are going to illustrate the differences in platform power by varying the default C-state: in the first case we will show the higher power C2 idle CPU state, while in the second case we will show the lower power C3 idle CPU state. As can be seen, changing the default C-state from C2 to C3 resulted in a 29% platform power delta on the same platform (see Figure 10). This low power states not only affects the CPU, but you can notice how the power in the GMCH, DRAM and power delivery also change.
25

Notebooks and ENERGY STAR Requirements
Figure 10. Idle Effects of Low Power States
Idle Power Effects of CPU C-states
0.00%
10.00%
20.00%
30.00%
40.00%
50.00%
60.00%
70.00%
80.00%
90.00%
100.00%
IdleC2/E* IdleC3/E*
AC Loss
PLT VR
CPU VRDRAM
GMCH
CPU
OtherODD
HDD
Audio
COMMCLK Chip
ICH
29% Power delta based on different
CPU C-state defaults
3.8 Optimizing a Notebook for ENERGY STAR
We have illustrated how AC power is affected by a number of different platform factors. The most important attribute is power delivery; and given that most platform and CPU power delivery designs are already optimized for battery operation (and are efficient at operating loads) the AC brick should be closely scrutinized for efficiencies over the ENERGY STAR loads of interest.
The next area to examine is battery power management features which are traditionally disabled when running on AC and configuring the platform to enable these under the AC mode of operation. As an example, there is a large power reduction by using C3 as the default C-state under AC mode versus a C2 state.
If the power is still high in idle, then the next step is to look for crying babies. This is a term used to describe devices which do not rest when idle, and in the process wake everyone else up (like a baby crying at night, if the baby sleeps through the night everybody sleeps, but if the baby cries every 15 minutes nobody sleeps). A crying baby device which generates activity when idle will keep all of the other subsystems out of their low power states (memory, busses, clocking, …). And as we discussed, this additional power load then gets amplified by the power delivery system.
USB devices are classic crying babies which generate lots of bus traffic when the device is sitting idle (keeping the rest of the system busy). In general, integrating USB devices into the platform can result in a non-optimal design for power management. If
26

Notebooks and ENERGY STAR Requirements
you cannot avoid integrating a USB device, then insure the USB device can support a “selective suspend” mode such that when the device is idle its function driver can suspend the device and then the USB driver can shutdown the USB controller so it will not generate idle activity. Further, if you have having trouble meeting ENERGY STAR idle power requirements, check to see if you have an integrated USB device.
The type of Operating System (OS) can also affect idle power. The way the OS schedules work can influence the amount of time the CPU spends in idle and will affect the idle power of the platform. Additionally an operating system that schedules daemons to pop-up and do work when the system is idle will also affect idle power Having one of these pop-up just prior to your ENERGY STAR idle test could be problematic and is the reason why the system is allowed to sit idle for 15 minutes prior to actually testing the system and the power is averaged over 5 minutes. Also, a provision has been made for the tester to go through the first boot process and bring the system up to it’s normal use state, further reducing the chance of this impacting the idle test.
Not all hardware is the same either. Different CPU’s, chipsets and devices will have different power attributes and support different power management features, which can dramatically reduce the load when the system is idle. Again as illustrated earlier, a power management feature that can save 1 W of power will translate to 1.7 W (or so) of power at the AC input.
With Sleep and Standby, again the majority of the power budget is dedicated to power delivery (typically over half). The AC brick should be optimized for these targeted loads (1 W – 2 W). Again you cannot rely on the ENERGY STAR External Power Supply specification for external bricks as they do not account for these low loads (idle is marginal), so the first action is to optimize the AC brick for these low loads, and then minimize the load for sleep and standby. In many cases an external power supply that has better efficiency than is required for the ENERGY STAR specification is needed.
Low power technologies are always being created and any paper on low power system design should cover some of these new technologies. One such technology is the field of large non-volatile hard disk drive (HDD) caches. The concept is to place a fast (compared to the HDD speed) non-volatile memory, i.e. NAND FLASH, between the CPU and the HDD, and then store the most often accessed HDD into the cache. Because the memory is faster, the overall platform performance is increased, and because the HDD is utilized less (the majority of accesses now occur to this FLASH), the power of the system becomes lower as the HDD can remain much longer in its low power state. There are few technologies that both speed up the system and lower its power; so this is a great technology: mobile systems will want it to decrease power consumption, while higher-end systems will want it just to get the performance boost. However please note that, as of the time this document was published, ENERGY STAR requires HDD spindown to be disabled during the idle test. Please check the specification for any possible revisions that apply to NV cache HDD technology.
How much does this technology boost performance and lower system power? Performance will vary with application, but the HDD is considered one of the I/O bottlenecks of platform performance. Access times to HDD memory can be measured in milliseconds (say ~8ms), while accesses to FLASH memory can be measured in hundreds of nano-seconds (say ~120ns); hence FLASH is roughly 10,000 times faster than the HDD. Users won’t see this speed-up, as overall performance is much more complicated (certain percentage of HDD accesses, cache misses, etc…), but it certainly reduces the impact of HDD latency to overall system performance.
27

Notebooks and ENERGY STAR Requirements
Additional performance can be gained by “pinning” commonly used applications within the FLASH memory. Basically think of the application remaining in the FLASH memory such when using/loading these applications the HDD is not used at all.
What is the power impact of these non-volatile caches? The HDD contributes about 7-10% of system power (our breakdown shows about 7%), as such the maximum upside is removing this power component. The majority of the HDD power is that needed to spin the disk; hence one area to look at is how does such a cache impact the ability for the system to spin-down the HDD? Ruston Panabaker of Microsoft published such a study in a WinHec ’06 presentation6 and a graph from this presentation is reproduced below:
Figure 11. Percent Spundown Time Operating on Battery
Percent Spundown Time Operating on Battery
0
10
20
30
40
50
60
70
80
90
100
Writeback +Spindown Logic
64 128 256 512 1024
NV Cache Size (MB)
Perc
ent S
pund
own
Tim
e
Active Use Scenario Idle ScenarioDVD Playback
This graph7 shows the percent of time the HDD spins-down based on the size of the NV Cache. Assuming that these caches will be 512Mbytes or larger, you’ll see that an idle system would be spun down over 95% of the time. Further it shows that even running an active workload such as DVDE playback the HDD can be spun-down 95% of the time, and that a very active usage the HDD could be spun down over 65% of the time.
While much of the benefit for power was originally targeted at notebook battery operation, the same technology will also help the AC power characteristics of any system using this technology. As discussed previously, this 7-12% of HDD power
6 Hybrid Hard Disk And ReadyDrive™ Technology: Improving Performance And Power For Windows Vista Mobile PCs (download.microsoft.com/download/5/b/9/5b97017b-e28a-4bae-ba48-174cf47d23cd/STO008_WH06.ppt)7 Hybrid Hard Disk And ReadyDrive™ Technology: Improving Performance And Power For Windows Vista Mobile PCs (download.microsoft.com/download/5/b/9/5b97017b-e28a-4bae-ba48-174cf47d23cd/STO008_WH06.ppt)
28

Notebooks and ENERGY STAR Requirements
savings will then get amplified by the platform VR efficiency and further by the AC brick efficiency. Of course some of the best ways to save power in personal computers is to enable the monitor and system sleep states when the system is idle. Use of NVM to cache HDD represents just one of the background technologies, the industry and system developers should be encouraged to develop to improve energy efficiency. These technologies are also not limited to notebooks or even desktop PCs. As described in subsequent chapters, workstations and enterprise class machines rely on increased amounts of bulk memory (HDDs). The HDD’s power percentage of the system and hence, the energy savings along with performance gains can exceed 20% in these configurations.
The new ENERGY STAR specification requires OEMs to ship systems with power management features enabled. As mentioned previously, “a system is required to be shipped with the monitor enabled to sleep after 15 minutes of idle, while the entire system to is required to enter sleep after 30 minutes or less of idle”. The monitor sleep mode will enable ENERGY STAR platforms to enter power states that bring the total system power to below 14 W for a category A notebook, and below 22 W for a category B notebook, while the system sleep mode will enable the entire platform to enter a 1.7 W to 2.4 W mode.
3.9 Summary
Several choices in components and system configuration can greatly influence the power use of the computers you supply and the energy bills of your customers. This chapter outlined examples of these practices including:
•
•
•
•
Tune efficiency of the AC brick so that it reaches its higher efficiency levels when the computer is idling (typically 14 – 24W). Avoid having idle fall at less than 25% of the AC bricks nameplate load.
Ensure that system power management features (e.g. C-state selection) are tuned for both battery and AC operation, and are aggressive enough to meet these new ENERGY STAR AC power requirements.
Ensure that the platform is enabled to meet ENERGY STAR shipping requirements. In particular that the monitor will enter sleep after 15 minutes or less of idleness and that the system will enter a sleep state after 30 minutes or less of idleness while on AC power.
Ensure that devices are generating no activity when idle (avoid crying babies).
29

Desktop Computers and ENERGY STAR Requirements
4 Desktop Computers and ENERGY STAR Requirements
4.1.1 Category Definitions
In order for a desktop system to be eligible to meet ENERGY STAR it must first meet the definition of a desktop computer. A desktop computer is defined as a computer system intended to be located in a permanent location, i.e., desk or floor, and utilizes an external monitor, keyboard, and mouse. Within the ENERGY STAR requirements there are three categories of desktops systems.
Category A: All desktop computers that do not meet the definition of either Category B or Category C will be considered under Category A for ENERGY STAR qualification.
Category B: To qualify under Category B desktops must have:
•
•
Multi-core processor(s) or greater than 1 discrete processor; and
Minimum of 1 gigabyte of system memory
Category C: To qualify under Category C desktops must be have:
•
•
•
•
•
Multi-core processor(s) or greater than 1 discrete processor; and
A GPU with greater than 128 megabytes of dedicated, non-shared memory
In addition to the requirements above, models qualifying under Category C must be configured with a minimum of 2 of the following 3 characteristics:
Minimum of 2 gigabytes of system memory;
TV tuner and/or video capture capability with high definition support; and/or
Minimum of 2 hard disks.
Each of the ENERGY STAR categories contains AC wall power requirements. These requirements are for power measured at the wall plug for idle, sleep, and standby power. Systems that do not ship with Wake On LAN enabled only have to meet the standard sleep and standby requirements. Systems shipping with Wake On LAN enabled are allowed to consume an additional 0.7 W of AC power at the wall plug. In addition to the idle, sleep and standby AC wall power requirements the power supply efficiency and power supply power factor requirements need to be met. These requirements are listed in Table 4. For further details see the ENERGY STAR Program Requirements for Computers: Version 4.0 specification.
30

Desktop Computers and ENERGY STAR Requirements
Table 4: ENERGY STAR Category Wall Power Requirements
ENERGY STAR Category A B C
Idle AC Wall Power 50 W 65 W 95 W
Sleep AC Wall Power 4 W
Standby AC Wall Power 2 W
Wake On LAN AC Wall Power Adder
0.7 W
Power Supply ≥ 80% efficient, ≥ 0.9 PF
In addition to the above requirements, when a desktop system is shipped it must be delivered with the display’s sleep mode set to activate after 15 minutes or less of user inactivity and with the desktop system sleep mode set to activate after 30 minutes or less of inactivity.
A number of requirements exist, regardless of distribution channel, for Wake On LAN configurations. For the specifics of the requirements, refer to the ENERGY STAR Program Requirements for Computers: Version 4.0 specification.
4.2 Power Supply Considerations
ENERGY STAR has specific requirements for the computer system’s internal power supply. In addition to these specific requirements, there are a number of aspects of the computer power supply that must be considered when building an ENERGY STAR compliant desktop computer system. These aspects of selecting a proper power supply will be discussed in this section.
4.2.1 ENERGY STAR Requirements
Tier 1 of the ENERGY STAR computer specification as documented in ENERGY STAR Program Requirements for Computers: Version 4.0 requires that the internal power supplies for compliant computers be at least 80% efficient. The efficiency is specified at 20%, 50% and 100% of the rated output capacity. In addition, the power supply needs to have a power factor of at least 0.9 measured at 100% of the rated output capacity. In order to meet the power factor requirements, internal power supplies will need to incorporate active power factor correction. Active power factor correction consists of wave shaping circuitry on the AC input side of the power supply to improve the power factor. It is unlikely that power supplies with passive power factor correction will be able to satisfy the 0.9 power factor requirement.
4.2.2 Overall Efficiency Measurements
Desktop computer systems typically use internal power supplies with multiple outputs. These outputs are 12 V, 5 V, 3.3 V, 12 V, -12 V and 5 VSB (or 5 V standby). Power supply efficiency for the multiple output power supplies is defined in terms of a sum of
31

Desktop Computers and ENERGY STAR Requirements
the individual outputs. Equation 2 defines the efficiency for a single output power supply.
Equation 2
PinPout
PSU =η
However for a multiple output power supply the efficiency definition is slightly different and shown in Equation 3.
Equation 3
Pin
iPouti
PSU
∑=
,η
In many cases, the sum of the output power capability for the individual outputs exceeds the total output capacity of the power supply. For these cases, a method of proportional loading needs to be applied in order to measure or calculate the efficiency of the power supply. This proportional loading method is explained in detail in the Generalized Internal Power Supply Efficiency Test Protocol which is available from www.efficiencypowersupplies.org.
4.2.3 Power Supply Sizing
The ENERGY STAR computer specification requires at least 80% efficiency at 20%, 50% and 100% of the rated output capacity. This effectively provides a window of high efficiency that extends from 20% to 100% of the rated capacity of the power supply. Internal power supplies for desktop computers are available in a number of capacities that vary from approximately 150 W up to 1000 W or more. Generally the efficiency of the power supply drops off significantly as the load falls below 20%. Because the power supply is one of the largest contributors to power loss in the system, it is important to maximize the efficiency in order to comply with the power targets for the various system categories. Below are two case examples for the desktop category B system to illustrate this concept. For these two cases, assume the efficiency curve in terms of percentage of the output is equivalent. This curve is shown in Figure 12.
32

Desktop Computers and ENERGY STAR Requirements
Figure 12. PSU Efficiency as Percentage of Output
Efficiency as Percentage of Output
0%10%20%
30%40%50%60%70%
80%90%
100%
0% 20% 40% 60% 80% 100% 120%
Percentage of Output Capacity (%)
Effic
ienc
y (%
)
NOTE: Graph is an estimated representation for illustrative purposes only.
CASE 1
For Case 1, suppose the system we are trying to configure to meet the desktop category B has a 450 W internal power supply. The category B idle power specification is 65 W AC wall power. The AC wall power is calculated or derived as shown in Equation 4.
Equation 4
PSU
WDCWACη
)()( =
In order to minimize the AC wall power, we need to maximize the power supply efficiency. As can be seen from Figure 13, for a 450 W power supply, the efficiency is low when the system is at 65 W AC wall power. Because the category B system at idle is on the part of the power supply efficiency curve where the efficiency is low, the remaining power budget for the other system components is much less than if the power supply efficiency was higher.
33

Desktop Computers and ENERGY STAR Requirements
Figure 13. PSU Efficiency per Power for 450 W PSU
Efficiency per Power for 450 W PSU
0%10%20%30%40%50%60%70%80%90%
100%
0 100 200 300 400 500 600
Power (W)
Effi
cien
cy (%
)
Efficiency per DC Power Efficiency per AC Power
High efficiency window≥ 80% efficiency
NOTE: Graph is an estimated representation for illustrative purposes only.
CASE 2
For Case 2, assume the system we are trying to configure for category B has a 250 W power supply. In this case, Figure 14 shows that for an idle state of 65 W AC wall power, the system is within the high efficiency window of the power supply.
Since the system is operating within the high efficiency window of the power supply when in the idle state, the power supply losses are minimized which allows additional budget for other system components.
34

Desktop Computers and ENERGY STAR Requirements
Figure 14. PSU Efficiency per Power for 250 W PSU
Efficiency per Power for 250 W PSU
0%10%20%30%40%50%60%70%80%90%
100%
0 50 100 150 200 250 300 350
Power (W)
Effi
cien
cy (%
)
Efficiency per DC Power Efficiency per AC Power
High efficiency window≥ 80% efficiency
NOTE: Graph is an estimated representation for illustrative purposes only.
The examples in Case 1 and Case 2 above show that building the system with a power supply that is the proper size will maximize the power supply efficiency and allow the most flexibility for selecting other components in the system.
In order to stay within the ≥ 80% efficiency window generally, the power supply sizes for each of the desktop system categories are shown in Table 5.
Table 5. Power Supply Sizes for Desktop System Categories
System Category Maximum Power Supply Size
A ≤ 200 W
B ≤ 260 W
C ≤ 380 W
NOTES: 1. The power supply sizes shown this table represent the maximum size in order to stay
within the ≥ 80% efficiency window. It is important; however, to ensure that the power supply also has sufficient capacity to handle the active or heavy workloads that the system may be subjected to. Larger power supplies are sometimes needed to allow for future system upgrades though a tradeoff for efficiency in the idle state may be necessary.
4.2.4 5 V Standby (5 VSB) Efficiency
As discussed previously, desktop systems typically have a multiple output power supplies. Of these multiple outputs, the 5 VSB (or 5 V standby) output is unique. This output is always present when the power supply is plugged into the AC wall outlet. The other outputs are off until the system powers on the entire power supply unit.
35

Desktop Computers and ENERGY STAR Requirements
Generally, the 5 VSB output is generated inside the power supply using its own circuit. It is this 5 VSB output that powers circuitry in the system when the system is in the standby and sleep states.
Because the 5 VSB output is the only output present for the sleep and standby states it is possible to measure the efficiency of this output independent of the other outputs. In order to meet the sleep and standby targets for ENERGY STAR, the power supply will need to have good efficiency performance for the 5 VSB output. For the overall power supply efficiency measurements, the 5 VSB efficiency only has a small affect because of the relatively small current capability. Because of this it is possible to have a power supply that is ≥ 80% efficient overall and yet has poor 5 VSB efficiency. The Power Supply Design Guide for Desktop Platform Form Factors available at www.formfactors.org has guidelines for 5 VSB efficiency that can be used to guide purchase decisions to ensure good efficiency for this portion of the power supply.
4.2.5 External Power Supplies for Desktop Systems
Desktop systems that use external power supplies should use ENERGY STAR qualified external power supplies or use power supplies that meet the external power supply requirements defined at www.energystar.gov/powersupplies.
4.3 Operational Modes
In order to test a system for ENERGY STAR compliance, the wall or AC power of the system needs to be measured in three different operational modes. These modes are Idle Mode, Sleep Mode and Standby Mode. The specific test procedures and factors that affect power in these modes are described in this section.
Before beginning to do any power measurements on the system please ensure that the operating system power management setting are configured correctly. The monitor and hard drive power management settings should be configured such that both the monitor and the hard drive(s) remain active for the duration of the idle test.
Appendix A of the ENERGY STAR Program Requirements for Computers: Version 4.0, contains detailed requirements for the power measurement equipment. In addition, a power meter that is capable of logging power data over time at a rate of at least one reading per second is useful for creating a record of power over time which can be used for more detailed analysis of the power consumption of the system.
Each of the system operational modes has different power states for the system components. Figure 15 through Figure 17 show examples of which elements of the system are powered in the various operational modes.
36

Desktop Computers and ENERGY STAR Requirements
Figure 15. Idle Mode System Power State Example
Powered Off
Powered On
CPU
(G)MCH
Flash
ICH
DRAM
Sus Well
MACSPI
Sus Well
MACSPI
CLOCK
LAN
DRAM
Figure 16. Sleep (S3) Mode System Power State Example
CPU
(G)MCH
ICH
DRAM
CLOCK
DRAM
Flash
Sus Well
MAC
SPI
LAN
Powered Off
Powered On
Self Refresh
Powered Off
Powered On
Self Refresh
37
Desktop Computers and ENERGY STAR Requirements
NOTE: Wake On LAN enabled.
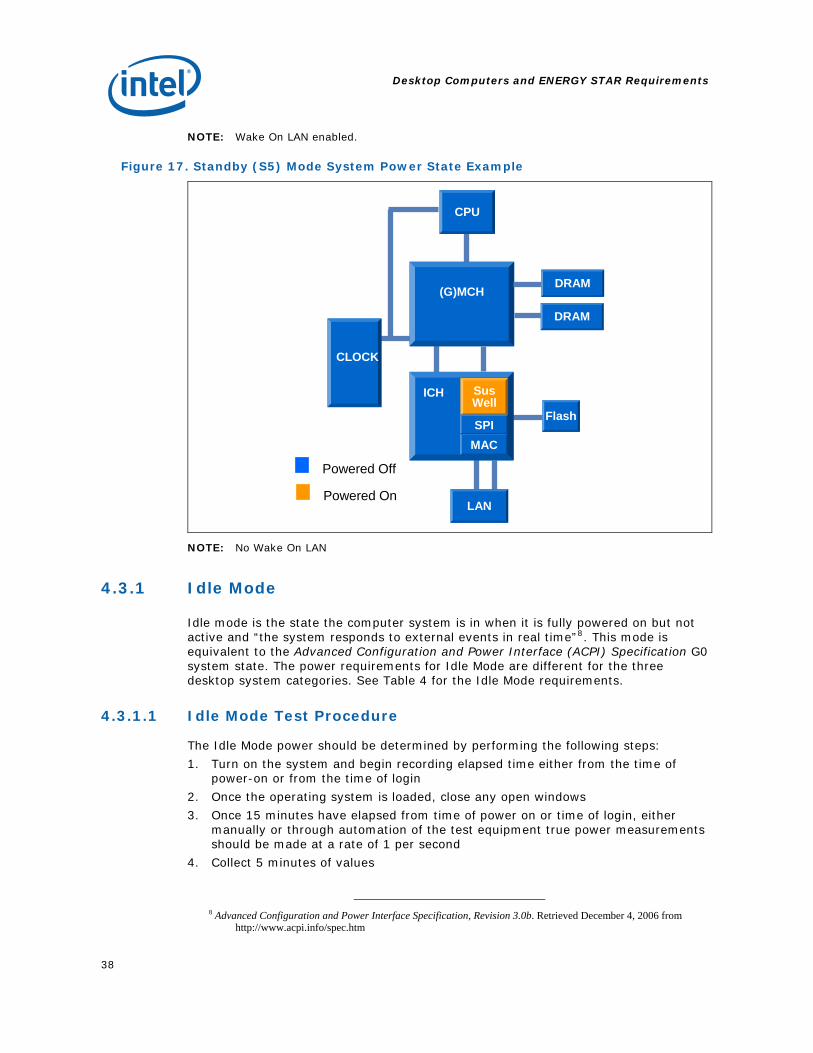
Figure 17. Standby (S5) Mode System Power State Example
CPU
(G)MCH
Flash
ICH
DRAM
CLOCK
LAN
DRAM
Sus Well
MACSPI
Sus Well
MACSPI
Powered Off
Powered On
NOTE: No Wake On LAN
4.3.1 Idle Mode
Idle mode is the state the computer system is in when it is fully powered on but not active and “the system responds to external events in real time”8. This mode is equivalent to the Advanced Configuration and Power Interface (ACPI) Specification G0 system state. The power requirements for Idle Mode are different for the three desktop system categories. See Table 4 for the Idle Mode requirements.
4.3.1.1 Idle Mode Test Procedure
The Idle Mode power should be determined by performing the following steps:
1. Turn on the system and begin recording elapsed time either from the time of power-on or from the time of login
2. Once the operating system is loaded, close any open windows
3. Once 15 minutes have elapsed from time of power on or time of login, either manually or through automation of the test equipment true power measurements should be made at a rate of 1 per second
4. Collect 5 minutes of values
8 Advanced Configuration and Power Interface Specification, Revision 3.0b. Retrieved December 4, 2006 from http://www.acpi.info/spec.htm
38

Desktop Computers and ENERGY STAR Requirements
5. The average of the 300 true power measurements is reported as the Idle Mode power level
4.3.1.2 Factors that Affect Idle Mode Power
Version 4 of the ENERGY STAR requirements for computers sets an aggressive target for computer system energy consumption. Therefore, in order to configure a compliant system, the system components must be selected carefully. Motherboards, power supplies, processors, hard drives, voltage regulators, etc. should all be considered when integrating or designing a computer system.
Figure 18 is an example of how some of the components in the system vary in terms of their idle power consumption for Category A or B systems. In this example, if you configured a system using all components at the high power end of the range, the resulting system would not be compliant with the Category A or Category B idle mode power requirements. On the other hand if you configured a system using all components from the low power range of the distribution, the system would be compliant with the idle mode requirements for both Category A and B. Use of components from the average range in this example would allow compliance with the desktop Category B requirements.
If the power is still high in idle, then the next step is to look for crying babies. This is a term used to describe devices which do not rest when idle, and in the process wake everyone else up (like a baby crying at night, if the baby sleeps through the night everybody sleeps, but if the baby cries every 15 minutes nobody sleeps). A crying baby device which generates activity when idle will keep all of the other subsystems out of their low power states (memory, busses, clocking, …). And as we discussed, this additional power load then gets amplified by the power delivery system.
USB devices are classic crying babies which generate lots of bus traffic when the device is sitting their idle (keeping the rest of the system busy). In general, do not integrate USB devices into the platform. If you cannot avoid integrating a USB device, then ensure the USB device can support a “selective suspend” mode such that when the device is idle its function driver can suspend the device and then the USB driver can shutdown the USB controller so it will not generate idle activity. Further, if you have having trouble meeting ENERGY STAR idle power requirements, check to see if you have an integrated USB device.
In addition to the tradeoffs that can be made between components for power, system designers need to consider performance, cost and feature tradeoffs as well when designing or building ENERGY STAR systems.
39

Desktop Computers and ENERGY STAR Requirements
Figure 18. System Idle Power Factors
System Idle Power Factors
0%
20%
40%
60%
80%
100%
120%
140%
160%
Total S
ystem
Motherb
oard
PSU Losse
s
Hard Driv
e
Proces
sor
Proces
sor V
R Loss
Memory
Optica
l Driv
eFan
s
% T
otal
Sys
tem
Pow
er B
udge
t
Avg Min Max
NOTE: Graph is an estimated representation for illustrative purposes only.
4.3.2 Sleep Mode
Sleep mode is the state the computer system is in when it is placed into the standby state. This mode is equivalent to the Advanced Configuration and Power Interface (ACPI) Specification G1/S3 sleeping state. The operating system context is preserved in system memory for this state. The power requirements for Sleep Mode are the same for all three desktop system categories.
4.3.2.1 Sleep Mode Test Procedure
The Sleep Mode power should be determined by performing the following steps:
1. Place system in Sleep state
2. Either manually or through automation of the test equipment true power measurements should be made at a rate of 1 per second
3. Collect 5 minutes of values
4. The average of the 300 true power measurements is reported as the Sleep Mode power level
5. If testing both Wake On LAN (WOL) enabled and WOL disabled, steps 1-4 above should be performed for both WOL settings
40

Desktop Computers and ENERGY STAR Requirements
4.3.2.2 Factors that Affect Sleep Mode Power
As can be seen in Figure 16, when the system is in the sleep mode or S3 state, portions of the system are still powered. In this mode the system is powered only by the 5 VSB portion of the power supply so the efficiency of the 5 VSB portion of the power supply has a significant impact on the power measured at the AC wall plug. Refer to Section 4.2.4 for additional information.
For systems with Wake On LAN (WOL) enabled in the sleep state, powering the LAN to look for wake traffic consumes some additional power. Also, the link speed of the LAN in this state affects magnitude of this additional power. For example, the difference between 100 Mb WOL and 10 Mb WOL is 485 mW for Intel® 82566 Gigabit Platform LAN Connect Networking Silicon.
Figure 16 indicates that the system memory is the self-refresh state in the sleep mode. Because of this the number of DRAM devices present and their associated self-refresh power impacts the sleep power of the system.
Other aspects of the system to consider when performing an analysis of sleep mode power or optimizing the system to reduce sleep mode power are the efficiency of motherboard regulators that are powered in this mode as well as the number and type of devices that are enabled and allowed to wake the system.
4.3.3 Off Mode (Standby)
The off mode or standby state is the state the computer system is in when it is shutoff but still plugged into the AC power outlet. This mode is equivalent to the Advanced Configuration and Power Interface (ACPI) Specification G2/S5 or soft-off sleeping state. The operating system context is not preserved in this state. The power requirements for Off Mode are the same for all three desktop system categories.
4.3.3.1 Off Mode Test Procedure
The Off Mode power should be determined by performing the following steps:
1. Place system in Off state
2. Either manually or through automation of the test equipment true power measurements should be made at a rate of 1 per second
3. Collect 5 minutes of values
4. The average of the 300 true power measurements is reported as the Sleep Mode power level
4.3.3.2 Factors that Affect Off Mode Power
As can be seen in Figure 16, when the system is in the Off mode or S5 state, portions of the system are still powered. In this mode the system is powered only by the 5 VSB portion of the power supply so the efficiency of the 5 VSB portion of the power supply has a significant impact on the power measured at the AC wall plug. Refer to Section 4.2.4 for additional information.
For systems with Wake On LAN (WOL) enabled in the Off state, powering the LAN to look for wake traffic consumes some additional power. Also, the link speed of the LAN in this state affects magnitude of this additional power. For example, the difference
41

Desktop Computers and ENERGY STAR Requirements
between 100 Mb WOL and 10 Mb WOL is 485 mW for Intel® 82566 Gigabit Platform LAN Connect Networking Silicon.
If Wake On LAN is not enabled or used in the Off state, implementing a hardware switch or some other mechanism to remove power from the LAN in the off state can save a significant amount of power.
Other aspects of the system to consider when performing an analysis of Off mode power or optimizing the system to reduce off mode power are the efficiency of motherboard regulators that are powered in this mode as well as the number and type of devices that are enabled and allowed to wake the system from the Off mode.
4.4 Summary
Several choices in components and system configuration can greatly influence the power use of the computers you supply and in the energy bills of your customers. This chapter outlined examples of these practices including:
•
•
•
•
•
Match the capacity of the power supply and the power draw of the computer in “idle” mode so that it reaches its higher efficiency levels when the computer is idling (typically 40-75W). Avoid having idle fall at less than 20% of the power supply nameplate load.
Ensure that CPU (C-states) and other component power management features are set such that the components run in less active modes
Ensure that monitor power management and computer sleep settings (S-states) are enabled.
Ensure that devices are generating no activity when idle (avoid crying babies).
Consider tradeoffs between power consumption, performance, cost and feature when designing or building ENERGY STAR systems.
42

Workstations and Desktop-derived Servers
5 Workstations and Desktop-derived Servers
ENERGY STAR criteria and metrics are meant to coexist and co-motivate the market to achieve the computing demanded in the most energy efficient manner. Workstations and servers can be classified as business critical computing devices; where throughput and capabilities are critical to the operation of that business. The business criticality is easily observed with the computer systems specifications and configurations commonly employed in this market. Indeed customers of such systems place a premium on these systems that is well beyond the value placed on personal computer requirements for these reasons. For workstations, the workload demands can be in either or both attended (user) and unattended (networked and little user interaction) environments. For servers, the uptime and reliability in an unattended operation serves as the computing backbone for those businesses. Specifically for workstations, operational responsiveness for applications such as CAD/CAE, financial simulations, engineering modeling, graphical or multimedia content creation, and scientific analysis can imply business operation success or failure. In the attended mode, business operation decisions based on these computing responses dictate the capability and capacity of the system. In the unattended or batch operation modes, these very same machines are in many use conditions relied upon to drive completion of project critical milestones, such as scientific, engineering or business modeling. Therefore, any efficiency criteria should comprehend the use condition to co-exist with the market incentives.
5.1 ENERGY STAR Workstation and Desktop Derived Server Specification Scope
The ENERGY STAR workstation and desktop derived server specification challenge was to have an energy metric which scales to the configuration and use demands of such systems. In addition, the metric should not impact the critical aspects for which the system was purchased and configured in the first place. By doing so, one develops a premium classification that both encourages energy savings and supports the varied, increasing capacity and capability requirements in these markets.
Due to several factors: compute capability, dataset criticality, the impact to business operations, energy consumption, along with the need to fully comprehend these use conditions and configurations; the current specification only addresses workstations and desktop derived servers for this category of machines. Enterprise class servers and blade configurations are explicitly not part of ENERGY STAR revision 4. In addition to the classification difference for workstations, the approach and criteria used for energy efficiency was changed to balance the scaleable business needs and the energy consumed.
One key tenet on computing energy efficiency is the system’s ability to automatically migrate between power levels of operation. Indeed, this power management capability and the seamless transition in various modes are already market critical in both mobile and server environments. The unattended business criticality for server or
43

Workstations and Desktop-derived Servers
enterprise environments, uptime requirements, and the fact that this environment is not self contained, drives increased challenges beyond a mobile computer system. From an energy efficiency standpoint, many technologies take advantage of the time-scale of operation, that is to determine how long each component can be at a lower power condition thus enabling the technology’s seamless operation. An attended activity is evaluated in 100’s of milliseconds of operational time slice, to save energy, yet appear to be fully responsive; whereas unattended activity is sliced at a scale of 10’s of microseconds. Response or the latency to wake-up from these lower power conditions without impacting the use condition, is the key technical energy savings challenge. Conversely, simply offering a lower power condition without taking the wake-up response into account will be unlikely to “motivate” energy savings. Solely limiting the power level without accounting for power management transitions either constrains the efficient use of the system or increases the use of older non-energy efficient systems (e.g. purchasing more systems that do less work, but, have lower inactive power levels). Encouraging or providing incentives for the development of power management (and reduced wake-up latencies) was a significant consideration in the development of the ENERGY STAR specifications on workstations.
The first phase of the ENERGY STAR specifications will not include servers, blades, and other enterprise categories due, in part, to the need to incorporate the business operations, workload, use condition and wake-up latency considerations into a simplified set of criteria.
While ENERGY STAR specifications for workstations do comprehend some of these concepts, the workstation metric primarily targets the attended operational characteristics and the power levels of non-active states. Desktop-derived servers are also included in the specifications and focused on its similarity to a standard desktop personal computer.
5.2 Desktop Derived Servers and Specification Application
Desktop-derived servers are so aptly named, driven by use of a desktop personal computer chassis to possibly provide both attended operation but, most definitely provide a secondary level of networked and business services (e.g.; print and file services, simplified mail services). The secondary level of service increases the use of the personal computer and minimizes use conditions such as sleep. Generally such devices, despite some being used 24x7, can tolerate rebooting or significant standby conditions where the response time is not business critical. Once the use conditions and business requirements drive a critical need for continuous-availability, enterprise class machines are employed with redundancy and fail-over features at various levels to support such expectations. The systems supporting such business critical, continuous-availability operations is part of the server classification of machines, and, not part of the current ENERGY STAR specifications.
Given a Desktop-derived server’s similarity in use and expectations in its primary operation to a Desktop personal computer, the criteria and specifications fall into the same categories and limits as defined for desktop computers. As noted, the use expectations in this category of product reflects its use as a standalone attended computer, as well as a stand alone system using the network to distribute services. For the ENERGY STAR limits, testing methods and criteria for Desktop-derived servers, please refer to the Desktop personal computer criteria and comments in the previous sections. There is however, one limit exception, sleep. As highlighted in the use
44

Workstations and Desktop-derived Servers
condition, and operation expectation, explicit long term sleep is not a primary application in this classification of product. Therefore Desktop Derived Servers are exempt from the sleep limits. Technologies however, at sub-application visibility levels, that can exploit sleep-modes of the subsystems to enable lower idle power or faster standby recovery, are highly encouraged.
Desktop-Derived Servers:
•
•
•
•
•
Pedestal, Tower form factor
Class B, (provide EIA, IEEE reference) product and has no more than 1 processor socket on board
All data processing, storage, and network interface is contained in a box
High reliability, high availability, 24/7, 7d/wk, low unscheduled down time9
Providing network infrastructure service, data hosting, web servers
4Refer to Section for desktop derived server categories and requirements. Note that providing compliance data to sleep requirements is not required for desktop derived servers.
5.3 Workstation Category and Definition
Workstations are task critical computing systems that rely heavily on operation response (speed), reliability, large dataset manipulation, and rich data creation or manipulation. Depending on the application employed, the configuration and feature demand changes. Some businesses require high end graphics and rendering, while others require financial and business modeling. A workstation must scale to the capacity and performance demanded. The use condition also varies from critical compute response in attended applications, to being part of a net_batch pool of systems tasked with large scale unattended computing. As a result of these use conditions and incremental features and cost; workstations are driven to maximum configurations and maximum effective use of the system’s features.
The workstation definition highlights both the minimum and optional list of features to constitute a workstation. The definition highlights the features which support the compute intensive, high capacity usage model of these systems. If the system does not lend itself to be classified as a workstation, one can apply as an ENERGY STAR compliant desktop system under the various categories A, B, or C. The criteria may also not address some mobile workstations. Some of these computing devices have inherently compromised the performance or features for the sake of mobility, cost or application criticality. The natural tradeoff will determine which category definition is best suited based on its configuration (use condition prioritization).
The workstation definition focuses on several areas: ECC or secure extensible memory, reliability, high end computing, high end I/O or graphics. These are broken
9 The description on Desktop Derived Servers is considered aggressive with regards to the high reliability and high availability comments. As noted in the general category descriptions in this paper, though used continuously in unattended tasks and at times 24x7, Desktop Derived Servers tolerate more down-time than enterprise class servers and are not employed as business critical solutions, ensuring high reliability or high availability. These two areas are generally why full-featured enterprise class solutions are employed. The energy significance is that to support business critical needs on high reliability and availability, configurations and system architectures provide such as items as redundant power supplies and resource fail-over.
45

Workstations and Desktop-derived Servers
into a mandatory set and optional list, reflecting the various configuration differences within a workstation class machine.
Workstation criteria:
•
•
•
•
•
•
•
•
Has MTBF of at least 15 k-hrs
Support ECC and / or buffered memory
Meet three of the following six optional characteristics:
Support power for high end graphics (i.e., PCI Express* 6-pin 12V power feed)
System is wired for greater than x4 PCI Express on motherboard in addition to the graphics slot(s) and/or PCI-X support
Does not support UMA graphics
Includes 5 or more PCI, PCI Express or PCI-X slots
Capable of MP support for two or more processors (must support 2 or more packages/sockets)
Be qualified by at least ISV product certification, these certifications must be completed within 3 months of qualification
5.4 Workstation Scalable Specification
The workstation criteria was redesigned to scale with the capabilities of the system, thus supporting the premise of co-existing or co-motivation of the market demands of the system with the energy efficiency targets. The metric is known as a scalable version of the Typical Electricity Consumption (TEC)10. Although accurate energy efficiency would reflect energy consumption to accomplish a set of typical tasks, the active mode task suites vary, making the active-mode aspect difficult to define in the current ENERGY STAR specifications. The assumption in focusing on the inactive portions to represent TEC, is that the market forces would motivate the performance side while the ENERGY STAR specification or use of TEC could focus on energy use in inactive states: Idle, Sleep and Standby. With an indeterminate workload (tasks) or work cycle defined, weighting factors used in the current TEC calculations currently reflect a balance of power management features the existing architectures and platforms contain. Both the active workload and the weightings to accurately represent these “Typical Electricity Consumption” modes are expected to be considerations in identifying an efficiency benchmark for the next revision of the ENERGY STAR specification.
10 The EPA document refers to this as Typical Electricity Consumption, and should be considered synonymous in this context
46

Workstations and Desktop-derived Servers
Figure 19. Scaleable Typical Electricity Consumption
NOTE: Simplified diagram of scalable Typical Electricity Consumption index based on system power levels
The additional challenge is to scale the metric or specification based on the capabilities configured on the platform. Given the variety of features and innovations the industry continues to produce a simplified proxy of power to reflect capability is employed. The resulting metric becomes an efficiency index that compares the “typical energy consumed” against the “maximum capability configured in the system”. As the compute demand and capability of the computing devices increases, the definition of an energy efficient system is to keep the typical energy assumption low relative to that peak capability. Scaling in this fashion promotes energy efficient computing without trying to dictate the features, purpose or work accomplished. Maximum power and the scaling provisions that enable power to serve as a proxy for capability is discussed later in this document. The current ENERGY STAR version of this metric, though limited in several areas, such as active mode consumption and work-cycle representation, does effectively scale to the various market demanded system configurations and encourages both the implementation and seamless operation of low power states. The simplified illustration of the scalable version of TEC demonstrates the accumulation of inactive power states as a ratio to “capability” of the system defined by the peak active power state. This efficiency index method is also referred to as Ratio Typical Electricity Consumption, or RTEC.
Specifically, the current ENERGY STAR limit for workstations is
•
•
Typical Electricity Consumption ≤ 35 % of the maximum power of the system
TEC is the sum of: 70% idle power + 20% sleep power + 10% standby power.
The weights used on the power levels do not currently reflect the use condition of these systems. The weights were assigned to balance the inactive power consumption employed in the various architectures and system configurations. The cumulative value not only focuses the effort on reducing power in all inactive modes, but, encourages power management technology development to allow tradeoff in power
47

Workstations and Desktop-derived Servers
consumption across various system states. For example, in developing higher I/O capability, the technology is encouraged to strive for lower power consumption waiting (lower idle power) and yet sufficient energy to wake-up (increase sleep power) and be ready for operation. Previous methods of pre-allocating budgets assume one already understands both the system’s performance demand and sleeping capabilities. Attempting to predict technology growth, and task critical demands with fixed limits in each category limits technology growth and does not motivate industry investments in energy efficient performance innovations (e.g. getting more work done for the energy consumed).
Maximum power is determined or demonstrated by applying activity benchmarks which reflect the maximum capability of the system in terms of power. Even with well established benchmarks such as MIPs per watt, a key issue was whether MIPs reflected the “capability” demanded by the system/market. One could argue that availability, reliability, database size, graphical response, or modeling regressions can eventually be synthesized to MIPs and hence MIPs per watt; but, unfortunately, there is no translation of this market’s value set to centralize to a single MIPs number. In other words, one could have a very good MIPs but, fail to be efficient in the application. In many cases use of this metric would result in burning more energy to accomplish the task even if the MIPs per watt were very efficient. Such a metric is, however, applicable for known fixed computational workload such as in scientific numerical calculations. Therefore, even though MIPs per watt could be an applicable metric in some cases, the variety of valued non-MIPs activities dictate the need for a different set of activities to generate a power proxy for a workstation’s configured capabilities.
The activities or performance benchmarks that scale power levels well with the platform, CPU, memory, and graphics capability are LINPACK and SpecViewPerf (in concurrent operation). Both benchmarks are publicly available and supported across multiple platforms and architectures, key aspects for objectivity and observability. Both performance benchmarks may have been tuned to demonstrate performance, which actually helps also track use of peak power consumption as a proxy for system capability. Do note that the use of these performance benchmarks is not to determine or measure performance, nor does it judge whether these are appropriate performance indices. The benchmarks do however, meet the scaling, power proxy, and public-availability objectives. From initial testing from various companies, these routines, run in parallel, exercises each of the major platform components to about a 70-80% level (except for HDD and network). These levels are purely a figure of merit as to how well they exercise the features and components in the system and its ability to scale with increasing capability in these areas. The percentage should not be used in place of actual measurements. Indeed, the main premise in using these routines is to establish the power proxy of the capability of the system. Use of key performance benchmarks is also intended to limit arbitrary increases in power, just to meet an ENERGY STAR criteria. Market demands of lower power during peak performance will drive that end of the power consumption, thus producing the co-motivation aspect of energy efficient performance.
LINPACK is a performance benchmark which solves a mathematical matrix array. The mathematical matrix-array is configurable to reflect the memory capacity, operational threads and CPU cores in the system. By adjusting these parameters in the routine (available as prompts in the routine published by Intel), one can appropriately exercise and hence represent in terms of power, the capability scaling of these platform components.
48

Workstations and Desktop-derived Servers
SpecViewPerf is a performance benchmark which targets both the GPU and its associated memory, while also loading other parts of the system. This graphics benchmark has shown to be a reasonable exerciser to scale platform power levels with the graphics capability. One must set sufficient memory allocation to allow SpecViewPerf to run at maximum performance and power consumption in parallel with LINPACK. With insufficient memory to run the routine, excessive paging will occur, and the system will demonstrate lower power consumption than the routines separately. Experiments have found that in many cases 1MB is sufficient to maximize the SpecViewPerf run.
A subcomponent of the system not heavily exercised by the routines above is the mass storage, i.e. hard disk drives (HDD). Though there are routines and benchmarks, such benchmarks for the HDDs can not be conducted in parallel with LINPACK and SpecViewPerf. Therefore, an additive value per HDD is allocated in the power proxy for maximum capability.
5.5 Measurements
5.5.1 Max_Power
Maximum power on the platform is determined by running SpecViewPerf and LINPACK in parallel. Configuring each benchmark to ensure that they maximize the execution of various aspects of the subsystems is listed below. It is recommended that initial setups review a power profile of each routine to ensure proper testing durations and cycles are employed. The assessment will also confirm that the two benchmarks are indeed operating in parallel and registers the power level caused by exercising these aspects of the system. The maximum power value is captured by the power meter sampling at a rate of 1 sample per second or greater.
5.5.1.1 SpecViewPerf
SpecViewPerf revisions and application details can be obtained via the SPEC web sites. The specific instructions identify setting options which should reflect the configuration under test or evaluation.
5.5.1.2 LINPACK-configurations
LINPACK binaries offered by Intel:
http://www.intel.com/cd/software/products/asmo-na/eng/perflib/mkl/266857.htm
General configuration instructions for max power testing are:
1. Determine the max memory installed in the system
2. Subtract the amount needed to run SpecViewPerf. and other system operations that would allow concurrent benchmarking operation
a. This amount to subtract is highly dependent on the system architecture and configuration.
b. Underestimating what is needed for SpecViewPerf and other operations, may cause LINPACK to run excessive paging of memory, resulting in a lower maximum power
49

Workstations and Desktop-derived Servers
3. Determine maximum matrix size (reminder: adjust the memory size per step 2) via this example script in Linux11:
This AWK script will calculate it on a Linux machine: awk ' BEGIN { printf "Maximum matrix dimension that will fit in RAM on this machine: " } /^MemTotal:/ { print int(sqrt(($2*1000)/8)/1000) "K" } ' /proc/meminfo For those not running Linux the equation is:
MemTotal( )*10008
1000
4. Identify the number of cores and threads feasible, based on the processor architecture
5. Enter these values in the configuration prompts or header for the LINPACK run.
5.5.2 Typical Electricity Consumption
The platform under evaluation must be configured as shipped. The power management settings when the system is shipped should be configured as documented in the ENERGY STAR specification. Some power management settings may conflict with the power measurement testing required for calculating of TEC and can be disabled during the TEC testing; however, they need to be enabled for shipping systems.
The description of the various tests below solely highlight key considerations and changes to previous descriptions in this document. Users should reference the previous testing methods and considerations for the operational modes as shown in Section 4.3.
5.5.2.1 Idle
The power level should be evaluated at the respective operating system idle conditions. Of particular note would be to turn off prepackaged monitoring features, daemons, and other such activities not absolutely needed to have the O/S running. This should be a relatively steady state value. Any significant variations during initial test development may identify background activities that may need to be turned off in the outgoing configuration and while running this test. Such items should be end user accessible to be re-enabled, and documented prior to data submission.
11 One needs to adjust the memory available to LINPACK per step 2 above, or the maximum power demonstrated by result in a lower value than running LINPACK on its own.
50

Workstations and Desktop-derived Servers
5.5.2.2 Sleep
Turn off wake-up timers or events. Management utilities that enable detection and migration through various power management states can also be turned off.
For those systems, whose architectures do not support a specific sleep state, the mode to use as a replacement is Idle. The formulae and weights for the TEC limits and calculations were determined accounting for this type of configuration.
5.5.2.3 Standby(S5)
There are no workstation specific changes to the testing methods and considerations for the standby state as shown in Section 4.3.3.
5.5.3 Tools and Calibration
For simplified pass/fail criteria and for the data submission, the minimum meter accuracies are listed in Appendix A of the ENERGY STAR Program Requirements for Computer for testing equipment requirements. Many system manufacturers will however, want to better characterize and profile the power consumption across the various operating conditions and variety of sub-system components. Some tools will provide the ability to synchronize and register power and energy levels at time intervals across the test suites. Given the operational nature of the tests, such as determining maximum power, the difference between power and energy is likely a topic of investigation for a system developer. Providing documentation of anomalies as part of the dataset for ENERGY STAR compliance is recommended to ensure consistency to future compliance data gathering.
5.5.4 Power Management and Settings
As noted previously, sophisticated power management schemes are often employed to support peak performance, and run efficiently under both low loads and periods of inactivity. As the current testing addresses solely static conditions, i.e. maximum capability, Idle, Sleep, and Standby; some power management features could disrupt the determination of maximum capability, or waking up the system components during Idle, Sleep, or standby. Therefore, the power management features should be enabled by default as shipped, identified in the data submission to the EPA, but may be turned off or disabled during the testing required for calculating the TEC.
51
Future Specification Considerations
6 Future Specification Considerations
The ENERGY STAR specification highlights the need to revisit the criteria in preparation of a revision in 2009. Highlighted in several areas in this document are concepts for criteria improvements to denote energy efficiency. The future revision serves as the opportunity to do so, and various industry organizations are current engaged by the EPA to study and propose evolving energy efficiency criteria. Pending the acceptability of these new metrics, the time frame also allows the EPA an opportunity to re-assess the ENERGY STAR limits themselves.
The next revision of ENERGY STAR will incorporate the learning obtained via the compliance data submissions after the July 20, 2007 effective date of the current specifications. The data reviewed will not only be with respect to the limits, but, also based on affects of the new criteria and conditions introduced by revision 4.
The current industry-wide organizations consulting with the EPA on an energy efficiency metric include ECMA*, BAPCO*, LBNL*, and SPEC.org*.
52

Summary
7 Summary
Both Intel and the EPA are each focused on growing adoption of energy saving technologies and products that can continue to improve usability and energy efficiency while also reducing energy consumption on the compute platform.
With the ENERGY STAR program for computers, the EPA has set the goal of generating awareness of these energy saving capabilities, as well as differentiating the market for more energy-efficient computers and accelerating the market penetration of more energy-efficient technologies.
This document provides some key insights into the delivery of desktop, notebook and workstation systems that are in a good position to meet the requirements in the new ENERGY STAR specification for computers.
§
53

Creating a Disk ImageTPF FPT
Appendix A Creating a Disk Image12
A.1 Modifications to the Default User/policy in Rollout Image (i.e.; “Ghosting”)
If rolling out Windows XP or Windows Vista through the use of images (i.e.; Using Symantec Ghost or similar) there is a method, lacking centralized control (fire-and-forget option), a system administrator or OEM can set and ensure compliance to monitor power management policies. When a user logs into a machine for the first time, assuming no roaming profiles in use, the default settings for the user comes from the default user account in the “Documents and Settings” (C:\Documents and Settings\Default User\ntuser.dat) folder in use by the system. Under most circumstances this is the case for power management settings13. By using regedt32.exe14 and making the necessary edits all new accounts will now pick up these settings. To do this:
•
•
•
•
•
•
•
•
•
•
•
•
Open regedt32.exe
Highlight the HKEY_USERS branch.
Under the Registry menu, click load hive and navigate to C:\Documents and Settings\Default User\ntuser.dat, or where ever the default user’s profile is stored.
Load that file into the hive naming the branch PMDefault.
From here, manually change the power management settings for the currently logged in user, following the directions in A.2
If regedit is already open switch to it and press F5 to refresh the current view. (Will export old settings otherwise)
Highlight the key ‘HKEY_CURRENT_USER\Control Panel\PowerCfg’ and select “Export Registry file…” from the Registry menu in the menu bar.
Export the file making sure that the selected branch option is selected.
Name the file anything you would like and save it.
Edit the reg file using a text editor changing the key prefixes (in every key entry) to ‘HKEY_USERS\PMDefault\Control Panel\PowerCfg’.
Go ahead and merge this reg file with the system by double clicking on it.
From here, unload the PMDefault hive by highlighting ‘HKEY_USERS\PMDefault ‘ and under the Registry menu, click unload hive.
12 Microsoft product screen shot(s) reprinted with permission from Microsoft Corporation. 13 There is a case where, if the last user to login changed their power management settings (with or without a reboot), and then a new user logs in next, this new user will pick up those settings. 14 Regedit.exe in XP or higher
54

Creating a Disk ImageTPF FPT
A.2 Microsoft Windows* XP • Select Start > Control Panel from the Start Menu.
• Click the “Performance and Maintenance” icon in the Control Panel window
then choose “Power Options”.
55
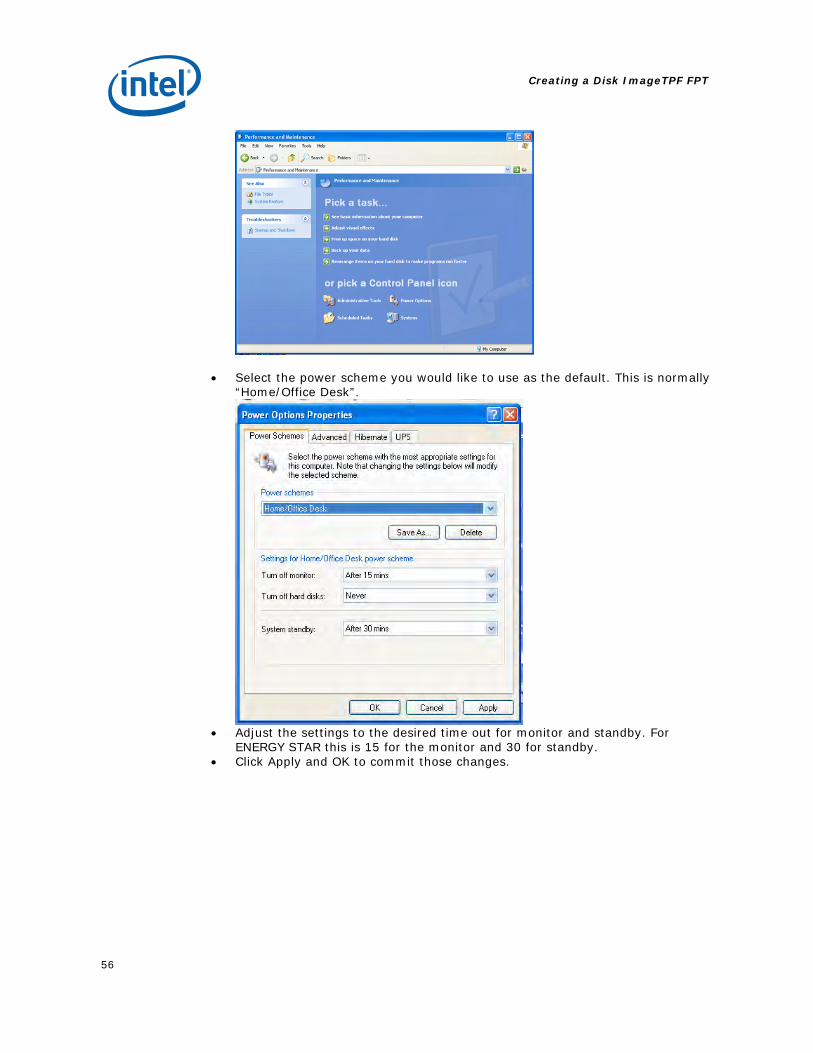
Creating a Disk ImageTPF FPT
• Select the power scheme you would like to use as the default. This is normally “Home/Office Desk”.
• Adjust the settings to the desired time out for monitor and standby. For
ENERGY STAR this is 15 for the monitor and 30 for standby. • Click Apply and OK to commit those changes.
56

Creating a Disk ImageTPF FPT
A.3 Microsoft Windows Vista* • Select Start > Control Panel from the Start Menu.
• Click the “System and Maintenance” icon in the Control Panel window then
choose “Power Options”.
57
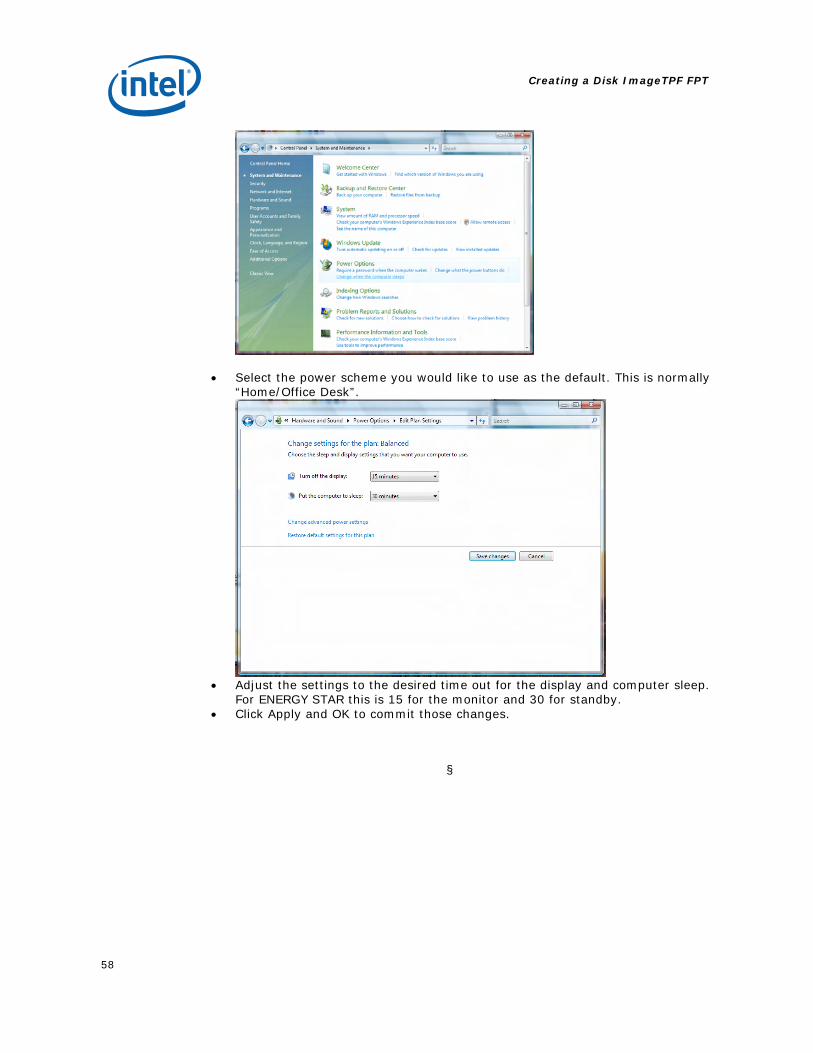
Creating a Disk ImageTPF FPT
• Select the power scheme you would like to use as the default. This is normally “Home/Office Desk”.
• Adjust the settings to the desired time out for the display and computer sleep.
For ENERGY STAR this is 15 for the monitor and 30 for standby. • Click Apply and OK to commit those changes.
§
58

About the Authors
About the Authors Thomas Bolioli – Terra Novum, LLC (technical consultant for EPA on ENERGY STAR) Thomas Bolioli has been working in the IT field since 1993 in such roles as developer (web & application), small business IT consultant as well as a systems administrator for large user populations. Since 2001 Thomas Bolioli has been consulting to the Environmental Protection Agency in support of ENERGY STAR. Projects Thomas Bolioli has participated in were the Million Monitor Drive (an effort to get users to enable monitor power management) and a follow up which focused on having users and companies enable the system standby/sleep function on their computers. Other work for ENERGY STAR performed by Thomas Bolioli has been to support ENERGY STAR on the development of various energy efficiency and labeling specifications, including those for computers, Digital Television Adapters and set top boxes. Thomas Bolioli has also worked on energy efficiency, renewable energy and other miscellaneous IT projects for the state of New York and Massachusetts as well as numerous private clients. Chris Hamlin – Intel Corporation Chris has been an Intel employee since 1997 and is a Senior Platform Applications Engineer responsible for power delivery enabling for the Business Client Group. He is responsible for processor voltage regulator and system power supply enabling. Prior to his current role, Chris was a validation and hardware design engineer in the desktop board operation and a platform applications engineer for desktop processor products. Jim Kardach – Intel Corporation Jim is a Senior Principal Engineer in the Mobility Group working on advanced platform architecture. Jim has spent over 20 years at Intel, 18 of those on notebook platform architecture specializing in low power architectures. Jim holds over 40 patents and has lead development of the Advanced Configuration and Power Interface (ACPI), and Bluetooth architectures (amongst others) and is currently working on future notebook low power architectures. David Korn – Cadmus Group, Inc. (technical consultant for EPA on ENERGY STAR) Dave is a principal with the Cadmus Group, Inc. and leads their energy efficiency practice. He has worked for the past 5 years supporting ENERGY STAR’s monitor and computer power management programs focusing on helping large enterprises take advantage of power management features in their computer systems.
59

About the Authors
J. Mike Walker - Beacon Consultants (technical consultant for EPA on ENERGY STAR) Mike Walker has held a number of senior management positions with responsibility for sales and marketing, operations, and media/public relations. He is President of Beacon Consultants Network Inc., a consultancy dedicated to helping organizations build better customer experiences and partnerships. Beacon works with clients to improve the way their products and services are developed, marketed, and delivered. In particular, Beacon has established a reputation for helping government agencies and socially responsible corporations build successful public-private partnerships. His work with various programs at the US Environmental Protection Agency, the US Department of Health and Human Services, and with companies such as GE, ADP, AOL and Microsoft has broken new ground in environmental protection and the advancement public health. Prior to founding Beacon Consultants, Mike was Chief Operating Officer of Complete Communications, Inc. (now New England Network Group), an IT services firm. He has served as VP of Client Services at Belenos, Inc., and previously supervised large management consulting engagements at Deloitte Consulting. Mike graduated from the University of Virginia and holds a Masters in Public Administration from Harvard University’s Kennedy School of Government. Henry Wong – Intel Corporation Senior Staff Platform Technologist, enabling Intel’s platform power and thermal technologies. Mr. Wong is a 20yr Intel veteran, with 16yrs industry experience in digital and mix signal processor development, including the first Intel mobile chipset, 360SL, and first mobile Pentium (P54LM/P55C). Henry led the development and enablement of high efficiency and high reliability power conversion techniques, component thermal solutions, and system clocking networks for the Itanium®, Itanium® 2, and Xeon™ processor platforms. Mr. Wong authored and enabled key technologies such as Adaptive Voltage Positioning, Modular Direct Power Connect, Server Component High Impingement Mode Cooling, and Programmable Geared Differential Clocking for Multi-Time Domain Architectures. He is currently leading Intel’s support of the enterprise industry power and computing efficiency initiatives, with organizations such as the EPA. Mr. Wong is an ’84 graduate from Yale University in both Semiconductor Physics and Econometric Modeling.
60