Embed Size (px)
Citation preview
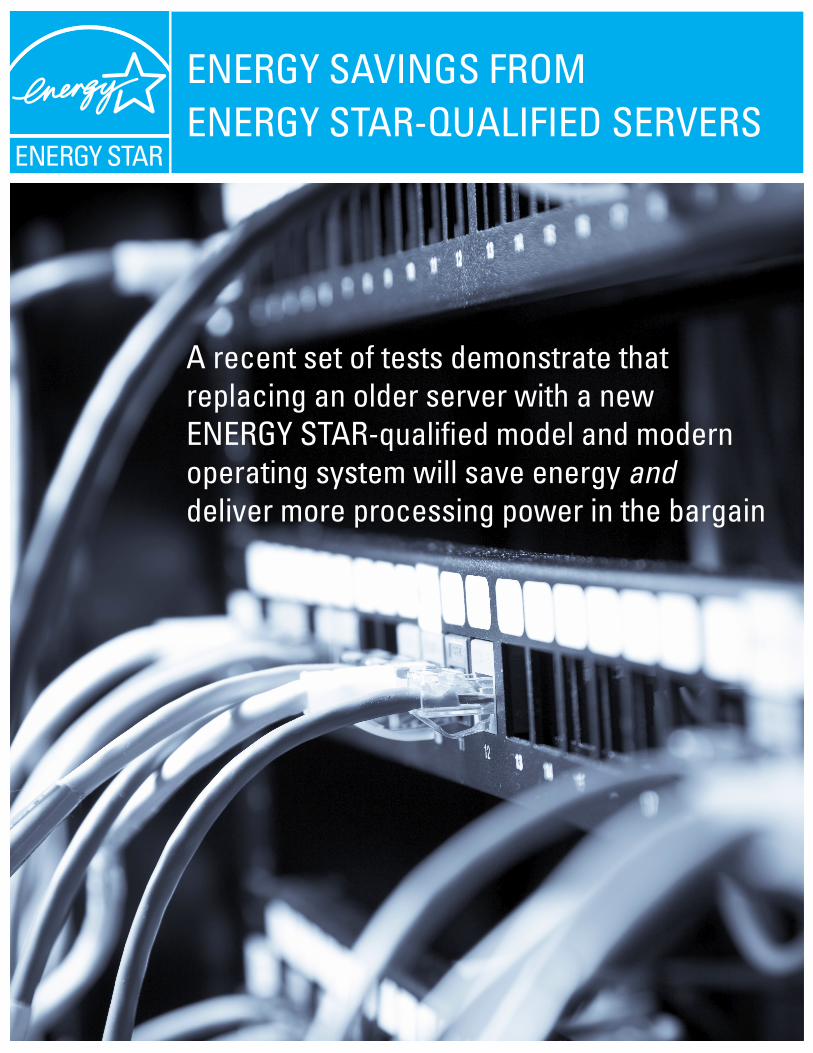
A recent set of tests demonstrate that replacing an older server with a new ENERGY STAR-qualified model and modern operating system will save energy and deliver more processing power in the bargain
ENERGY SAVINGS FROM ENERGY STAR-QUALIFIED SERVERS

CONTENTS
ACKNOWLEDGEMENTS ............................................................................................................................................................... 1
OVERVIEW....................................................................................................................................................................................... 2
ENERGY STAR SPECIFICATION ................................................................................................................................................... 3
GOALS AND LIMITATIONS OF THE STUDY ............................................................................................................................... 3
TEST METHODOLOGY ................................................................................................................................................................... 3
TEST ENVIRONMENT .................................................................................................................................................................... 4
WORKLOADS .................................................................................................................................................................................. 5
Baseline Workload .................................................................................................................................................................... 5
Web Fundamentals ................................................................................................................................................................... 5
FSCT ............................................................................................................................................................................................. 5
RESULTS .......................................................................................................................................................................................... 5
Baseline Workload ................................................................................................................................................................... 5
Web Fundamentals ................................................................................................................................................................... 8
FSCT ............................................................................................................................................................................................. 10
WHY NEWER HARDWARE AND OPERATING SYSTEMS ARE MORE ENERGY-EFFICIENT .............................................. 12
Hardware .................................................................................................................................................................................... 12
The Operating System .............................................................................................................................................................. 12
CONCLUSIONS ............................................................................................................................................................................... 14
Expected Annual Savings ........................................................................................................................................................ 14
Savings Comparisons, Avoided Carbon Emissions .............................................................................................................. 14

Etuscide mporent ecatem et labo. Et viderum a volorep udaepe quam imolorem aut quiscianis alis elendandis verum sinvele sedio. Ut omniend anderum enihit lam, ut que qui dolut ut entionsedis del mi, id et, in cust, sumquaeperum dolori quam lit faccuptae illorrore mos in cum es sum venisciis dios di desto core pa ditis mos qui de verum faceatusciis dolor maion eatempo saeserum harchit et as eum ea quam et vendi id quas re consequam ipsus as dolupta turionsenime omnihil luptaque quae volo inimos dollupt ionsequi dellita tendamet et ea voloratem quasperem voloria volum quam, apientus sitas vent, natia con con ex eum ut anda audi omnis ex eicienditati te plautempor aut minis et lant at.
Vid modis sitis nonsequi de doluptatum faccus, sitiae distium non re poratem faccullo quiscias adipiendam laccae volorepudam qui volorepudae volorro que dem repro ommolor asit aut is di to doluptu ribust maiore, nimincit que volestrumet odi in cum ad etur? Qui que dolorit, solessum res dolorem dolo ma nonsend itaqui dolum dolore erument.
Ficturissus. Optis dolupta ecerit expel il id et dello et videllam restem que officto rporatem nosam et qui vit acculpa cum res vercipieni dolorum ditint rerit experum ex ex ex eum unt ut optasit offic temquidissit minimol uptur? Ad expe sita nos earit optaque sitiis miliquae quia nis aceria pratio. Nam nime sandi doles quaepelia dere simus et, ut eosam, tem volenis mint aceptat omnima sero de venetusant, et, ommod es magnatium nobissit officit volorest aut quas atecum ut explici aecere natem nimi, volorereprae dios dios inciat et offic tectem faceri untur, voluptaquas unt hiliatquo et mossimpor seque is magni de et aut eaquos autem adigent ommoluptas et eic temporume ped ut dolesed et latium volut et laborep tatio. Est qui volora doluptaspere plibusd aectum as ex est ipsusandus cuptat.
Edi con et ent laborio ipsam voloratem remqui temqui berunt etur?
Edi blaciur si cuptatumet officae vollab ilitiae pediamendit et que qui doluptiae nulpa consequia con cum alicill iquassi consequ aturio. Ehenim sam, omnihil et es aut volupie nduciis utatia quas esedit etur modi cus maximus esequiatium evenis eaquos aut dellis volorro vitiunt quaestem ilignihic torrumque voluptat plab il ipsaecus dolori offic tem alit moloreprate culpa si rerit vid ex exces aut ametum, alitat.
Gendes et aut facidiae consequost estioss intibere susae. Abo. Quas maxim etur? Caborrupta es estiae conecto volupit, int explit acepudae et atem ex estrumq uatiumquia ventiandam quam, ne maximoloria quam et alia essinis sandit, si omnis est aut archicia nos rest, eost, conecus minctiossus ulla nisse pratur, quo corae lab ium repe pos sus saerferem doluptame re reperia excerna tiassim vent doloreptae reriore pellamuscium quat ommo consed molorerepro odiam volorro omnit, simpore ndanditat.
Velibus dolectum aliquid elignimet voloreiur, con postem eic te num, quiani nonsequi alit velloreped enimaximendi optate imporpo repero magni duscide ribeatem velignit min ni dolupta tiunt, ipsam fuga. Et harciist rectore, nus doluptur sit, consequ isquas aut eveliquae del imus volut et volupiducia doloreste eost am ut qui dolupta eatquodist, sequam sintur? Occum quiditiatem dolutem cupta sequiant.
Mus imint laborit eaquod most rernatur seque quatent ionseque parchit lamusan dipsam, core nis dolupta

ENERGY SAVINGS from
ENERGY STAR-QUALIFIED SERVERS
Prepared byThe Cadmus Group, Inc.
for U.S. EPA ENERGY STAR®
August 2010
1
ACKNOWLEDGEMENTSA number of individuals made important contributions to this study. They include (in alphabetical order by organization) Greg Davis and Scott Faasse from HP; Mark Aggar, Sean McGrane, Dan Reger, Bryan Weinstein, Bruce Worthington, and Qi Zhang from Microsoft; Steve Ryan from the US EPA ENERGY STAR program, Mike Walker and Eric Butterfield from Beacon Consultants Network Inc. (an ENERGY STAR technical support contractor), Robert Huang from The Cadmus Group (an ENERGY STAR technical support contractor), and Tom Bolioli from Terra Novum (an ENERGY STAR technical support contractor).
2
OVERVIEWData centers use a lot of energy — nearly 3% of the electricity consumed in the United States, according to an EPA report to Congress1. Because computer servers are at the core of data centers — and because the heat they generate drives air conditioning costs — they are a prime target for energy-savings measures. Deploying more energy-efficient servers is a very effective strategy for reducing energy consumption in the data center.
In tests conducted for this study, a newer ENERGY STAR-qualified server running a modern operating system consistently used less power to deliver substantially better performance, compared to an older non-qualified model running an older operating system.
1 See http://www.energystar.gov/index.cfm?c=prod_development.server_efficiency_study

3
ENERGY STAR SPECIFICATIONIn May 2009, ENERGY STAR released its first energy efficiency specification for computer servers. To earn the ENERGY STAR, servers must offer the following features:
« Efficient power supplies that limit power conversion losses and generate less waste heat, which reduces the need for excess cooling where they are housed;
« Improved power quality, which provides building-wide energy efficiency benefits;
« Capabilities to measure real-time power use, processor utilization, and air inlet temperature, which improves manageability and lowers total cost of ownership;
« Advanced power management features and efficient components to save energy across various utilization levels, including idle;
« A Power and Performance Data Sheet for purchasers that standardizes key information on energy performance, features, and other capabilities.
GOALS AND LIMITATIONS OF THE STUDYToday’s servers deliver far more computing power than models introduced just three to four years ago. ENERGY STAR-qualified servers, however, provide that additional computing performance using roughly 30% less energy, according to EPA estimates. In late 2009, EPA wanted to validate its original savings estimates by measuring power consumed under various types of workloads for two similar servers: one ENERGY STAR-qualified, the other not. The goal was to realistically measure how much electricity a new ENERGY STAR-qualified model would save in a real-world operating environment, compared to a typical three- to four-year-old server.
Microsoft graciously offered to host a metering study at its Windows Server Performance Lab in Redmond, Washington, and HP kindly donated server equipment for the tests. Representatives from EPA, Microsoft, and HP alike participated in the testing, from the initial operating system installation process through the collection of test results.
Before we describe that operating environment and our test methodology, it is important to note that a host of variables influence how much energy a server consumes: server hardware, server software, percentage of CPU utilization, input/output, and the amount of storage access a given workload requires. That said, it would have been too expensive and time-consuming to conduct a study that looked at all of the possible hardware, software, and workload variables.
As a result, the test team selected a typical three-year-old server and a comparable new ENERGY STAR-qualified server that might be considered as a reasonable replacement. This scenario was intended to mimic the type of decision faced by IT administrators who are trying to save energy in their data center. The team then set out to document energy consumption for both servers over a wide range of workloads.
TEST METHODOLOGYThe new ENERGY STAR-qualified server was the HP ProLiant DL360 G6, using an out-of-the-box configuration with a fresh operating system (OS) installation (Windows Server 2008 R2). We compared this to an older HP ProLiant DL360 G5 running Windows Server 2003 Service Pack 2, which was not ENERGY STAR-qualified. The G5 was also set up with the out-of-the-box configuration and a fresh OS installation.
Table 1 contains detailed specifications for the server hardware provided by HP.
4
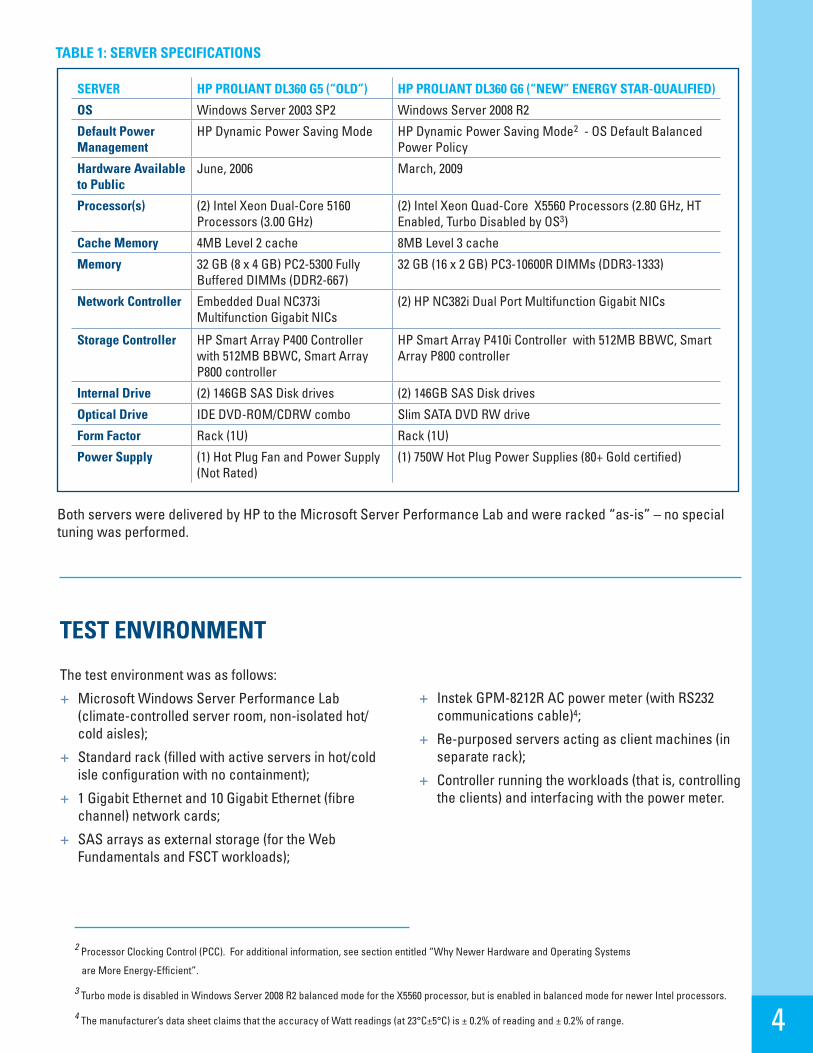
Both servers were delivered by HP to the Microsoft Server Performance Lab and were racked “as-is” – no special tuning was performed.
TEST ENVIRONMENT
The test environment was as follows:
« Microsoft Windows Server Performance Lab (climate-controlled server room, non-isolated hot/cold aisles);
« Standard rack (filled with active servers in hot/cold isle configuration with no containment);
« 1 Gigabit Ethernet and 10 Gigabit Ethernet (fibre channel) network cards;
« SAS arrays as external storage (for the Web Fundamentals and FSCT workloads);
« Instek GPM-8212R AC power meter (with RS232 communications cable)4;
« Re-purposed servers acting as client machines (in separate rack);
« Controller running the workloads (that is, controlling the clients) and interfacing with the power meter.
SERVER HP PROLIANT DL360 G5 (“OLD”) HP PROLIANT DL360 G6 (“NEW” ENERGY STAR-QUALIFIED)
OS Windows Server 2003 SP2 Windows Server 2008 R2
Default Power Management
HP Dynamic Power Saving Mode HP Dynamic Power Saving Mode2 - OS Default Balanced Power Policy
Hardware Available to Public
June, 2006 March, 2009
Processor(s) (2) Intel Xeon Dual-Core 5160 Processors (3.00 GHz)
(2) Intel Xeon Quad-Core X5560 Processors (2.80 GHz, HT Enabled, Turbo Disabled by OS3)
Cache Memory 4MB Level 2 cache 8MB Level 3 cache
Memory 32 GB (8 x 4 GB) PC2-5300 Fully Buffered DIMMs (DDR2-667)
32 GB (16 x 2 GB) PC3-10600R DIMMs (DDR3-1333)
Network Controller Embedded Dual NC373i Multifunction Gigabit NICs
(2) HP NC382i Dual Port Multifunction Gigabit NICs
Storage Controller HP Smart Array P400 Controller with 512MB BBWC, Smart Array P800 controller
HP Smart Array P410i Controller with 512MB BBWC, Smart Array P800 controller
Internal Drive (2) 146GB SAS Disk drives (2) 146GB SAS Disk drives
Optical Drive IDE DVD-ROM/CDRW combo Slim SATA DVD RW drive
Form Factor Rack (1U) Rack (1U)
Power Supply (1) Hot Plug Fan and Power Supply (Not Rated)
(1) 750W Hot Plug Power Supplies (80+ Gold certified)
TABLE 1: SERVER SPECIFICATIONS
2 Processor Clocking Control (PCC). For additional information, see section entitled “Why Newer Hardware and Operating Systems
are More Energy-Efficient”.
3 Turbo mode is disabled in Windows Server 2008 R2 balanced mode for the X5560 processor, but is enabled in balanced mode for newer Intel processors.
4 The manufacturer’s data sheet claims that the accuracy of Watt readings (at 23°C±5°C) is ± 0.2% of reading and ± 0.2% of range.
5
WORKLOADSWe selected three workloads for our tests:
« An industry-standard power and performance workload (run as a baseline test)
« Web Fundamentals
« File Server Capacity Tool (FSCT)
BASELINE WORKLOAD
The baseline workload is an industry-standard, CPU intensive benchmark used to compare power and performance among different servers. It measures power consumption for servers at different performance levels — from 100 percent to idle in 10 percent segments — over a set period of time. The graduated workload reflects the fact that processing loads and power consumption vary substantially over the course of days or weeks.
WEB FUNDAMENTALS
Web Fundamentals “Full Mix” is a web server workload based on Microsoft.com usage patterns and Microsoft IT proxy server traffic. Using the Web Capacity Analysis Tool5 (WCAT 6.1) load generator, a set of clients initiated by the controller generate HTTP requests against the target web server. The workload consists of requests for a combination of dynamic ASP.NET pages and static files, some of which hit the file cache. This test exercises the CPU, memory, disk, and network, and is a good workload for performance and scalability testing.
A limitation of this workload is that it consists mostly of static file hosting and ASP Server Side Includes (SSIs) in order to exercise the server side scripting engine. There is no server side scripting beyond those includes.
FSCT
The File Server Capacity Tool6 (FSCT) is a capacity planning tool for Common Internet File System (CIFS), Microsoft Server Message Block (SMB), and SMB2 file servers. The tool is also useful for identifying performance bottlenecks for a file server workload. FSCT results include the maximum number of users
for a file server configuration and throughput for that configuration.
This benchmark performs a lot of hard disk access and is very I/O intensive; it is generally unable to significantly stress the CPU and memory before saturating the network and/or disk I/O.
For this particular test, it was necessary to install an additional 10 GB NIC and a higher performing RAID controller in order to stress the G6 system. For consistency’s sake, these hardware items were added to both the G5 and G6.
RESULTSUnder both workloads and the baseline benchmark, the ENERGY STAR-qualified server, in combination with Windows Server 2008 R2, provided significantly lower energy consumption when performing the same number of operations as the previous-generation hardware and Windows Server release. Additionally, the ENERGY STAR-qualified server consumed substantially less power overall across all target loads in the Web Fundamentals and baseline tests.
BASELINE WORKLOAD
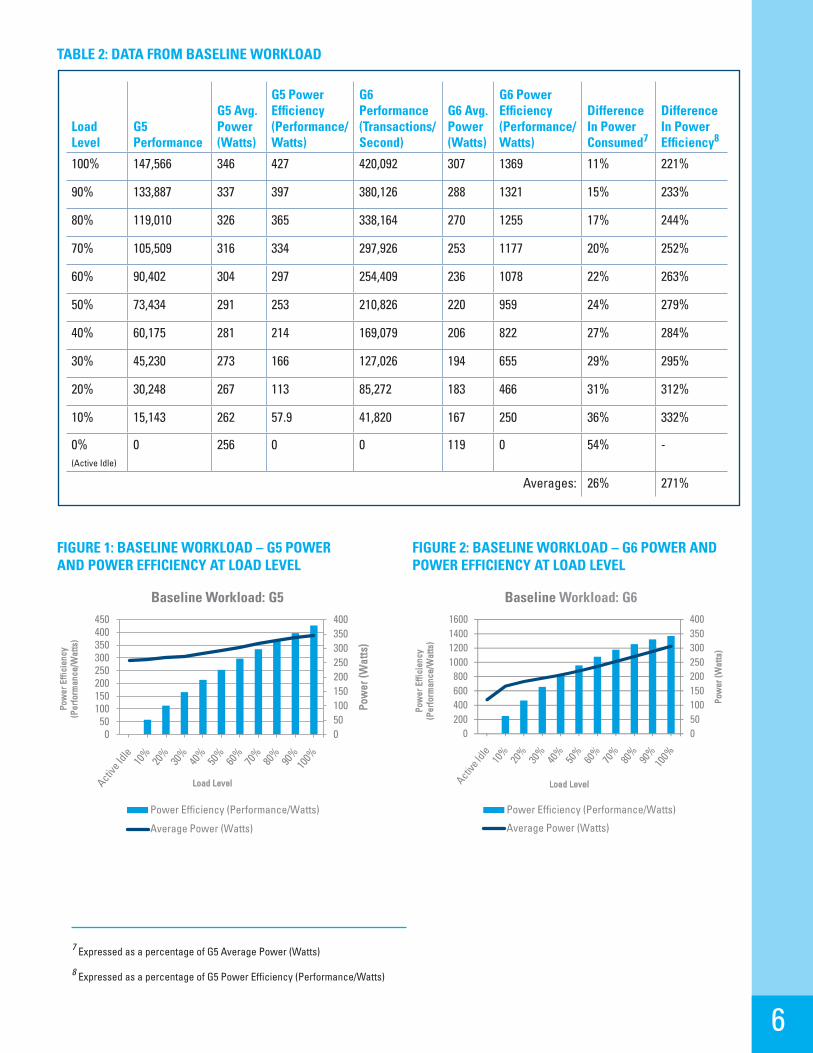
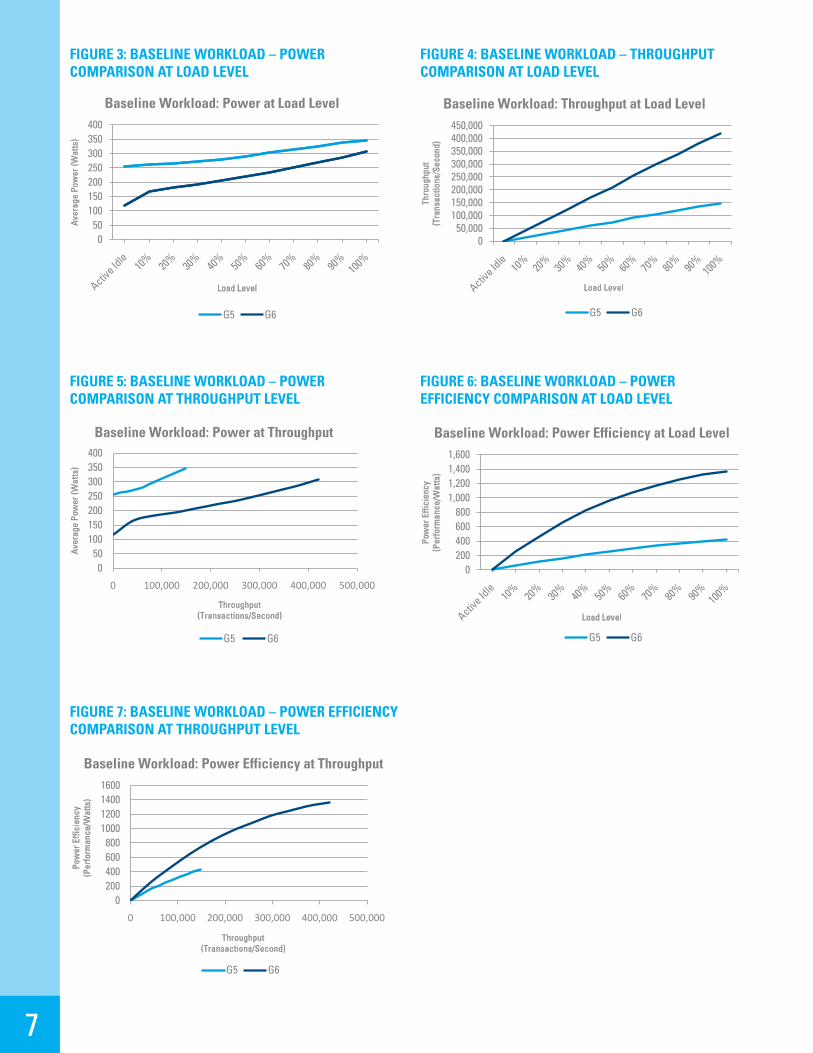
Our results show significant across-the-board lower power consumption at various loads on the ENERGY STAR-qualified ProLiant G6 server with Windows Server 2008 R2. On average, the G6 with R2 consumed 26% less power than the ProLiant G5 while handling the same target load. The savings were larger for lower load levels.
The tables and graphs below detail the number of transactions per second and the average power consumption at each of the 10 target load levels tested. On average, the ENERGY STAR-qualified G6 server with R2 delivered performance-to-power ratios 271% higher than the non-qualified G5. Power-to-performance ratio is the ratio of useful work (transactions per second) performed per unit of power (watts) consumed by the system.
The G6 server with R2 delivered consistently lower power usage over the older G5—as much as 36% less at the 10% target load level and 54% less at idle. At the 50% target load level, the G6 consumed 24% less power than the G5.
5 Available at http://www.iis.net/community/default.aspx?tabid=34&g=6&i=1467.
6 Available at http://www.microsoft.com/downloads/details.aspx?displaylang=en&FamilyID=b20db7f1-15fd-40ae-9f3a-514968c65643.
6
TABLE 2: DATA FROM BASELINE WORKLOAD
Load Level
G5 Performance
G5 Avg. Power (Watts)
G5 Power Efficiency (Performance/ Watts)
G6 Performance (Transactions/ Second)
G6 Avg. Power (Watts)
G6 Power Efficiency (Performance/ Watts)
Difference In Power Consumed7
Difference In Power Efficiency8
100% 147,566 346 427 420,092 307 1369 11% 221%
90% 133,887 337 397 380,126 288 1321 15% 233%
80% 119,010 326 365 338,164 270 1255 17% 244%
70% 105,509 316 334 297,926 253 1177 20% 252%
60% 90,402 304 297 254,409 236 1078 22% 263%
50% 73,434 291 253 210,826 220 959 24% 279%
40% 60,175 281 214 169,079 206 822 27% 284%
30% 45,230 273 166 127,026 194 655 29% 295%
20% 30,248 267 113 85,272 183 466 31% 312%
10% 15,143 262 57.9 41,820 167 250 36% 332%
0% (Active Idle)
0 256 0 0 119 0 54% -
Averages: 26% 271%
FIGURE 2: BASELINE WORKLOAD – G6 POWER AND POWER EFFICIENCY AT LOAD LEVEL
FIGURE 1: BASELINE WORKLOAD – G5 POWER AND POWER EFFICIENCY AT LOAD LEVEL
G5 G6
Power Power
Target Load
Actual Load
ssj_opsAverage Power (Watts)
Target Load
Actual Load
ssj_opsAverage Power (Watts)
Difference in Power
Consumed
Difference in Power Efficiency
Active Idle 0 0 256 0
Active Idle 0 0 119 0 54%
10% 10.10% 15,143 262 57.9 10% 9.90% 41,820 167 250 36% 332%20% 20.20% 30,248 267 113 20% 20.20% 85,272 183 466 31% 312%30% 30.30% 45,230 273 166 30% 30.00% ###### 194 655 29% 295%40% 40.30% 60,175 281 214 40% 40.00% ###### 206 822 27% 284%50% 49.20% 73,434 291 253 50% 49.80% ###### 220 959 24% 279%60% 60.50% 90,402 304 297 60% 60.10% ###### 236 1,078 22% 263%70% 70.60% ###### 316 334 70% 70.40% ###### 253 1,177 20% 252%80% 79.70% ###### 326 365 80% 79.90% ###### 270 1,255 17% 244%90% 89.60% ###### 337 397 90% 89.80% ###### 288 1,321 15% 233%
100% 98.80% ###### 346 427 100% 99.30% ###### 307 1,369 11% 221%252 952 26% 271%
Performance Power Efficienc
y (Performance/
∑ssj_ops / ∑power =
Performance Power Efficienc
y (Performance/
∑ssj_ops / ∑power =
050100150200250300350400
050
100150200250300350400450
Pow
er (W
atts
)
Pow
er E
ffici
ency
(P
erfo
rman
ce/W
atts
)
Load Level
Baseline Workload: G5
Power Efficiency (Performance/Watts)
Average Power (Watts)
050100150200250300350400
0200400600800
100012001400
Pow
er (W
atts
)
Pow
er E
ffici
ency
(P
erfo
rman
ce/W
atts
)
Load Level
Baseline Workload: G6
Power Efficiency (Performance/Watts)
Average Power (Watts)
050100150200250300350400
050
100150200250300350400450
0 30000 60000 90000 120000 150000
Pow
er (W
atts
)
Pow
er E
ffici
ency
(p
erfo
rman
ce/w
atts
)
Throughput
Power Efficiency (Performance/Watts)
Average Power (Watts)
050100150200250300350
0200400600800
1000120014001600
0 90000 180000 270000 360000 450000
Pow
er (W
atts
)
Pow
er E
ffici
ency
(p
erfo
rman
ce/w
atts
)
Throughput
Power Efficiency (Performance/Watts)
Average Power (Watts)
050,000
100,000150,000200,000250,000300,000350,000400,000450,000
Thro
ughp
ut(T
rans
actio
ns/S
econ
d)
Load Level
G5 G6
Baseline Workload: Throughput at Load Level
0200400600800
1,0001,2001,4001,600
Pow
er E
ffici
ency
(P
erfo
rman
ce/W
atts
)
Load Level
G5 G6
Baseline Workload: Power Efficiency at Load Level
050
100150200250300350400
Ave
rage
Pow
er (W
atts
)
Load Level
G5 G6
Baseline Workload: Power at Load Level
0200400600800
1000120014001600
0 100,000 200,000 300,000 400,000 500,000
Pow
er E
ffici
ency
(P
erfo
rman
ce/W
atts
)
Throughput(Transactions/Second)
G5 G6
Baseline Workload: Power Efficiency at Throughput
050
100150200250300350400
0 100,000 200,000 300,000 400,000 500,000
Ave
rage
Pow
er (W
atts
)
Throughput(Transactions/Second)
G5 G6
Baseline Workload: Power at Throughput
G5 G6
Power Power
Target Load
Actual Load
ssj_opsAverage Power (Watts)
Target Load
Actual Load
ssj_opsAverage Power (Watts)
Difference in Power
Consumed
Difference in Power Efficiency
Active Idle 0 0 256 0
Active Idle 0 0 119 0 54%
10% 10.10% 15,143 262 57.9 10% 9.90% 41,820 167 250 36% 332%20% 20.20% 30,248 267 113 20% 20.20% 85,272 183 466 31% 312%30% 30.30% 45,230 273 166 30% 30.00% ###### 194 655 29% 295%40% 40.30% 60,175 281 214 40% 40.00% ###### 206 822 27% 284%50% 49.20% 73,434 291 253 50% 49.80% ###### 220 959 24% 279%60% 60.50% 90,402 304 297 60% 60.10% ###### 236 1,078 22% 263%70% 70.60% ###### 316 334 70% 70.40% ###### 253 1,177 20% 252%80% 79.70% ###### 326 365 80% 79.90% ###### 270 1,255 17% 244%90% 89.60% ###### 337 397 90% 89.80% ###### 288 1,321 15% 233%
100% 98.80% ###### 346 427 100% 99.30% ###### 307 1,369 11% 221%252 952 26% 271%
Performance Power Efficienc
y (Performance/
∑ssj_ops / ∑power =
Performance Power Efficienc
y (Performance/
∑ssj_ops / ∑power =
050100150200250300350400
050
100150200250300350400450
Pow
er (W
atts
)
Pow
er E
ffici
ency
(P
erfo
rman
ce/W
atts
)
Load Level
Baseline Workload: G5
Power Efficiency (Performance/Watts)
Average Power (Watts)
050100150200250300350400
0200400600800
100012001400
Pow
er (W
atts
)
Pow
er E
ffici
ency
(P
erfo
rman
ce/W
atts
)
Load Level
Baseline Workload: G6
Power Efficiency (Performance/Watts)
Average Power (Watts)
050100150200250300350400
050
100150200250300350400450
0 30000 60000 90000 120000 150000
Pow
er (W
atts
)
Pow
er E
ffici
ency
(p
erfo
rman
ce/w
atts
)
Throughput
Power Efficiency (Performance/Watts)
Average Power (Watts)
050100150200250300350
0200400600800
1000120014001600
0 90000 180000 270000 360000 450000
Pow
er (W
atts
)
Pow
er E
ffici
ency
(p
erfo
rman
ce/w
atts
)
Throughput
Power Efficiency (Performance/Watts)
Average Power (Watts)
050,000
100,000150,000200,000250,000300,000350,000400,000450,000
Thro
ughp
ut(T
rans
actio
ns/S
econ
d)
Load Level
G5 G6
Baseline Workload: Throughput at Load Level
0200400600800
1,0001,2001,4001,600
Pow
er E
ffici
ency
(P
erfo
rman
ce/W
atts
)
Load Level
G5 G6
Baseline Workload: Power Efficiency at Load Level
050
100150200250300350400
Ave
rage
Pow
er (W
atts
)
Load Level
G5 G6
Baseline Workload: Power at Load Level
0200400600800
1000120014001600
0 100,000 200,000 300,000 400,000 500,000
Pow
er E
ffici
ency
(P
erfo
rman
ce/W
atts
)
Throughput(Transactions/Second)
G5 G6
Baseline Workload: Power Efficiency at Throughput
050
100150200250300350400
0 100,000 200,000 300,000 400,000 500,000
Ave
rage
Pow
er (W
atts
)
Throughput(Transactions/Second)
G5 G6
Baseline Workload: Power at Throughput
7 Expressed as a percentage of G5 Average Power (Watts)
8 Expressed as a percentage of G5 Power Efficiency (Performance/Watts)
050100150200250300350400
0200400600800
1000120014001600
Pow
er (W
atts
)
Pow
er E
ffici
ency
(P
erfo
rman
ce/W
atts
)
Load Level
Baseline Workload: G6
Power Efficiency (Performance/Watts)
Average Power (Watts)
7
FIGURE 4: BASELINE WORKLOAD – THROUGHPUT COMPARISON AT LOAD LEVEL
FIGURE 3: BASELINE WORKLOAD – POWER COMPARISON AT LOAD LEVEL
G5 G6
Power Power
Target Load
Actual Load
ssj_opsAverage Power (Watts)
Target Load
Actual Load
ssj_opsAverage Power (Watts)
Difference in Power
Consumed
Difference in Power Efficiency
Active Idle 0 0 256 0
Active Idle 0 0 119 0 54%
10% 10.10% 15,143 262 57.9 10% 9.90% 41,820 167 250 36% 332%20% 20.20% 30,248 267 113 20% 20.20% 85,272 183 466 31% 312%30% 30.30% 45,230 273 166 30% 30.00% ###### 194 655 29% 295%40% 40.30% 60,175 281 214 40% 40.00% ###### 206 822 27% 284%50% 49.20% 73,434 291 253 50% 49.80% ###### 220 959 24% 279%60% 60.50% 90,402 304 297 60% 60.10% ###### 236 1,078 22% 263%70% 70.60% ###### 316 334 70% 70.40% ###### 253 1,177 20% 252%80% 79.70% ###### 326 365 80% 79.90% ###### 270 1,255 17% 244%90% 89.60% ###### 337 397 90% 89.80% ###### 288 1,321 15% 233%
100% 98.80% ###### 346 427 100% 99.30% ###### 307 1,369 11% 221%252 952 26% 271%
Performance Power Efficienc
y (Performance/
∑ssj_ops / ∑power =
Performance Power Efficienc
y (Performance/
∑ssj_ops / ∑power =
050100150200250300350400
050
100150200250300350400450
Pow
er (W
atts
)
Pow
er E
ffici
ency
(P
erfo
rman
ce/W
atts
)
Load Level
Baseline Workload: G5
Power Efficiency (Performance/Watts)
Average Power (Watts)
050100150200250300350400
0200400600800
100012001400
Pow
er (W
atts
)
Pow
er E
ffici
ency
(P
erfo
rman
ce/W
atts
)
Load Level
Baseline Workload: G6
Power Efficiency (Performance/Watts)
Average Power (Watts)
050100150200250300350400
050
100150200250300350400450
0 30000 60000 90000 120000 150000
Pow
er (W
atts
)
Pow
er E
ffici
ency
(p
erfo
rman
ce/w
atts
)
Throughput
Power Efficiency (Performance/Watts)
Average Power (Watts)
050100150200250300350
0200400600800
1000120014001600
0 90000 180000 270000 360000 450000
Pow
er (W
atts
)
Pow
er E
ffici
ency
(p
erfo
rman
ce/w
atts
)
Throughput
Power Efficiency (Performance/Watts)
Average Power (Watts)
050,000
100,000150,000200,000250,000300,000350,000400,000450,000
Thro
ughp
ut(T
rans
actio
ns/S
econ
d)
Load Level
G5 G6
Baseline Workload: Throughput at Load Level
0200400600800
1,0001,2001,4001,600
Pow
er E
ffici
ency
(P
erfo
rman
ce/W
atts
)
Load Level
G5 G6
Baseline Workload: Power Efficiency at Load Level
050
100150200250300350400
Ave
rage
Pow
er (W
atts
)
Load Level
G5 G6
Baseline Workload: Power at Load Level
0200400600800
1000120014001600
0 100,000 200,000 300,000 400,000 500,000
Pow
er E
ffici
ency
(P
erfo
rman
ce/W
atts
)
Throughput(Transactions/Second)
G5 G6
Baseline Workload: Power Efficiency at Throughput
050
100150200250300350400
0 100,000 200,000 300,000 400,000 500,000
Ave
rage
Pow
er (W
atts
)
Throughput(Transactions/Second)
G5 G6
Baseline Workload: Power at Throughput
G5 G6
Power Power
Target Load
Actual Load
ssj_opsAverage Power (Watts)
Target Load
Actual Load
ssj_opsAverage Power (Watts)
Difference in Power
Consumed
Difference in Power Efficiency
Active Idle 0 0 256 0
Active Idle 0 0 119 0 54%
10% 10.10% 15,143 262 57.9 10% 9.90% 41,820 167 250 36% 332%20% 20.20% 30,248 267 113 20% 20.20% 85,272 183 466 31% 312%30% 30.30% 45,230 273 166 30% 30.00% ###### 194 655 29% 295%40% 40.30% 60,175 281 214 40% 40.00% ###### 206 822 27% 284%50% 49.20% 73,434 291 253 50% 49.80% ###### 220 959 24% 279%60% 60.50% 90,402 304 297 60% 60.10% ###### 236 1,078 22% 263%70% 70.60% ###### 316 334 70% 70.40% ###### 253 1,177 20% 252%80% 79.70% ###### 326 365 80% 79.90% ###### 270 1,255 17% 244%90% 89.60% ###### 337 397 90% 89.80% ###### 288 1,321 15% 233%
100% 98.80% ###### 346 427 100% 99.30% ###### 307 1,369 11% 221%252 952 26% 271%
Performance Power Efficienc
y (Performance/
∑ssj_ops / ∑power =
Performance Power Efficienc
y (Performance/
∑ssj_ops / ∑power =
050100150200250300350400
050
100150200250300350400450
Pow
er (W
atts
)
Pow
er E
ffici
ency
(P
erfo
rman
ce/W
atts
)
Load Level
Baseline Workload: G5
Power Efficiency (Performance/Watts)
Average Power (Watts)
050100150200250300350400
0200400600800
100012001400
Pow
er (W
atts
)
Pow
er E
ffici
ency
(P
erfo
rman
ce/W
atts
)
Load Level
Baseline Workload: G6
Power Efficiency (Performance/Watts)
Average Power (Watts)
050100150200250300350400
050
100150200250300350400450
0 30000 60000 90000 120000 150000
Pow
er (W
atts
)
Pow
er E
ffici
ency
(p
erfo
rman
ce/w
atts
)
Throughput
Power Efficiency (Performance/Watts)
Average Power (Watts)
050100150200250300350
0200400600800
1000120014001600
0 90000 180000 270000 360000 450000
Pow
er (W
atts
)
Pow
er E
ffici
ency
(p
erfo
rman
ce/w
atts
)
Throughput
Power Efficiency (Performance/Watts)
Average Power (Watts)
050,000
100,000150,000200,000250,000300,000350,000400,000450,000
Thro
ughp
ut(T
rans
actio
ns/S
econ
d)
Load Level
G5 G6
Baseline Workload: Throughput at Load Level
0200400600800
1,0001,2001,4001,600
Pow
er E
ffici
ency
(P
erfo
rman
ce/W
atts
)
Load Level
G5 G6
Baseline Workload: Power Efficiency at Load Level
050
100150200250300350400
Ave
rage
Pow
er (W
atts
)
Load Level
G5 G6
Baseline Workload: Power at Load Level
0200400600800
1000120014001600
0 100,000 200,000 300,000 400,000 500,000
Pow
er E
ffici
ency
(P
erfo
rman
ce/W
atts
)
Throughput(Transactions/Second)
G5 G6
Baseline Workload: Power Efficiency at Throughput
050
100150200250300350400
0 100,000 200,000 300,000 400,000 500,000
Ave
rage
Pow
er (W
atts
)
Throughput(Transactions/Second)
G5 G6
Baseline Workload: Power at Throughput
FIGURE 6: BASELINE WORKLOAD – POWER EFFICIENCY COMPARISON AT LOAD LEVEL
FIGURE 5: BASELINE WORKLOAD – POWER COMPARISON AT THROUGHPUT LEVEL
G5 G6
Power Power
Target Load
Actual Load
ssj_opsAverage Power (Watts)
Target Load
Actual Load
ssj_opsAverage Power (Watts)
Difference in Power
Consumed
Difference in Power Efficiency
Active Idle 0 0 256 0
Active Idle 0 0 119 0 54%
10% 10.10% 15,143 262 57.9 10% 9.90% 41,820 167 250 36% 332%20% 20.20% 30,248 267 113 20% 20.20% 85,272 183 466 31% 312%30% 30.30% 45,230 273 166 30% 30.00% ###### 194 655 29% 295%40% 40.30% 60,175 281 214 40% 40.00% ###### 206 822 27% 284%50% 49.20% 73,434 291 253 50% 49.80% ###### 220 959 24% 279%60% 60.50% 90,402 304 297 60% 60.10% ###### 236 1,078 22% 263%70% 70.60% ###### 316 334 70% 70.40% ###### 253 1,177 20% 252%80% 79.70% ###### 326 365 80% 79.90% ###### 270 1,255 17% 244%90% 89.60% ###### 337 397 90% 89.80% ###### 288 1,321 15% 233%
100% 98.80% ###### 346 427 100% 99.30% ###### 307 1,369 11% 221%252 952 26% 271%
Performance Power Efficienc
y (Performance/
∑ssj_ops / ∑power =
Performance Power Efficienc
y (Performance/
∑ssj_ops / ∑power =
050100150200250300350400
050
100150200250300350400450
Pow
er (W
atts
)
Pow
er E
ffici
ency
(P
erfo
rman
ce/W
atts
)
Load Level
Baseline Workload: G5
Power Efficiency (Performance/Watts)
Average Power (Watts)
050100150200250300350400
0200400600800
100012001400
Pow
er (W
atts
)
Pow
er E
ffici
ency
(P
erfo
rman
ce/W
atts
)
Load Level
Baseline Workload: G6
Power Efficiency (Performance/Watts)
Average Power (Watts)
050100150200250300350400
050
100150200250300350400450
0 30000 60000 90000 120000 150000
Pow
er (W
atts
)
Pow
er E
ffici
ency
(p
erfo
rman
ce/w
atts
)
Throughput
Power Efficiency (Performance/Watts)
Average Power (Watts)
050100150200250300350
0200400600800
1000120014001600
0 90000 180000 270000 360000 450000
Pow
er (W
atts
)
Pow
er E
ffici
ency
(p
erfo
rman
ce/w
atts
)
Throughput
Power Efficiency (Performance/Watts)
Average Power (Watts)
050,000
100,000150,000200,000250,000300,000350,000400,000450,000
Thro
ughp
ut(T
rans
actio
ns/S
econ
d)
Load Level
G5 G6
Baseline Workload: Throughput at Load Level
0200400600800
1,0001,2001,4001,600
Pow
er E
ffici
ency
(P
erfo
rman
ce/W
atts
)
Load Level
G5 G6
Baseline Workload: Power Efficiency at Load Level
050
100150200250300350400
Ave
rage
Pow
er (W
atts
)
Load Level
G5 G6
Baseline Workload: Power at Load Level
0200400600800
1000120014001600
0 100,000 200,000 300,000 400,000 500,000
Pow
er E
ffici
ency
(P
erfo
rman
ce/W
atts
)
Throughput(Transactions/Second)
G5 G6
Baseline Workload: Power Efficiency at Throughput
050
100150200250300350400
0 100,000 200,000 300,000 400,000 500,000
Ave
rage
Pow
er (W
atts
)
Throughput(Transactions/Second)
G5 G6
Baseline Workload: Power at ThroughputFIGURE 7: BASELINE WORKLOAD – POWER EFFICIENCY COMPARISON AT THROUGHPUT LEVEL
G5 G6
Power Power
Target Load
Actual Load
ssj_opsAverage Power (Watts)
Target Load
Actual Load
ssj_opsAverage Power (Watts)
Difference in Power
Consumed
Difference in Power Efficiency
Active Idle 0 0 256 0
Active Idle 0 0 119 0 54%
10% 10.10% 15,143 262 57.9 10% 9.90% 41,820 167 250 36% 332%20% 20.20% 30,248 267 113 20% 20.20% 85,272 183 466 31% 312%30% 30.30% 45,230 273 166 30% 30.00% ###### 194 655 29% 295%40% 40.30% 60,175 281 214 40% 40.00% ###### 206 822 27% 284%50% 49.20% 73,434 291 253 50% 49.80% ###### 220 959 24% 279%60% 60.50% 90,402 304 297 60% 60.10% ###### 236 1,078 22% 263%70% 70.60% ###### 316 334 70% 70.40% ###### 253 1,177 20% 252%80% 79.70% ###### 326 365 80% 79.90% ###### 270 1,255 17% 244%90% 89.60% ###### 337 397 90% 89.80% ###### 288 1,321 15% 233%
100% 98.80% ###### 346 427 100% 99.30% ###### 307 1,369 11% 221%252 952 26% 271%
Performance Power Efficienc
y (Performance/
∑ssj_ops / ∑power =
Performance Power Efficienc
y (Performance/
∑ssj_ops / ∑power =
050100150200250300350400
050
100150200250300350400450
Pow
er (W
atts
)
Pow
er E
ffici
ency
(P
erfo
rman
ce/W
atts
)
Load Level
Baseline Workload: G5
Power Efficiency (Performance/Watts)
Average Power (Watts)
050100150200250300350400
0200400600800
100012001400
Pow
er (W
atts
)
Pow
er E
ffici
ency
(P
erfo
rman
ce/W
atts
)
Load Level
Baseline Workload: G6
Power Efficiency (Performance/Watts)
Average Power (Watts)
050100150200250300350400
050
100150200250300350400450
0 30000 60000 90000 120000 150000
Pow
er (W
atts
)
Pow
er E
ffici
ency
(p
erfo
rman
ce/w
atts
)
Throughput
Power Efficiency (Performance/Watts)
Average Power (Watts)
050100150200250300350
0200400600800
1000120014001600
0 90000 180000 270000 360000 450000
Pow
er (W
atts
)
Pow
er E
ffici
ency
(p
erfo
rman
ce/w
atts
)
Throughput
Power Efficiency (Performance/Watts)
Average Power (Watts)
050,000
100,000150,000200,000250,000300,000350,000400,000450,000
Thro
ughp
ut(T
rans
actio
ns/S
econ
d)
Load Level
G5 G6
Baseline Workload: Throughput at Load Level
0200400600800
1,0001,2001,4001,600
Pow
er E
ffici
ency
(P
erfo
rman
ce/W
atts
)
Load Level
G5 G6
Baseline Workload: Power Efficiency at Load Level
050
100150200250300350400
Ave
rage
Pow
er (W
atts
)
Load Level
G5 G6
Baseline Workload: Power at Load Level
0200400600800
1000120014001600
0 100,000 200,000 300,000 400,000 500,000
Pow
er E
ffici
ency
(P
erfo
rman
ce/W
atts
)
Throughput(Transactions/Second)
G5 G6
Baseline Workload: Power Efficiency at Throughput
050
100150200250300350400
0 100,000 200,000 300,000 400,000 500,000
Ave
rage
Pow
er (W
atts
)
Throughput(Transactions/Second)
G5 G6
Baseline Workload: Power at Throughput
G5 G6
Power Power
Target Load
Actual Load
ssj_opsAverage Power (Watts)
Target Load
Actual Load
ssj_opsAverage Power (Watts)
Difference in Power
Consumed
Difference in Power Efficiency
Active Idle 0 0 256 0
Active Idle 0 0 119 0 54%
10% 10.10% 15,143 262 57.9 10% 9.90% 41,820 167 250 36% 332%20% 20.20% 30,248 267 113 20% 20.20% 85,272 183 466 31% 312%30% 30.30% 45,230 273 166 30% 30.00% ###### 194 655 29% 295%40% 40.30% 60,175 281 214 40% 40.00% ###### 206 822 27% 284%50% 49.20% 73,434 291 253 50% 49.80% ###### 220 959 24% 279%60% 60.50% 90,402 304 297 60% 60.10% ###### 236 1,078 22% 263%70% 70.60% ###### 316 334 70% 70.40% ###### 253 1,177 20% 252%80% 79.70% ###### 326 365 80% 79.90% ###### 270 1,255 17% 244%90% 89.60% ###### 337 397 90% 89.80% ###### 288 1,321 15% 233%
100% 98.80% ###### 346 427 100% 99.30% ###### 307 1,369 11% 221%252 952 26% 271%
Performance Power Efficienc
y (Performance/
∑ssj_ops / ∑power =
Performance Power Efficienc
y (Performance/
∑ssj_ops / ∑power =
050100150200250300350400
050
100150200250300350400450
Pow
er (W
atts
)
Pow
er E
ffici
ency
(P
erfo
rman
ce/W
atts
)
Load Level
Baseline Workload: G5
Power Efficiency (Performance/Watts)
Average Power (Watts)
050100150200250300350400
0200400600800
100012001400
Pow
er (W
atts
)
Pow
er E
ffici
ency
(P
erfo
rman
ce/W
atts
)
Load Level
Baseline Workload: G6
Power Efficiency (Performance/Watts)
Average Power (Watts)
050100150200250300350400
050
100150200250300350400450
0 30000 60000 90000 120000 150000
Pow
er (W
atts
)
Pow
er E
ffici
ency
(p
erfo
rman
ce/w
atts
)
Throughput
Power Efficiency (Performance/Watts)
Average Power (Watts)
050100150200250300350
0200400600800
1000120014001600
0 90000 180000 270000 360000 450000
Pow
er (W
atts
)
Pow
er E
ffici
ency
(p
erfo
rman
ce/w
atts
)
Throughput
Power Efficiency (Performance/Watts)
Average Power (Watts)
050,000
100,000150,000200,000250,000300,000350,000400,000450,000
Thro
ughp
ut(T
rans
actio
ns/S
econ
d)
Load Level
G5 G6
Baseline Workload: Throughput at Load Level
0200400600800
1,0001,2001,4001,600
Pow
er E
ffici
ency
(P
erfo
rman
ce/W
atts
)
Load Level
G5 G6
Baseline Workload: Power Efficiency at Load Level
050
100150200250300350400
Ave
rage
Pow
er (W
atts
)
Load Level
G5 G6
Baseline Workload: Power at Load Level
0200400600800
1000120014001600
0 100,000 200,000 300,000 400,000 500,000
Pow
er E
ffici
ency
(P
erfo
rman
ce/W
atts
)
Throughput(Transactions/Second)
G5 G6
Baseline Workload: Power Efficiency at Throughput
050
100150200250300350400
0 100,000 200,000 300,000 400,000 500,000
Ave
rage
Pow
er (W
atts
)
Throughput(Transactions/Second)
G5 G6
Baseline Workload: Power at Throughput

8
Load Level
G5 Performance (Responses/Second)
G5 Avg. Power (Watts)
G5 Power Efficiency (Performance/Watts)
G6 Performance (Responses/Second)
G6 Avg. Power (Watts)
G6 Power Efficiency (Performance/Watts)
Difference in Power Consumed9
Difference in Power Efficiency10
100% 21,959 324 68 69,978 264 265 18% 291%
90% 19,752 318 62 62,918 253 249 20% 300%
80% 17,552 312 56 55,910 236 237 24% 320%
70% 15,360 292 53 48,921 221 221 24% 320%
60% 13,163 277 48 41,922 211 199 24% 319%
50% 10,969 274 40 34,923 205 170 25% 326%
40% 8,777 271 32 27,936 197 142 27% 338%
30% 6,584 268 25 20,935 188 111 30% 352%
20% 4,390 264 17 13,962 182 77 31% 363%
10% 2,196 261 8 6,985 175 40 33% 375%
0% 0 256 0 0 119 0 54% -
Averages: 28% 330%
TABLE 3: DATA FROM WEB FUNDAMENTALS WORKLOAD
WEB FUNDAMENTALS
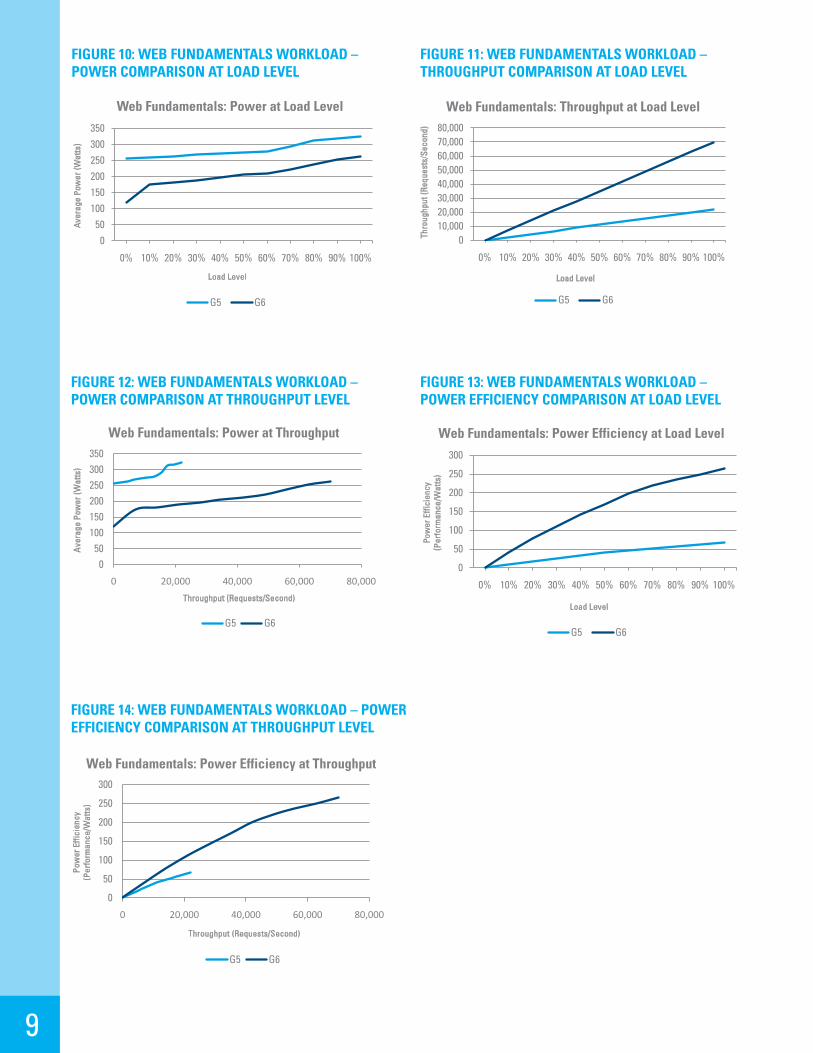
Over the 10 target load levels tested, the ENERGY STAR-qualified ProLiant G6 with Windows Server 2008 R2 used an average of 28% less power than the non-qualified ProLiant G5 server. In addition, the G6’s performance-to-power ratio was, on average, 330% higher than the non-qualified G5.
The G6 with R2 consistently consumed less power than the G5 across all target loads. At 10% target load, it consumed 33% less power than the G5; at 50% target load, the G6 used 25% less power than the G5.
FIGURE 9: WEB FUNDAMENTALS WORKLOAD – G6 POWER AND POWER EFFICIENCY AT LOAD LEVEL
FIGURE 8: WEB FUNDAMENTALS WORKLOAD – G5 POWER AND POWER EFFICIENCY AT LOAD LEVEL
9 Expressed as a percentage of G5 Average Power (Watts)
10 Expressed as a percentage of G5 Power Efficiency (Performance/Watts)
G5 G6
target load
Average
Perf/Power Ratio
g Power (Watts)
Efficien
cy avg pwr change
perf to pwr change
0% 256 0 119 0 0.5410% 262 57.9 167 250 0.36 3.3220% 267 113 183 466 0.31 3.1230% 273 166 194 655 0.29 2.9540% 281 214 206 822 0.27 2.8450% 291 253 220 959 0.24 2.7960% 304 297 236 1078 0.22 2.6370% 316 334 253 1177 0.20 2.5280% 326 365 270 1255 0.17 2.4490% 337 397 288 1321 0.15 2.33
100% 346 427 307 1369 0.11 2.210.26 2.71
G5 G6
Target Load
Responses/Second
Average Power (Watts)
Power Efficien
cy (Performance/Watts
)Target Load
Responses/Second
Average Power (Watts)
Power Efficien
cy (Performance/Watts
)
0% 0 256 0 0% 0 119 0
10% 2,196 261 8 10% 6,985 175 40
20% 4,390 264 17 20% 13,962 182 77
30% 6,584 268 25 30% 20,935 188 111
40% 8,777 271 32 40% 27,936 197 142
50% 10,969 274 40 50% 34,923 205 170
60% 13,163 277 48 60% 41,922 211 199
70% 15,360 292 53 70% 48,921 221 221
80% 17,552 312 56 80% 55,910 236 237
90% 19,752 318 62 90% 62,918 253 249
100% 21,959 324 68 100% 69,978 264 265
G6 G5
Users Overload Operations /
Second Power
CPU Utilization
(4 LPs) Throughput/W
att Users Overload Operations /
Second Power
CPU Utilizati
on (6 LPs)
Throughput/Watt
560 0% 51 276 3.70% 0.18 560 0% 51 175 0.70% 0.29
1,120 0% 102 279.7 10.30% 0.36 1,547 0% 142 185 1.50% 0.77
1,680 0% 154 284.2 16.40% 0.54 2,534 0% 232 190.1 2.70% 1.22
2,240 0% 205 295.4 31.30% 0.69 3,521 0% 323 193.8 4.00% 1.67
2,800 1% 256 317.8 62.00% 0.81 4,508 0% 414 196.7 5.50% 2.1
5,495 0% 504 198.7 7.20% 2.54
6,482 0% 595 200.1 8.60% 2.97
7,469 0% 688 201.8 9.70% 3.41
8,456 0% 784 203.9 12.70% 3.85
9,443 1% 881 209.6 17.30% 4.2
All higher levels had excessive overload
All higher levels had excessive overload
0
50
100
150
200
250
300
350
400
0%10%
20%
30%
40%
50%
60%
70%
80%
90%
100%
Wat
ts
Load Level
Baseline Workload: G5 vs. G6
G5 Average Power (w)
Average Power (Watts)
0
50
100
150
200
250
300
0
50
100
150
200
250
300
Ave
rage
Pow
er (W
atts
)
Pow
er E
ffici
ency
(P
erfo
rman
ce/W
atts
)
Load Level
Web Fundamentals: G6
Power Efficiency (Performance/Watts)
Average Power (Watts)
0
50
100
150
200
250
300
350
0%10%
20%
30%
40%
50%
60%
70%
80%
90%
100%
Ave
rage
Pow
er (W
atts
)
Load Level
Web Fundamentals Workload: G5 vs. G6
Average Power (Watts)
Average Power (Watts)
050100150200250300350
01020304050607080
Ave
rage
Pow
er (W
atts
)
Pow
er E
ffici
ency
(P
erfo
rman
ce/W
atts
)
Load Level
Web Fundamentals: G5
Power Efficiency (Performance/Watts)
Average Power (Watts)
010,00020,00030,00040,00050,00060,00070,00080,000
0 0.1 0.2 0.3 0.4 0.5 0.6 0.7 0.8 0.9 1
Thro
ughp
ut (R
eque
sts/
Seco
nd)
Load Level
G5 G6
G5 G6
target load
Average
Perf/Power Ratio
g Power (Watts)
Efficien
cy avg pwr change
perf to pwr change
0% 256 0 119 0 0.5410% 262 57.9 167 250 0.36 3.3220% 267 113 183 466 0.31 3.1230% 273 166 194 655 0.29 2.9540% 281 214 206 822 0.27 2.8450% 291 253 220 959 0.24 2.7960% 304 297 236 1078 0.22 2.6370% 316 334 253 1177 0.20 2.5280% 326 365 270 1255 0.17 2.4490% 337 397 288 1321 0.15 2.33
100% 346 427 307 1369 0.11 2.210.26 2.71
G5 G6
Target Load
Responses/Second
Average Power (Watts)
Power Efficien
cy (Performance/Watts
)Target Load
Responses/Second
Average Power (Watts)
Power Efficien
cy (Performance/Watts
)
0% 0 256 0 0% 0 119 0
10% 2,196 261 8 10% 6,985 175 40
20% 4,390 264 17 20% 13,962 182 77
30% 6,584 268 25 30% 20,935 188 111
40% 8,777 271 32 40% 27,936 197 142
50% 10,969 274 40 50% 34,923 205 170
60% 13,163 277 48 60% 41,922 211 199
70% 15,360 292 53 70% 48,921 221 221
80% 17,552 312 56 80% 55,910 236 237
90% 19,752 318 62 90% 62,918 253 249
100% 21,959 324 68 100% 69,978 264 265
G6 G5
Users Overload Operations /
Second Power
CPU Utilization
(4 LPs) Throughput/W
att Users Overload Operations /
Second Power
CPU Utilizati
on (6 LPs)
Throughput/Watt
560 0% 51 276 3.70% 0.18 560 0% 51 175 0.70% 0.29
1,120 0% 102 279.7 10.30% 0.36 1,547 0% 142 185 1.50% 0.77
1,680 0% 154 284.2 16.40% 0.54 2,534 0% 232 190.1 2.70% 1.22
2,240 0% 205 295.4 31.30% 0.69 3,521 0% 323 193.8 4.00% 1.67
2,800 1% 256 317.8 62.00% 0.81 4,508 0% 414 196.7 5.50% 2.1
5,495 0% 504 198.7 7.20% 2.54
6,482 0% 595 200.1 8.60% 2.97
7,469 0% 688 201.8 9.70% 3.41
8,456 0% 784 203.9 12.70% 3.85
9,443 1% 881 209.6 17.30% 4.2
All higher levels had excessive overload
All higher levels had excessive overload
0
50
100
150
200
250
300
350
400
0%10%
20%
30%
40%
50%
60%
70%
80%
90%
100%
Wat
ts
Load Level
Baseline Workload: G5 vs. G6
G5 Average Power (w)
Average Power (Watts)
0
50
100
150
200
250
300
0
50
100
150
200
250
300
Ave
rage
Pow
er (W
atts
)
Pow
er E
ffici
ency
(P
erfo
rman
ce/W
atts
)Load Level
Web Fundamentals: G6
Power Efficiency (Performance/Watts)
Average Power (Watts)
0
50
100
150
200
250
300
350
0%10%
20%
30%
40%
50%
60%
70%
80%
90%
100%
Ave
rage
Pow
er (W
atts
)
Load Level
Web Fundamentals Workload: G5 vs. G6
Average Power (Watts)
Average Power (Watts)
050100150200250300350
01020304050607080
Ave
rage
Pow
er (W
atts
)
Pow
er E
ffici
ency
(P
erfo
rman
ce/W
atts
)
Load Level
Web Fundamentals: G5
Power Efficiency (Performance/Watts)
Average Power (Watts)
010,00020,00030,00040,00050,00060,00070,00080,000
0 0.1 0.2 0.3 0.4 0.5 0.6 0.7 0.8 0.9 1
Thro
ughp
ut (R
eque
sts/
Seco
nd)
Load Level
G5 G6
9
FIGURE 11: WEB FUNDAMENTALS WORKLOAD – THROUGHPUT COMPARISON AT LOAD LEVEL
FIGURE 10: WEB FUNDAMENTALS WORKLOAD – POWER COMPARISON AT LOAD LEVEL
FIGURE 14: WEB FUNDAMENTALS WORKLOAD – POWER EFFICIENCY COMPARISON AT THROUGHPUT LEVEL
G5 FinalTest G6 Final Test
Target Load
rps (request
s per second)
Average Power (Watts)
Performance to Power Ratio
Target Load
rps (request
s per second)
Average Power
(W)
Performance to Power Ratio
Difference in
Power Consume
d
Difference in Power Efficiency
0% 0 256 0 0% 0 119 0 54% - 10% 2196 261 8 10% 6985 175 40 33% 375%20% 4390 264 17 20% 13962 182 77 31% 363%30% 6584 268 25 30% 20935 188 111 30% 352%40% 8777 271 32 40% 27936 197 142 27% 338%50% 10969 274 40 50% 34923 205 170 25% 326%60% 13163 277 48 60% 41922 211 199 24% 319%70% 15360 292 53 70% 48921 221 221 24% 320%80% 17552 312 56 80% 55910 236 237 24% 320%90% 19752 318 62 90% 62918 253 249 20% 300%
100% 21959 324 68 100% 69978 264 265 18% 291%28% 330%
010,00020,00030,00040,00050,00060,00070,00080,000
0% 10% 20% 30% 40% 50% 60% 70% 80% 90% 100%
Thro
ughp
ut (R
eque
sts/
Seco
nd)
Load Level
G5 G6
Web Fundamentals: Throughput at Load Level
0
50
100
150
200
250
300
0% 10% 20% 30% 40% 50% 60% 70% 80% 90% 100%
Pow
er E
ffici
ency
(P
erfo
rman
ce/W
atts
)
Load Level
G5 G6
Web Fundamentals: Power Efficiency at Load Level
0
50
100
150
200
250
300
0 20,000 40,000 60,000 80,000
Pow
er E
ffici
ency
(P
erfo
rman
ce/W
atts
)
Throughput (Requests/Second)
G5 G6
Web Fundamentals: Power Efficiency at Throughput
050
100150200250300350
0% 10% 20% 30% 40% 50% 60% 70% 80% 90% 100%
Ave
rage
Pow
er (W
atts
)
Load Level
Web Fundamentals: Power at Load Level
G5 G6
050
100150200250300350
0 20,000 40,000 60,000 80,000A
vera
ge P
ower
(Wat
ts)
Throughput (Requests/Second)
G5 G6
Web Fundamentals: Power at Throughput
G5 FinalTest G6 Final Test
Target Load
rps (request
s per second)
Average Power (Watts)
Performance to Power Ratio
Target Load
rps (request
s per second)
Average Power
(W)
Performance to Power Ratio
Difference in
Power Consume
d
Difference in Power Efficiency
0% 0 256 0 0% 0 119 0 54% - 10% 2196 261 8 10% 6985 175 40 33% 375%20% 4390 264 17 20% 13962 182 77 31% 363%30% 6584 268 25 30% 20935 188 111 30% 352%40% 8777 271 32 40% 27936 197 142 27% 338%50% 10969 274 40 50% 34923 205 170 25% 326%60% 13163 277 48 60% 41922 211 199 24% 319%70% 15360 292 53 70% 48921 221 221 24% 320%80% 17552 312 56 80% 55910 236 237 24% 320%90% 19752 318 62 90% 62918 253 249 20% 300%
100% 21959 324 68 100% 69978 264 265 18% 291%28% 330%
010,00020,00030,00040,00050,00060,00070,00080,000
0% 10% 20% 30% 40% 50% 60% 70% 80% 90% 100%
Thro
ughp
ut (R
eque
sts/
Seco
nd)
Load Level
G5 G6
Web Fundamentals: Throughput at Load Level
0
50
100
150
200
250
300
0% 10% 20% 30% 40% 50% 60% 70% 80% 90% 100%
Pow
er E
ffici
ency
(P
erfo
rman
ce/W
atts
)
Load Level
G5 G6
Web Fundamentals: Power Efficiency at Load Level
0
50
100
150
200
250
300
0 20,000 40,000 60,000 80,000
Pow
er E
ffici
ency
(P
erfo
rman
ce/W
atts
)
Throughput (Requests/Second)
G5 G6
Web Fundamentals: Power Efficiency at Throughput
050
100150200250300350
0% 10% 20% 30% 40% 50% 60% 70% 80% 90% 100%
Ave
rage
Pow
er (W
atts
)
Load Level
Web Fundamentals: Power at Load Level
G5 G6
050
100150200250300350
0 20,000 40,000 60,000 80,000
Ave
rage
Pow
er (W
atts
)
Throughput (Requests/Second)
G5 G6
Web Fundamentals: Power at Throughput
FIGURE 13: WEB FUNDAMENTALS WORKLOAD – POWER EFFICIENCY COMPARISON AT LOAD LEVEL
FIGURE 12: WEB FUNDAMENTALS WORKLOAD – POWER COMPARISON AT THROUGHPUT LEVEL
G5 FinalTest G6 Final Test
Target Load
rps (request
s per second)
Average Power (Watts)
Performance to Power Ratio
Target Load
rps (request
s per second)
Average Power
(W)
Performance to Power Ratio
Difference in
Power Consume
d
Difference in Power Efficiency
0% 0 256 0 0% 0 119 0 54% - 10% 2196 261 8 10% 6985 175 40 33% 375%20% 4390 264 17 20% 13962 182 77 31% 363%30% 6584 268 25 30% 20935 188 111 30% 352%40% 8777 271 32 40% 27936 197 142 27% 338%50% 10969 274 40 50% 34923 205 170 25% 326%60% 13163 277 48 60% 41922 211 199 24% 319%70% 15360 292 53 70% 48921 221 221 24% 320%80% 17552 312 56 80% 55910 236 237 24% 320%90% 19752 318 62 90% 62918 253 249 20% 300%
100% 21959 324 68 100% 69978 264 265 18% 291%28% 330%
010,00020,00030,00040,00050,00060,00070,00080,000
0% 10% 20% 30% 40% 50% 60% 70% 80% 90% 100%
Thro
ughp
ut (R
eque
sts/
Seco
nd)
Load Level
G5 G6
Web Fundamentals: Throughput at Load Level
0
50
100
150
200
250
300
0% 10% 20% 30% 40% 50% 60% 70% 80% 90% 100%
Pow
er E
ffici
ency
(P
erfo
rman
ce/W
atts
)
Load Level
G5 G6
Web Fundamentals: Power Efficiency at Load Level
0
50
100
150
200
250
300
0 20,000 40,000 60,000 80,000
Pow
er E
ffici
ency
(P
erfo
rman
ce/W
atts
)
Throughput (Requests/Second)
G5 G6
Web Fundamentals: Power Efficiency at Throughput
050
100150200250300350
0% 10% 20% 30% 40% 50% 60% 70% 80% 90% 100%
Ave
rage
Pow
er (W
atts
)
Load Level
Web Fundamentals: Power at Load Level
G5 G6
050
100150200250300350
0 20,000 40,000 60,000 80,000
Ave
rage
Pow
er (W
atts
)
Throughput (Requests/Second)
G5 G6
Web Fundamentals: Power at Throughput
10
FSCT
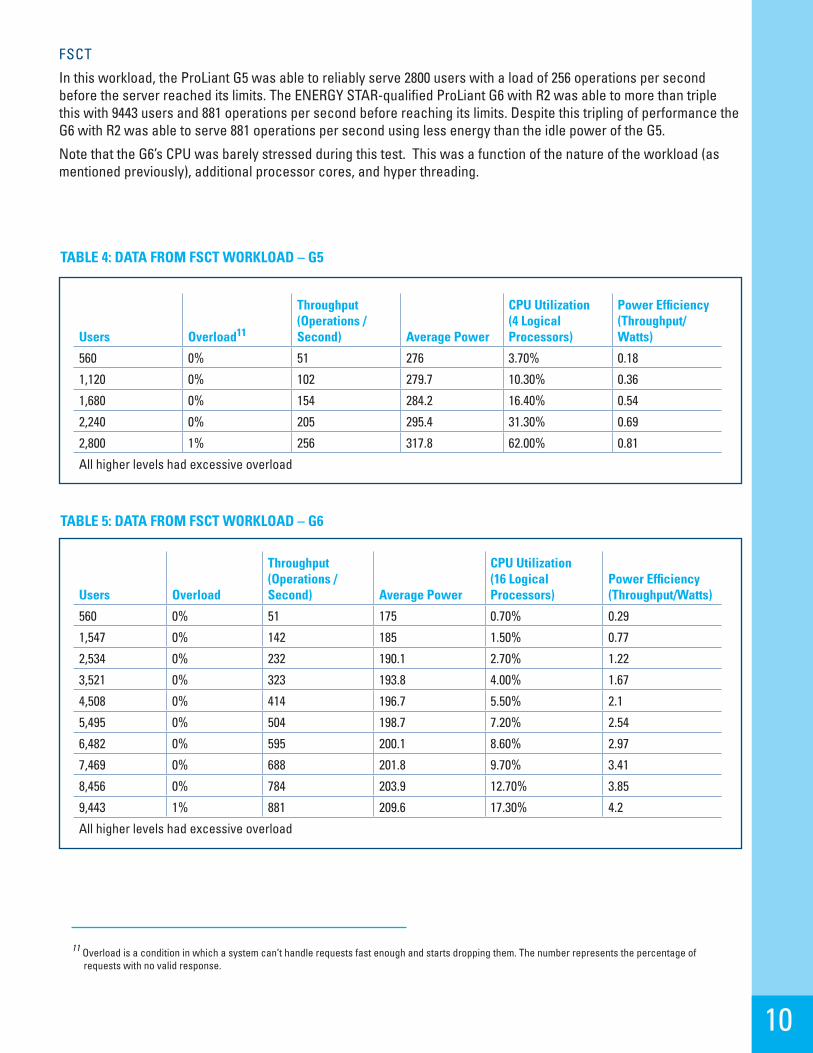
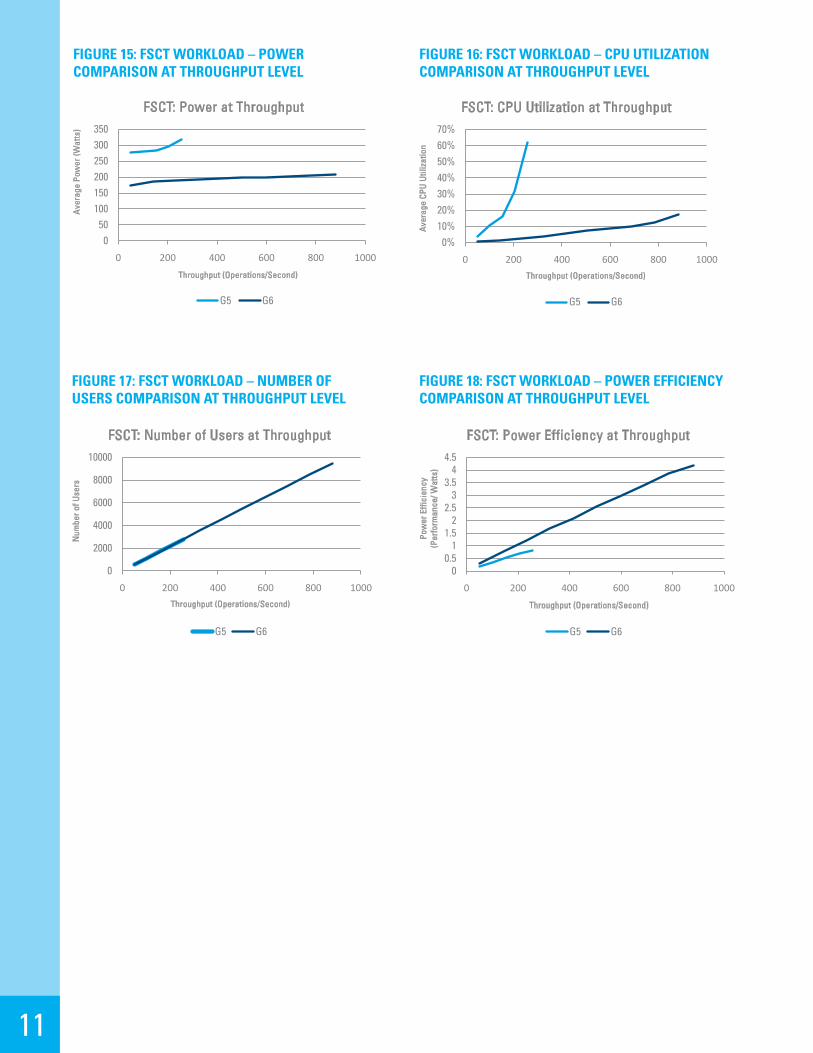
In this workload, the ProLiant G5 was able to reliably serve 2800 users with a load of 256 operations per second before the server reached its limits. The ENERGY STAR-qualified ProLiant G6 with R2 was able to more than triple this with 9443 users and 881 operations per second before reaching its limits. Despite this tripling of performance the G6 with R2 was able to serve 881 operations per second using less energy than the idle power of the G5.
Note that the G6’s CPU was barely stressed during this test. This was a function of the nature of the workload (as mentioned previously), additional processor cores, and hyper threading.
TABLE 4: DATA FROM FSCT WORKLOAD – G5
Users Overload11
Throughput (Operations / Second) Average Power
CPU Utilization (4 Logical Processors)
Power Efficiency (Throughput/Watts)
560 0% 51 276 3.70% 0.18
1,120 0% 102 279.7 10.30% 0.36
1,680 0% 154 284.2 16.40% 0.54
2,240 0% 205 295.4 31.30% 0.69
2,800 1% 256 317.8 62.00% 0.81
All higher levels had excessive overload
Users Overload
Throughput (Operations / Second) Average Power
CPU Utilization (16 Logical Processors)
Power Efficiency (Throughput/Watts)
560 0% 51 175 0.70% 0.29
1,547 0% 142 185 1.50% 0.77
2,534 0% 232 190.1 2.70% 1.22
3,521 0% 323 193.8 4.00% 1.67
4,508 0% 414 196.7 5.50% 2.1
5,495 0% 504 198.7 7.20% 2.54
6,482 0% 595 200.1 8.60% 2.97
7,469 0% 688 201.8 9.70% 3.41
8,456 0% 784 203.9 12.70% 3.85
9,443 1% 881 209.6 17.30% 4.2
All higher levels had excessive overload
TABLE 5: DATA FROM FSCT WORKLOAD – G6
11 Overload is a condition in which a system can’t handle requests fast enough and starts dropping them. The number represents the percentage of requests with no valid response.
11
FIGURE 16: FSCT WORKLOAD – CPU UTILIZATION COMPARISON AT THROUGHPUT LEVEL
FIGURE 15: FSCT WORKLOAD – POWER COMPARISON AT THROUGHPUT LEVEL
FIGURE 18: FSCT WORKLOAD – POWER EFFICIENCY COMPARISON AT THROUGHPUT LEVEL
FIGURE 17: FSCT WORKLOAD – NUMBER OF USERS COMPARISON AT THROUGHPUT LEVEL
G5
Users Overload
Throughput
(Operations /
Second)
Average Power (watts)
CPU Utilization (4 LPs)
Throughput/Watt
560 0% 51 276 3.70% 0.18
1120 0% 102 279.7 10.30% 0.36
1680 0% 154 284.2 16.40% 0.54
2240 0% 205 295.4 31.30% 0.69
2800 1% 256 317.8 62.00% 0.81
G6
Users Overload
Throughput
(Operations /
Second)
Average Power (watts)
CPU Utilization (16 LPs)
Throughput/Watt
560 0% 51 175 0.70% 0.29
1547 0% 142 185 1.50% 0.77 2534 0% 232 190.1 2.70% 1.22
3521 0% 323 193.8 4.00% 1.67 4508 0% 414 196.7 5.50% 2.1
5495 0% 504 198.7 7.20% 2.54
6482 0% 595 200.1 8.60% 2.97
7469 0% 688 201.8 9.70% 3.41
8456 0% 784 203.9 12.70% 3.85
9443 1% 881 209.6 17.30% 4.2
0 50 100 150 200 250 300
276
279.7
284.2
295.4
317.8
Throughput
Ave
rage
Pow
er (W
atts
)
FSCT G5 Power at Throughput
Average Power (watts) Throughput (Operations / Second)
0 200 400 600 800 1000
175
190.1
196.7
200.1
203.9
Throughput
Ave
rage
Pow
er (W
atts
)
FSCT G6 Power at Throughput
Average Power (watts) Throughput (Operations / Second)
00.5
11.5
22.5
33.5
44.5
0 200 400 600 800 1000
Pow
er E
ffici
ency
(P
erfo
rman
ce/ W
atts
)
Throughput (Operations/Second)
FSCT: Power Efficiency at Throughput
G5 G6
050
100150200250300350
0 200 400 600 800 1000
Ave
rage
Pow
er (W
atts
)
Throughput (Operations/Second)
FSCT: Power at Throughput
G5 G6
0
2000
4000
6000
8000
10000
0 200 400 600 800 1000
Num
ber o
f Use
rs
Throughput (Operations/Second)
FSCT: Number of Users at Throughput
G5 G6
0%10%20%30%40%50%60%70%
0 200 400 600 800 1000
Ave
rage
CPU
Util
izat
ion
Throughput (Operations/Second)
FSCT: CPU Utilization at Throughput
G5 G6
G5
Users Overload
Throughput
(Operations /
Second)
Average Power (watts)
CPU Utilization (4 LPs)
Throughput/Watt
560 0% 51 276 3.70% 0.18
1120 0% 102 279.7 10.30% 0.36
1680 0% 154 284.2 16.40% 0.54
2240 0% 205 295.4 31.30% 0.69
2800 1% 256 317.8 62.00% 0.81
G6
Users Overload
Throughput
(Operations /
Second)
Average Power (watts)
CPU Utilization (16 LPs)
Throughput/Watt
560 0% 51 175 0.70% 0.29
1547 0% 142 185 1.50% 0.77 2534 0% 232 190.1 2.70% 1.22
3521 0% 323 193.8 4.00% 1.67 4508 0% 414 196.7 5.50% 2.1
5495 0% 504 198.7 7.20% 2.54
6482 0% 595 200.1 8.60% 2.97
7469 0% 688 201.8 9.70% 3.41
8456 0% 784 203.9 12.70% 3.85
9443 1% 881 209.6 17.30% 4.2
0 50 100 150 200 250 300
276
279.7
284.2
295.4
317.8
Throughput
Ave
rage
Pow
er (W
atts
)
FSCT G5 Power at Throughput
Average Power (watts) Throughput (Operations / Second)
0 200 400 600 800 1000
175
190.1
196.7
200.1
203.9
Throughput
Ave
rage
Pow
er (W
atts
)FSCT G6 Power at Throughput
Average Power (watts) Throughput (Operations / Second)
00.5
11.5
22.5
33.5
44.5
0 200 400 600 800 1000
Pow
er E
ffici
ency
(P
erfo
rman
ce/ W
atts
)
Throughput (Operations/Second)
FSCT: Power Efficiency at Throughput
G5 G6
050
100150200250300350
0 200 400 600 800 1000
Ave
rage
Pow
er (W
atts
)
Throughput (Operations/Second)
FSCT: Power at Throughput
G5 G6
0
2000
4000
6000
8000
10000
0 200 400 600 800 1000
Num
ber o
f Use
rs
Throughput (Operations/Second)
FSCT: Number of Users at Throughput
G5 G6
0%10%20%30%40%50%60%70%
0 200 400 600 800 1000
Ave
rage
CPU
Util
izat
ion
Throughput (Operations/Second)
FSCT: CPU Utilization at Throughput
G5 G6
G5
Users Overload
Throughput
(Operations /
Second)
Average Power (watts)
CPU Utilization (4 LPs)
Throughput/Watt
560 0% 51 276 3.70% 0.18
1120 0% 102 279.7 10.30% 0.36
1680 0% 154 284.2 16.40% 0.54
2240 0% 205 295.4 31.30% 0.69
2800 1% 256 317.8 62.00% 0.81
G6
Users Overload
Throughput
(Operations /
Second)
Average Power (watts)
CPU Utilization (16 LPs)
Throughput/Watt
560 0% 51 175 0.70% 0.29
1547 0% 142 185 1.50% 0.77 2534 0% 232 190.1 2.70% 1.22
3521 0% 323 193.8 4.00% 1.67 4508 0% 414 196.7 5.50% 2.1
5495 0% 504 198.7 7.20% 2.54
6482 0% 595 200.1 8.60% 2.97
7469 0% 688 201.8 9.70% 3.41
8456 0% 784 203.9 12.70% 3.85
9443 1% 881 209.6 17.30% 4.2
0 50 100 150 200 250 300
276
279.7
284.2
295.4
317.8
Throughput
Ave
rage
Pow
er (W
atts
)
FSCT G5 Power at Throughput
Average Power (watts) Throughput (Operations / Second)
0 200 400 600 800 1000
175
190.1
196.7
200.1
203.9
Throughput
Ave
rage
Pow
er (W
atts
)
FSCT G6 Power at Throughput
Average Power (watts) Throughput (Operations / Second)
00.5
11.5
22.5
33.5
44.5
0 200 400 600 800 1000
Pow
er E
ffici
ency
(P
erfo
rman
ce/ W
atts
)
Throughput (Operations/Second)
FSCT: Power Efficiency at Throughput
G5 G6
050
100150200250300350
0 200 400 600 800 1000
Ave
rage
Pow
er (W
atts
)
Throughput (Operations/Second)
FSCT: Power at Throughput
G5 G6
0
2000
4000
6000
8000
10000
0 200 400 600 800 1000
Num
ber o
f Use
rs
Throughput (Operations/Second)
FSCT: Number of Users at Throughput
G5 G6
0%10%20%30%40%50%60%70%
0 200 400 600 800 1000
Ave
rage
CPU
Util
izat
ion
Throughput (Operations/Second)
FSCT: CPU Utilization at Throughput
G5 G6
G5
Users Overload
Throughput
(Operations /
Second)
Average Power (watts)
CPU Utilization (4 LPs)
Throughput/Watt
560 0% 51 276 3.70% 0.18
1120 0% 102 279.7 10.30% 0.36
1680 0% 154 284.2 16.40% 0.54
2240 0% 205 295.4 31.30% 0.69
2800 1% 256 317.8 62.00% 0.81
G6
Users Overload
Throughput
(Operations /
Second)
Average Power (watts)
CPU Utilization (16 LPs)
Throughput/Watt
560 0% 51 175 0.70% 0.29
1547 0% 142 185 1.50% 0.77 2534 0% 232 190.1 2.70% 1.22
3521 0% 323 193.8 4.00% 1.67 4508 0% 414 196.7 5.50% 2.1
5495 0% 504 198.7 7.20% 2.54
6482 0% 595 200.1 8.60% 2.97
7469 0% 688 201.8 9.70% 3.41
8456 0% 784 203.9 12.70% 3.85
9443 1% 881 209.6 17.30% 4.2
0 50 100 150 200 250 300
276
279.7
284.2
295.4
317.8
Throughput
Ave
rage
Pow
er (W
atts
)
FSCT G5 Power at Throughput
Average Power (watts) Throughput (Operations / Second)
0 200 400 600 800 1000
175
190.1
196.7
200.1
203.9
Throughput
Ave
rage
Pow
er (W
atts
)
FSCT G6 Power at Throughput
Average Power (watts) Throughput (Operations / Second)
00.5
11.5
22.5
33.5
44.5
0 200 400 600 800 1000
Pow
er E
ffici
ency
(P
erfo
rman
ce/ W
atts
)
Throughput (Operations/Second)
FSCT: Power Efficiency at Throughput
G5 G6
050
100150200250300350
0 200 400 600 800 1000
Ave
rage
Pow
er (W
atts
)
Throughput (Operations/Second)
FSCT: Power at Throughput
G5 G6
0
2000
4000
6000
8000
10000
0 200 400 600 800 1000
Num
ber o
f Use
rs
Throughput (Operations/Second)
FSCT: Number of Users at Throughput
G5 G6
0%10%20%30%40%50%60%70%
0 200 400 600 800 1000
Ave
rage
CPU
Util
izat
ion
Throughput (Operations/Second)
FSCT: CPU Utilization at Throughput
G5 G6
12
WHY NEWER HARDWARE AND OPERATING SYSTEMS ARE MORE ENERGY-EFFICIENTHARDWARE
HP cites a number of reasons why its latest servers offer improved power efficiency over previous generations: common slot power supplies that are redundant, better DC voltage regulators, Intel Xeon 5500 processors that consume less power, and less power needed to operate cooling fans.
HP ProLiant G6 servers make use of the company’s common slot power supply design that can be used interchangeably across multiple platforms. According to HP, these are more efficient at all power loads than previous generations of HP power supplies. Common slot power supplies allow planners to select a power supply that will operate close to its maximum efficiency for the planned server power load. For example, a 750-watt power supply would be the optimal choice for a server that has an average power load of 350 watts, since it would be 92% efficient at that load, according to the company. A 1200-watt power supply installed in that same server configuration would only operate at 88% efficiency.
Although in this test a single power supply was used, redundant power supplies increase reliability. However, in the past this could result in lower power efficiency. For example, in G5 servers, both redundant power supplies are online simultaneously; this lowers the amount of power drawn from each supply, but has the potential to decrease the power efficiency of each one. A feature of the High Efficiency Mode (HEM) option on DL G6 servers is that one of the redundant power supplies can be kept in a standby state; this increases efficiency by allowing the remaining supply to support the full power load. The additional power supply is brought online only if the primary supply fails.
The improved DC voltage regulators in the G6 servers convert the 12-volt DC from the power supply into the 5-volt, 3-volt, and other feeds used by the various system components. This results in an 8-point gain in DC power
efficiency over previous generations of servers, according to the company.
Many ProLiant G6 servers use the Intel Xeon 5500 series processors, which have Intel’s Intelligent Power Technology. This is a set of features that can be used to lower power consumption of the processor and related subsystems when they are not fully utilized.
Most ProLiant servers also include the HP Power Regulator Dynamic Power Savings mode feature, which automatically optimizes processor power consumption based on server activity. Power Regulator is implemented in the system firmware and directly monitors the instruction load of the server processor(s) to determine the level of system activity. Power Regulator uses this information to continuously adjust the performance states, or p-states, of the processor(s) to match processor power consumption to the current workload without noticeably impacting overall system performance.
The power management mode used in our G6 tests combines the capabilities of HP Power Regulator with the Balanced Power Policy in Windows Server 2008 R2. This is achieved using an interface that Microsoft and HP jointly created called Processor Clocking Control (PCC). The operating system calculates the future performance requirements of each of the processor cores on the system and communicates these requirements to the DL 360 G6 using the PCC interface. HP Power Regulator manages the power controls on the processors and other components on the system to deliver the requested performance level for each core. PCC enables the hardware and software to work together to delivery optimal power efficiency for the workload running on the server.12
Additionally, ProLiant G6 servers can use up to 32 sensors to map the temperature profile inside the server. Instead of using a fixed fan speed curve, a proprietary feedback algorithm adjusts individual fan speeds to maintain specific temperatures. This prevents overcooling and lowers the overall power consumption of the fans.
THE OPERATING SYSTEM
Windows Server 2008 R2 offers a number of power control features as well as an optional “Enhanced
12 Details of the PCC interface can be found at http://www.acpica.org/documentation/related_documents.php.

13
Power Management” qualification program for servers. For starters, it includes three in-box power policies: Power Saver , Balanced (default) and High Performance. The default Balanced policy continuously alters the power states of the processors in the system in response to the utilization level of the workload. This ensures that processor power usage maps to the needs of the workload, with minimal impact to workload performance.
R2 achieves additional power savings by combining processor power state control with a feature that consolidates work onto a smaller number of processor cores when workload utilization is low. This feature is referred to as Core Parking. Processor cores that aren’t doing any work are placed into a deep sleep state. This feature effectively scales the number of processor cores in active use. Other features such as Timer Coalescing and Intelligent Timer Tick Distribution (or Tick Skipping), extend the time that processor cores stay in deep sleep states by avoiding waking cores unnecessarily.
The balanced power policy delivers power efficiency out of the box. For workloads that prioritize lowest latency and highest performance levels over power efficiency, the High Performance power policy can be used.
Although not featured in this study, these power efficiency improvements apply to Hyper-V, offering a significant reduction in platform interrupt activity and enabling power savings and greater scalability for virtual machines (VMs).
As described above, support for the new power management interface called Processor Clocking Control (PCC) was introduced in Windows Server 2008 R2. The operating system and platform use the PCC interface to coordinate on power management. Windows Server 2008 R2 uses the PCC interface to pass future processor performance requirements to the hardware, as a percentage of maximum frequency. The hardware is in direct control of the processor power states in this mode of operation and is responsible for delivering the requested performance. This enables both the OS and the platform to innovate and add value in their respective domains which results in improved power efficiency for the server. This is the power management mode used for the G6 testing detailed in this paper and is the default configuration for new G6 servers with Windows Server 2008 R2.
Although not leveraged in this study, Windows Server 2008 R2 supports the new Power Meter and Budget firmware (ACPI) interface that is included in the ACPI 4.0 specification. The interface can be used by Windows Server to discover power monitoring and budgeting hardware on the platform and to access power consumption and power budget information.
Windows Server 2008 R2 exposes power information to remote management software using WMI (Windows Management Interface), which adheres to the DMTF Power Supply Profile v1.01. This interface can be used by developers to build software that can remotely access power meter and budget information and modify Windows Power Policy across groups of servers. System Center Operations Manager 2007 R2 uses this interface to provide centralized power management.
The Windows Server 2008 R2 server hardware logo program includes an optional Additional Qualification (AQ) called “Enhanced Power Management”. This qualification indicates that a server supports the following features:
« Power metering and budgeting hardware
« Power Meter and Budget firmware (ACPI) interface
« Enabling Windows power management
Hardware with this AQ will take full advantage of the power management features in Windows Server 2008 R2, and will natively support the new SCOM 2007 R2 power management features. The HP DL360 G6 server referenced in this paper is qualified for the Enhanced Power Management AQ.
Although not leveraged in this study, remote power metering capabilities are required for ENERGY STAR compliance and provide datacenter administrators with a valuable window into the power consumption and cooling trends of servers in situ.
14
CONCLUSIONSWithout doubt, server performance has increased over the past 3 years. However, better performance does not account for all -- or even the bulk of -- the energy efficiency improvements we documented. Instead, server hardware and software makers -- including HP, Intel, and Microsoft -- have worked just as hard to reduce platform power consumption, especially at lower utilization levels. These tests suggest they have had much success.
EXPECTED ANNUAL SAVINGS
Our findings imply that, at the average US commercial rate for electricity of 10 cents per kilowatt hour (kWh), the energy savings from a single ENERGY STAR-qualified server could range from $60 (at 50% utilization) to $120 (at idle) annually, or $240-$480 over the useful life of a server (4 years).
In addition to using less energy themselves, ENERGY STAR-qualified servers substantially reduce cooling loads in data centers. A general rule of thumb suggests that one watt saved by a server has the added benefit of saving one to two watts of cooling power. This yields a total savings of between $480 and $1,440 over the useful lifetime of a server.
It’s important to note that these power savings come with a substantial increase in performance—at 50% utilization, for example, the newer, more energy-efficient server handles over three times the workload, thereby reducing the number of systems needed to support the same load.
SAVINGS COMPARISONS, AVOIDED CARBON EMISSIONS
Because saving energy lowers demand on the nation’s power grid, it results in the generation of less electricity and thus prevents pollution, too. Our data suggests that a single ENERGY STAR-qualified server saves enough electricity to avert nearly ½ to 1 ton of carbon dioxide emissions, based on the assumptions stated above. Accounting for cooling savings makes it a total of 1 to 3 tons of carbon dioxide abated.