Embed Size (px)
Citation preview

ENERGY STAR Market Insights and Updates
ENERGY STAR:A win-win partnership that benefits business and society
Jean LupinacciOctober 24, 2017

ENERGY STAR partners: An efficiency community
Many playersMany roles and responsibilitiesCommon goals: Financial and environmental value
Service providers
Business Governments
Utilities
Manufacturers
Associations
NGOs
Education

EPA’s ENERGY STAR piece• Help facilitate the community
by providing transparency, standardization and education: Understandable benchmarks and
metrics Objective resources distilled from
proven practices Strong brand recognitionMotivation for improvement Badge of success for top
performance Community and network of
experts
Partners together
• Strengthen business networks• Develop new partnerships• Learn from each other about proven solutions and new technologies
• Pursue untapped opportunities to work together to bring energy efficiency to scale

Welcome to the Leadership Circle:Partner of the Year 2017:
Leaders in Energy Management and ENERGY STAR
AEP Ohio AEP Texas Central Air-King, Ltd. Allergan Ameren Missouri American Society for Healthcare Engineering (ASHE) AndersenCorporation Arizona Public Service AT&T Austin Energy AZ Energy Efficient Home Baltimore Gas and Electric Company (BG&E) Beacon CapitalPartners, LLC Beazer Homes USA, Inc Beko US Inc. - Arcelik A.S. Bentall Kennedy Best Buy Co., Inc. Best Energy Rating and Consulting LLCBig Ass Solutions BOMA International Bozzuto Management Company Brighton Homes Bristol-Myers Squibb Building Energy Burton EnergyGroup CalPortland Company CAMBA Housing Ventures, Inc. Canon U.S.A., Inc. CBRE Celanese Corporation Cenergistic CenterPoint EnergyChinburg Properties City of Chicago City of Seattle CodeGreen Solutions Colgate-Palmolive Company Columbia Gas of Ohio, Inc. (a NiSourcecompany) ComEd Consumers Energy Corning Incorporated Cushman & Wakefield Delaware Sustainable Energy Utility Delmarva Power DeltaProducts Corporation Des Moines Public Schools DPIS Engineering, LLC E3 Energy LLC E3 INNOVATE, LLC Eastman Chemical CompanyEATON Ecova Efficiency Vermont Energize Connecticut in partnership with Eversource, United Illuminating, Connecticut Natural Gas, andSouthern Connecticut Gas Energy Incentives, Inc. Energy Inspectors Corporation Energy Upgrade California EnergyLogic, Inc. EnergyPrintEnerNOC, Inc. Evergreen Public Schools Eversource Energy Fairfax County Public Schools Fannie Mae Focus on Energy Food Lion, LLC FourWalls, Inc. Fulton Homes GDS Associates GE Lighting General Motors Company Goby Inc. Grede Holdings LLC greeNEWit GreenSaversGresham-Barlow School District Guaranteed Watt Saver (GWS) Habitat for Humanity of Greater Nashville Hanesbrands Inc. HCP, Inc. HinesHoshizaki America, Inc. Houston Habitat for Humanity HP Inc. Illinois Office of Energy & Recycling at the Department of Commerce and
Economic Opportunity Intertape Polymer Group, Inc. IREM ITW Food Equipment Group Ivey Residential, LLC J.C. Penney Company, Inc.Jacksonville Building Science JLL KB Home Kenton County School District Kentucky School Boards Association Kilroy Realty Corporation KochIndustries, Inc. Kohl's Department Stores, Inc. Loudoun County Public Schools Mandalay Homes Manitowoc Foodservice, Inc. MansfieldIndependent School District Maximum Energy Professionals MaxLite Memorial Hermann Healthcare System Merck & Co., Inc. Meritage HomesMetro Lighting National Grid (MA) National Grid (RI) National Multifamily Housing Council Nationwide Marketing Group New Tradition HomesNew York State Energy Research and Development Authority (NYSERDA) NH CORE Utilities Nissan North America, Inc. Olin Brass PanasonicEco Solutions North America Parmenter Patuxent Environmental Group Pentair Aquatic Systems Potomac Electric Power Company (Pepco)Principal Real Estate Investors, LLC ProVia Providence Homes Public Service Company of Oklahoma (PSO) Raytheon Company Ricoh USA,Inc. Salt River Project Agricultural Improvement and Power District Sears Holdings Corporation Servidyne SkyeTec Energy Rating Services Soft-Lite LLC Southern Maryland Electric Cooperative (SMECO) Southwestern Electric Power Company (AEP SWEPCO) Staples the OfficeSuperstore, LLC Sustainable Investment Group Target Corporation Texas-New Mexico Power Company The Home Depot The Lighting andProducts Sponsors of Mass Save Thermo-Scan Inspections (TSI Energy Solutions) TIAA Tishman Speyer Top Build Home Services USAA RealEstate Company Virginia Beach City Public Schools Virginia State Corporation Commission Whirlpool Corporation

Best practices demonstrated by ENERGY STAR award winners
• LED retrofits• Energy performance reports• Employee engagement • Solar/renewable energy• Demand response
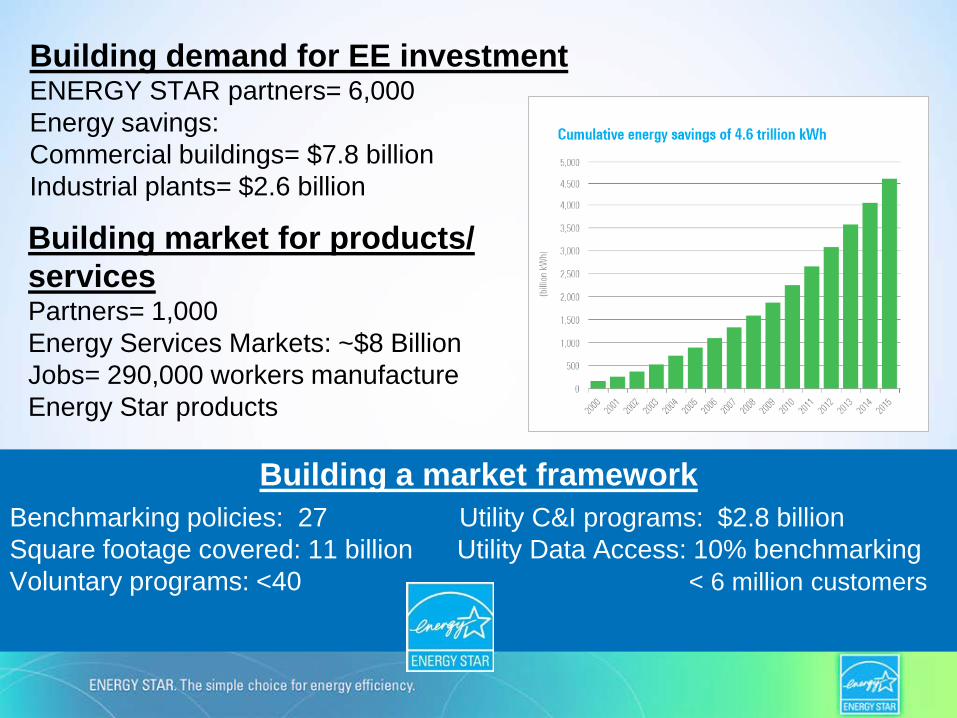
Building demand for EE investmentENERGY STAR partners= 6,000Energy savings:Commercial buildings= $7.8 billionIndustrial plants= $2.6 billion
Building a market frameworkBenchmarking policies: 27 Utility C&I programs: $2.8 billionSquare footage covered: 11 billion Utility Data Access: 10% benchmarking Voluntary programs: <40 < 6 million customers
Building market for products/ services Partners= 1,000Energy Services Markets: ~$8 BillionJobs= 290,000 workers manufacture Energy Star products

Recent ENERGY STAR updates• Making it easier to find solutions:
– New utility data and state and local policy maps – New directory to find licensed professionals
• Reaching new audiences with energy efficiency opportunities:
– Tenant engagement– Host your own competitions– College curriculum (with broader educational uses)
• Improving Portfolio Manager:– 1-100 ENERGY STAR score updates on track for 2018– Updated dashboard features– Demand tracking– New multifamily housing water score

Insights into the Commercial Building Market

If U.S. buildings and plants were their own country, they would rank third in the world in greenhouse gas emissions, behind only China and the United States.

Building Sector Activity
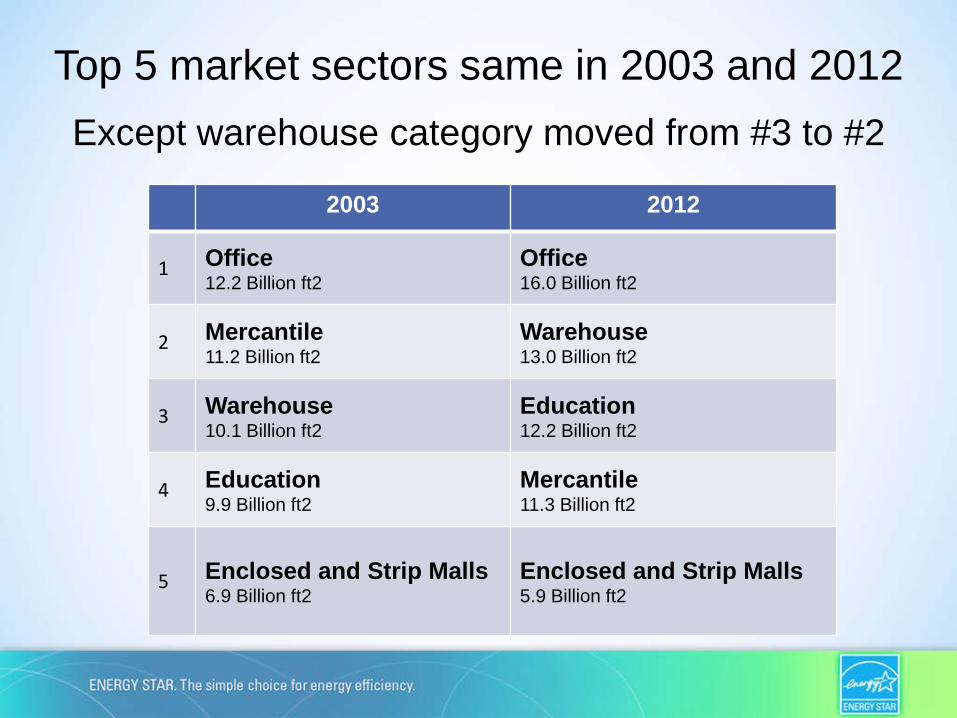
Top 5 market sectors same in 2003 and 2012Except warehouse category moved from #3 to #2
2003 2012
1 Office12.2 Billion ft2
Office16.0 Billion ft2
2 Mercantile11.2 Billion ft2
Warehouse13.0 Billion ft2
3 Warehouse10.1 Billion ft2
Education12.2 Billion ft2
4 Education9.9 Billion ft2
Mercantile11.3 Billion ft2
5 Enclosed and Strip Malls6.9 Billion ft2
Enclosed and Strip Malls5.9 Billion ft2

Building sector benchmarking penetration varies in Portfolio Manager
Estimated market penetration by square footage
50% 10%
• Office• School• Retail• In-Patient Healthcare
• Lodging• Public Order and Safety• Warehouse
• Public assembly• Religious Worship• Malls• Foodservice
100%

Benchmarking growing in building sectors without ENERGY STAR scores
Top 5 Estimated Increases in property types without ENERGY STAR scores (2013-2016)
Food Service Mailing Center/ Post Office
College/ University
Mixed Use Property
Fire Station

Factors impacting market penetration
Drivers• ENERGY STAR scores• Service Providers• Education and awareness:
• Trade associations• Training• ENERGY STAR partner
• Sustainability goals and reporting
• Building ownership when the building is the business
Barriers• No ENERGY STAR scores• Building ownership:
• Split incentives• Tenant engagement• Access to energy data• Diffuse ownership
• Limited education and awareness
• Smaller buildings and class B/C office
Exceptions: Warehouse, religious worship, lodging Exceptions: Fire and police stations

Building Size

5.6 million commercial buildings in the U.SAverage Size= 15,700 square feet
Smallest 50% account for 9.2% of floor area
Largest 0.8% account for 20.4% of floor area

~50% of national floorspace has been benchmarked across 9% of buildings
Percentage of buildings
benchmarked
Percentage of square footage
benchmarked
< 100,000 SFbuildings
100,000–250,000 SFbuildings
250,000-500,000 SFbuildings 500,000+ SF
buildings

19
Percentage of buildings
certified
Percentage of square
footage certified
< 100,000 SFbuildings
100,000–250,000 SFbuildings
250,000+ SFbuildings
500,000+ SFbuildings
Represents percentages of ENERGY STAR certified buildings in the top 30 U.S. markets. Percentages are, on average, similar in the 20 smallest markets.
Certified buildings by floor area

Geographic distribution

Top benchmarking and certification metro areas (totals)
0 5000 10000 15000
New York-Newark-…Seattle-Tacoma-…
Los Angeles-Long…Washington-Arlington-…
Chicago-Naperville-…San Francisco-Oakland-…
Boston-Cambridge-…Philadelphia-Camden-…
Houston-The…Minneapolis-St. Paul-…
Active Benchmarks0 500 1000 1500 2000
Los Angeles-Long Beach-…
Washington-Arlington-…
New York-Newark-Jersey…
Dallas-Fort Worth-…
San Francisco-Oakland-…
Chicago-Naperville-Elgin…
Atlanta-Sandy Springs-…
Houston-The Woodlands-…
Boston-Cambridge-…
Denver-Aurora-Lakewood…
Cumulative Certifications

22
Growth in benchmarking occurring in smaller jurisdictions
22

0%
5%
10%
15%
20%
25%
30%
35%
40%
45%
50%
0%
10%
20%
30%
40%
50%
60%
Gro
wth
in S
quar
e Fo
otag
e
Gro
wth
in B
uild
ings
%Growth (Buildings) % Growth (Square Footage)
Top 10 Metro Areas by Percent growth in benchmarking (2014-2015)
Growth in benchmarking occurring in smaller jurisdictions

Service and Product Provider Activity

Service and Product Providers contributed over 80% of benchmarking volume and over 70% of
certification volume in the first half of 2017

Benchmarking through web services is significantly outpacing manual entry

Increase entrants to benchmarking and drive action
• Turn data into information and knowledge:
–Spend less time on gathering data
• More time for energy management and improvement

Recognition and Improvement

Johnson Controls Energy Efficiency Indicator Survey 2017 indicates that benchmarking and certification
drive investment and improvement

Certification continues to grow overall and for recertification

Property types with biggest opportunities for certification growth
• These five property types have the most benchmarked properties that are eligible for certification but are not yet certified (28,000 properties combined)
Office
K-12 School
Retail Store
Multifamily Housing
Bank Branch
Biggest Certification Growth Potential What is the value of certification?
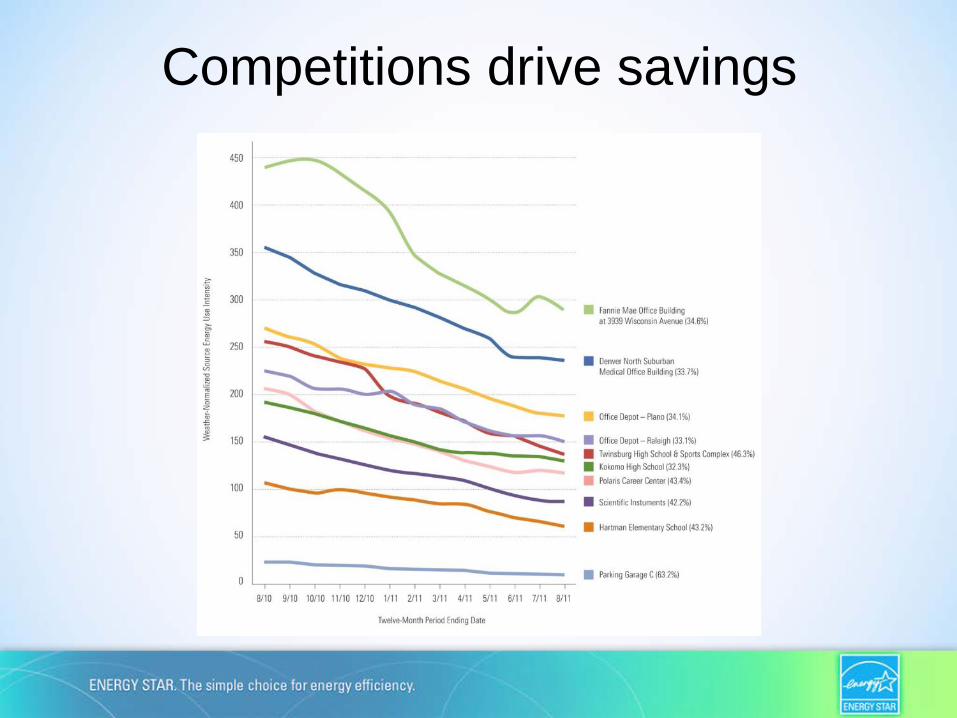
Competitions drive savings

10% improvement within 5 years

Where did ENERGY STAR certified buildings start benchmarking?
0%
3%
6%
9%
12%
15%
18%
Perc
ent o
f Bui
ldin
gs
Starting Score
34% of buildings reported starting scores below 75

1
Worst PerformersBest Performers
Num
ber
of B
uild
ings
25507590 10
121.129.9 165.786.0 339.4EPA Performance Rating
&Energy Intensity
(kBtu/ft2-year)
The buildings we most need to reach are the ones farthest from any possibility of recognition.

What do the trends tell us?• Good market penetration in benchmarking
– 50% of the floor space still remains- smaller and hard to reach
• Some building sectors have deep penetration– Barriers remain in other sectors
• Local and state policies driving action, especially in larger jurisdictions
– Action is growing in smaller jurisdictions• Service providers driving benchmarking
– Can deliver benefits to customers through certification and awareness
• Improvement in building efficiency occurring– Much more opportunity exists

Next steps for EPA
• Reach additional sectors through tailored resources addressing business barriers
• Reach smaller buildings and organizations through our partner network
• Evaluate building-specific improvement recognition with low administration cost that doesn’t conflict with ENERGY STAR certification

Opportunities for our partnership Communities engage Businesses mentor School districts lead by example Association chapters and NGOs
educate Utilities provide programs and
data access Product/service providers offer
solutions
Use ENERGY STAR to tap into immediate brand recognition and consistency
……to realize savings for businesses and organizations, grow the local economy, create jobs and improve environmental quality.