Embed Size (px)
Citation preview

Energy Sector Maggie & Tyler
SIM SECTOR PRESENTATION Fall 2013
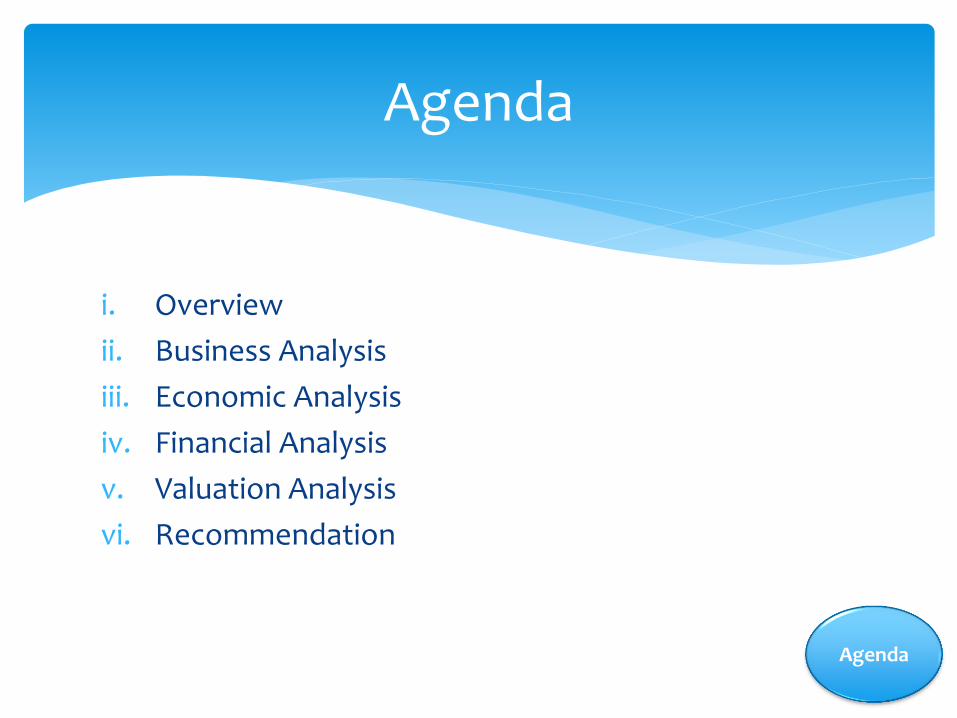
i. Overview
ii. Business Analysis
iii. Economic Analysis
iv. Financial Analysis
v. Valuation Analysis
vi. Recommendation
Agenda
Agenda

SECTOR OVERVIEW
SIM SECTOR PRESENTATION Fall 2013

S&P 500, SIM Portfolio Comparison
Overview
S&P 500 - 10.49% SIM - 14.39%
390 basis points
Overweight

Energy Sector vs S&P 500 YTD
*Thomas Baseline Overview
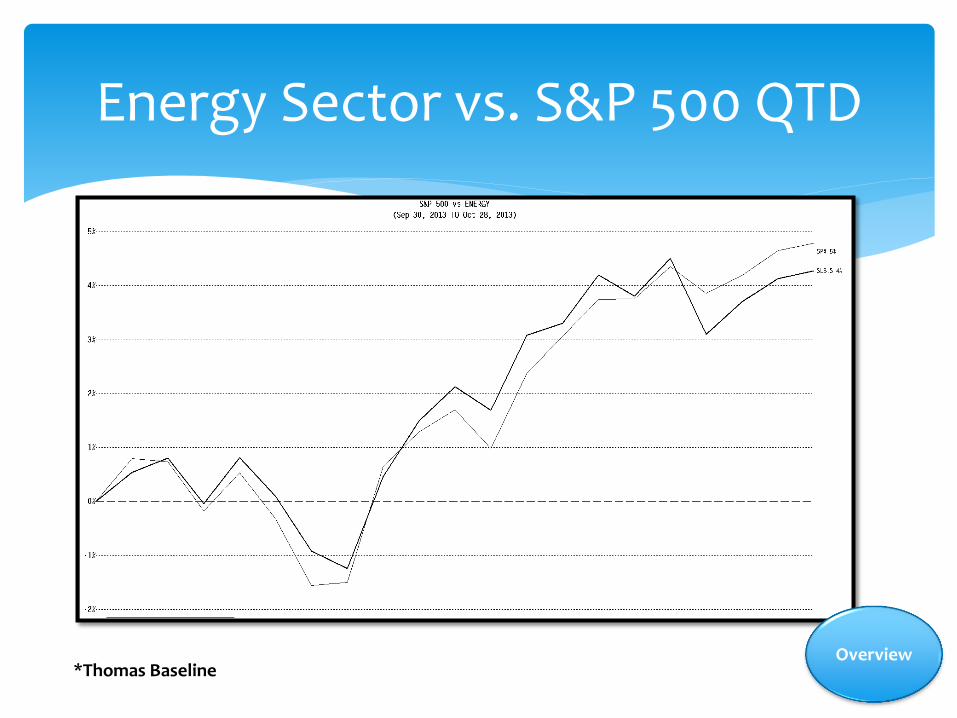
Energy Sector vs. S&P 500 QTD
Overview *Thomas Baseline
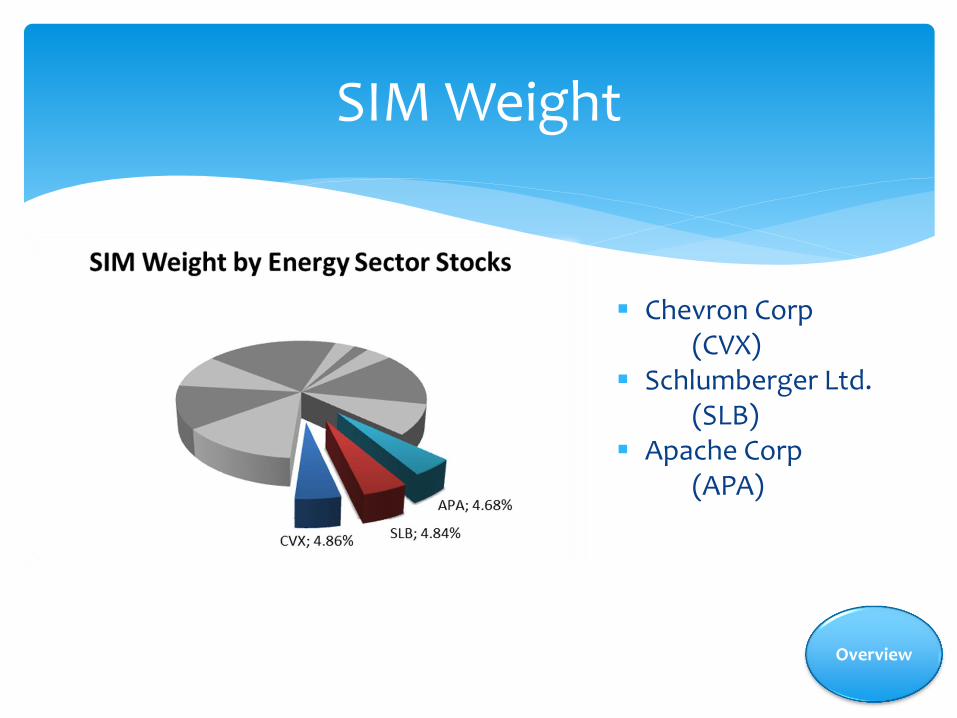
Chevron Corp (CVX) Schlumberger Ltd. (SLB) Apache Corp (APA)
SIM Weight
Overview

Stocks in SIM Portfolio YTD
Overview
Schlumberger – Up 27% Chevron – Up 7% Apache –Up 6%

Largest Firms within Energy Sector
Overview

Largest Energy Firms in S&P500 by MarketCap
Overview

• Integrated Oil & Gas
• Oil & Gas Drilling
• Oil & Gas Exploration and Production
• Oil & Gas Equipment and Services
• Oil & Gas Storage
• Coal & Consumed Fuels
• Oil & Gas Refining and Marketing
Industries
Overview

Industries YTD
Overview
Top Performers: Oil &Gas Refining, Exploration/Production, Equipment/Services Bottom Performers: Coal & Consumed Fuels, Oil & Gas Integrated

BUSINESS ANALYSIS
SIM SECTOR PRESENTATION Fall 2013

Phases of the Business Cycle
Business Analysis
Capital Goods & Basic
Materials
Energy& Consumer
Staples
Utilities
Financials & Consumer Cyclicals
Technology
Middle Expansion*
Late Expansion**
Early Contraction
Late Contraction
Early Expansion

Oil Producers in 2012 (By millions of barrels per day)
I. Saudi Arabia – 11.73
II. United States – 11.12
III. Russia – 10.40
IV. China – 4.42
V. Canada – 3.87
VI. Iran – 3.59
VII. United Arab Emirates – 3.21
World Production
Business Analysis *According to U.S. Energy Information Administration 2012 (eia)
U.S. Projected to be world’s top oil producer by the end of 2013
according to PIRA (12.1 million barrels a day)
Business Analysis
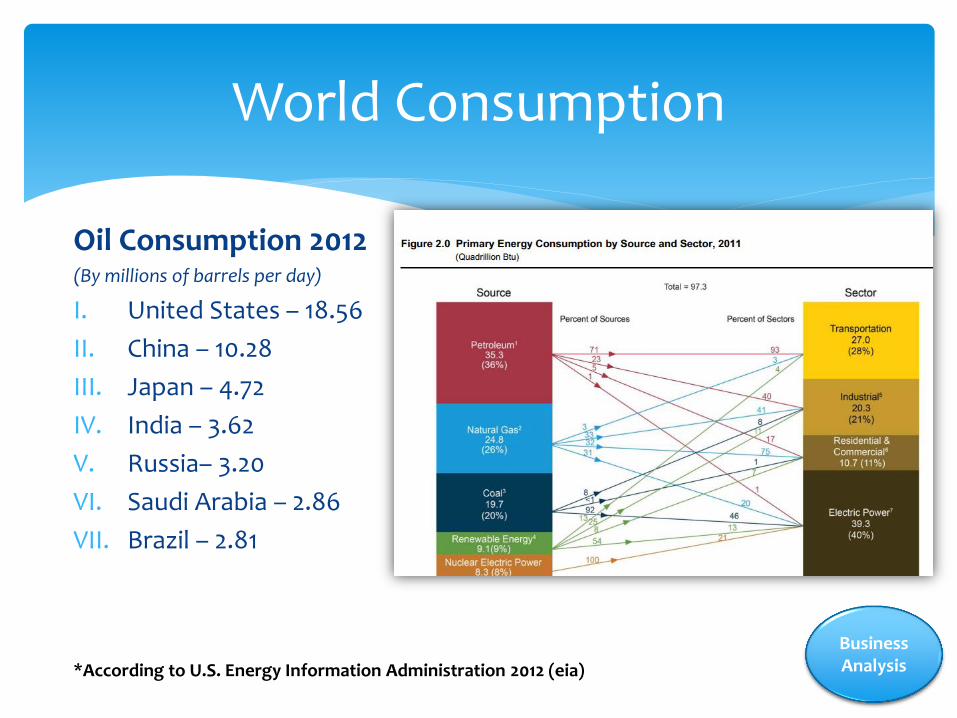
Oil Consumption 2012 (By millions of barrels per day)
I. United States – 18.56
II. China – 10.28
III. Japan – 4.72
IV. India – 3.62
V. Russia– 3.20
VI. Saudi Arabia – 2.86
VII. Brazil – 2.81
World Consumption
Business Analysis *According to U.S. Energy Information Administration 2012 (eia)
Business Analysis
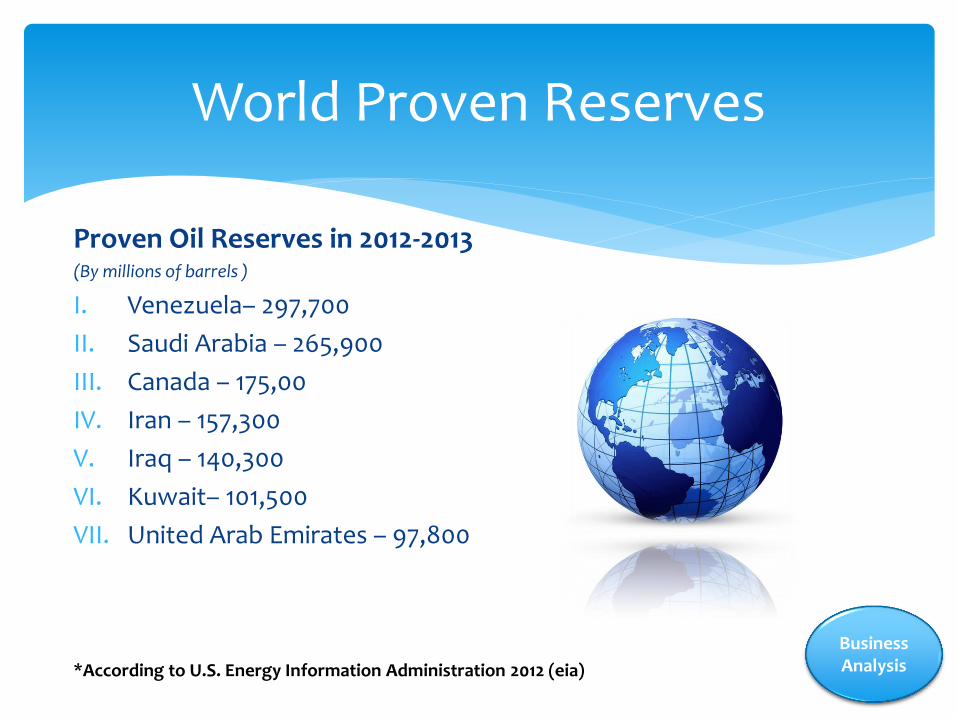
Proven Oil Reserves in 2012-2013 (By millions of barrels )
I. Venezuela– 297,700
II. Saudi Arabia – 265,900
III. Canada – 175,00
IV. Iran – 157,300
V. Iraq – 140,300
VI. Kuwait– 101,500
VII. United Arab Emirates – 97,800
World Proven Reserves
Business Analysis *According to U.S. Energy Information Administration 2012 (eia)

Industrialization in Emerging Countries
Business Analysis
I. Significant increase in Operating Usage
II. Tendency to see rapid demand growth for Energy during this stage
III. Driving Global Use steadily higher
Demand
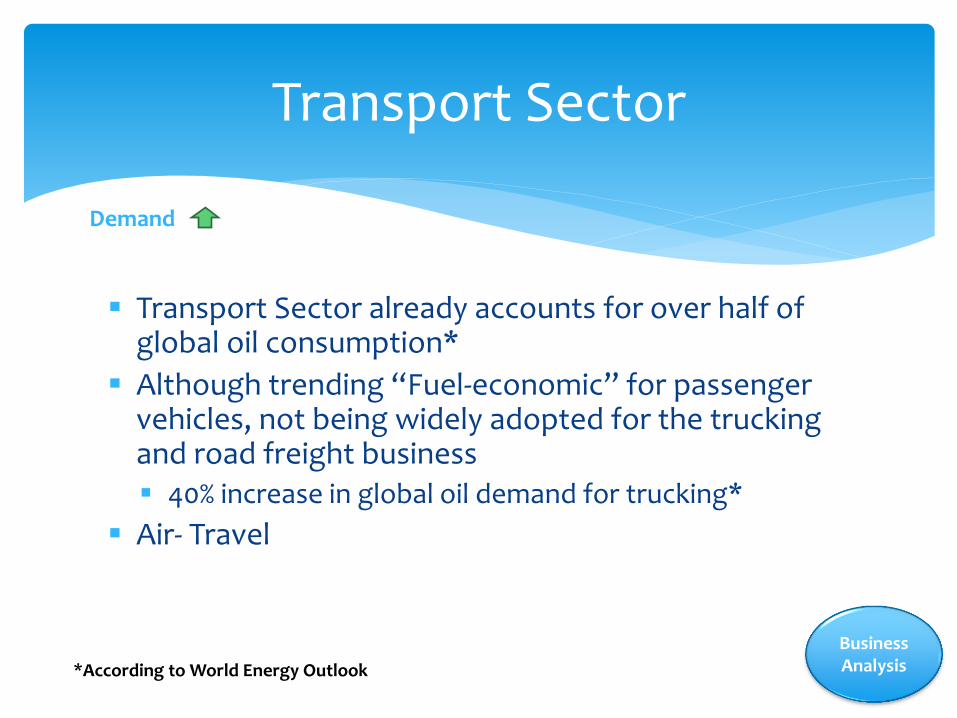
Transport Sector already accounts for over half of global oil consumption*
Although trending “Fuel-economic” for passenger vehicles, not being widely adopted for the trucking and road freight business 40% increase in global oil demand for trucking*
Air- Travel
Transport Sector
Business Analysis *According to World Energy Outlook
Demand

U.S. Shale Drilling • Natural Gas
• Predicted by the year 2035, 46% of the U.S. natural gas supply will come from Shale Drilling*
New Capacity additions in Supply
Business Analysis *According to the EIA
Supply

12 Current Members Algeria
Angola
Ecuador
Iran
Iraq
Kuwait
Libya
Nigeria
Qatar
Saudi Arabia
United Arab Emirates
Venezuela
OPEC
Business Analysis
Dedicated to ensure the stabilization of oil markets to: 1. Secure an efficient, economic and regular supply of
petroleum to consumers 2. Steady income to producers 3. A fair Return on capital for those investing in the
petroleum industry

OPEC

Porter’s Five Forces
Rivalry Amongst
Firms
Barriers to Entry/Exit
Power of Suppliers
Substitutes
Power of Buyers
Business Analysis

Five Forces - Barriers
Business Analysis
Barriers to Entry Extraordinary Start-Up Costs
Economies of Scale take time to be realized
Potential Entrants - Low

Five Forces - Suppliers
Business Analysis
Bargaining Power of Suppliers Many firms are vertically
integrated, not a factor
Exploration and production industry, high costs for purchasing
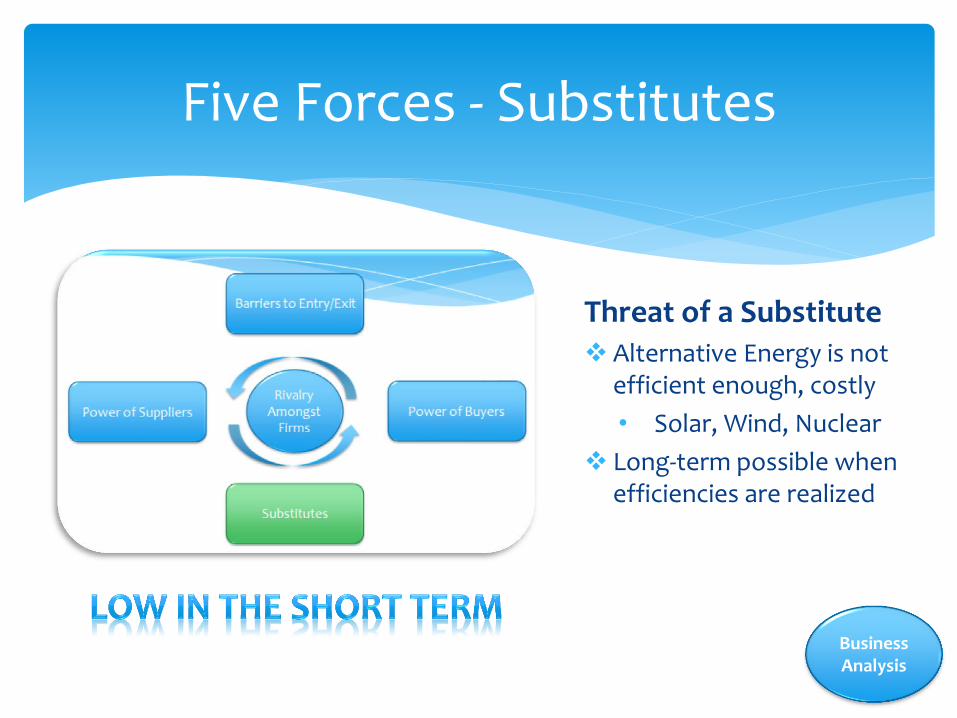
Five Forces - Substitutes
Business Analysis
Threat of a Substitute Alternative Energy is not
efficient enough, costly
• Solar, Wind, Nuclear
Long-term possible when efficiencies are realized
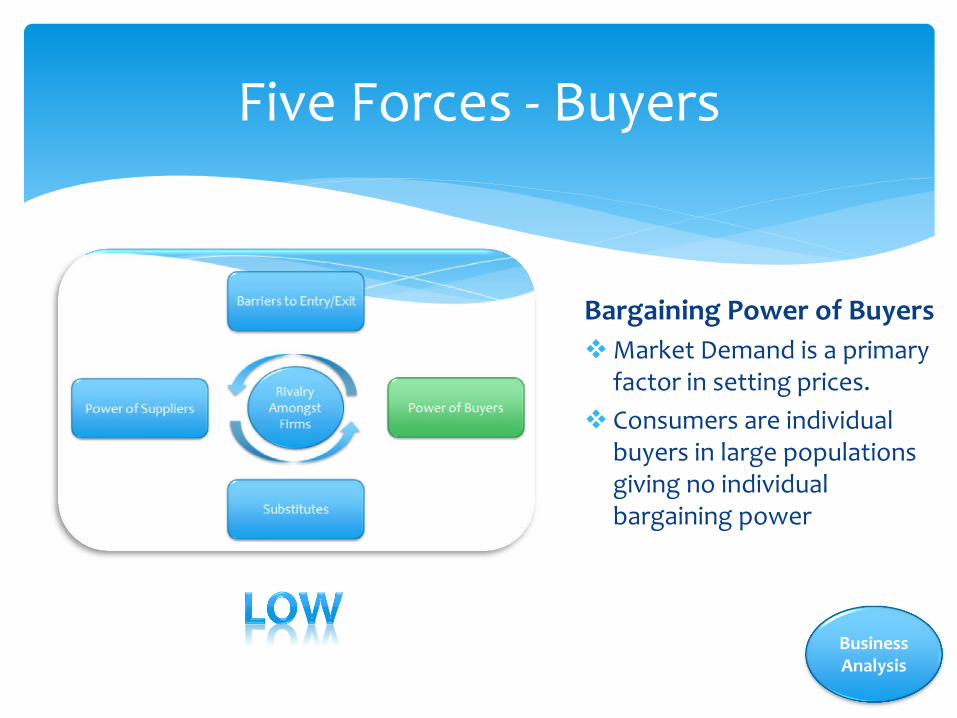
Five Forces - Buyers
Bargaining Power of Buyers
Market Demand is a primary factor in setting prices.
Consumers are individual buyers in large populations giving no individual bargaining power
Business Analysis

ECONOMIC ANALYSIS
SIM SECTOR PRESENTATION Fall 2013

Real GDP vs. Energy
Economics
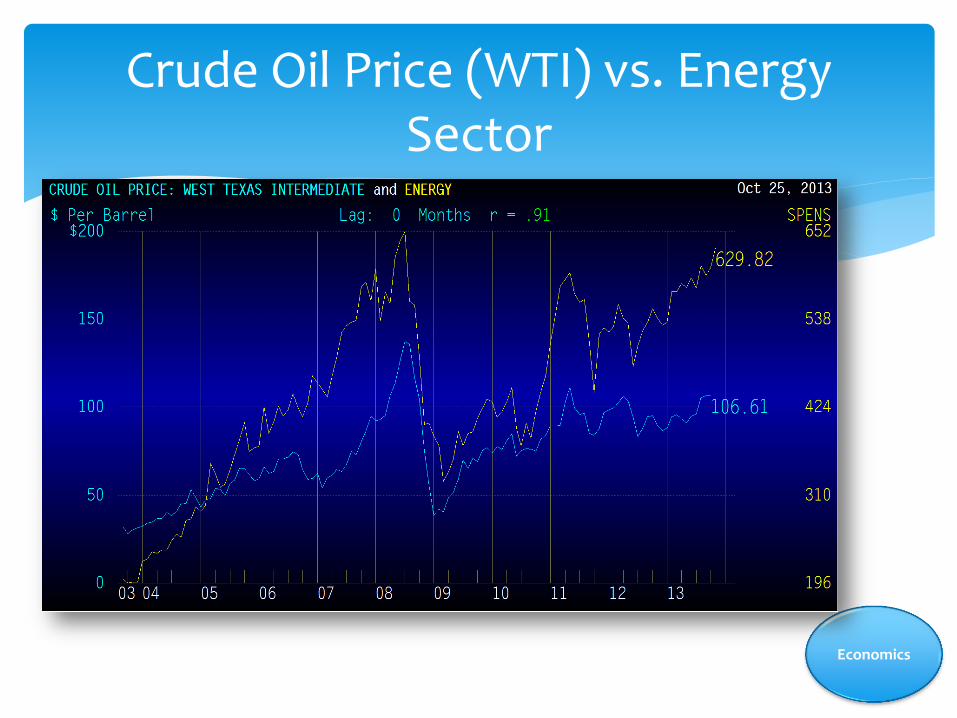
Crude Oil Price (WTI) vs. Energy Sector
Economics

Crude Oil Price (BRENT) vs. Energy Sector
Economics
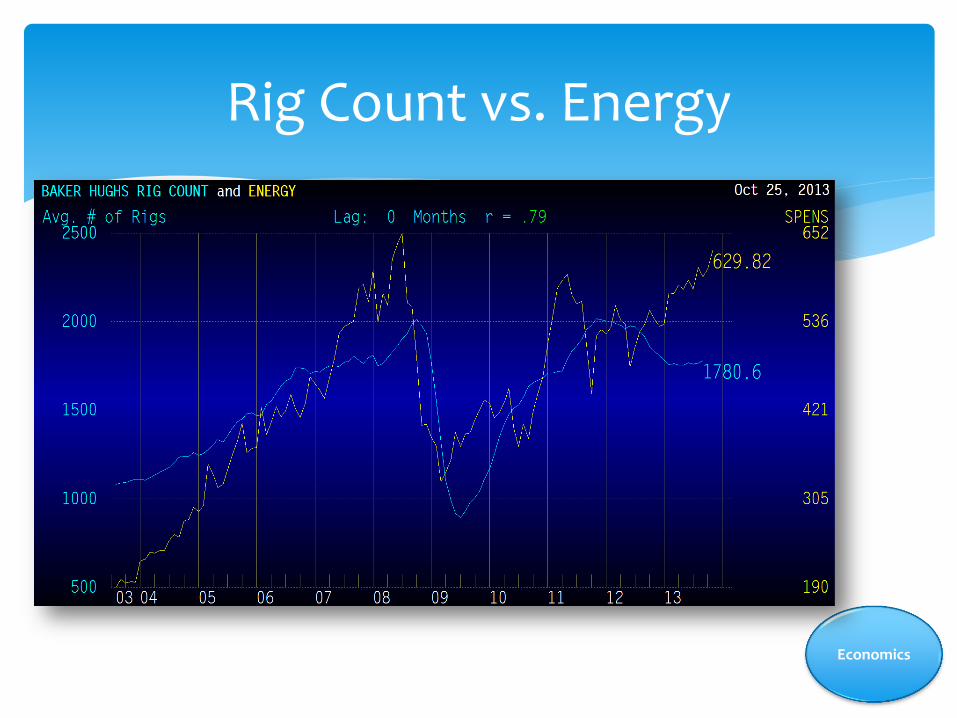
Rig Count vs. Energy
Economics
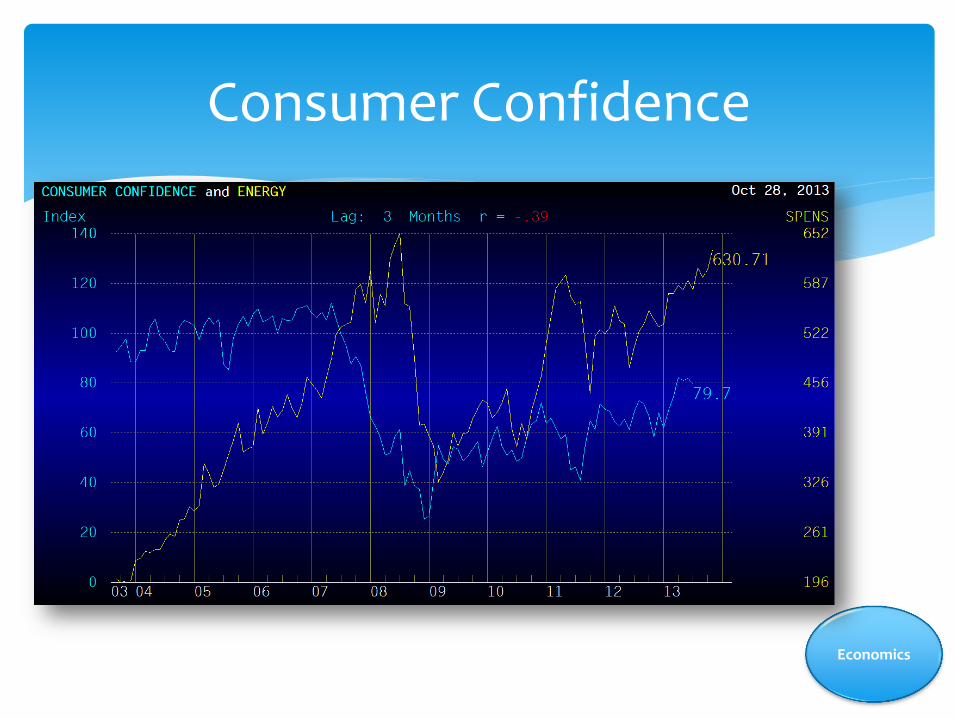
Consumer Confidence
Economics

Worldwide Production vs. Energy
Economics

FINANCIAL ANALYSIS
SIM SECTOR PRESENTATION Fall 2013
28%
9% 9% 25%
-33%
21% 24%
-4% 4% 2%
47%
21%
7% 19%
-57%
55%
37%
-2% -6%
11%
2005 2006 2007 2008 2009 2010 2011 2012 2013 2014
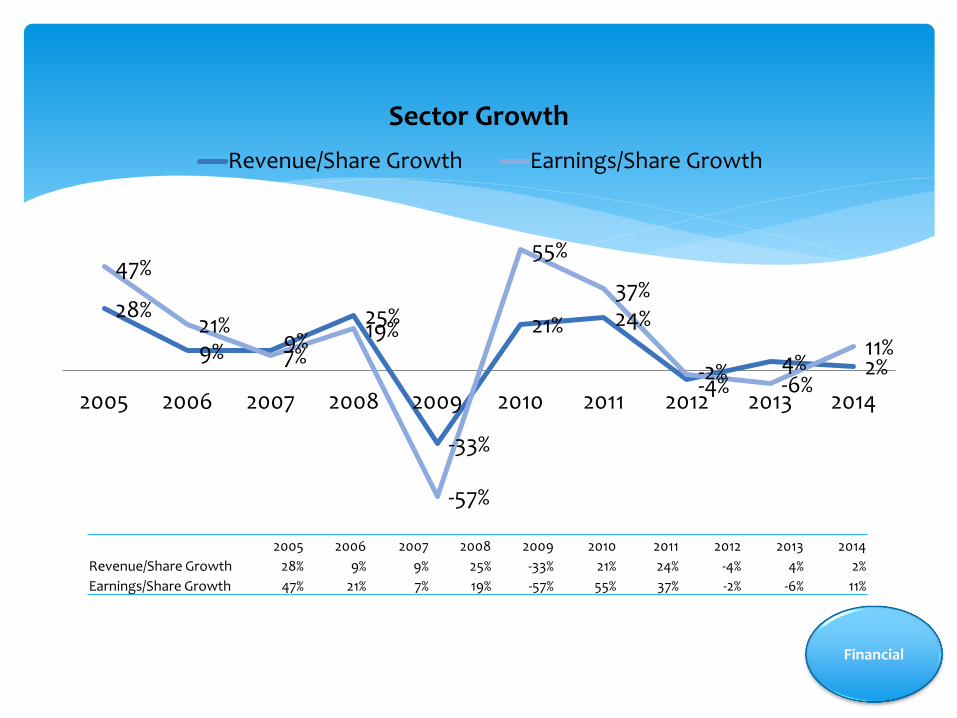
Sector Growth
Revenue/Share Growth Earnings/Share Growth
2005 2006 2007 2008 2009 2010 2011 2012 2013 2014
Revenue/Share Growth 28% 9% 9% 25% -33% 21% 24% -4% 4% 2%
Earnings/Share Growth 47% 21% 7% 19% -57% 55% 37% -2% -6% 11%
Financial
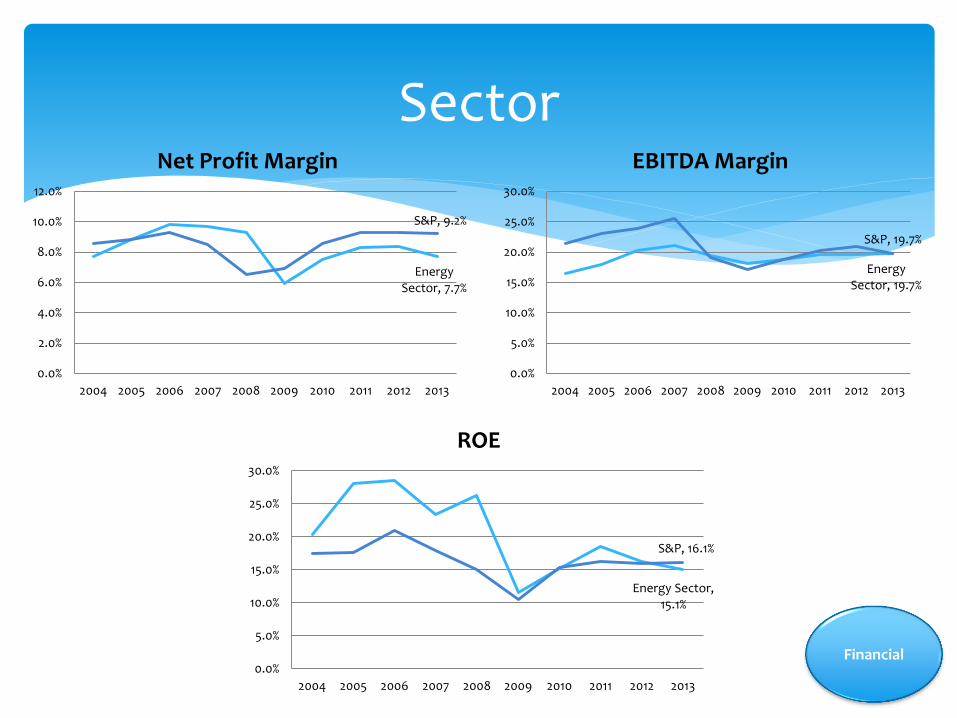
Sector
Energy Sector, 7.7%
S&P, 9.2%
0.0%
2.0%
4.0%
6.0%
8.0%
10.0%
12.0%
2004 2005 2006 2007 2008 2009 2010 2011 2012 2013
Net Profit Margin
Energy Sector, 19.7%
S&P, 19.7%
0.0%
5.0%
10.0%
15.0%
20.0%
25.0%
30.0%
2004 2005 2006 2007 2008 2009 2010 2011 2012 2013
EBITDA Margin
Energy Sector, 15.1%
S&P, 16.1%
0.0%
5.0%
10.0%
15.0%
20.0%
25.0%
30.0%
2004 2005 2006 2007 2008 2009 2010 2011 2012 2013
ROE
Financial

Industries
Oil & Gas – Integrated
Major Companies
Chevron, Exxon Mobil, Hess Corp
-80%
-60%
-40%
-20%
0%
20%
40%
60%
80%
OGINT
Revenue/Share Growth
Earnings/Share Growth
2005 2006 2007 2008 2009 2010 2011 2012 2013 2014
Revenue/Share Growth 29% 4% 11% 29% -32% 23% 23% -21% 3% 1%
Earnings/Share Growth 39% 20% 6% 23% -58% 70% 38% -3% -10% 5%
Financial
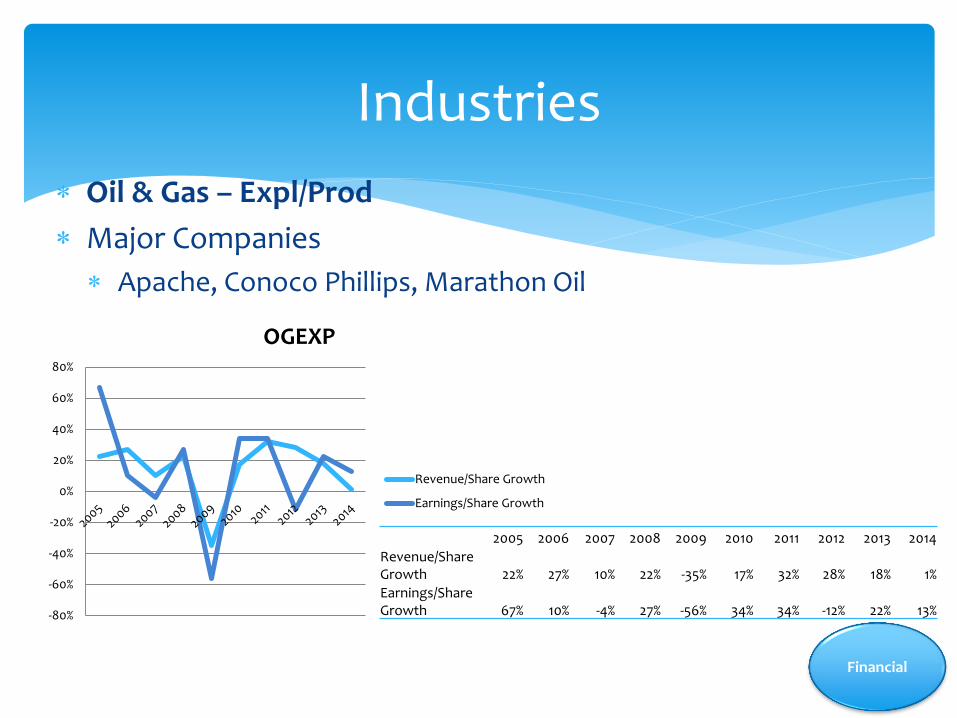
Industries
Oil & Gas – Expl/Prod
Major Companies
Apache, Conoco Phillips, Marathon Oil
-80%
-60%
-40%
-20%
0%
20%
40%
60%
80%
OGEXP
Revenue/Share Growth
Earnings/Share Growth
2005 2006 2007 2008 2009 2010 2011 2012 2013 2014
Revenue/Share Growth 22% 27% 10% 22% -35% 17% 32% 28% 18% 1%
Earnings/Share Growth 67% 10% -4% 27% -56% 34% 34% -12% 22% 13%
Financial

Industries
Oil & Gas – Equip/Svc
Major Companies
Schlumberger, Baker Hughes, Cameron Int’l
-60%
-40%
-20%
0%
20%
40%
60%
80%
OGEQP
Revenue/Share Growth
Earnings/Share Growth
2005 2006 2007 2008 2009 2010 2011 2012 2013 2014
Revenue/Share Growth 8% 28% 10% 21% -19% 7% 28% 15% 10% 11%
Earnings/Share Growth 71% 55% 35% 15% -47% 17% 42% 4% 5% 26%
Financial

Industries
Coal & Consumable Fuels
Major Companies
Consol Energy, Peabody Energy
-100%
-50%
0%
50%
100%
150%
200%
250%
300%
COCOF
Revenue/Share Growth
Earnings/Share Growth
2005 2006 2007 2008 2009 2010 2011 2012 2013 2014
Revenue/Share Growth 37% -6% -7% 32% -4% 2% 22% -12% -30% 11%
Earnings/Share Growth 147% 50% -29% 84% -33% 4% 36% -62% -82% 271%
Financial

Industries
Oil & Gas – Drilling
Major Companies
Diamond Offshore Drl, Ensco Plc
-100%
-50%
0%
50%
100%
150%
200%
OGDRL
Revenue/Share Growth
Earnings/Share Growth
2005 2006 2007 2008 2009 2010 2011 2012 2013 2014
Revenue/Share Growth 25% 43% 33% 35% -3% 9% -5% 4% -3% 14%
Earnings/Share Growth 181% 89% 83% 34% -44% -39% 6% 25% 8% 27%
Financial

Industries
Oil & Gas – Refining/Marketing
Major Companies
Marathon Petroleum, Phillips 66, Tesoro
-200%
-100%
0%
100%
200%
300%
400%
OGREF
Revenue/ShareGrowth
Earnings/ShareGrowth
2005 2006 2007 2008 2009 2010 2011 2012 2013 2014
Revenue/Share Growth 88% 19% 19% 30% -43% 18% 24% 8% 5% 0%
Earnings/Share Growth 194% 24% -9% -35% -112% 351% 174% 71% -30% 19%
Financial

Industries
Oil & Gas – Storage
Major Companies
Kinder Morgan Holdco, Spectra Energy
-500%
0%
500%
1000%
1500%
2000%
2500%
OGSTO
Revenue/ShareGrowth
Earnings/ShareGrowth
2005 2006 2007 2008 2009 2010 2011 2012 2013 2014
Revenue/Share Growth -5% 42% -38% 15% -24% 9% 6% 15% 11% 16%
Earnings/Share Growth 2046% 18% 26% 24% -35% 13% 13% -22% 2% 33%
Financial

VALUATION ANALYSIS
SIM SECTOR PRESENTATION Fall 2013

Sector
0
5
10
15
20
P/Trailing E P/Forward E P/B P/S P/CF
Absolute Basis
High Low Median Current
0
0.2
0.4
0.6
0.8
1
1.2
1.4
1.6
P/Trailing E P/Forward E P/B P/S P/CF
Relative to S&P 500
High Low Median Current
Absolute Basis High Low Median Current
P/Trailing E 18.7 6.1 12.3 13.1
P/Forward E 16.9 7.8 11.8 12.5
P/B 3.8 1.4 2.4 1.9
P/S 1.4 0.5 1.0 1.0
P/CF 9.4 5.0 7.1 7.3
Relative to SP500 High Low Median Current
P/Trailing E 1.1 0.53 0.78 0.84
P/Forward E 1.2 0.57 0.82 0.86
P/B 1.4 0.7 1.0 0.8
P/S 1.0 0.6 0.7 0.7
P/CF 0.9 0.6 0.7 0.7
Valuation
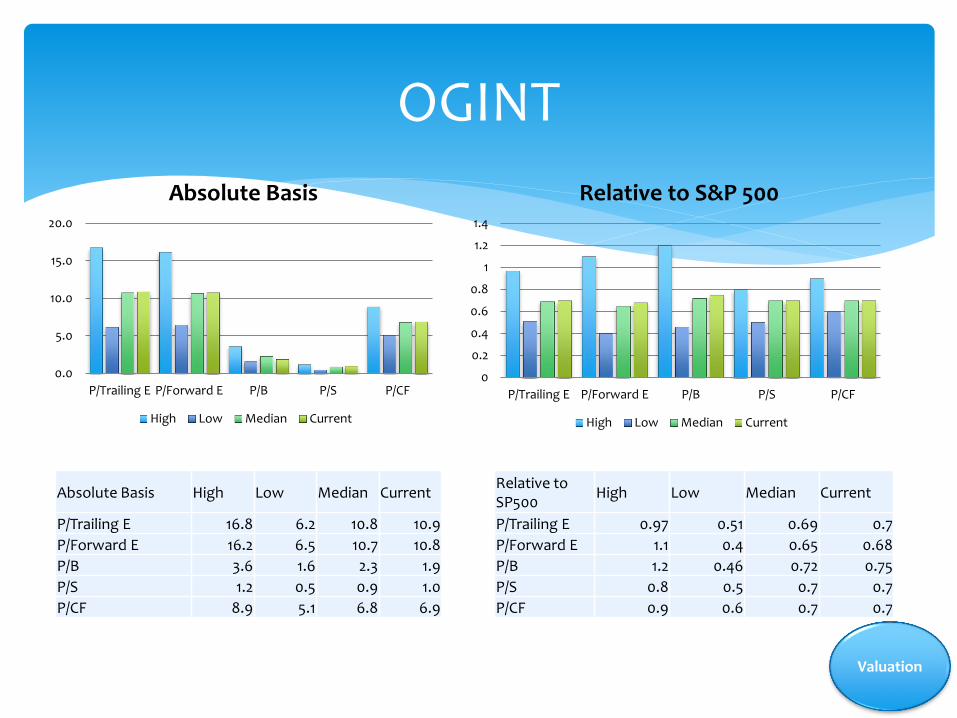
OGINT
0.0
5.0
10.0
15.0
20.0
P/Trailing E P/Forward E P/B P/S P/CF
Absolute Basis
High Low Median Current
0
0.2
0.4
0.6
0.8
1
1.2
1.4
P/Trailing E P/Forward E P/B P/S P/CF
Relative to S&P 500
High Low Median Current
Absolute Basis High Low Median Current
P/Trailing E 16.8 6.2 10.8 10.9
P/Forward E 16.2 6.5 10.7 10.8
P/B 3.6 1.6 2.3 1.9
P/S 1.2 0.5 0.9 1.0
P/CF 8.9 5.1 6.8 6.9
Relative to SP500
High Low Median Current
P/Trailing E 0.97 0.51 0.69 0.7
P/Forward E 1.1 0.4 0.65 0.68
P/B 1.2 0.46 0.72 0.75
P/S 0.8 0.5 0.7 0.7
P/CF 0.9 0.6 0.7 0.7
Valuation
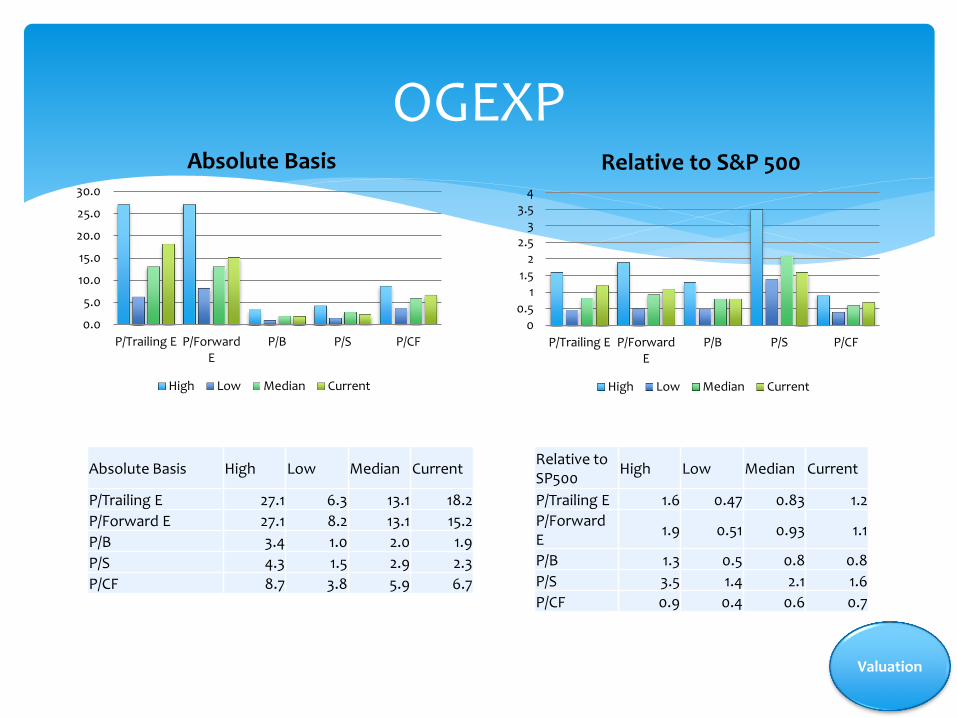
OGEXP
0.0
5.0
10.0
15.0
20.0
25.0
30.0
P/Trailing E P/ForwardE
P/B P/S P/CF
Absolute Basis
High Low Median Current
0
0.51
1.5
2
2.5
33.5
4
P/Trailing E P/ForwardE
P/B P/S P/CF
Relative to S&P 500
High Low Median Current
Absolute Basis High Low Median Current
P/Trailing E 27.1 6.3 13.1 18.2
P/Forward E 27.1 8.2 13.1 15.2
P/B 3.4 1.0 2.0 1.9
P/S 4.3 1.5 2.9 2.3
P/CF 8.7 3.8 5.9 6.7
Relative to SP500
High Low Median Current
P/Trailing E 1.6 0.47 0.83 1.2
P/Forward E
1.9 0.51 0.93 1.1
P/B 1.3 0.5 0.8 0.8
P/S 3.5 1.4 2.1 1.6
P/CF 0.9 0.4 0.6 0.7
Valuation

OGEQP
0.0
10.0
20.0
30.0
40.0
50.0
P/Trailing E P/Forward E P/B P/S P/CF
Absolute Basis
High Low Median Current
0
0.5
1
1.5
2
2.5
3
P/Trailing E P/Forward E P/B P/S P/CF
Relative to S&P 500
High Low Median Current
Absolute Basis High Low Median Current
P/Trailing E 39.5 6.5 20.6 20.2
P/Forward E 28.9 7.8 18.1 16.4
P/B 8.6 1.6 3.6 2.6
P/S 3.0 1.0 2.0 2.0
P/CF 17.5 5.6 12.3 12.3
Relative to SP500
High Low Median Current
P/Trailing E 1.9 0.58 1.3 1.2
P/Forward E 1.7 0.61 1.2 1.1
P/B 2.8 0.9 1.5 1.1
P/S 2.8 1.0 1.6 1.3
P/CF 1.7 0.8 1.3 1.1
Valuation
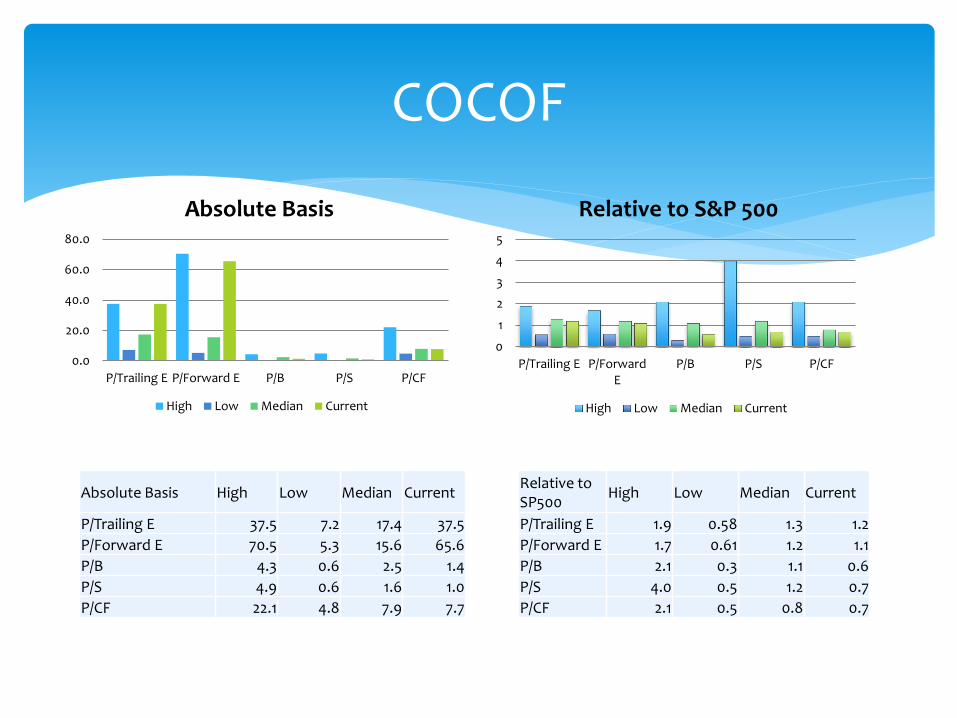
COCOF
0
1
2
3
4
5
P/Trailing E P/ForwardE
P/B P/S P/CF
Relative to S&P 500
High Low Median Current
0.0
20.0
40.0
60.0
80.0
P/Trailing E P/Forward E P/B P/S P/CF
Absolute Basis
High Low Median Current
Absolute Basis High Low Median Current
P/Trailing E 37.5 7.2 17.4 37.5
P/Forward E 70.5 5.3 15.6 65.6
P/B 4.3 0.6 2.5 1.4
P/S 4.9 0.6 1.6 1.0
P/CF 22.1 4.8 7.9 7.7
Relative to SP500
High Low Median Current
P/Trailing E 1.9 0.58 1.3 1.2
P/Forward E 1.7 0.61 1.2 1.1
P/B 2.1 0.3 1.1 0.6
P/S 4.0 0.5 1.2 0.7
P/CF 2.1 0.5 0.8 0.7

OGDRL
Absolute Basis High Low Median Current
P/Trailing E 65.0 3.3 15.1 12.6
P/Forward E 38.3 3.7 11.3 11.1
P/B 4.1 0.8 1.7 1.2
P/S 6.6 1.1 2.6 2.0
P/CF 20.1 3.0 8.0 6.5
Relative to SP500
High Low Median Current
P/Trailing E 3.7 0.28 0.99 0.77
P/Forward E 2.1 0.28 0.83 0.73
P/B 1.7 0.5 0.7 0.5
P/S 4.3 1.2 2.0 1.3
P/CF 1.8 0.4 0.8 0.6
0.0
20.0
40.0
60.0
80.0
P/Trailing E P/Forward E P/B P/S P/CF
Absolute Basis
High Low Median Current
0
1
2
3
4
5
P/Trailing E P/Forward E P/B P/S P/CF
Relative to S&P 500
High Low Median Current
Valuation
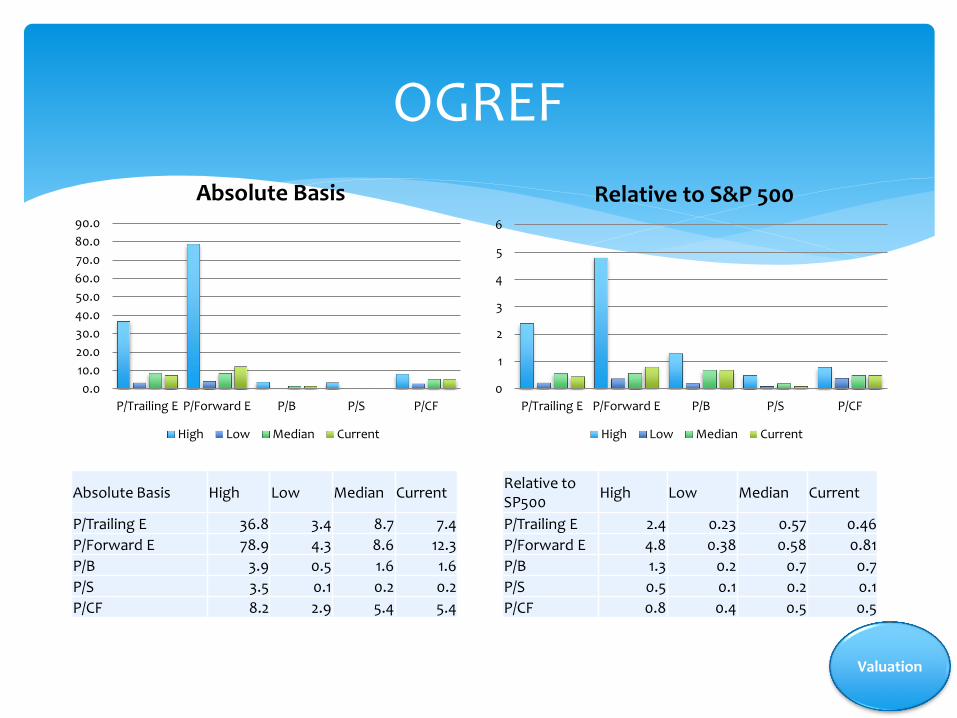
OGREF
0.0
10.0
20.0
30.0
40.0
50.0
60.0
70.0
80.0
90.0
P/Trailing E P/Forward E P/B P/S P/CF
Absolute Basis
High Low Median Current
0
1
2
3
4
5
6
P/Trailing E P/Forward E P/B P/S P/CF
Relative to S&P 500
High Low Median Current
Absolute Basis High Low Median Current
P/Trailing E 36.8 3.4 8.7 7.4
P/Forward E 78.9 4.3 8.6 12.3
P/B 3.9 0.5 1.6 1.6
P/S 3.5 0.1 0.2 0.2
P/CF 8.2 2.9 5.4 5.4
Relative to SP500
High Low Median Current
P/Trailing E 2.4 0.23 0.57 0.46
P/Forward E 4.8 0.38 0.58 0.81
P/B 1.3 0.2 0.7 0.7
P/S 0.5 0.1 0.2 0.1
P/CF 0.8 0.4 0.5 0.5
Valuation

OGSTO
0.0
50.0
100.0
150.0
200.0
250.0
300.0
350.0
400.0
450.0
P/Trailing E P/Forward E P/B P/S P/CF
Absolute Basis
High Low Median Current
0
5
10
15
20
25
P/Trailing E P/Forward E P/B P/S P/CF
Relative to S&P 500
High Low Median Current
Absolute Basis High Low Median Current
P/Trailing E 396.0 5.9 20.9 38.5
P/Forward E 32.5 8.5 17.6 26.8
P/B 3.6 0.9 2.8 3.5
P/S 3.2 0.6 1.7 2.8
P/CF 16.1 3.7 8.3 15.8
Relative to SP500 High Low Median Current
P/Trailing E 22 0.52 1.4 2.3
P/Forward E 2.1 0.69 1.2 1.8
P/B 1.5 0.6 1.1 1.4
P/S 2.6 0.4 1.4 1.9
P/CF 1.6 0.5 0.9 1.5
Valuation
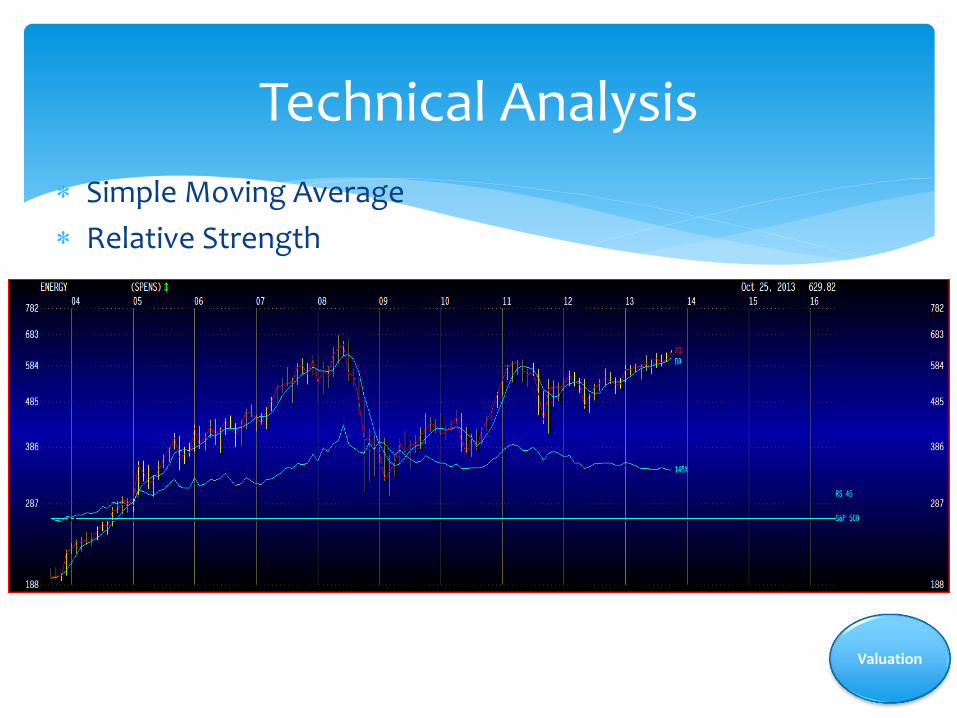
Technical Analysis
Simple Moving Average
Relative Strength
Valuation

RECOMMENDATION
SIM SECTOR PRESENTATION Fall 2013
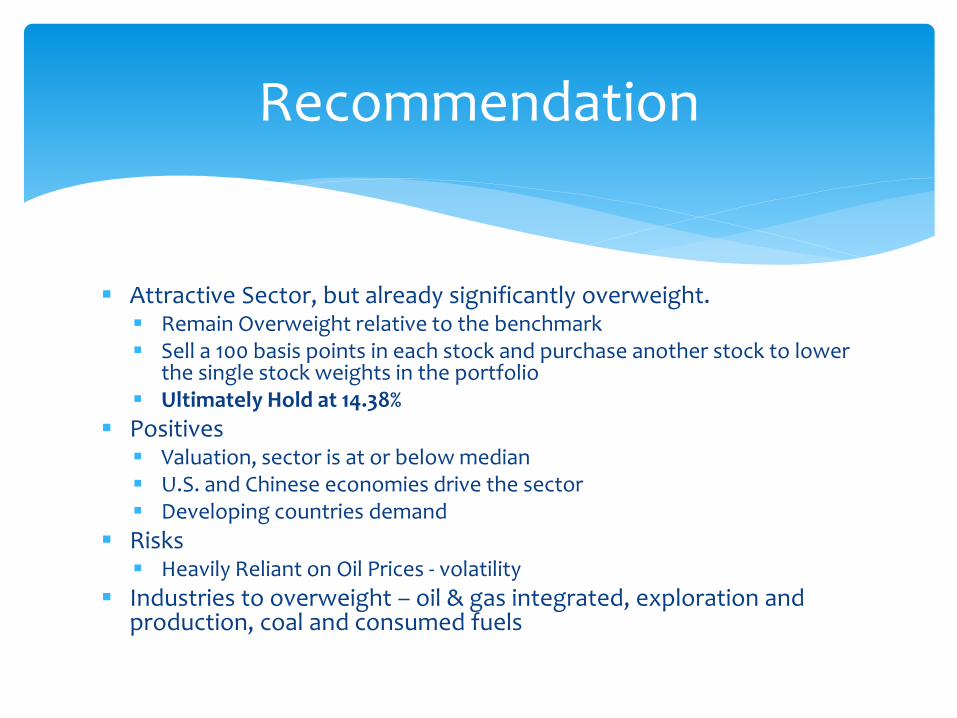
Attractive Sector, but already significantly overweight. Remain Overweight relative to the benchmark Sell a 100 basis points in each stock and purchase another stock to lower
the single stock weights in the portfolio Ultimately Hold at 14.38%
Positives Valuation, sector is at or below median U.S. and Chinese economies drive the sector Developing countries demand
Risks Heavily Reliant on Oil Prices - volatility
Industries to overweight – oil & gas integrated, exploration and production, coal and consumed fuels
Recommendation

Questions?
SIM SECTOR PRESENTATION Fall 2013

www.opec.org
us.spindices.com
www.eia.gov
www.worldenergyoutlook.org
www.oecd.org
Bloomberg Terminal
Thomas Reuters Baseline
References