Embed Size (px)
Citation preview

Energy Sector Report 2015 1
ENERGYREGULATIONBOARD
Energy Sector Report 2015

Energy Regulation Board
Energy Sector Report 20152
Energy Regulation Board
Energy Sector Report 2015 i
VISIONA proactive, firm and fair energy regulator
MISSION STATEMENTTo regulate the energy sector in order to ensure efficient provision of reliable and
quality energy services and products
THEMEPromoting a sustainable energy mix by facilitating investment in renewable and clean energy

Energy Regulation Board
Energy Sector Report 2015ii
Editorial Team
Alfred M. Mwila Director - Economic Regulation
Simweemba Buumba Senior Manager - Research and Pricing
Fred Hang’andu Senior Manager - Consumer and Public Affairs
Wallace Chitungu Senior Manager - Legal Counsel
Rodgers K. Muyangwa Manager - Economic Regulation, Electricity
Lungowe Lutangu Manager - Economic Regulation, Fossil Fuels
Besa Chimbaka Economic Analyst – Electricity
Benny Bwalya Kangwa Financial Analyst – Electricity
Zephania Mwanza Financial Analyst - Fossil Fuels
Mundu Mwila Economic Analyst - Fossil Fuels
Namakando Mukelabai Statistician
Cletus Sikwanda Economist – Research
Nelson Banda Engineer - Renewable Energy
Chibulu Musonda Consumer Affairs Officer
Simon Chanda Licensing Officer
Energy Regulation Board
Energy Sector Report 2015 iii
Table of Contents
EDITORIAL TEAM.................................................................................................................................... ii
ABBREVIATIONS ..................................................................................................................................viii
UNITS OF MEASUREMENT .................................................................................................................... ix
ACKNOWLEDGEMENTS ......................................................................................................................... x
FOREWORD ........................................................................................................................................... xi
1.0 INTRODUCTION .........................................................................................................................1
2.0 ELECTRICITY SUB-SECTOR ........................................................................................................3
2.1 National installed electricity generation capacity ............................................... 3
2.2 Total electricity generation .............................................................................. 4
2.3 Generation from large hydro power plants - ZESCO .......................................... 4
2.4 Generation from small and mini hydro power plants – ZESCO ........................... 5
2.5 Generation from diesel power plants - ZESCO .................................................. 6
2.6 Generation from Independent Power Producers ............................................... 7
2.7 ZESCO electricity exports and imports ............................................................. 8
2.8 Electricity consumption by economic sector ..................................................... 8
2.9 Performance of utilities in 2015 ....................................................................... 9
2.9.1 ZESCO ........................................................................................... 9
2.9.2 Copperbelt Energy Corporation Plc ................................................. 10
2.9.3 Ndola Energy Company Limited ..................................................... 11
2.9.4 Kariba North Bank Extension Power Corporation Limited .................. 11
2.9.5 Lunsemfwa Hydro Power Company Limited ..................................... 12
2.9.6 Zengamina Power Limited ............................................................. 12
2.9.7 North Western Energy Corporation Limited ..................................... 12
2.10 Power quality performance ........................................................................... 13
2.11 Operational performance of the electricity network......................................... 13
2.11.1 Disturbances on the ZESCO network .............................................. 13
2.11.2 Disturbances on the Copperbelt Energy Company network ............... 14
2.12 Renewable energy regulatory framework ....................................................... 14
2.12.1 REFiT strategy .............................................................................. 14
2.12.2 REFiT regulatory framework .......................................................... 15
2.12.3 Solar Photovoltaic tariffs ................................................................ 16
2.12.4 Development of draft solar energy product standards ...................... 16
2.13 Investments in the electricity sub-sector ........................................................ 16
2.13.1 Electricity generation projects ........................................................ 16
2.13.2 Electricity transmission and distribution projects .............................. 17
2.14 Planned power generation projects ............................................................... 20
2.14.1 Mambilima and Mumbotuta hydro schemes .................................... 20
2.14.2 Upgrading of Mulungushi power plant ............................................ 20

Energy Regulation Board
Energy Sector Report 2015iv
2.14.3 Muchinga power generation project ............................................... 20
2.14.4 Ndola Energy Company Limited Heavy Fuel Oil power plant ............. 20
2.14.5 Kalungwishi Hydro Power Project ................................................... 20
2.14.6 EMCO Thermal power plant .......................................................... 20
2.14.7 Chavuma and Chanda Falls Hydro Schemes .................................... 21
2.14.8 Consolidated Farming Limited Bagasse power plant ........................ 21
2.15 Facilitating investments in the electricity sub-sector ........................................ 21
2.15.1 Investment endorsements ............................................................. 21
2.15.2 Power purchase agreements .......................................................... 22
2.15.3 Licensing ...................................................................................... 22
2.16 Electricity tariff reviews ................................................................................ 22
2.16.1 ZESCO ......................................................................................... 23
2.16.2 North Western Energy Corporation Limited ..................................... 25
2.16.3 Copperbelt Energy Corporation Plc ................................................. 25
2.17 Other developments .................................................................................... 25
2.17.1 Rural electrification ....................................................................... 26
2.17.2 Scaling solar ................................................................................. 26
2.17.3 Legislative reviews and Multi-Year Tariff Framework ........................ 27
2.17.4 Zambia Distribution Code .............................................................. 27
2.18 Regional Developments - Southern African Power Pool ................................... 27
2.18.1 SAPP installed capacity .................................................................. 28
2.18.2 SAPP demand and supply .............................................................. 28
2.18.3 SAPP system disturbances ............................................................. 28
2.18.4 SAPP power trading ...................................................................... 29
2.18.5 SAPP transmission projects ............................................................ 30
3.0 PETROLEUM SUB-SECTOR ......................................................................................................32
3.1 Importation of petroleum products................................................................ 32
3.1.1 Importation of petroleum feedstock ................................................. 32
3.1.2 Importation of finished petroleum products ..................................... 33
3.2 Operations at TAZAMA ................................................................................. 34
3.2.1 TAZAMA throughput ...................................................................... 34
3.2.2 Petroleum storage ......................................................................... 34
3.2.3 TAZAMA pipeline rehabilitation works ............................................. 35
3.3 Operations at INDENI Petroleum Refinery Limited .......................................... 36
3.3.1 INDENI throughput ....................................................................... 36
3.3.2 INDENI rehabilitation works ........................................................... 37
3.4 National consumption of petroleum products ................................................. 37
3.5 Daily national consumption ........................................................................... 38

Energy Regulation Board
Energy Sector Report 2015 v
3.5.1 Consumption by province .............................................................. 39
3.5.2 Consumption by economic sector ................................................... 40
3.6 Market share of Oil Marketing Companies ...................................................... 41
3.6.1 Market share of white petroleum products ...................................... 41
3.6.2 Market share for Jet A-1 ................................................................ 41
3.6.3 Market share for Lubricants ........................................................... 42
3.7 Pricing of petroleum products ....................................................................... 43
3.7.1 Determinants of petroleum prices .................................................. 43
3.7.2 Trends in international oil prices ..................................................... 43
3.7.3 Trend in the exchange rate ............................................................ 44
3.7.3.1 Trends in international oil prices and exchange rate ......................... 45
3.8 Transport Differentials .................................................................................. 46
3.8.1 Margins review ............................................................................. 47
3.8.2 Strategic Reserve Fund ................................................................. 47
3.8.3 National fuel pump prices .............................................................. 48
3.8.4 Trends in domestic fuel pump prices .............................................. 48
3.8.5 Fuel pump prices in selected African countries ................................. 49
3.8.6 Price support ................................................................................ 50
3.8.7 Development of technical standards ............................................... 50
3.9 Challenges in the petroleum sub-sector ......................................................... 50
3.9.1 Irregular fuel supply ...................................................................... 51
3.9.2 Illegal fuel vending ....................................................................... 51
3.9.3 Contamination of petroleum feedstock ........................................... 51
3.10 Prospects for 2016 ....................................................................................... 52
3.10.1 Low international oil prices ............................................................ 52
3.10.2 Implementation of Fuel Marking Programme ................................... 52
3.10.3 New pricing framework for Jet A-1 using Import Parity Pricing.......... 52

Energy Regulation Board
Energy Sector Report 2015vi
LIST OF FIGURES
Figure 2-1: Installed national generation capacity by technology in 2015 ................................. 3
Figure 2-2: Total generation sent out, 2013 – 2015 ................................................................ 4
Figure 2-3: Generation sent out by large hydro plants owned by ZESCO, 2010 – 2015 ............. 5
Figure 2-4: Generation sent out by small and mini hydro power plants owned by
ZESCO, 2010 - 2015 .......................................................................................... 6
Figure 2-5: Generation sent out by diesel power plants owned by ZESCO, 2010 – 2015 ............ 7
Figure 2-6: Generation sent out by IPPs, 2012-2015 .............................................................. 7
Figure 2-7: ZESCO electricity import and export trends, 2010 – 2015 ...................................... 8
Figure 2-8: SAPP installed capacity by technology in 2015 .................................................... 28
Figure 2-9: SAPP number of system disturbances in 2015 .................................................... 29
Figure 2-10: Sales vs Buy Bids in SAPP in 2015 ................................................................... 29
Figure 2-11: SAPP market clearing prices in 2015 ................................................................ 30
Figure 3-1: Trends in petroleum feedstock imports, 2011-2015 ............................................. 33
Figure 3-2: Trends in imports of finished petroleum products, 2010 - 2015 ............................ 33
Figure 3-3: Petroleum feedstock throughput for TAZAMA Pipeline, 2011 – 2015 ..................... 34
Figure 3-4: Petroleum feedstock processed by INDENI, 2011 – 2015 .................................... 37
Figure 3-5: Trends in national fuel consumption by type, 2010–2015 .................................... 38
Figure 3-6: National petroleum daily average consumption, 2011 – 2015............................... 39
Figure 3-7: Provincial daily average consumption of diesel, petrol and kerosene in 2015 ......... 39
Figure 3-8: Consumption of petroleum products by economic sector in 2015 ......................... 40
Figure 3-9: Market share for white petroleum products in 2014 and 2015 .............................. 41
Figure 3-10 Market share for Jet A-1 in 2014 and 2015 ........................................................ 42
Figure 3-11: Market share for lubricants in 2014 and 2015 ................................................... 42
Figure 3-12: International oil prices in 2015 ........................................................................ 44
Figure 3-13: Interbank exchange rate in 2015 ..................................................................... 45
Figure 3-14: Trends in international oil prices and exchange rate in 2015 .............................. 46
Figure 3-15: Fuel pump price adjustments in 2015 .............................................................. 48
Figure 3-16: Trends in the domestic fuel pump prices, 2000 - 2015 ....................................... 49
Figure 3-17: Regional prices of petrol, diesel and kerosene in US Dollars in 2015 ................... 49

Energy Regulation Board
Energy Sector Report 2015 vii
LIST OF TABLES
Table 2-1: Consumption of electricity by economic sectors in 2014 and 2015 ...............................................9
Table 2-2: Performance of ZESCO on KPIs in 2014 and 2015 ................................................................................ 10
Table 2-3: ZESCO’s compliance ratings ........................................................................................................................ 10
Table 2-4: CEC’s performance, 2013 – 2015 ............................................................................................................... 11
Table 2-5: Solar PV plant size range tariffs .................................................................................................................. 16
Table 2-6: Electricity generation projects ................................................................................................................... 17
Table 2-7: Electricity transmission and distribution projects .............................................................................. 18
Table 2-8: Licences issued in 2014 and 2015 ............................................................................................................. 22
Table 2-9: Approved electricity tariffs .......................................................................................................................... 23
Table 3-1: Construction of petroleum storage depots in 2015 ........................................................................... 35
Table 3-2: TAZAMA pipeline rehabilitation works in 2015 .................................................................................... 35
LIST OF APPENDICES Appendix 1: ZESCO’s KPI framework, October 2014 - December 2016 ........................................................... 53
Appendix 2: Petroleum feedstock imports in 2014 and 2015 ............................................................................. 54
Appendix 3: Wholesale price build-up ........................................................................................................................ 54
Appendix 4: Uniform pump price build-up .............................................................................................................. 55
ADDITIONAL INFORMATION ON THE ZAMBIAN ENERGY SECTORAnnex 1: Zambia’s average electricity tariffs adjustments, 1998 - 2014 .......................................................... 55
Annex 2: SADC average end user electricity tariffs in 2015 ................................................................................. 56
Annex 3: Licensing procedures ...................................................................................................................................... 57
Annex 4: Zambian electrical power system overview ........................................................................................... 58
Annex 5: Petroleum value chain .................................................................................................................................... 59
Annex 6: Energy Regulation Board complaints handling procedure ............................................................... 60
Annex 7: ERB toll free line ................................................................................................................................................. 61
Annex 8: Provincial petroleum retail service station network in 2015 ............................................................. 62
Annex 9: Petrolem retail service station construction license requirements ................................................ 63
Annex 10: List of licenced solar energy dealers in 2015 ........................................................................................ 64

Energy Regulation Board
Energy Sector Report 2015viii
BSA Bulk Supply AgreementCEC Copperbelt Energy Corporation PlcCFL Consolidated Farming LimitedCPM Cost Plus ModelCSO Central Statistical OfficeDAM Day Ahead MarketDZS Draft Zambian StandardsEMCO Emco Energy Zambia Limited ERB Energy Regulation BoardEPC Engineering, Procurement and ConstructionESI Electricity Supply IndustryESIA Environmental Social Impact AssessmentGRZ Government of the Republic of ZambiaHFO Heavy Fuel OilIDC Industrial Development Corporation IPP Independent Power ProducerKNB Kariba North BankKNBEPC Kariba North Bank Extension Power Corporation LimitedKPI Key Performance IndicatorLHPC Lunsemfwa Hydropower Company LimitedLPG Liquefied Petroleum GasMCL Maamba Collieries LimitedMD Maximum DemandMEWD Ministry of Energy and Water DevelopmentMYTF Multi-Year Tariff FrameworkNECL Ndola Energy Company LimitedNFT Ndola Fuel TerminalNWEC North Western Energy Corporation LimitedOMC Oil Marketing CompanyOPEC Organization of the Petroleum Exporting Countries PCP Public Consultation PaperPPA Power Purchase AgreementPQD Power Quality DirectivesPQMS Power Quality Management SystemPSA Power Supply AgreementREA Rural Electrification AuthorityREFiT Renewable Energy Feed-in TariffSADC Southern African Development CommunitySAPP Southern African Power PoolSRF Strategic Reserve Fund UPP Uniform Pump PriceZABS Zambia Bureau of Standards ZEMA Zambia Environmental Management AgencyZESCO ZESCO LimitedZPL Zengamina Power Limited
ABBREVIATIONS

Energy Regulation Board
Energy Sector Report 2015 ix
UNITS OF MEASUREMENT
bbl Barrels of oil (159 litres)GWh Giga-Watt hour (1,000 MWh)K Zambian Kwacha (ZMW)km KilometrekV Kilo VoltkVA Kilo Volt Amperes (1,000 Volt Amps)kW Kilo WattkWh Kilo Watt HourMVA Mega Volt AmperesMW Mega WattMWh Mega Watt Hour (1,000 kWh)MT Metric Tonne (in this document means a mass equivalent to 1,000 kg) m³ Cubic MetersUS$ United States of America Dollar

Energy Regulation Board
Energy Sector Report 2015x
We acknowledge the following organisations that provided data and information that has been used in this report:
§ Bank of Zambia
§ Copperbelt Energy Corporation plc
§ Industrial Development Corporation
§ INDENI Petroleum Refinery Limited
§ Kariba North Bank Extension Power Corporation Limited
§ Lunsemfwa Hydropower Company Limited
§ Maamba Collieries Limited
§ Ministry of Energy and Water Development
§ Ndola Energy Company Limited
§ North Western Energy Corporation Limited
§ Office for Promotion of Private Power Investment
§ Oil Marketing Companies
§ Regional Electricity Regulators Association
§ Road Transport and Safety Agency
§ Rural Electrification Authority
§ Southern African Power Pool
§ TAZAMA Pipelines Limited
§ TAZAMA Petroleum Products Limited
§ Zengamina Power Limited
§ ZESCO Limited
Acknowledgements

Energy Regulation Board
Energy Sector Report 2015 xi
Foreword
It is my pleasure to present the 2015 Energy Sector Report (ESR) on behalf of the Energy Regulation Board (ERB). The ERB is mandated to ensure that there is orderly development in the energy sector, mainly through licensing, setting and approving of prices and tariffs, compliance monitoring and enforcement, as well as dispute resolution.
The ESR highlights the key successes achieved and challenges faced in 2015. In general, the energy sector experienced a number of challenges ranging from inadequate supply of electricity to isolated incidences of fuel shortages. However, despite these challenges, the sector also recorded positive developments in the formulation of the renewable energy policy and regulatory framework; investment in new power generation and transmission lines; enhanced rural electrification; and legislative reviews.
Specifically, in the electricity sub-sector, electricity tariffs were reviewed in an effort to migrate to cost reflectivity. Further, there was the successful development of a
Renewable Energy Feed-in-Tariff (REFiT) strategy and regulatory support mechanisms, through a consultative process with all key stakeholders. The REFiT strategy is envisaged to expand the deployment of renewable energy, by creating a platform for effective processing of licenses and technology-based standardized Power Purchase Agreements (PPAs). To support the strategy, ERB developed regulatory tools which included the following: Model standard PPA; REFiT rules; REFiT Guidelines; Model Grid Connection Agreement; Grid Connection Guidelines; and Model Generation Licence. Further, ERB developed renewable energy feed-in tariffs for solar and small hydro power plants, of up to 20 Mega watts (MW). The development of the REFiT strategy and regulatory tools set the stage for enhanced investment in renewable energy projects in Zambia.
In addition, other achievements in the electricity sub-sector in 2015, included the commissioning of phase one (1) of the Itezhi-Tezhi power plant (120 MW); the construction of a new 14.8 MW Lunzua power plant; and construction of transmission lines. Some of the major transmission lines commissioned in 2015 were: the Pensulo - Kasama 330 kV; and the Pensulo - Chipata 330 kV; meanwhile, there was significant progress made on the Itezhi - Tezhi - Mumbwa - Lusaka West 220 kV transmission line.
During 2015, specifically in July, load shedding intensified following a reduction in electricity generation attributed to poor rainfall experienced during the 2014/2015 rainy season. The poor rainfall consequently resulted in low water levels and negatively impacted on the capacity of the hydro power plants to generate electricity. To remedy the power deficit situation, the ERB approved a number of PPAs that provided for the importation of emergency power. With respect to licencing, 17 new licences were granted, ranging from generation; supply; and solar (manufacturing, supply, installation and maintenance of solar energy systems).
In 2015, there was unprecedented rehabilitation of petroleum feedstock transportation and petroleum storage facilities. Major pumping units and main pumps on the TAZAMA Pipelines infrastructure were replaced with more efficient pumps and associated units. Meanwhile, the Solwezi fuel storage depot was commissioned during the year, while the construction of the Mongu fuel depot had reached 98 percent completion by end of the year. To ensure that the key players in the petroleum value chain remain financially viable, the ERB undertook reviews of transport; dealer and Oil marketing Companies (OMCs)

Energy Regulation Board
Energy Sector Report 2015xii
margins. This resulted in a 37 percent increase in transport margins. Meanwhile, the margins for OMCs and dealers were also reviewed but were not implemented by the end of the year. The ERB reviews petroleum prices each time the fundamentals dictate. During 2015, wholesale and pump prices were reduced in January; following a reduction in international oil prices and a stable exchange rate. However, by mid-year, the situation changed as the prices were increased twice, in May and July. The increase in May and July was mainly on account of the depreciation of the Kwacha against the United States Dollar. To support safety and technical reliability of petroleum products and services during 2015, the ERB reviewed several technical standards and codes. The review included standards for storage and distribution of petroleum products in above-ground bulk installations; above-ground containerized tank installation; rural filling station standards, and many others. In order to prevent fuel adulteration with low grade fuels and other undesirable substances, and dumping of tax-free transit or export fuels, the ERB in 2015 engaged a consulting firm to undertake fuel marking services. This exercise is envisaged to be operationalised beyond 2015.
The petroleum sub-sector had its own challenges. Particularly, in June 2015, the Government was supplied with petroleum feedstock that did not meet the technical specifications. The petroleum feedstock that was supplied threatened the operations of INDENI refinery and consequently led to the shutdown of the refinery and the resultant fuel shortage in the country. Further, the country experienced illegal fuel vending in isolated places. The ERB will remain proactive and responsive by providing a transparent regulatory framework that supports: security of energy supply; investment in infrastructure; competitive functioning of the industry; affordability and access. The ERB will also support the need to diversify energy sources in the country and ensure introduction of renewable energy and entry of independent power producers.
In conclusion, it is my sincere hope that this edition of the ESR will provide useful information to the public on energy statistics and the state of the energy sector in Zambia. The information provided will highlight the achievements and challenges recorded in the energy sector in 2015, and the measures that were taken to remedy the situation.
I wish to express my appreciation for the strategic guidance we have received from our stakeholders and also thank all those who contributed data and information to this edition of the ESR.
Langiwe Hope Lungu (Ms.) Executive Director June 2016

Energy Regulation Board
Energy Sector Report 2015 1
In 2015, like the previous year, global economic and political conditions continued to challenge the energy sector. According to the International Monetary Fund (IMF), the global economy was projected to grow by 3.1 percent in 2015, 0.3 percentage points lower than in 20141. The decline in the economic growth was as a result of the lower commodity prices and tighter external financial conditions particularly in Latin America and oil exporting countries, the slow down in China, and structural bottlenecks, as well as economic distress related to geopolitical factors.
Oil prices declined significantly in 2015, partly due to the shift by the United States of America (USA) to increase its production of oil by employing new techniques such as fracking and the reluctance by the Organization of the Petroleum Exporting Countries (OPEC) members to reduce production. These factors contributed to excess supply on the global market, thereby lowering the price2.
Further, the speculative behaviour on the anticipated interest rates hike by the Federal Reserve Bank (the Fed) of the USA in September, 2015 for the first time since 2006 led to systematic net outflows of capital from emerging markets to the USA, resulting in the strengthening of the US Dollar against other international currencies. These financial outflows led to greater exchange rate pressure in emerging and frontier markets.
In Sub-Saharan Africa (SSA), growth decelerated throughout the first three quarters of 2015 and preliminary estimates showed that the economic growth was projected to decline to 3.6 percent compared to 5.1 percent growth recorded in 2014. This marked one of the slowest growths in six years3. The low commodity prices coupled with a slowdown in China stifled growth. Further, political instability, adverse weather conditions as well as water and electricity shortages undermined growth. The weakening oil and mineral prices propagated a deterioration of the terms of trade of oil-exporting and mineral rich economies. This led to a widening of the fiscal deficit as oil and mineral exports contribute significantly to most government revenues4.
In 2015, according to the World Bank, Zambia faced tough economic challenges like other countries in SSA. The economy was under pressure as external headwinds and domestic pressures intensified. The external challenges included the slower regional and global growth (crucially from China which purchases about 40 percent of copper produced globally) and a strong US dollar that had strengthened considerably against the Kwacha. The economic growth was estimated to decline below 4 percent in 2015 for the first time since 1998, resulting in marginal growth of per capita incomes. The economy witnessed double digit levels of inflation since 2010. Further, the Zambian economy experienced a deterioration in its terms of trade, which resulted in the depreciation of the currency against major international currencies to levels not seen in the recent past.
During the period under review, the electricity sub-sector faced a number of challenges. In particular, there was a substantial shortfall in supply of electricity that was exacerbated by a reduction in hydro electricity generation due to poor rainfall experienced during the period 2014/2015 rainy season. This increased power outages which impacted on all aspects of the economy there by contributing to slower economic growth and higher production costs. In July 2015, ZESCO Limited (ZESCO) increased the extent of load shedding to at least eight (8) hours a day for the majority of its household, commercial and industrial consumers. Further, ZESCO requested the mining industry to reduce its load by 30 percent. This was in order to manage the power deficit of around 560 – 1,000 MW for the period September to December 2015, representing between 21.4 percent and 38.2 percent of peak demand of 2,616 MW. The electricity sub-sector continued to experience the challenge of non-cost reflective tariffs which is a major barrier to power development projects. Further, the energy mix remained predominately hydro dependent (94%) and therefore prone to changes in rainfall patterns and climate change in general.
1 http://www.imf.org/external/pubs/ft/weo/2015/02/wds.worldbank.org/external/default/WDSContentServer/WDSP/IB/2015/12/09/090224b083c3d284/1_0/Ren dered/PDF/Powering0the0Zambian0economy.pdf2 https://www.imf.org/external/pubs/ft/weo/2015/02/pdf/c1.pdf 3 http://www.focus-economics.com/regions/sub-saharan-africa 4 http://www-wds.worldbank.org/external/default/WDSContentServer/WDSP/IB/2015/12/09/090224b083c3d284/1_0/Rendered/PDF/Powering0the0Zambian0econ omy.pdf
1.0 INTRODUCTION
Energy Regulation Board
Energy Sector Report 20152
In order to mitigate the challenges experienced in 2015, the Government tendered for the emergency inland power generation of around 200 MW from thermal power plants utilising Heavy Fuel Oil (HFO), gas and other sources. The Government also facilitated the importation of emergency power from various sources within the region. Further, the Government announced a ban on local manufacturing and importation of incandescent bulbs and inefficient lighting devices in Zambia. The ban would be implemented gradually starting with the importation of such products effective January 2016. The ban on the sale of incandescent bulbs would be effected in June 2016, and it is envisaged that their use will be completely phased out by December 2016.
Consistent with the Southern African Development Community (SADC) Ministers’ declaration to move to cost reflectivity by 31st December 2019, the Government in August 2015 provided a policy direction on the first phase movement of electricity tariffs to cost reflectivity for all customer categories. In an effort to improve the energy generation mix, the ERB developed the Renewable Energy Feed-in Tariff regulatory framework that will support investments in renewable energy. On the other hand, the Government had reached an advanced stage in the development of Renewable Energy Feed-in Tariff strategy and the adoption of the Global Energy Transfer Feed-in Tariff (GETFiT) framework, a cost reflective tariff top-up mechanism. Meanwhile, the Government through the Industrial Development Corporation (IDC) commenced the procurement process for the planned installation of at least 600 MW of solar power plants in order to redress the power deficit challenges. The IDC in 2015 planned to develop two solar power plants of 50 MW each to be awarded to two different developers. Further, a new Lunzua power plant, owned by ZESCO and situated in Northern Province, was constructed and commissioned with a rated capacity of 14.8 MW adding to the existing capacity of 0.75 MW.
In the petroleum sub-sector, demand for petroleum products continued to be met through importation of petroleum feedstock and finished products. In order to further improve security of supply of petroleum products, Government accelerated the construction of fuel storage depots across the country. In particular, the construction of the Solwezi fuel depot was completed and commissioned. On the other hand, construction works for the Mongu fuel depot had reached an advanced stage.
In 2015, international oil prices fell below US$ 40 per barrel5 (/bbl) which was the lowest in six (6) years. Further, during the year, specifically on 10th November 2015, the exchange rate of the Kwacha to the US dollar reached an all-time low of K14.41/US$ on the Bank of Zambia interbank market. The fall in global oil prices created anticipation from the public of a reduction in the domestic wholesale and pump prices of fuel. However, the ERB was unable to effect a price reduction as the profound depreciation of the exchange rate counteracted the potential gains arising from the falling oil prices. With regard to price adjustments, the ERB made three adjustments to the pump price; a reduction in January and increases in May and July 2015.
The report is arranged in three sections as follows: section one is an introduction followed by section two which discusses the key developments and challenges in the electricity sub-sector. Section three focuses on the key developments and challenges in the petroleum sub-sector.
5 In this document, a barrel is a unit of volume equivalent to 159 litres

Energy Regulation Board
Energy Sector Report 2015 3
This section highlights performance and developments in the electricity sub-sector in 2015. It discusses electricity generation, exports, imports, consumption (by economic sector), renewable energy feed-in tariff framework, investments and regional developments.
2.1 National installed electricity generation capacity
The Electricity Supply Industry (ESI) in Zambia was dominated by hydro generation which accounted for 94.1 percent of national installed capacity in 2015 and the balance of 5.9 percent was from diesel6, HFO, and Solar Photovoltaic (PV) generation plants. Hydro generation accounted for 2,269 MW of the total national installed capacity, followed by diesel at 92 MW, whereas HFO accounted for 50 MW and solar PV 0.06 MW. Figure 2-1 shows Zambia’s installed generation capacity by technology in 2015.
Figure 2-1: Installed national generation capacity by technology in 2015
2.0 ELECTRICITY SUB-SECTOR
An ERB engineer conducting an inspection at a ZESCO substation
6 Includes 80 MW CEC stand-by emergency generation capacity
Hydro 94.1%
Heavy Fuel oil 2.1%
Diesel 3.8%
Solar PV 0.0%
Energy Regulation Board
Energy Sector Report 20154
In 2015, the total installed generation capacity increased to 2,411 MW, from 2,396 MW recorded in 2014, representing an increase of 0.6 percent. The increase in generation capacity was attributed to the construction and commissioning of ZESCO’s Lunzua small hydro power plant with a rated capacity of 14.8 MW.
2.2 Total electricity generation
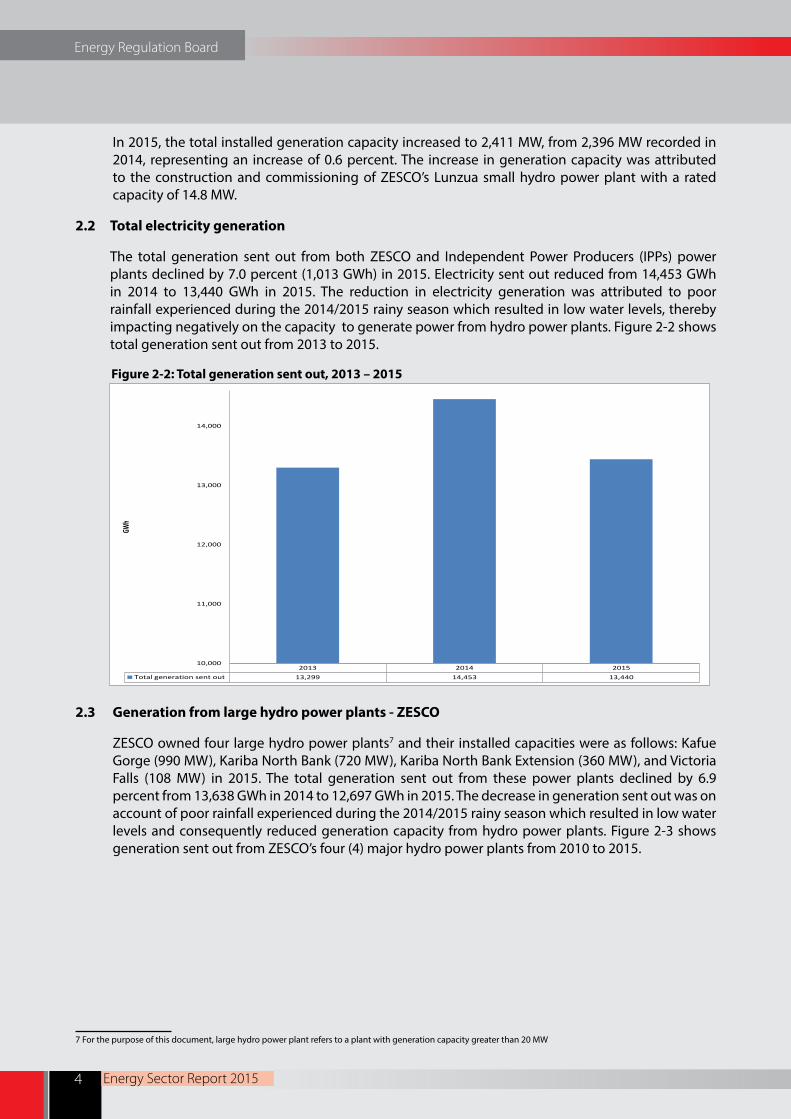
The total generation sent out from both ZESCO and Independent Power Producers (IPPs) power plants declined by 7.0 percent (1,013 GWh) in 2015. Electricity sent out reduced from 14,453 GWh in 2014 to 13,440 GWh in 2015. The reduction in electricity generation was attributed to poor rainfall experienced during the 2014/2015 rainy season which resulted in low water levels, thereby impacting negatively on the capacity to generate power from hydro power plants. Figure 2-2 shows total generation sent out from 2013 to 2015.
Figure 2-2: Total generation sent out, 2013 – 2015
2.3 Generation from large hydro power plants - ZESCO
ZESCO owned four large hydro power plants7 and their installed capacities were as follows: Kafue Gorge (990 MW), Kariba North Bank (720 MW), Kariba North Bank Extension (360 MW), and Victoria Falls (108 MW) in 2015. The total generation sent out from these power plants declined by 6.9 percent from 13,638 GWh in 2014 to 12,697 GWh in 2015. The decrease in generation sent out was on account of poor rainfall experienced during the 2014/2015 rainy season which resulted in low water levels and consequently reduced generation capacity from hydro power plants. Figure 2-3 shows generation sent out from ZESCO’s four (4) major hydro power plants from 2010 to 2015.
7 For the purpose of this document, large hydro power plant refers to a plant with generation capacity greater than 20 MW
2013 2014 2015Total generation sent out 13,299 14,453 13,440
10,000
11,000
12,000
13,000
14,000
GWh

Energy Regulation Board
Energy Sector Report 2015 5
Figure 2-3: Generation sent out by large hydro plants owned by ZESCO, 2010 – 2015
As shown in Figure 2-3, in 2015, Kariba North Bank, Kafue Gorge and Victoria Falls power plants all recorded reduction in generation of 13.7 percent, 3.2 percent and 3.3 percent, respectively. However, Kariba North Bank Extension power plant recorded a marginal increase of 1.5 percent.
2.4 Generation from small and mini hydro power plants – ZESCO
Partial view of a typical mini hydro power plant
-
2,000
4,000
6,000
8,000
10,000
12,000
14,000
Kariba North Kafue Gorge Kariba North BankExtension
Victoria falls Total
2010 2,777 6,841 - 724 10,3422011 3,451 7,183 - 747 11,3812012 3,668 7,376 - 810 11,8542013 4,507 7,463 - 810 12,7802014 4,999 6,666 1,162 811 13,6382015 4,316 6,417 1,179 785 12,697
GWh
Source: ZESCO

Energy Regulation Board
Energy Sector Report 20156
In 2015, ZESCO owned five (5) small and mini hydro power plants with installed capacities as follows: Lusiwasi (12 MW), Chishimba falls (6 MW), Shiwang’andu (1 MW), Musonda falls (5 MW) and Lunzua (14.8 MW) power plants.
Generation sent out from small and mini hydro power plants increased significantly by 13.4 percent, from 107.1 GWh recorded in the previous year to 121.5 GWh in 2015. Figure 2-4 shows generation sent out from small and mini hydro power plants from 2010 to 2015.
Figure 2-4: Generation sent out by small and mini hydro power plants owned by ZESCO, 2010 - 2015
Lunzua recorded the highest increase in generation sent out of 642.9 percent, from 3.5 GWh in 2014 to 26 GWh in 2015. The significant increase in generation sent out for Lunzua was on account of the newly constructed power plant with an installed capacity of 14.8 MW. This was followed by Shiwang’andu which also recorded a significant increase in electricity sent out of 42.9 percent. Lusiwasi and Chishimba also recorded increases of 8.9 percent and 2.1 percent respectively. However, Musonda falls recorded substantial drop in generation sent out of 68.8 percent, from 20.5 GWh in 2014 to 6.4 GWh in 2015. The reduction was attributed to ongoing uprating works that were being carried out on the plant. The plant was only operational during the first four (4) months of 2015.
2.5 Generation from diesel power plants - ZESCO
In 2015, ZESCO owned nine (9) diesel power plants whose installed capacities were: Zambezi (1.8 MW), Kabompo (2.0 MW), Mwinilunga (1.4 MW), Lukulu (0.5 MW), Shang’ombo (1.0 MW), Luangwa (2.6 MW), Mufumbwe (0.8 MW), Chavuma (0.8 MW), and Itezhi-Tezhi (1.0 MW). The total installed capacity for diesel power stations was 11.9 MW in 2015 compared to 11.3 MW in 2014. Figure 2-5 shows generation sent out from diesel plants for the period 2010 to 2015.
-
20.0
40.0
60.0
80.0
100.0
120.0
140.0
Lusiwasi Musonda falls Shiwang'andu Chishimba falls Lunzua Total Generation2010 48.8 18.5 - 22.8 3.3 93.32011 55.9 18.4 - 23.8 3.5 101.62012 57.7 19.4 - 23.5 3.7 104.32013 55.7 21.1 - 22.2 3.8 102.72014 58.7 20.5 0.7 23.7 3.5 107.12015 63.9 6.4 1.0 24.2 26.0 121.5
GWh
Source: ZESCO
Energy Regulation Board
Energy Sector Report 2015 7
-
100.0
200.0
300.0
400.0
500.0
600.0
700.0
Lusemfwa Hydro PowerCompany
Ndola Energy CompanyLimited
Zengamina PowerLimited
Total Generation
2012 392.0 - 1.4 393.42013 398.4 0.03 1.5 400.02014 297.0 393.4 1.8 692.12015 216.5 380.0 1.9 598.4
GWh
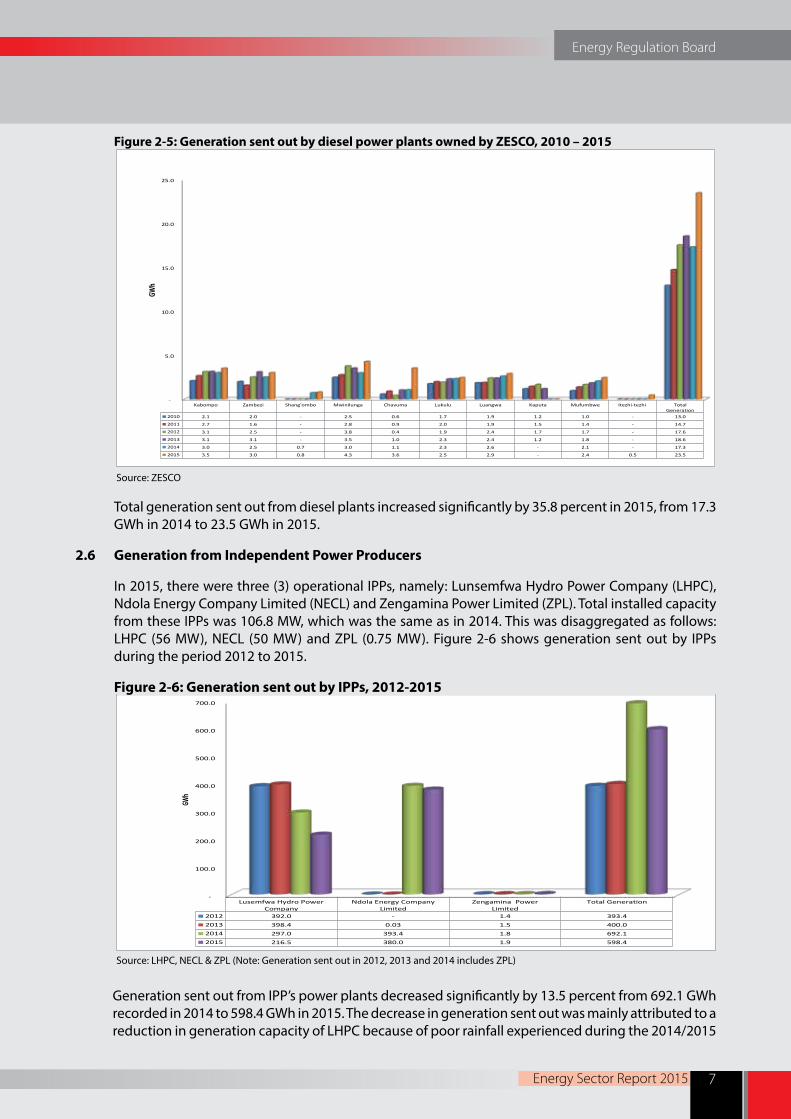
Figure 2-5: Generation sent out by diesel power plants owned by ZESCO, 2010 – 2015
Total generation sent out from diesel plants increased significantly by 35.8 percent in 2015, from 17.3 GWh in 2014 to 23.5 GWh in 2015.
2.6 Generation from Independent Power Producers
In 2015, there were three (3) operational IPPs, namely: Lunsemfwa Hydro Power Company (LHPC), Ndola Energy Company Limited (NECL) and Zengamina Power Limited (ZPL). Total installed capacity from these IPPs was 106.8 MW, which was the same as in 2014. This was disaggregated as follows: LHPC (56 MW), NECL (50 MW) and ZPL (0.75 MW). Figure 2-6 shows generation sent out by IPPs during the period 2012 to 2015.
Figure 2-6: Generation sent out by IPPs, 2012-2015
Generation sent out from IPP’s power plants decreased significantly by 13.5 percent from 692.1 GWh recorded in 2014 to 598.4 GWh in 2015. The decrease in generation sent out was mainly attributed to a reduction in generation capacity of LHPC because of poor rainfall experienced during the 2014/2015
Source: ZESCO
Source: LHPC, NECL & ZPL (Note: Generation sent out in 2012, 2013 and 2014 includes ZPL)
-
5.0
10.0
15.0
20.0
25.0
Kabompo Zambezi Shang'ombo Mwinilunga Chavuma Lukulu Luangwa Kaputa Mufumbwe Itezhi-tezhi TotalGeneration
2010 2.1 2.0 - 2.5 0.6 1.7 1.9 1.2 1.0 - 13.0
2011 2.7 1.6 - 2.8 0.9 2.0 1.9 1.5 1.4 - 14.7
2012 3.1 2.5 - 3.8 0.4 1.9 2.4 1.7 1.7 - 17.6
2013 3.1 3.1 - 3.5 1.0 2.3 2.4 1.2 1.8 - 18.6
2014 3.0 2.5 0.7 3.0 1.1 2.3 2.6 - 2.1 - 17.3
2015 3.5 3.0 0.8 4.3 3.6 2.5 2.9 - 2.4 0.5 23.5
GWh

Energy Regulation Board
Energy Sector Report 20158
rainy season which impacted on its capacity to generate power from its hydro power plants. LHPC’s generation sent out reduced significantly by 27.1 percent, from 297.0 GWh in 2014 to 216.5 GWh in 2015. NECL also recorded a marginal decrease in generation sent out of 3.4 percent, from 393.4 GWh in 2014 to 380 GWh in 2015.
2.7 ZESCO electricity exports and imports
Zambia, through ZESCO, engages in cross border trading of electricity through the Southern African Power Pool (SAPP) and bilateral markets. Figure 2-7 shows ZESCO’s power (electricity) exports and imports for the period 2010-2015.
Figure 2-7: ZESCO electricity import and export trends, 2010 – 2015
In 2015, ZESCO recorded a significant increase in power imports of 6,034.4 percent. Power imports increased from 12.8 GWh in 2014 to 785.2 GWh in 2015. The increase in imports was attributed to the power deficit experienced in 2015 which necessitated emergency power imports. Nevertheless, power exports dropped by 6.4 percent, from 1,256.2 GWh recorded in 2014 to 1,175.9 GWh in 2015.
2.8 Electricity consumption by economic sector
In 2015, national electricity consumption increased by 6.8 percent, from 10,720.5 GWh in 2014 to 11,449.9 GWh in 2015. The increase in consumption was mainly attributed to increased demand from the mining sector. Consumption from the mining sector increased by 6.4 percent, from 5,871.3 GWh recorded in 2014 to 6,245.6 GWh in 2015. This is depicted in Table 2-1.
Source: ZESCO
2010 2011 2012 2013 2014 2015Exports (GWh) 578.0 28.9 976.7 1,083.4 1,256.2 1,175.9Imports (GWh) 12.9 119.7 163.0 72.9 12.8 785.2
-
200.0
400.0
600.0
800.0
1,000.0
1,200.0
1,400.0
GWh

Energy Regulation Board
Energy Sector Report 2015 9
SectorsConsumption
(GWh) Proportion (%)
2014 2015 2014 2015Mining 5,871.3 6,245.6 54.8 54.5Domestic 3,250.8 3,482.0 30.3 30.4Finance & Property 487.4 516.9 4.5 4.5Manufacturing 479.2 530.8 4.5 4.6Agriculture 241.4 260.4 2.3 2.3Others 99.1 98.5 0.9 0.9Trade 107.4 109.8 1.0 1.0Energy & Water 73.2 89.1 0.7 0.8Quarries 62.2 68.2 0.5 0.6Transport 31.3 33.4 0.3 0.3Construction 17.2 15.2 0.2 0.1Total 10,720.5 11,449.9 100.0 100.0
Source: ZESCO
The mining and domestic sectors collectively consumed 84.9 percent of the total energy in 2015. The mining sector consumed the highest energy amongst all sectors at 6,245.6 GWh (54.5%). This was followed by the domestic sector, which includes residential customers at 3,482.0 GWh (30.4%).
2.9 Performance of utilities in 2015
It is the ERB’s mandate to regularly undertake economic and technical audits of the undertakings in the electricity sub-sector. The technical audits relate to safety, environmental concerns, and maintenance of equipment among others. Meanwhile, the economic audits focussed on staff productivity, cash management, and customer metering, among others.
2.9.1 ZESCO
The ERB uses the Key Performance Indicators (KPIs) framework to monitor ZESCO’s performance. The KPI framework is aimed at improving the efficiency of ZESCO’s operations both technically and financially. The KPI framework is an incentive based regulatory tool that is embedded in the tariff determination framework. Therefore, the Utility is penalised and rewarded for poor and good performance respectively. The current KPI framework for ZESCO runs from 2014 to 2016. The details of the framework are shown in Appendix 1. On a quarterly basis, ZESCO is required to submit data and a self-assessed report to the ERB detailing performance against benchmarks agreed in the KPI framework for evaluation.
ZESCO’s performance during the year under review is depicted in Table 2-2. The utility in 2015 attained an overall KPI score of 46.0 percent compared to 40.0 percent in 2014.
Table 2-1: Consumption of electricity by economic sectors in 2014 and 2015

Energy Regulation Board
Energy Sector Report 201510
Table 2-2: Performance of ZESCO on KPIs in 2014 and 2015
No. Indicator Assigned weight 2014 2015
1 Metering Customers 10% 0% 5%
2 Cash Management 20% 2% 0%
3 Staff Productivity 15% 8% 11%
4 Quality of Service Supply 20% 10% 0%
5 System Losses 10% 0% 10%
6 Power Generation 10% 10% 10%
7 Safety 5% 0% 0%
8 Customer Complaints 10% 10% 10%Total 100% 40% 46%
In 2015, ZESCO registered improvements on the following KPIs: customer metering, staff productivity, and system losses. The utility registered a deterioration in cash management, and quality of service while performance remained the same on power generation, safety, and customer complaints KPIs.
Technical performance audits
ZESCO’s infrastructure in all the 10 provinces was audited during the period under review covering a total of 236 sampled facilities. ZESCO’s overall compliance rating stood at 76.0 percent in 2015 compared to 72.9 percent in 2014, indicating an increase of 3.1 percentage points. The compliance ratings for the different facilities are shown in Table 2-3 .
Table 2-3: ZESCO’s compliance ratings
No. Facility Number of
Compliance Rating (% )Facilities Audited
1 Large hydro power stations 3 96.02 Substations greater than 33 kV 69 67.0
3Substations less than or equal to 33 kV 153 53.0
4 Mini hydro plants 4 82.05 Diesel plants 7 79.0
Total 236 76.0*
The improvement in the compliance levels has been attributed in part to the investments by ZESCO in upgrading its distribution infrastructure under the Distribution Expansion and Rehabilitation Project.
2.9.2 Copperbelt Energy Corporation Plc
The Copperbelt Energy Corporation Plc (CEC) is an independent power company listed on the Lusaka Stock Exchange. It is also a member of SAPP. CEC operates and maintains a network mainly comprising generation, transmission and distribution assets that supplies power to Zambia’s mining companies based on the Copperbelt province. CEC also exports power to the Democratic Republic of Congo (DRC). Table 2-4 highlights CEC’s performance during the period 2013 to 2015.
* weighted average

Energy Regulation Board
Energy Sector Report 2015 11
Table 2-4: CEC’s performance, 2013 – 2015
Business element 2013 2014 2015Electricity sales to the mines (GWh) 4,281 4,208 4,092Transmission losses (%) 2.8 2.9 2.9Stand-by generation capacity (MW) 60 80 80Electricity generation (GWh) 0 0 7.17
Source: CEC
In 2015, CEC’s electricity sales to its mining customers reduced to 4,092 GWh down by 2.8 percent from 2014 when sales were 4,208 GWh. Transmission losses remained the same in 2014 and 2015 at 2.9 percent. Further, 7.17 GWh of energy was generated by CEC from its diesel power stations.
Technical performance audits
During the period under review, the audit of CEC infrastructure on the Copperbelt province covered a total of 21sampled facilities. The average compliance level in 2015 was 92.9 percent compared to 95.0 percent recorded in 2014.
Challenges faced
During the period under review, CEC faced two major challenges. Firstly, power supply from ZESCO was reduced by 30 percent on account of insufficient rainfall experienced during the 2014/2015 rainy season, resulting in reduced generation from ZESCO’s hydro power plants. Secondly, CEC reported instances of theft of its overhead copper conductors.
2.9.3 Ndola Energy Company Limited
Ndola Energy Company Limited (NECL) is an IPP that supplies power to its sole customer, ZESCO, under a PPA. The company operates a 50 MW HFO power plant which was commissioned in November 2013.
In 2015, NECL’s electricity sales to ZESCO reduced by 3.4 percent, from 393.39 GWh recorded in 2014 to 379.95 GWh in 2015.
Challenges faced
During the year under review, NECL faced challenges that included grid voltage and frequency fluctuations outside the operating range of the power plant; and the absence of independent fuel test laboratories in the region to test the fuel oil.
2.9.4 Kariba North Bank Extension Power Corporation Limited
Kariba North Bank Power Extension Corporation (KNBEPC) Limited is a wholly owned subsidiary of ZESCO that owns and operates Kariba North Bank Extension Hydropower Plant that has a rated capacity of 360 MW. ZESCO is the off-taker of power from the plant under a PPA. Kariba North Bank Extension Hydropower Plant was commissioned in May 2014. Generation sent out in 2015 increased marginally by 1.5 percent, from 1,162 GWh recorded in 2014 to 1,179 GWh in 2015. In 2015, Kariba North Bank Extension Hydropower plant operated as a peaking plant8 at 14.6 percent capacity factor9 .
8 Peaking Plant typically refers to a power plant that operates in standby mode and only runs when there is a high demand, known as “peak demand”9 Capacity factor: represents the ratio of the average power produced by the power plant over a year to its rated power capacity

Energy Regulation Board
Energy Sector Report 201512
2.9.5 Lunsemfwa Hydro Power Company Limited
Lunsemfwa Hydro Power Company Limited (LHPC) is an IPP that supplies power solely to ZESCO under a PPA. The company owns and operates two hydro power plants namely: Mulungushi and Lunsemfwa with a total installed capacity of 56 MW.
During the period under review, LHPC’s electricity sales to ZESCO reduced significantly by 27.1 percent, from 297.0 GWh recorded in 2014 to 216.5 GWh in 2015. The reduction in sales was attributed to the poor rain fall experienced in 2014/2015 rainy season which led to failure to fill the two (2) reservoirs namely Mita Hills and Mulungushi dams, which only filled to 32.0 percent and 72.5 percent respectively.
Technical performance audits
In 2015, the average compliance level for LHPC infrastructure was 75.6 percentage points compared to 81.2 percent attained in 2014. This represented a 5.6 percent drop in compliance level.
2.9.6 Zengamina Power Limited
Zengamina Power Limited (ZPL) is a private company that owns and operates an off-grid mini hydro power plant which was officially commissioned in July 2007 and has an installed capacity of 0.75 MW. The company has a generation, distribution and supply licence. The company is situated in Ikelenge, North-Western Province and is owned by the North-West Zambia Development Trust (NWZDT). The company generates and supplies power to Ikelenge Mission Hospital, Ikelenge District and surrounding areas.
In 2015, generation sent out from the company increased by 9.2 percent, from 1,759.67 MWh in 2014 to 1,921.62 MWh in 2015. The growth in generation sent out was attributed to the growing demand for electricity. Over the last five years, the company has grown its customer base from 250 in 2010 to 510 in 2015, representing a 104.0 percent increase. Residential customers make up the biggest single category accounting for up to 90 percent of total metered and unmetered customers, followed by standard commercial customers and others.
Technical performance audits
The technical compliance audits conducted in 2015 revealed that the compliance level dropped from 74 percent in 2014 to 56 percent in 2015.
Challenges faced
In 2015, ZPL continued to face several challenges. These included the following: non cost reflective tariffs, low income base of the potential customers, inability by the company to borrow on commercial terms and expand its operations, weak technical protection regime which makes the power plant prone to lightning and loss of equipment during the rainy season, and inability to attract qualified technical staff to operate the plant.
2.9.7 North Western Energy Corporation Limited
North Western Energy Corporation Limited (NWEC) has a license to distribute electricity in the North-Western Province of Zambia. NWEC distributes electricity to non-mining customers in Lumwana (Barrick), Kabitaka and Kalumbila sites. Power is supplied by ZESCO at various substations established by NWEC. Operations commenced at Lumwana in 2010 and in 2015 at Kabitaka and Kalumbila. The supply arrangements at Lumwana are governed by a PPA between ZESCO and NWEC. At Kabitaka and Kalumbila, ZESCO supplies and bills power using the ERB approved ZESCO maximum demand tariffs. Since its inception in 2008, NWEC has connected over 3,000 households to its distribution system.

Energy Regulation Board
Energy Sector Report 2015 13
Technical performance audits
During the period under review, an audit was conducted at NWEC’ s facilities in Lumwana and Kalumbila mine township comprising the Lumwana 2 x 10 MVA, 33/11kV substation and the Kalumbila 1 x 3.5 MVA, 33/11kV substation. The overall compliance levels of the substations increased by 7.0 percentage points from 83.0 percent in 2014 to 90.0 percent in 2015.
Challenges faced
NWEC continued to face the following challenges during the period under review:
a. Lack of local finance to expand the current business operations;
b. Low market penetration and low opportunities for Public Private Partnerships especially with regard to new projects; and
c. Residential customers’ unwillingness to pay for electricity owing to the free electricity supply enjoyed in the past.
2.10 Power quality performance
Power Quality refers to technical parameters used to describe the electricity supplied to consumers. These parameters are used to determine the extent to which the needs of consumers are met in the utilisation of electricity.
In 2015, the ERB monitored 25 sites for power quality on a pilot basis. These were selected out of a total number of 337 sites that are required to be monitored as per Zambian Power Quality standards. Of these 25 sites, the average compliance rate of the power quality standards was 62.0 percent for the period under review. The ERB has provided that all sites must reach a compliance target of 75.0 percent by December 2016. The results from the parameters that were monitored for power quality in the 25 pilot sites revealed that the performance was below the ERB set target.
2.11 Operational performance of the electricity network
During the period under review, the Zambian power system experienced a total of six (6) disturbances which affected most parts of the country, thereby adversely affecting the safety, security and reliability of the system. Of the six (6) disturbances, five (5) occurred on the ZESCO system, while one was on the CEC.
2.11.1 Disturbances on the ZESCO network
In 2015, ZESCO experienced five (5) system disturbances as follows:
a. On 14th August 2015, the power system experienced a disturbance due to an earth fault on the Kabwe - Luano 330 kV Line 1 that was triggered by a bush fire. The fault gave rise to a cascade of tripping due to protection failure on Kabwe - Luano 330 kV Line No. 1;
b. On 2nd September 2015, the system disturbance was due to a busbar fault at Kafue West 330 kV Switching Station triggered by the failure of a blue phase current transformer on the 330 kV reserve busbar side of the bus coupler;
c. On 10th October 2015, the power system failure was due to a busbar fault at Kabwe Stepdown 330/88 kV Substation which was triggered by the failure of an aerial earth guard wire between Leopards Hill Line tower to Luano line 1 tower which

Energy Regulation Board
Energy Sector Report 201514
snapped off on Luano line 1 side and went to rest on the 330 kV reserve busbar. After the busbar fault, the system experienced cascade tripping which resulted into a nationwide power blackout;
d. On 10th December 2015, the system failure was attributed to the tripping of the tie line between Zambia and Zimbabwe. After the tripping of the tie line, the Zambian system experienced low system frequency due to high load on the system as the Zambian system was importing about 560 MW power via the tie line. As a result of loss of power imports, the major power stations could not sustain the internal load and tripped out resulting into a nationwide power blackout; and
e. On 22nd December 2015, the system failure was due to a busbar fault at Leopards Hill 330/132/88 kV Substation. The busbar fault was triggered by the failure of a 330 kV busbar isolator for Kafue Gorge Line 2 during the process of transferring the load from the main busbar to the reserve busbar. After the busbar fault, the system experienced cascade tripping which resulted into a nationwide power blackout.
ZESCO indicated that the delay in the restoration of system was attributed to high voltages on the system.
In order to avert future blackouts, the ERB directed ZESCO to undertake the following measures:
a. The implementation of busbar protection schemes for all major transmission sub-stations;
b. The replacement of circuit breakers (replacement of Air Blast Circuit Breakers with Sulfur hexafluoride (SF6) breakers on the 330 kV system);
c. The offloading of Leopards Hill Substation by constructing alternative substations and transmission lines that do not pass through Leopards Hill Substation; and
d. The installation of compensating equipment on the power system for voltage control.
2.11.2 Disturbances on the Copperbelt Energy Company network
On Monday 27th April 2015, the nation experienced a system disturbance which resulted in a system blackout affecting Lusaka, Central, Copperbelt, North-Western, Luapula, Muchinga, Northern and Eastern provinces and some parts of Southern Province. However, parts of Southern province and Western province including the transmission line which supplies Namibia continued to be on supply from Victoria Falls Power Station.
2.12 Renewable energy regulatory framework
2.12.1 REFiT strategy
During the year under review, the Ministry of Energy and Water Development (MEWD) using a consultative process with all key stakeholders and with the assistance of the United States Agency for International Development (USAID) and the Southern Africa Trade Hub (SATH) developed a Renewable Energy Feed-in Tariff (REFiT) strategy. The REFiT strategy is envisaged to expand the deployment of renewable energy by creating a platform to provide effective processes for licensing and technology-based standardized PPAs in order to increase private sector involvement in power generation with a view to diversifying the energy sector.

Energy Regulation Board
Energy Sector Report 2015 15
Having a dedicated REFiT strategy shall aid the development and expansion of the renewable energy sector in Zambia. A decentralized approach to REFiT allows for alternative ownership and management models and provides an opportunity to empower local entrepreneurs and communities. The REFiT Strategy has the potential to transform the energy sector in profound and tangible ways.
The REFiT strategy is envisaged to be implemented in phases. The first phase shall span a three (3) year period from the time of official launching and will focus on low-cost options. Further, it will also focus on the use of technology specific differentiated tariffs based on the avoided costs of marginal energy supply. The following broad objectives are provided for under the first three (3) year period:
a. To provide for a REFiT generation allocation of initially 200 MW divided into 100 MW hydropower and 100 MW non-hydropower;
b. To provide for a REFiT micro-generation allocation of initially 10 MW; and
c. To provide a platform for the second REFiT phase.
Further, the REFiT strategy provides for ZESCO as the off-taker of power from REFiT projects. Under the renewable energy programme the following technologies are provided for: solar energy; biomass energy/fuel; wind energy; and geothermal energy.
The key stakeholders identified in the strategy are the Department of Energy (DoE); the ERB and ZESCO. DoE will be the custodian of the REFiT programme and developer of the strategy for renewable energy procurement within the context of integrated resource planning. The ERB will create an enabling environment for the REFiT programme through the development of appropriate regulatory instruments. ZESCO is designated as the off-taker and will sign PPAs with qualifying and licensed renewable energy generators from the REFiT programme. ZESCO will also connect licensed renewable energy generators to the transmission and distribution network, consistent with the agreed cost estimates, timelines and standardised grid connection agreements.
2.12.2 REFiT regulatory framework
To support the REFiT strategy, the ERB developed the following regulatory support mechanisms in 2015:
a. REFIT Guidelines: Support Mechanisms and Regulations;
b. REFiT Rules;
c. REFiT Standard Power Purchase Agreements; for REFiT projects;
d. REFiT Generation Licence;
e. REFiT Grid connection Guidelines; and
f. Model Grid Connection Agreement.

Energy Regulation Board
Energy Sector Report 201516
2.12.3 Solar photovoltaic tariffs
The ERB computed indicative cost-reflective tariffs for solar PV projects applicable for Phase 1 of REFiT, as summarized in Table 2-5.
Table 2-5: Solar PV plant size range tariffs
Project size Tariff in US¢/kWh500 kW but less than 1 MW 17.821 MW but less than 5 MW 16.765MW but less than 10 MW 15.7410 MW but less than or equal to 20 MW 14.25
The tariffs set in Table 2-5 are the maximum that will be allowed under the REFiT programme. However, to support price discovery below these maximum tariffs, competitive bidding will be allowed consistent with the agreed REFiT procurement mechanisms and implementation agreements.
2.12.4 Development of draft solar energy product standards
The ERB working in close collaboration with the Zambia Bureau of Standards (ZABS) spearheaded the development of Draft Zambian Standards (DZS) and review of existing standards for solar energy products. The development of the draft standards was made through the Solar PV Technical Committee which reviewed international standards and also undertook extensive local stakeholder consultations. The technical committee commenced the development of the two standards namely:
a. DZS: Solar Photovoltaic (PV) Panels - Specifications.
b. DZS: Static Inverters for Solar Photovoltaic Systems.
Further, the Committee also revised and published the following standards for public comments:
a. DZS 403: Batteries For Use in Photovoltaic Systems – Specification;
b. DZS 404: Charge Controllers for Photovoltaic Systems Using Lead-Acid Batteries – Specification;
c. DZS 405: Photovoltaic Systems Design and Installation – Code of Practice; and
d. DZS 407: Lighting Devices for Use in Photovoltaic Systems – Specification.
2.13 Investments in the electricity sub-sector
2.13.1 Electricity generation projects
During the year under review, ZESCO and other IPPs continued with investments in power generation in order to meet the growing demand for electricity. Table 2-6 shows generation projects under implementation.

Energy Regulation Board
Energy Sector Report 2015 17
Table 2-6: Electricity generation projects
No. Project Name Description/Details/Status
1 Itezhi-Tezhi project (120 MW)
The Itezhi-Tezhi power project was under construction at Itezhi-Tezhi Dam on the Kafue River. The project was being developed through a joint venture between ZESCO and Tata Africa Holdings of India. The first phase of the project was commissioned in 2015. The second phase of the project was expected to be commissioned in 2016.
2 Rehabilitation and uprating of Musonda Falls mini hydro power plant
Musonda Falls is one of ZESCO’s mini hydro power plants, located on the Luongo River in Luapula Province. The power plant had an initial installed capacity of 5 MW. During the period under review, the plant was under rehabilitation to upgrade it to 10 MW. The project is expected to be completed in 2016.
3 Construction of Lunzua power plant
Lunzua hydropower plant is owned by ZESCO and is located in Mbala District, Northern Province. During the year under review, construction of the 14.8 MW Lunzua hydropower plant was completed and commissioned.
4 Development of Kafue Gorge lower hydro power project
Kafue Gorge lower hydro power project will be located in Kafue Gorge, about 65 km upstream of the confluence of the Kafue and the Zambezi Rivers and 9 km downstream of the existing 990 MW Kafue Gorge hydropower plant. Once developed, the power plant will have an installed capacity of 750 MW. The project is estimated to cost US$1.94 billion and will be developed under a Private Public Partnership (PPP) on Build, Own, Operate and Transfer (BOOT) basis with ZESCO. During the period under review, the Engineering, Procurement and Construction (EPC) contractor was procured.
5 Development of Kabompo hydro power project (40 MW)
Kabompo hydropower project is located in Mwinilunga District and was under development by CEC. During the period under review, civil works were underway. The 33/11 kV Kabompo Gorge substation and 33 kV line were partially handed over by the contractor. An implementation agreement was signed with the Government and CEC was in discussion with ZESCO for a PPA.
6 Construction of Maamba Thermal Power Plant (300 MW)
Maamba Collieries Limited is constructing a thermal power plant at Maamba coal mine in Sinazongwe District. The power plant is estimated to cost US$750 million. During the period under review, major construction works were completed and the project was expected to be commissioned in 2016.
2.13.2 Electricity transmission and distribution projects
During the year under review, ZESCO and other undertakings made investments in the transmission and distribution infrastructure in order to increase access to electricity and improve the quality of supply. Table 2-7 shows a summary of the investments in transmission and distribution that were underway during the period under review.

Energy Regulation Board
Energy Sector Report 201518
Table 2-7: Electricity transmission and distribution projects
No. Project Name Description/Details/Status1 Itezhi-Tezhi -
Mumbwa - Lusaka West 220 kV transmission line project
The project involves the construction of a 220 kV transmission line from Itezhi-Tezhi to the substation in Lusaka West. During the period under review, the implementation of the project was in progress. Further, 100 percent of transmission line works were completed while the substation site works were at 60 percent completion.
2 Luangwa 132 kV transmission line project
The project involves the construction of a transmission line to connect Luangwa District to the national grid from Lusaka Leopards Hill sub-station via Chongwe. During the period under review, the project was under implementation.
3 Kafue town – Muzuma - Livingstone 220 kV transmission line upgrade project
The project involves the upgrading of the existing transmission line from 220 kV to 330 kV. During the period under review, all contracts were signed except for Kafue town and Muzuma substations upgrade works.
4 Connection of some towns in North - Western Province to the national grid through a 132kV transmission line
The project involves the construction of transmission lines to connect some districts in North - Western Province that are currently not connected to the national grid. Further, it will involve the construction of six (6) 132-66/33/11 kV tap down load centres substations, one at each of the five sites of diesel generation namely: Mwinilunga, Mufumbwe, Kabompo, Zambezi, Chavuma and also another one at Mumbeji. During the period under review, the project was under implementation.
5 Pensulo - Kasama 330 kV transmission line project
The project involved constructing a new 330 kV transmission line from Pensulo substation to Kasama. The project was completed and commissioned in 2015.
6 Pensulo - Chipata 330 kV transmission line project
The project involved the construction of the 330 kV transmission line from Pensulo substation to Chipata. The project was completed and commissioned in 2015.
7 Lunsemfwa Power Station /Mkushi mine 66 kV transmission line project
The project involves reinforcement of power supply to Mkushi through the construction of a 97 km transmission line from Lunsemfwa power plant to Mkushi mine. Construction of the transmission line was completed but was yet to be commissioned.
8 Chimsoro Farm and Mkushi mine substations
The project is expected to reinforce the power supply to Mkushi through the construction of 132/66/33 kV substation at Chimsoro farm and Mkushi mine. During the period under review, the project was under implementation.

Energy Regulation Board
Energy Sector Report 2015 19
No. Project Name Description/Details/Status9 Power bank
installation at Mkushi Central and Farmers substations
The project involves reinforcement of power supply to Mkushi District through the installation of capacitor banks at Mkushi Central and Farmers substations. During the period under review, the project was under implementation.
10 Re-conductoring of 88 kV Kabwe-Kapiri line
The project involved the replacement of power conductors on the existing 88 kV line from Kabwe to Kapiri Mposhi. The project was completed in 2015.
11 Upgrading of Mbereshi-Nchelenge transmission line.
The project involves the upgrading of 33 kV Mbereshi-Nchelenge line to 66 kV and installation of 10 MVA 66/33 kV transformer at Nchelenge substation. During the period under review, the project was under implementation.
12 Cairo “A” switching station
The project involved the refurbishment of Cairo “A” switching station. The station is located adjacent to Lusaka main post office and was completed in 2015.
13 Mungwi road substation
The project involves the construction of a of 33/11 kV substation with capacity of 63 MVA on Mungwi Road in Lusaka Province. During the period under review, the project was under implementation.
14 Lusaka East transmission project
This involves upgrading of Chongwe – Avondale (132kV), Avondale – Ngwerere (132kV) and Roma – Avondale (132kV) overhead lines. Construction of a new line from Avondale to Ngwerere substations was under implementation during the period under review while the re-conductoring of the Avondale – Kwamwena 33 kV overhead line and construction of Chongwe Avondale line was completed.
15 Coventry – Chelstone line
This involves the replacement of 33 kV cables for the Coventry – Chelstone line. During the review period, no progress was made on this project.
16 Refurbishment of UTH Substations
The project involves refurbishment of University Teaching Hospital 617, Maybin A substation. During the review period, no progress was made on this project

Energy Regulation Board
Energy Sector Report 201520
2.14 Planned power generation projects
2.14.1 Mambilima and Mumbotuta hydro schemes
The Governments of Zambia and DRC signed an Inter-Governmental Memorandum of Understanding for joint exploitation of Mambilima and Mumbotuta hydropower sites in July 2015. The Joint Technical Committee (JTC) between ZESCO and Societe’ Nationale D’electricite’ (SNEL S.A.R.L), reviewed the previous feasibility studies of 1977 and 2001 in October 2015. The terms of reference for engaging consultants were also prepared. The reports were presented to the Project Implementation Unit for approval. The CEC also conducted preliminary feasibility studies for the Mambilima and Mumbotuta hydropower sites.
2.14.2 Upgrading of Mulungushi power plant
LHPC commenced feasibility studies in order to increase the capacity at Mulungushi power plant from the current 32 MW to about 45 MW. The project will involve the installation of an additional machine at Mulungushi power plant to increase the capacity from 32 MW to 40 MW and installation of 5 MW generating unit at the Mulungushi dam discharge site.
2 .14.3 Muchinga power generation project
In 2015, the draft Environmental Impact Assessment Report for Muchinga power generation project by Muchinga Power Company was submitted to Zambia Environmental Management Agency (ZEMA) for review. After the review, ZEMA had requested for a resettlement action plan which was yet to be submitted.
Further, the Government invited Muchinga Power Company and LHPC to initiate the project Implementation Agreement (IA) negotiation. By end of 2015, the developers were still studying the IA template from the Office for Promoting Private Power Investments (OPPPI).
2.14.4 Ndola Energy Company Limited Heavy Fuel Oil power plant
NECL planned to develop an additional HFO power plant in Ndola with an estimated generation capacity of 55 MW. All the power generated will be fed into the national grid. In 2015, NECL had already spent US$ 8.5 million towards the project.
2.14.5 Kalungwishi Hydro Power Project
The project involves the construction of two (2) power stations with a combined capacity of 247 MW located at Kabwelume Falls (96 MW) and Kundabwika Falls (151 MW). The project will also involve the construction of a 220 km, 330 kV transmission line to Kasama substation where power will be injected into the national electricity grid. Lunzua Power Authority (LPA) was contracted through international competitive bidding to develop the project at a total cost of US$650 million. The Implementation Agreement was signed on 22nd August, 2011 and the developer was in the process of finalizing the Environmental Impact Assessment (EIA) and other preparatory activities. The project is expected to be commissioned in 2019.
2.14.6 EMCO Thermal power plant
EMCO Energy Zambia Limited (EMCO) thermal power plant will be located in Sinazongwe with a capacity of 340 MW. The project is estimated to cost US$600 million. EMCO signed an Implementation Agreement with the Government on 20th September, 2012 and amended it in 2014. The PPA with ZESCO was signed in June 2014. During 2015, the developer undertook an Environmental Social Impact Assessment (ESIA) study and had commenced the process of procuring coal mine and power plant contractors.
Energy Regulation Board
Energy Sector Report 2015 21
2.14.7 Chavuma and Chanda Falls Hydro Schemes
The power plant projects comprising Chavuma Falls (14 MW) and Chanda Falls (1 MW) will be located in Chavuma on the Zambezi River and Kashiji River respectively in the North-Western Province of Zambia. The projects will be developed on Build, Own and Operate (BOO) basis. The power plants will improve quality of electricity supply in the North-Western province by displacing diesel generation. The power generated will be evacuated into the national grid through the transmission lines that were being constructed by ZESCO. The projects were estimated to cost US$ 51 million and US$8.1 million respectively. In 2015, the developer was still undertaking field investigations and designs. Meanwhile, negotiations for the Implementation Agreement were progressing.
2.14.8 Consolidated Farming Limited Bagasse power plant
Consolidated Farming Limited (CFL) is a private company based in Lusaka. CFL plans to design, finance, construct, commission, own, operate and maintain a bagasse fired power generation plant with a design rated capacity of 24 MW in Nampundwe, Shibuyunji District. This is expected to be commissioned in 2016.
CFL and ZESCO have agreed to enter into a PPA for a duration of eight (8) years commencing when the plant is commissioned.
2.15 Facilitating investments in the electricity sub-sector
2.15.1 Investment endorsements
To encourage investment in the electricity sub-sector, the ERB may issue an Investment Endorsement to a power project developer. An Investment Endorsement is a document that guarantees a developer that a license will be issued by ERB upon completion of the project subject to meeting the prescribed conditions. When applying for an Investment Endorsement the developer must submit the following information to the ERB:
a. Detailed project description including technical drawings;
b. Estimated cost and economic justification of the project;
c. A decision letter from the ZEMA; and
d. Draft PPA agreed with the off-taker.
The Investment Endorsement is valid for a specific period of one (1) year but may be renewed.
During the period under review, the ERB issued one (1) Investment Endorsement to CFL and two (2) Investment Endorsements renewals to MCL and EMCO. The three (3) Investment Endorsements were issued for generation of power as follows:
a. MCL: - for the development of a 300 MW (2 x 150) maximum capacity, coal fired power plant located in Maamba, Sinazongwe District in Southern Province;
b. CFL: - for the development of a Bagasse Fired Thermal Power Plant based in CFL’s sugar plantation in Nampundwe, Shibuyunji District, in Lusaka Province with a rated capacity of 24 MW; and
c. EMCO: - for the development of a 340 MW (2 x 170) coal fired power plant located in Sinazongwe District in Southern Province.

Energy Regulation Board
Energy Sector Report 201522
2.15.2 Power purchase agreements
During the year under review, the ERB approved five (5) PPAs compared to four (4) in 2014 and these were:
a. ZESCO and Itezhi-Tezhi Power Corporation;
b. ZESCO and MCL;
c. ZESCO and SNEL S.A.R.L;
d. ZESCO and Aggrekko; and
e. ZESCO, KarPower and Electricidade De Mozambique (EDM).
Notably, the PPAs between ZESCO and Aggrekko and; ZESCO, KarPower and Electricidade De Mozambique (EDM) were for the importation of emergency power. The PPAs for the other three (3) projects were amendments.
2.15.3 Licensing
During the year under review, the ERB issued a total of 17 standard and provisional licences compared to 13 in 2014. This is depicted in Table 2-8. A provisional licence is one which is valid for six months. Of the total licences issued two (2) were standard licences for generation of which one was an embedded10 licence. Meanwhile, there was no transmission licence issued in 2015. On the other hand, two (2) licences were issued for the supply of electricity of which one (1) was a standard licence and the other was provisional. In addition, 13 licences were issued for solar of which 10 were standard licences while three (3) were provisional licences.
Table 2-8: Licences issued in 2014 and 2015
No. Licence Type 2014 2015
1 Generation 2 2
2 Transmission 0 0
3 Distribution 2 0
4 Supply 1 2
5 Solar11 8 13
Total 13 17
The applicant for a license is required to pay an application fee, at the rate of 0.1 percent of the cost of investment. Upon being licensed, the licensee is also required to pay monthly license fees of 0.7 percent of monthly turnover of the business.
2.16 Electricity tariff reviews
During the year under review, the ERB received three (3) tariff applications from ZESCO, CEC and NWEC.
10 Embedded refers to generation units connected within a distribution network and not having direct access to the transmission network.11 For Manufacturing, Supply, Installation and Maintenance of Solar Energy Systems

Energy Regulation Board
Energy Sector Report 2015 23
2.16.1 ZESCO
In August 2015, ZESCO lodged an application to the ERB for a tariff adjustment in conformity with the Electricity Act – Section 8(2), Chapter 433 of the Laws of Zambia. The application was to increase electricity tariffs for its various customers, except the mines. The major justification for the tariff application was the need to move towards cost reflective tariffs. The key rationale being that ZESCO had signed PPAs with IPPs at tariffs which were higher than the average tariffs that existed in 2015. The average tariff ZESCO was paying, as an off-taker, to purchase power from IPPs ranged from USc 7/kWh to USc 13.23 /kWh and yet the average retail tariff in 2015 was USc 6/kWh.
The ERB reviewed the application from ZESCO and made a determination in December 2015. The ERB approved tariffs for the various customer categories are depicted in Table 2-9.
Table 2-9: Approved electricity tariffs
Category Consumption UnitTariffs (K)
Previous Approved
Metered Residential(Prepaid) (capacity 15 kVA)
R1 - Consumption band up to 300 kWh per month
Energy charge/kWh)0.15 0.15
R2 - consumption above 300 kWh in a month. Energy charge/kWh)
0.51 1.54
Fixed Monthly Charge 18.23 18.23
Commercial Tariffs (capacity 15 kVA)
Commercial Energy charge/kWh) 0.31 0.88
Fixed Monthly Charge 55.09 156.47
Social Services
Schools, Hospitals, Orphanages, churches, water pumping & street lighting
Energy charge K/kWh
0.28 0.81
Fixed Monthly Charge 47.91 139.41

Energy Regulation Board
Energy Sector Report 201524
Category Consumption UnitTariffs (K)
Previous Approved
Maximum Demand Tariffs
MD1- Capacity between 16 - 300 kVA
MD charge/kVA/Month 13.97 48.05
Energy charge /kWh 0.20 0.70
Fixed Monthly Charge 136.82 470.65
Off-peak MD charge/kVA/Month 6.98 24.03
Off-peak energy charge/kWh 0.15 0.52
Peak MD charge/kVA/Month 17.46 60.06
Peak Energy Charge/kWh 0.25 0.87
MD2- Capacity 301 to 2,000 kVA
MD charge/kVA/Month 26.13 89.9
Energy charge /kWh 0.17 0.58
Fixed Monthly Charge 273.62 941.25
Off-peak MD charge/kVA/Month 13.07 44.95
Off-peak energy charge/kWh 0.13 0.43
Peak MD charge/kVA/Month 32.67 112.37
Peak Energy Charge/kWh 0.21 0.72
MD3- Capacity 2,001 to 7,500 kVA
MD charge/kVA/Month 41.75 115.23
Energy charge /kWh 0.14 0.38
Fixed Monthly Charge 579.74 1,600.10
Off-peak MD charge/kVA/Month 20.87 57.61
Off-peak energy charge/kWh 0.1 0.28
Peak MD charge/kVA/Month 52.19 144.04
Peak Energy Charge/kWh 0.17 0.47
MD4-Capacity above 7500 kVA
MD charge/kVA/Month 41.98 115.87
Energy charge /kWh 0.12 0.32
Fixed Monthly Charge 1,159.50 3,200.22
Off-peak MD charge/kVA/Month 20.99 57.93
Off-peak energy charge/kWh 0.09 0.24
Peak MD charge/kVA/Month 52.48 144.83
Peak Energy Charge/kWh 0.14 0.4
Note: Tariffs are exclusive of taxes

Energy Regulation Board
Energy Sector Report 2015 25
2.16.2 North Western Energy Corporation Limited
In November 2015, NWEC applied to the ERB to vary the tariffs for its various customers in order to make them consistent with ZESCO’s application of August 2015. NWEC, in its application, argued that the load shedding and the new ZESCO proposed tariffs would lead to reductions in consumption of power by their residential customers. Further, if NWEC was to adopt the proposed new R1 and R2 tariffs by ZESCO, most of its customers would fall into a lower tariff band (K0.15/kWh) which would drop their revenues significantly.
However, as at 31st December 2015, the ERB was still reviewing the tariff application and had not yet rendered its decision.
2.16.3 Copperbelt Energy Corporation Plc
In December 2015, CEC applied to the ERB to vary the tariffs for its residential customers in CEC village housing complex in Kitwe to make them consistent with the proposed ZESCO’s residential tariffs. However, as at 31st December 2015, the ERB was still reviewing the tariff application and had not yet rendered its decision.
2.17 Other developments
During the year under review, there were a number of other developments in the sub-sector ranging from increasing access to electricity in rural areas, initiatives to ecourage solar power generation, to proposed amendments to the current tariff determination methodology. These developments were aimed at addressing challenges in the sub-sector.
Stakeholders following public hearing proceedings during ZESCO’S tariff application in 2015.
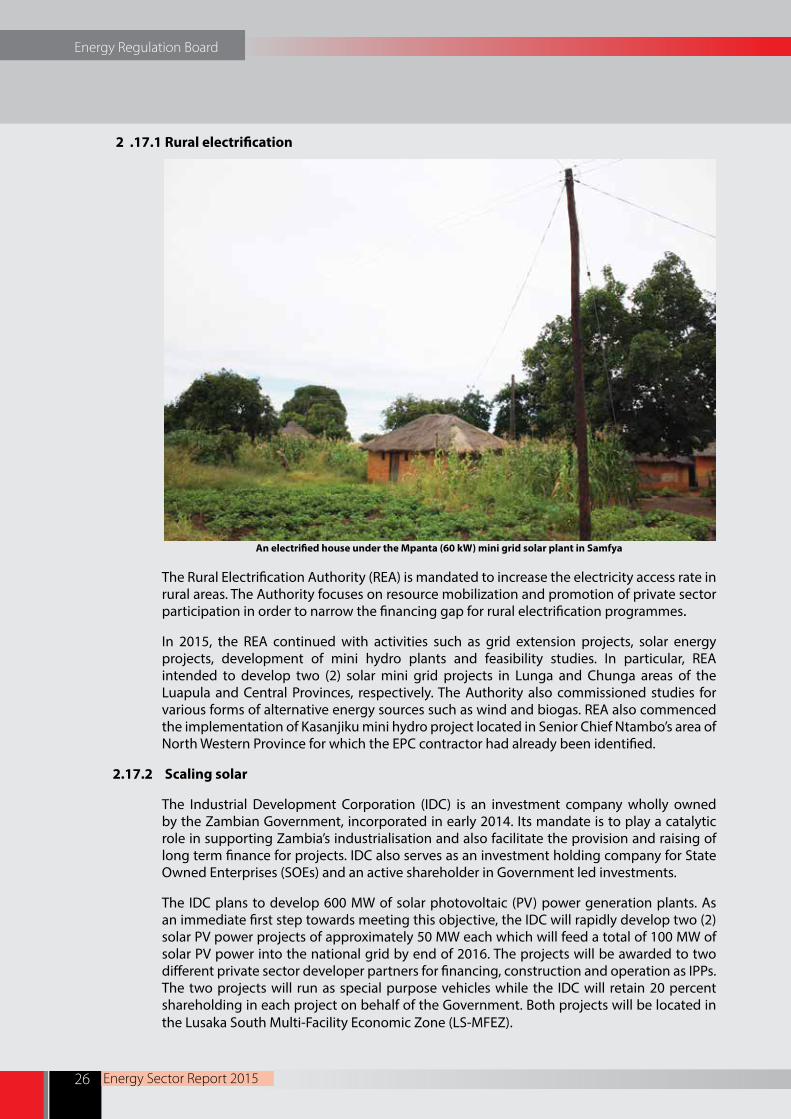
Energy Regulation Board
Energy Sector Report 201526
2 .17.1 Rural electrification
An electrified house under the Mpanta (60 kW) mini grid solar plant in Samfya
The Rural Electrification Authority (REA) is mandated to increase the electricity access rate in rural areas. The Authority focuses on resource mobilization and promotion of private sector participation in order to narrow the financing gap for rural electrification programmes.
In 2015, the REA continued with activities such as grid extension projects, solar energy projects, development of mini hydro plants and feasibility studies. In particular, REA intended to develop two (2) solar mini grid projects in Lunga and Chunga areas of the Luapula and Central Provinces, respectively. The Authority also commissioned studies for various forms of alternative energy sources such as wind and biogas. REA also commenced the implementation of Kasanjiku mini hydro project located in Senior Chief Ntambo’s area of North Western Province for which the EPC contractor had already been identified.
2.17.2 Scaling solar
The Industrial Development Corporation (IDC) is an investment company wholly owned by the Zambian Government, incorporated in early 2014. Its mandate is to play a catalytic role in supporting Zambia’s industrialisation and also facilitate the provision and raising of long term finance for projects. IDC also serves as an investment holding company for State Owned Enterprises (SOEs) and an active shareholder in Government led investments.
The IDC plans to develop 600 MW of solar photovoltaic (PV) power generation plants. As an immediate first step towards meeting this objective, the IDC will rapidly develop two (2) solar PV power projects of approximately 50 MW each which will feed a total of 100 MW of solar PV power into the national grid by end of 2016. The projects will be awarded to two different private sector developer partners for financing, construction and operation as IPPs. The two projects will run as special purpose vehicles while the IDC will retain 20 percent shareholding in each project on behalf of the Government. Both projects will be located in the Lusaka South Multi-Facility Economic Zone (LS-MFEZ).

Energy Regulation Board
Energy Sector Report 2015 27
In 2015, two projects were identified namely: Mosi-oa-Tunya and West Lunga. Working with the International Finance Corporation which is a member of the World Bank Group, the IDC conducted open and competitive Request For Pre-qualification (RFP). The IDC received 49 applications from which 11 bidders were shortlisted to participate in the tender. By the end of 2015, the process of bid evaluation was ongoing.
2.17.3 Legislative reviews and Multi-Year Tariff Framework
In 2015, just like the previous year, the ERB made proposals to amend the current legislation on tariff determination. The proposals were aimed at enhancing the ERB’s regulatory efficiency. Specifically, the ERB proposed the introduction of a Multi-Year Tariff Framework (MYTF) and an automatic cost-pass-through framework that is intended to address the needs of the evolving and expanding ESI in Zambia. The current tariff determination framework requires that the licensee makes a tariff application when need arises. The proposed framework will provide for more efficiency and predictability. The proposed MYTF will undergo stakeholder consultation before finalisation and implementation once the legislation has been amended.
2.17.4 Zambia Distribution Code
During the period under review, the ERB developed the Zambia Distribution Code (Distribution Code) which was intended to complement the Electricity Regulations (Grid Code), Statutory Instrument No. 79 of 2013, in facilitating non-discriminatory access to the electricity distribution network in Zambia. This will ultimately result in improved efficiency in the operation of electricity network and is expected to encourage more investment in the electricity sub-sector.
The Distribution Code aims to address the challenges arising from the envisaged developments in the ESI, especially the expected increased integration of the private sector investment in embedded generation and distribution facilities.
Specifically, the envisaged developments in the ESI, among other things include:
a. The development of embedded generators connecting directly into the distribution network;
b. Integration of renewable energy based generation into the distribution network; and
c. Net metering to allow domestic customers with renewable energy based generation to supply part of their generation into the distribution network.
The development of the Distribution Code took into account the evolving structure of the ESI in Zambia as outlined above. It is expected, however, that the change in structure will be aimed at achieving increased access, greater competition and enhanced efficiency in the ESI. The Distribution Code will therefore form an essential and integral part in achieving the goals of liberalisation. The draft Distribution Code was circulated to stakeholders for comments and was awaiting finalisation by the end of the year.
2.18 Regional Developments - Southern African Power Pool
The Southern African Power Pool (SAPP) is a cooperation of electricity companies in Southern Africa under the auspices of the Southern African Development Community (SADC). Members of SAPP have created a common power grid between their countries and a common market for electricity in the SADC region. SAPP was founded in 1995 and has 16 electricity companies drawn from 12

Energy Regulation Board
Energy Sector Report 201528
member countries. In Zambia, the members of SAPP are ZESCO, CEC and LHPC. SAPP was created with the primary aim to provide reliable and economical supply of electricity. According to SAPP, the demand for electricity in the region grew at about 4 percent in 2015.
2.18.1 SAPP installed capacity
During the year under review, SAPP installed capacity was 61,859 MW. Figure 2-8 shows the total contributions to the installed capacity by generation technology.
Figure 2-8: SAPP installed capacity by technology in 2015
Source: SAPP, [2015] Note: OCGT refers to Open Cycle Gas Turbine while CSP refers to Concentrated Solar Power
2.18.2 SAPP demand and supply
As at 31st December 2015, SAPP had available installed capacity of 57,917 MW and an operating capacity of 43,964 MW against a demand of 51,821 MW. This represented a shortfall of 7,857 MW. According to SAPP, the projected peak demand will equal operating capacity by 2019, according to plan.
2.18.3 SAPP system disturbances
A system disturbance is a situation where the grid network does not perform according to the desired operating parameters. In 2015, the SAPP system registered up to seven (7) disturbances in a month compared to up to nine (9) in 2014. This is depicted in Figure 2-9.
21.0%
62.0%
3.0%
1.5%
4.4%
4.0%
1.0%
2.9%
0.0%
0.1%
Hydro
Coal
Nuclear
OCGT
Distillate
Wind
Solar CSP
Solar PV
Landfill
Biomass
0.0% 10.0% 20.0% 30.0% 40.0% 50.0% 60.0% 70.0%
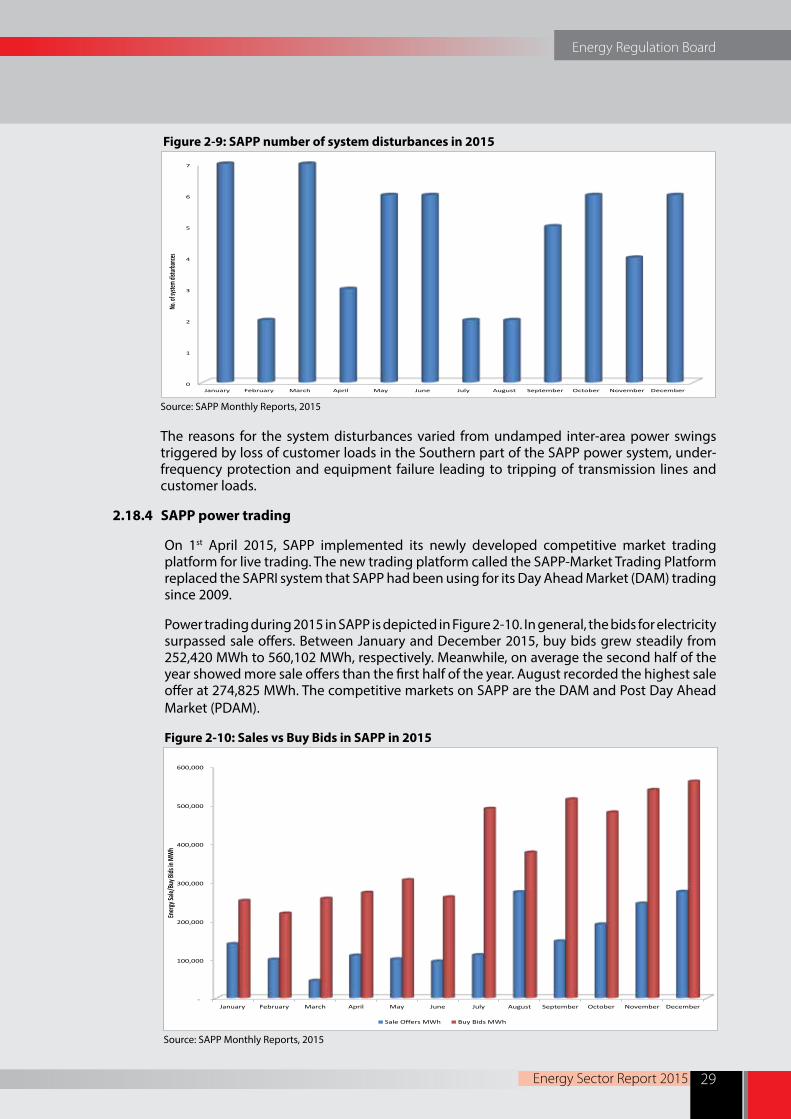
Energy Regulation Board
Energy Sector Report 2015 29
Figure 2-9: SAPP number of system disturbances in 2015
Source: SAPP Monthly Reports, 2015
The reasons for the system disturbances varied from undamped inter-area power swings triggered by loss of customer loads in the Southern part of the SAPP power system, under-frequency protection and equipment failure leading to tripping of transmission lines and customer loads.
2.18.4 SAPP power trading
On 1st April 2015, SAPP implemented its newly developed competitive market trading platform for live trading. The new trading platform called the SAPP-Market Trading Platform replaced the SAPRI system that SAPP had been using for its Day Ahead Market (DAM) trading since 2009.
Power trading during 2015 in SAPP is depicted in Figure 2-10. In general, the bids for electricity surpassed sale offers. Between January and December 2015, buy bids grew steadily from 252,420 MWh to 560,102 MWh, respectively. Meanwhile, on average the second half of the year showed more sale offers than the first half of the year. August recorded the highest sale offer at 274,825 MWh. The competitive markets on SAPP are the DAM and Post Day Ahead Market (PDAM).
Figure 2-10: Sales vs Buy Bids in SAPP in 2015
Source: SAPP Monthly Reports, 2015
0
1
2
3
4
5
6
7
January February March April May June July August September October November December
No. of
syste
m distu
rbance
s
-
100,000
200,000
300,000
400,000
500,000
600,000
January February March April May June July August September October November December
Energ
y Sale
/Buy
Bids
in M
Wh
Sale Offers MWh Buy Bids MWh

Energy Regulation Board
Energy Sector Report 201530
In terms of Market Clearing Prices (MCPs), the average monthly MCPs increased to USc 6.7/kWh in 2014/15 compared to the USc 5.7/kWh recorded in 2013/14. The months of July to October recorded sustained high MCPs for the period under review. Meanwhile, the month of April recorded the lowest market prices. Figure 2-11 shows the trends of MCPs in 2015.
Figure 2-11: SAPP market clearing prices in 2015
Source: SAPP Monthly Reports, 2015
2.18.5 SAPP transmission projects
ZIZABONA
The major SAPP transmission project that will have an impact on Zambia is the Zimbabwe-Zambia-Botswana-Namibia (ZIZABONA) project. This project is a 330 kV transmission line that will run through the four countries. It is expected to be completed in 2019. During the period under review, detailed feasibility studies were completed including analysis of financing options. The project will be implemented in two phases. Phase 1 of the project will be the Hwange – Victoria Falls- Livingstone transmission line and the Livingstone – Sesheke transmission line into Namibia. This line would be used to evacuate power from Zimbabwe to Namibia where an 80 MW PPA between Zimbabwe Electricity Supply Authority (ZESA) and NamPower is already in existence. Phase 2 would be the Victoria Falls-Pandamatenga and Livingstone-Sesheke- lines. The implementation timing for phase 2 will depend on the Kudu project (a 900 MW gas to power project located in Namibia that is expected to be commissioned in 2018/19), demand at Pandamatenga and also demand by ZESCO.
During the year under review, the Economic Social Impact Assessment report was submitted to the ZEMA for review and approval. Furthermore, the following reports were completed by the Transaction Advisor (TA):
a. Market and Load Flow Studies;
b. Financial model for phase 1;
c. EPC contracting strategy report;
d. Lender’s engagement report; and
e. Draft Wheeling Agreement for phase 1.
0
1
2
3
4
5
6
7
8
9
10
January February March April May June July August September October November December
Mark
et Cle
aring
Price
s

Energy Regulation Board
Energy Sector Report 2015 31
Zambia -Tanzania – Kenya inter-connector project
In 2015, funding for the Zambia -Tanzania – Kenya inter-connector project was secured from the African Development Bank (AfDB) and Japan International Cooperation Agency (JICA). The procurement of a consultant for the EPC phase commenced in 2015. Construction is expected to start by June, 2016 and is scheduled for completion by March, 2019. With regard to the project, Zambia was in the process of procuring an EPC contractor and financing the Kasama to Tunduma (border with Tanzania) transmission line.

Energy Regulation Board
Energy Sector Report 201532
This section discusses the supply of national fuel requirements, operations of TAZAMA Pipelines Limited (TAZAMA) and INDENI Petroleum Refinery Company Limited (INDENI), national consumption of fuel, market share of Oil Marketing Companies (OMCs), pricing of petroleum products and challenges in the petroleum sub-sector.
3.1 Importation of petroleum products
The national demand for petroleum products is met through the importation of petroleum feedstock and finished petroleum products as the country has no known reserves of crude oil. The Government and OMCs import finished petroleum products by road. On the other hand, the petroleum feedstock is only imported by the Government and later refined at INDENI. In 2015, the proportion of Government imports of petrol and diesel accounted for 55.8 percent of the total national consumption of the two products. INDENI refinery production and OMCs imports of the two products accounted for 28.6 percent and 15.6 percent of the total national consumption respectively.
3.1.1 Importation of petroleum feedstock
Figure 3-1 shows the trend in the importation of petroleum feedstock from 2011 to 2015. The country imports petroleum feedstock which is refined at INDENI. Notably, the country imports commingled petroleum feedstock because the refinery is not designed to process pure crude oil. Typically, petroleum feedstock comprises crude oil, diesel, condensate and naphtha12 .
12 Naphtha is a general term that is used to refer to a mixture of various volatile flammable liquid hydrocarbons used as a solvent.
3.0 PETROLEUM SUB-SECTOR
A new innovative mobile petroleum retail service station with above-ground fuel storage

Energy Regulation Board
Energy Sector Report 2015 33
Figure 3-1: Trends in petroleum feedstock imports, 2011-2015
Source: TAZAMA
As depicted in Figure 3-1 the amount of petroleum feedstock imports increased by 14.9 percent from 559,916 MT in 2014 to 643,180 MT in 2015. Details of the imports of the petroleum feedstock by cargo in 2014 and 2015 is provided in Appendix 2.
3.1.2 Importation of finished petroleum products
Figure 3-2 shows the trends in the importation of finished petroleum products by the Government for the period 2010 to 2015. The importation of finished petroleum products is meant to supplement refinery production.
Figure 3-2: Trends in imports of finished petroleum products, 2010 - 2015
Source: TAZAMA. Note: Figures for diesel and petrol for 2010, 2012, 2013 and 2014 have been adjusted post reconciliation.
100,000
200,000
300,000
400,000
500,000
600,000
2011 2012 2013 2014 2015 Petroluem feedstock (MT) 577,098 642,683 606,463 559,916 643,180
MT
-
100,000
200,000
300,000
400,000
500,000
600,000
700,000
800,000
900,000
2010 2011 2012 2013 2014 2015Diesel 96,791 197,442 283,759 429,378 389,183 519,948Petrol 49,417 71,005 145,374 249,208 264,777 294,876Grand Total 148,218 268,447 429,134 678,586 653,960 814,823
M3

Energy Regulation Board
Energy Sector Report 201534
During the period under review, total imports of petrol and diesel increased by 24.6 percent from 653,960 m3 in 2014 to 814,823 m3 in 2015. Specifically, diesel imports increased by 33.6 percent, from 389,183 m3 in 2014 to 519,948 m3 in 2015, while petrol imports increased by 11.4 percent, from 264,777 m3 in 2014 to 294,876 m3 in 2015.
3.2 Operations at TAZAMA
3.2.1 TAZAMA throughput
Petroleum feedstock that is imported mainly from the Middle East is transported from Dar-es-Salaam in Tanzania to Ndola in Zambia via the 1,710 km pipeline. The pipeline has an initial design throughput of 1,100,000 MT per annum. However, in the last five (5) years, the throughput averaged 584,793 MT per annum. The reduction in the throughput against the design capacity is as a result of degradation of the pipeline. Nevertheless, over the years the throughput has steadily increased on account of maintenance and refurbishment works, except in 2014 when there was a reduction of 15.6 percent from 2013. Specifically, during the year under review, the throughput increased to 613,174 MT from 519,725 MT in 2014, representing an increase of 18.0 percent. This is depicted in Figure 3-3
Figure 3-3 : Petroleum feedstock throughput for TAZAMA Pipeline, 2011 – 2015
Source: TAZAMA
3.2.2 Petroleum storage
Mongu Fuel Depot construction works underway
100,000
200,000
300,000
400,000
500,000
600,000
2010 2011 2012 2013 2014 2015Throughput (MT) 603,234 579,058 596,094 615,916 519,725 613,174
MT

Energy Regulation Board
Energy Sector Report 2015 35
During 2015, the Government continued with the programme to construct fuel storage depots (to be located in each province) in order to enhance security of supply. Between 2013 and 2014, two (2) fuel depots were completed and commissioned in Lusaka and Mpika respectively. The Solwezi Depot was completed while works on the Mongu Depot had already commenced and had reached an advanced stage. Further, within 2015, major rehabilitation works at the NFT were completed. TAZAMA has been supervising the construction works and also managing the depots on behalf of the Government. The details on the construction and the status of the works are shown in Table 3-1.
Table 3-1: Construction of petroleum storage depots in 2015No. Project Name Description/Details/Status
1 Ndola Fuel Terminal Rehabilitation and upgrading works were completed. The rehabilitation on existing storage tanks was completed and tank gauging was upgraded from manual to automatic. Further, the loading facilities were increased from 5 to 19 for the road tankers and 7 to 21 for the rail tankers as a result of upgrading to bottom loading.
2 Solwezi Fuel Depot Construction of the depot was completed on 31st October 2015 at a total cost of US$ 25 million and was officially commissioned on 7th December 2015. The depot has five (5) petroleum storage tanks with a combined storage capacity of 15,500 m3 as follows: diesel - 10,000 m3; petrol - 5,000 m3; and kerosene – 500 m3.
3 Mongu Fuel Depot Construction works at the Mongu Fuel Depot commenced in 2014. In 2015, the construction works had progressed to 98 percent. The works included construction of five (5) fuel storage tanks and fuel containment facilities. The depot will have a combined fuel storage capacity of 6,500 m3 as follows: Diesel - 4,000 m3, Petrol - 2,000 m3, and Kerosene – 500 m3. The project was expected to be commissioned in April 2016 at a cost of over US$ 27 million.
3 .2.3 TAZAMA pipeline rehabilitation works
In order to keep the pipeline operational, TAZAMA routinely undertakes rehabilitation works that include, repair of corroded sections, replacement of pumping units and rehabilitation of the petroleum feedstock tanks. The major rehabilitation works undertaken during 2015 are shown in Table 3-2.
Table 3-2: TAZAMA pipeline rehabilitation works in 2015
No. Rehabilitation Works Description/Details/Status
1 Rehabilitation of Pipeline In 2015, TAZAMA continued to repair corroded areas along the pipeline based on the intelligent pigging13 exercise that was undertaken on the entire pipeline in 2013. All corroded areas for which the metal losses were above 60 percent had been repaired on the Zambian side. Meanwhile, on the Tanzanian side, the repairs on the remaining two sections are expected to be concluded in April 2016. The total cost for this exercise is about US$7.5 Million. It is anticipated that after completion of repair works on the corroded areas, the throughput capacity (volumetric flow rate) will be improved to 115 m3/hour from the current 105 m3/ hour.
13 Intelligent Pigging in the context of pipelines refers to the use of electronic devices known as pigs to collect data on the internal state of the pipeline.

Energy Regulation Board
Energy Sector Report 201536
No. Rehabilitation Works Description/Details/Status
2 Replacement of Pumping Units The replacement of the pumping units and main pumps at Elphons Pass Station in Tanzania were completed and commissioned in August 2015 at a total cost of US$6.2 million. Previously, the pumping station would at minimum operate using three pumping units since its inception in 1968. However, following the replacement of the old units with more efficient ones, the pumping station is now operated by only two units at minimum thereby reducing operational costs for the station.
3 Rehabilitation of Tank No. 4 at the Dar-es-Salaam Tank Farm
Repair works on Tank No. 4 continued in 2015 and progressed to 98 percent by the end of 2015. The tank is expected to be commissioned in March 2016 at a cost of US$ 2.9 million.
3.3 Operations at INDENI Petroleum Refinery Limited
INDENI Refinery
3.3.1 INDENI throughput
INDENI has a name plate (design) throughput of 1,100,000 million metric tonnes per annum. In the last five (5) years, from 2011 to 2015, the throughput for INDENI averaged 661,000 MT. During this period, the lowest throughput was recorded in 2015 while the highest was in 2014. Specifically, during 2015, the throughput was 623,000 MT compared to 701,000 MT in 2014, representing a decrease of 11.1 percent. During the period under review, the Refinery was operational for 290 days, having shut down for 75 days, against 304 days of operation and 61 days of shutdown in 2014. The increase in number of shutdowns experienced in 2015 was on account of corrosion caused by high acidic levels of petroleum feedstock contaminated by organic chlorides which was processed in June 2015. The refinery was also on planned shutdown for annual catalyst regeneration and general maintenance for 19 days in 2015. During the shutdowns, the Government imported finished petroleum products by road in order to guarantee security of supply. Figure 3-4 shows petroleum feedstock processed by INDENI, for the period 2011 to 2015.

Energy Regulation Board
Energy Sector Report 2015 37
Figure 3-4: Petroleum feedstock processed by INDENI, 2011 – 2015
Source: INDENI. Note that figures in the graph are rounded off to the nearest hundred.
3.3.2 INDENI rehabilitation works
During 2015, INDENI undertook the following major works:
a. Rehabilitation of a boiler;
b. Upgrade of recycle gas compressor; and
c. Cleaning and retubing of heat exchangers and air-coolers.
The bitumen plant which has been undergoing rehabilitation at an estimated cost of US$20.7 million since 2012, had not yet commenced operations as at 31st December, 2015. This was due to process equipment optimisation challenges and the quality of petroleum feedstock in terms of bituminous content.
3.4 National consumption of petroleum products
National consumption of petroleum products continued to increase in 2015, consistent with the increase in economic activities. Figure 3-5 shows the national consumption of petroleum products trends for the period 2010 to 2015. There was generally a consistent rise in consumption for unleaded petrol, diesel15 and HFO during the period 2010 to 2015. During the same period, consumption of Jet A-1 was mixed, while that of kerosene and Liquefied Petroleum Gas (LPG) remained fairly constant.
14 Organic chloride contamination in crude oil can cause hydrochloric acid to be formed during hydro treating. The hydrochloric acid can then corrode equipment. 15 Diesel in this report refers to ordinary and low sulphur gasoil combined
100,000
200,000
300,000
400,000
500,000
600,000
700,000
2010 2011 2012 2013 2014 2015Petroluem feedstock (MT) 625,000 699,000 655,000 627,000 701,000 623,000
MT

Energy Regulation Board
Energy Sector Report 201538
Figure 3-5: Trends in national fuel consumption by type, 2010–2015
NOTE: Figures for Jet A-1, heavy fuel oils, kerosene and diesel for 2014 have been adjusted post reconciliation
The total national consumption of petroleum products increased from 1,177,465 MT in 2014 to 1,379, 781 MT in 2015, reflecting a percentage increase of 17.2. In 2015, the most consumed product was diesel at 818,418 MT (974,307 m3)16 followed by petrol at 366,524 MT (488,699 m3)17 , while the least consumed was LPG at 3,230 MT.
Generally, the consumption of diesel and petrol had increased during the period 2010 to 2015. During the period under review, the consumption of diesel increased by 16.8 percent, from 700,577 MT (834,020 m3) in 2014 to 818,418 MT (974,307 m3) in 2015. Similarly, the consumption of petrol increased by 20.3 percent, from 304,562 MT (406,083 m3) in 2014 to 366,524 MT (488,699 m3) in 2015. This increase could be partially attributed to growth in the number of motor vehicles in the country and increased economic activities in sectors that use petroleum products. The cumulative stock of registered vehicles increased by 9.6 percent; that is, from 605,637 in 2014 to 663,542 in 2015. Further, there was new demand for petroleum products from new economic activities especially in mining in the North Western Province.
The national consumption of HFO increased from 116,821 MT in 2014 to 129,149 MT in 2015, reflecting a percentage increase of 10.6 percent. Similarly, the consumption of Jet A-1 increased by 16.1 percent from 38,049 MT (47,861 m3)18 in 2014 to 44,160 MT (55,546.65 m3) in 2015. The increase in the consumption of Jet A-1 was partially attributed to the increase in airlines traffic both locally and internationally.
On the other hand, there was a decline in the consumption of LPG in 2015. The national consumption of LPG declined by 12.2 percent from 3,680 MT in 2014 to 3,230 MT in 2015, due to low production at INDENI. The national consumption of kerosene increased by 32.8 percent from 13,776 MT (17,328 m3) in 2014 to 18,300 MT (23,019 m3) in 2015.
3.5 Daily national consumption
Figure 3-6 shows the national daily average consumption of petroleum products for the period 2011 to 2015. Generally, for all the petroleum products, there has been a gradual rise in consumption over time. The daily average consumption of diesel increased to 2,669,334 litres compared to
16 In the case of diesel, 1 Metric Tonne is equivalent to 1.19m3 using a density of 0.84 kilograms/litre.17 In the case of petrol, 1 Metric Tonne is equivalent to 1.33m3 using a density of 0.75 kilograms/litre.18 In the case of Jet A-1 and Kerosene, 1 Metric Tonne is equivalent to 1.26m3 using a density of 0.795 kilograms/litre.
0
200,000
400,000
600,000
800,000
1,000,000
1,200,000
1,400,000
Heavy Fuel Oils LP Gas Jet-A1 Kerosene Unleaded Petrol Diesel TotalConsumption
2010 46,845 1,848 29,130 17,330 160,982 496,568 752,7032011 49,461 2,424 32,593 19,898 182,123 577,836 864,3352012 60,222 658 49,477 14,669 234,224 675,756 1,035,0062013 50,793 3,021 49,613 12,315 275,604 676,078 1,067,4252014 116,821 3,680 38,049 13,776 304,562 700,577 1,177,4652015 129,149 3,230 44,160 18,300 366,524 818,418 1,379,781
MT
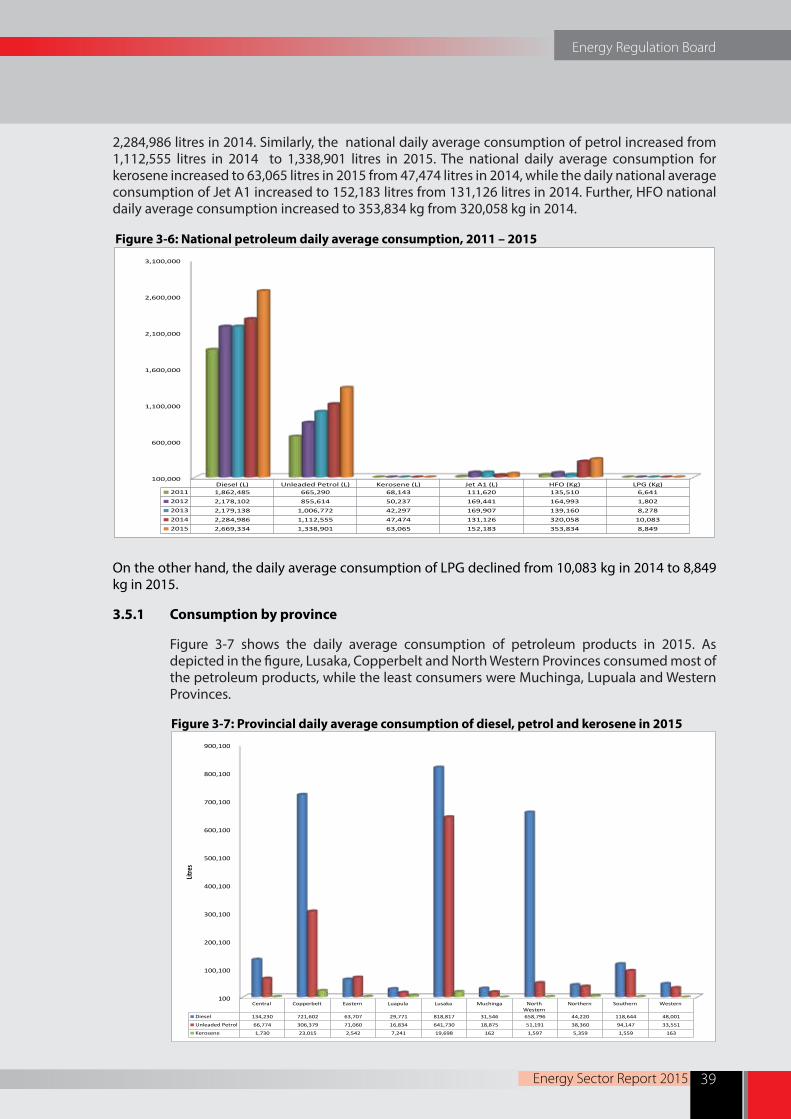
Energy Regulation Board
Energy Sector Report 2015 39
2,284,986 litres in 2014. Similarly, the national daily average consumption of petrol increased from 1,112,555 litres in 2014 to 1,338,901 litres in 2015. The national daily average consumption for kerosene increased to 63,065 litres in 2015 from 47,474 litres in 2014, while the daily national average consumption of Jet A1 increased to 152,183 litres from 131,126 litres in 2014. Further, HFO national daily average consumption increased to 353,834 kg from 320,058 kg in 2014.
Figure 3-6: National petroleum daily average consumption, 2011 – 2015
On the other hand, the daily average consumption of LPG declined from 10,083 kg in 2014 to 8,849 kg in 2015.
3.5.1 Consumption by province
Figure 3-7 shows the daily average consumption of petroleum products in 2015. As depicted in the figure, Lusaka, Copperbelt and North Western Provinces consumed most of the petroleum products, while the least consumers were Muchinga, Lupuala and Western Provinces.
Figure 3-7: Provincial daily average consumption of diesel, petrol and kerosene in 2015
100
100,100
200,100
300,100
400,100
500,100
600,100
700,100
800,100
900,100
Central Copperbelt Eastern Luapula Lusaka Muchinga NorthWestern
Northern Southern Western
Diesel 134,230 721,602 63,707 29,771 818,817 31,546 658,796 44,220 118,644 48,001
Unleaded Petrol 66,774 306,379 71,060 16,834 641,730 18,875 51,191 38,360 94,147 33,551
Kerosene 1,730 23,015 2,542 7,241 19,698 162 1,597 5,359 1,559 163
Litre
s
100,000
600,000
1,100,000
1,600,000
2,100,000
2,600,000
3,100,000
Diesel (L) Unleaded Petrol (L) Kerosene (L) Jet A1 (L) HFO (Kg) LPG (Kg)2011 1,862,485 665,290 68,143 111,620 135,510 6,6412012 2,178,102 855,614 50,237 169,441 164,993 1,8022013 2,179,138 1,006,772 42,297 169,907 139,160 8,2782014 2,284,986 1,112,555 47,474 131,126 320,058 10,0832015 2,669,334 1,338,901 63,065 152,183 353,834 8,849

Energy Regulation Board
Energy Sector Report 201540
The national daily average consumption of diesel, petrol and kerosene combined was 4,071,300 litres in 2015. Lusaka Province accounted for the highest daily average combined consumption at 1,480,245 litres reflecting 36.4 percent of total national daily average consumption. This comprised 818,817 litres of diesel, 641,730 litres of petrol and 19,698 litres of kerosene per day, respectively.
The second highest consumer was Copperbelt Province with a combined average daily national consumption of 1,050,996 litres representing 25.8 percent of total average daily consumption. This comprised 721,602 litres of diesel, 306,379 litres of petrol and 23,015 litres of kerosene per day, respectively.
North Western province was the third highest consumer accounting for a combined daily average consumption of 711,584 litres. This reflected 17.5 percent of total daily average national consumption and comprised 658,796 litres of diesel, 51,191 litres of petrol and 1,597 litres of kerosene per day, respectively.
Lusaka, Copperbelt and North Western Provinces collectively accounted for 79.7 percent of the total daily average national consumption. This is consistent with the level of economic activities in these provinces, including the number of retail outlets. Specifically, the mines on the Copperbelt Province and North Western Province consume a lot of petroleum products.
The lowest daily average national combined consumption of the three petroleum products was recorded by Muchinga Province at 50,582 litres per day representing 1.2 percent of total consumption. Of this, 31,546 litres was diesel, 18,875 litres was petrol while 162 litres was kerosene. The rest of the provinces, that is, Central, Eastern, Southern, Northern, Luapula and Western consumed 19.1 percent.
3.5.2 Consumption by economic sector
The national consumption of diesel, petrol, kerosene and Jet A-1 in 2014 and 2015 by economic sector is shown in Figure 3-8. The economic sectors are classified as follows: retail, mining and non-mining. Retail refers to petroleum products that are sold at the forecourt while mining refers to petroleum products delivered to and directly consumed by the mines. Non-mining refers to all the other sectors in the economy.
Figure 3-8: Consumption of petroleum products by economic sector in 2015
The share of the retail sector of national consumption of petroleum products in 2015 increased to 54 percent from 52 percent in 2014. However, the share of national consumption of petroleum products for the mining and non-mining sectors declined to 22 percent and 24 percent in 2015 from 23 percent and 25 percent in 2014 respectively.
0%
10%
20%
30%
40%
50%
60%
Percen
tage
Sector Retail Mining2014 52% 23% 25%2015 54% 22% 24%
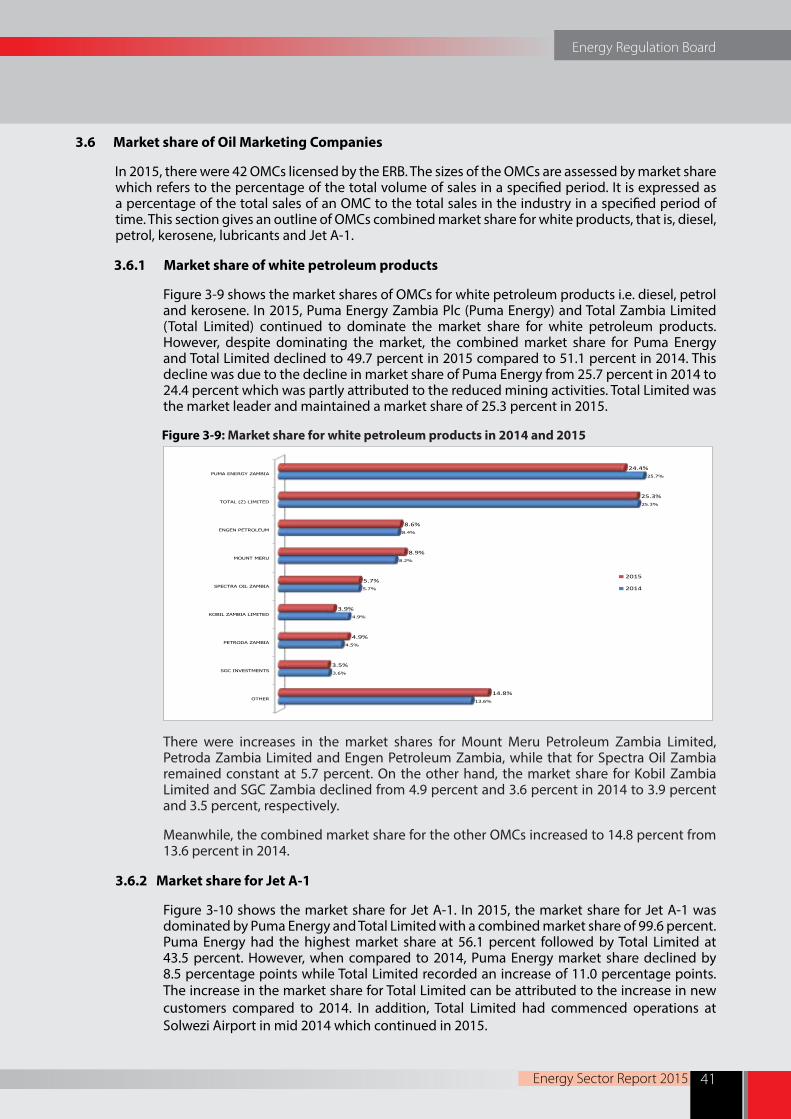
Energy Regulation Board
Energy Sector Report 2015 41
3.6 Market share of Oil Marketing Companies
In 2015, there were 42 OMCs licensed by the ERB. The sizes of the OMCs are assessed by market share which refers to the percentage of the total volume of sales in a specified period. It is expressed as a percentage of the total sales of an OMC to the total sales in the industry in a specified period of time. This section gives an outline of OMCs combined market share for white products, that is, diesel, petrol, kerosene, lubricants and Jet A-1.
3.6.1 Market share of white petroleum products
Figure 3-9 shows the market shares of OMCs for white petroleum products i.e. diesel, petrol and kerosene. In 2015, Puma Energy Zambia Plc (Puma Energy) and Total Zambia Limited (Total Limited) continued to dominate the market share for white petroleum products. However, despite dominating the market, the combined market share for Puma Energy and Total Limited declined to 49.7 percent in 2015 compared to 51.1 percent in 2014. This decline was due to the decline in market share of Puma Energy from 25.7 percent in 2014 to 24.4 percent which was partly attributed to the reduced mining activities. Total Limited was the market leader and maintained a market share of 25.3 percent in 2015.
Figure 3-9: Market share for white petroleum products in 2014 and 2015
There were increases in the market shares for Mount Meru Petroleum Zambia Limited, Petroda Zambia Limited and Engen Petroleum Zambia, while that for Spectra Oil Zambia remained constant at 5.7 percent. On the other hand, the market share for Kobil Zambia Limited and SGC Zambia declined from 4.9 percent and 3.6 percent in 2014 to 3.9 percent and 3.5 percent, respectively.
Meanwhile, the combined market share for the other OMCs increased to 14.8 percent from 13.6 percent in 2014.
3.6.2 Market share for Jet A-1
Figure 3-10 shows the market share for Jet A-1. In 2015, the market share for Jet A-1 was dominated by Puma Energy and Total Limited with a combined market share of 99.6 percent. Puma Energy had the highest market share at 56.1 percent followed by Total Limited at 43.5 percent. However, when compared to 2014, Puma Energy market share declined by 8.5 percentage points while Total Limited recorded an increase of 11.0 percentage points. The increase in the market share for Total Limited can be attributed to the increase in new customers compared to 2014. In addition, Total Limited had commenced operations at Solwezi Airport in mid 2014 which continued in 2015.
OTHER
SGC INVESTMENTS
PETRODA ZAMBIA
KOBIL ZAMBIA LIMITED
SPECTRA OIL ZAMBIA
MOUNT MERU
ENGEN PETROLEUM
TOTAL (Z) LIMITED
PUMA ENERGY ZAMBIA
13.6%
3.6%
4.5%
4.9%
5.7%
8.2%
8.4%
25.3%
25.7%
14.8%
3.5%
4.9%
3.9%
5.7%
8.9%
8.6%
25.3%
24.4%
2015
2014

Energy Regulation Board
Energy Sector Report 201542
Figure 3-10 Market share for Jet A-1 in 2014 and 2015
The other two OMCs that deal in Jet A-1, namely: Mount Meru and Oryx, only commanded a total market share of 0.4 percent in 2015.
3.6.3 Market share for Lubricants
During 2015, the total number of companies dealing in lubricants and licensed by the ERB was 13. In 2015, Spectra Oil Zambia had the highest market share for lubricants at 26.0 percent representing an increase of 1.8 percentage points from 24.2 percent in 2014. This was followed by Puma Energy whose market share had reduced to 23.4 percent from 27.5 percent in 2014. Engen Petroleum Zambia was next in the hierarchy with a market share of 17.3 percent followed by Total Limited at 14.7 percent. The market share of these companies during the period under review is shown in Figure 3-11.
Figure 3-11: Market share for lubricants in 2014 and 2015
SGC Investments, Dana Oil Corporation and Fuchs Zambia had a market share of 6.7 percent, 5.3 percent and 4.4 percent respectively. The other OMCs that deal in lubricants, only commanded a total market share of 2.2 percent in 2015.
MOUNT MERU
ORYX OIL ZAMBIA LTD
TOTAL (Z) LIMITED
PUMA ENERGY ZAMBIA
0.2%
2.7%
32.5%
64.6%
0.40%
0.00%
43.5%
56.1%
2015
2014
OTHER
DANA OIL CORPORATION LIMITED
SGC INVESTMENTS
FUCHS ZAMBIA
TOTAL (Z) LIMITED
ENGEN PETROLEUM
SPECTRA OIL ZAMBIA
PUMA ENERGY ZAMBIA
2.6%
3.5%
4.6%
16.8%
20.7%
24.2%
27.5%
2.2%
5.3%
6.7%
4.4%
14.7%
17.3%
26.0%
23.4%
2015
2014
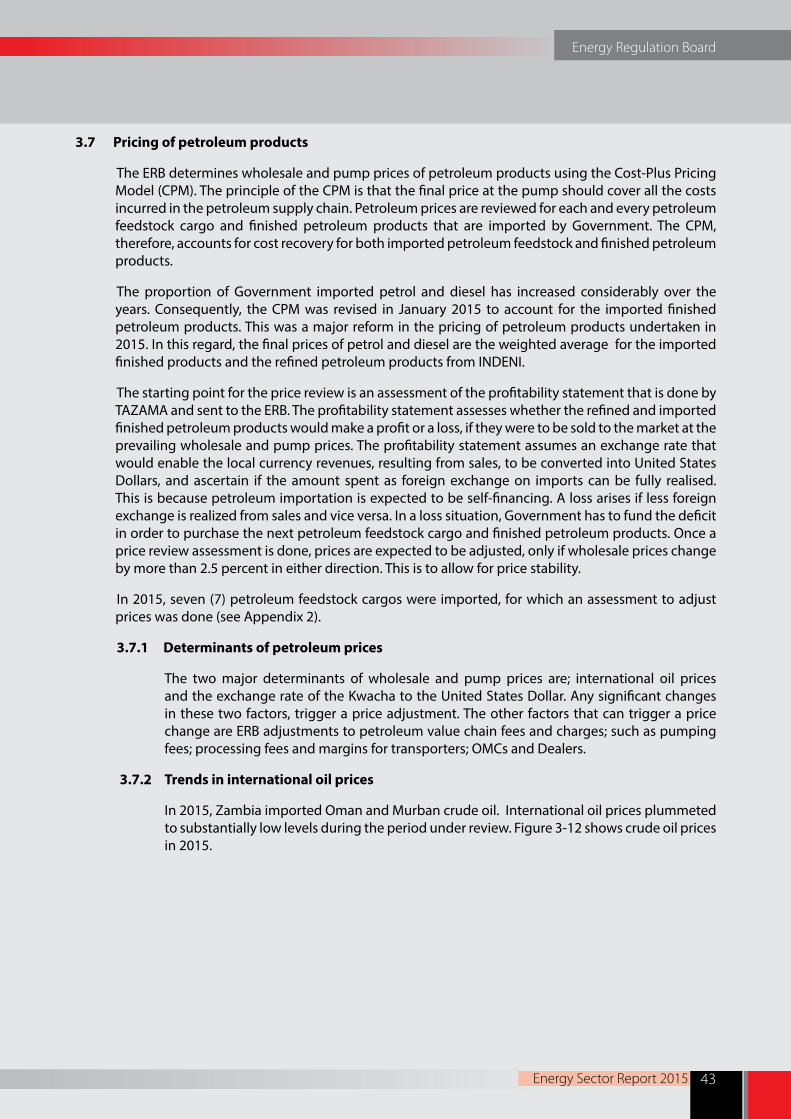
Energy Regulation Board
Energy Sector Report 2015 43
3.7 Pricing of petroleum products
The ERB determines wholesale and pump prices of petroleum products using the Cost-Plus Pricing Model (CPM). The principle of the CPM is that the final price at the pump should cover all the costs incurred in the petroleum supply chain. Petroleum prices are reviewed for each and every petroleum feedstock cargo and finished petroleum products that are imported by Government. The CPM, therefore, accounts for cost recovery for both imported petroleum feedstock and finished petroleum products.
The proportion of Government imported petrol and diesel has increased considerably over the years. Consequently, the CPM was revised in January 2015 to account for the imported finished petroleum products. This was a major reform in the pricing of petroleum products undertaken in 2015. In this regard, the final prices of petrol and diesel are the weighted average for the imported finished products and the refined petroleum products from INDENI.
The starting point for the price review is an assessment of the profitability statement that is done by TAZAMA and sent to the ERB. The profitability statement assesses whether the refined and imported finished petroleum products would make a profit or a loss, if they were to be sold to the market at the prevailing wholesale and pump prices. The profitability statement assumes an exchange rate that would enable the local currency revenues, resulting from sales, to be converted into United States Dollars, and ascertain if the amount spent as foreign exchange on imports can be fully realised. This is because petroleum importation is expected to be self-financing. A loss arises if less foreign exchange is realized from sales and vice versa. In a loss situation, Government has to fund the deficit in order to purchase the next petroleum feedstock cargo and finished petroleum products. Once a price review assessment is done, prices are expected to be adjusted, only if wholesale prices change by more than 2.5 percent in either direction. This is to allow for price stability.
In 2015, seven (7) petroleum feedstock cargos were imported, for which an assessment to adjust prices was done (see Appendix 2).
3.7.1 Determinants of petroleum prices
The two major determinants of wholesale and pump prices are; international oil prices and the exchange rate of the Kwacha to the United States Dollar. Any significant changes in these two factors, trigger a price adjustment. The other factors that can trigger a price change are ERB adjustments to petroleum value chain fees and charges; such as pumping fees; processing fees and margins for transporters; OMCs and Dealers.
3.7.2 Trends in international oil prices
In 2015, Zambia imported Oman and Murban crude oil. International oil prices plummeted to substantially low levels during the period under review. Figure 3-12 shows crude oil prices in 2015.
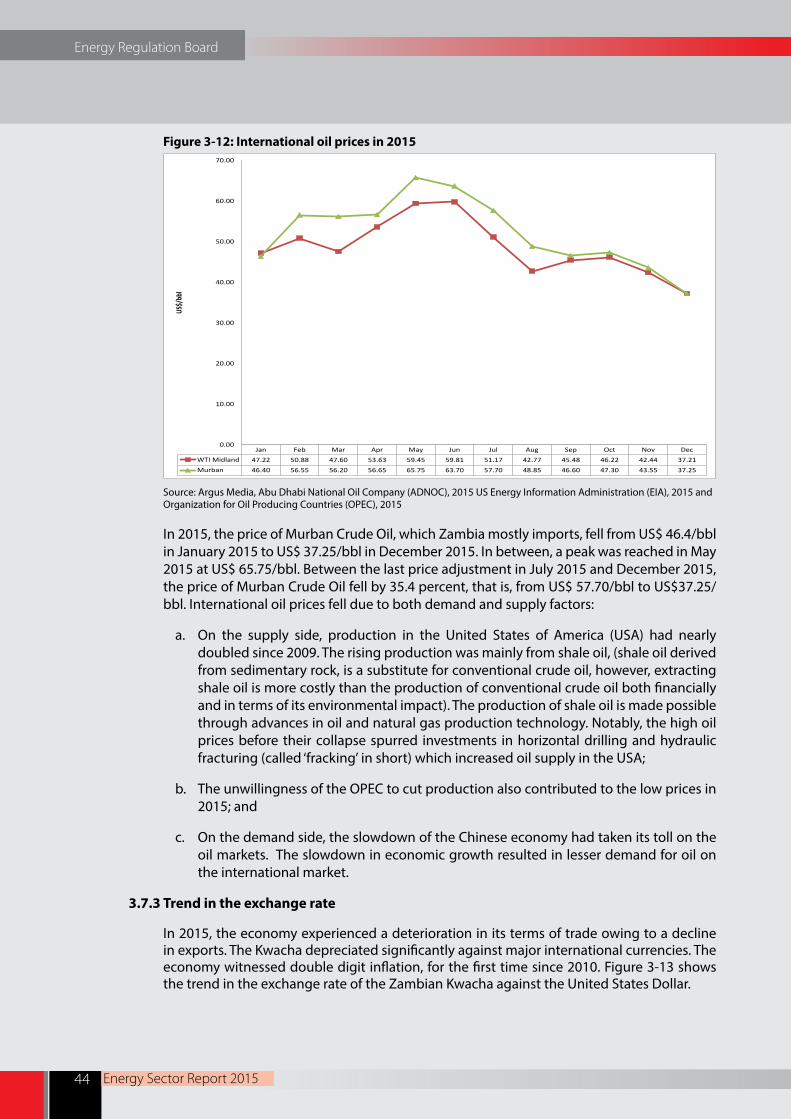
Energy Regulation Board
Energy Sector Report 201544
Figure 3-12: International oil prices in 2015
Source: Argus Media, Abu Dhabi National Oil Company (ADNOC), 2015 US Energy Information Administration (EIA), 2015 and Organization for Oil Producing Countries (OPEC), 2015
In 2015, the price of Murban Crude Oil, which Zambia mostly imports, fell from US$ 46.4/bbl in January 2015 to US$ 37.25/bbl in December 2015. In between, a peak was reached in May 2015 at US$ 65.75/bbl. Between the last price adjustment in July 2015 and December 2015, the price of Murban Crude Oil fell by 35.4 percent, that is, from US$ 57.70/bbl to US$37.25/bbl. International oil prices fell due to both demand and supply factors:
a. On the supply side, production in the United States of America (USA) had nearly doubled since 2009. The rising production was mainly from shale oil, (shale oil derived from sedimentary rock, is a substitute for conventional crude oil, however, extracting shale oil is more costly than the production of conventional crude oil both financially and in terms of its environmental impact). The production of shale oil is made possible through advances in oil and natural gas production technology. Notably, the high oil prices before their collapse spurred investments in horizontal drilling and hydraulic fracturing (called ‘fracking’ in short) which increased oil supply in the USA;
b. The unwillingness of the OPEC to cut production also contributed to the low prices in 2015; and
c. On the demand side, the slowdown of the Chinese economy had taken its toll on the oil markets. The slowdown in economic growth resulted in lesser demand for oil on the international market.
3.7.3 Trend in the exchange rate
In 2015, the economy experienced a deterioration in its terms of trade owing to a decline in exports. The Kwacha depreciated significantly against major international currencies. The economy witnessed double digit inflation, for the first time since 2010. Figure 3-13 shows the trend in the exchange rate of the Zambian Kwacha against the United States Dollar.
Jan Feb Mar Apr May Jun Jul Aug Sep Oct Nov DecWTI Midland 47.22 50.88 47.60 53.63 59.45 59.81 51.17 42.77 45.48 46.22 42.44 37.21Murban 46.40 56.55 56.20 56.65 65.75 63.70 57.70 48.85 46.60 47.30 43.55 37.25
0.00
10.00
20.00
30.00
40.00
50.00
60.00
70.00
US$/
bbl

Energy Regulation Board
Energy Sector Report 2015 45
Figure 3-13: Interbank exchange rate in 2015
Source: Bank of Zambia, 2015
The Kwacha depreciated by 25.0 percent, from K6.47/US$ to K8.09/US$ between January and August 2015, while between September and December 2015, the Kwacha depreciated by 6.3 percent, from K10.20/US$ to K10.84/US$. Notably, the Kwacha depreciated significantly by 48.57 percent between August and October 2015, owing to the highest trade imbalance recorded in October, 2015.
In particular, between January and December, 2015, the Zambian Kwacha depreciated by 67.5 percent from K6.47/US$ to K10.84/US$. The depreciation of the Kwacha was mainly caused by the following domestic and international factors:
a. The country’s deteriorating trade imbalance in 2015. The country recorded the highest ever trade deficit of K2.59 billion in October, 2015;
b. The slowdown in the Chinese economy which accounts for 40 percent of global copper consumption, contributed immensely to the collapse of the price of copper. The price of copper collapsed to a six-year low, below US$5,000/MT in August 2015, for the first time since July 2009. The copper price continued below this level for most of 2015. Notably, copper exports account for the bulk of foreign exchange earnings for the country; and
c. The speculative behaviour on the anticipated interest rate hike by the Fed of the USA in September, 2015 for the first time since 2006 led to the systematic net outflows of capital from emerging markets to the United States, resulting in the strengthening of the US Dollar against other currencies including, the Kwacha. The Fed eventually raised the interest rate in December 2015, by 0.25 percent.
3.7.3.1 Trends in international oil prices and exchange rates
With regard to the domestic product petroleum prices, the movement of the international oil prices and exchange rate in the opposite direction means that the gains that could have resulted from falling international oil prices were eroded by the weakening Kwacha against the United States Dollar. Figure 3-14 shows the movements in international oil prices and the Kwacha exchange rate against the United Stated Dollar.
6.47
6.75
7.34 7.41 7.26 7.33
7.67
8.09
10.20
12.02 12.18
10.84
5.40
6.40
7.40
8.40
9.40
10.40
11.40
12.40
13.40
Jan-15 Feb-15 Mar-15 Apr-15 May-15 Jun-15 Jul-15 Aug-15 Sep-15 Oct-15 Nov-15 Dec-15
ZMW
/USD

Energy Regulation Board
Energy Sector Report 201546
Figure 3-14: Trends in international oil prices and exchange rate in 2015
Source: Argus Media, Abu Dhabi National Oil Company (ADNOC), 2015 US Energy Information Administration (EIA), 2015, Organization for Oil Producing Countries (OPEC), 2015 and Bank of Zambia, 2015.
International oil prices experienced significant reductions throughout 2015. From January to December 2015 the price of crude oil (Murban) fell by 19.7 percent, that is, from US$46.40/bbl to US$37.25/bbl. During the same period, the Kwacha experienced historically high depreciation against major international currencies. Specifically, between January and December, 2015, the Zambian Kwacha depreciated by 67.5 percent, from K6.47/US$ to K10.84/US$.
At the last upward fuel price adjustment in July 2015, the ERB used an exchange rate of K7.80/US$. After this adjustment, the Kwacha became extremely volatile, especially in the third quarter, when it depreciated steeply by 33 percent, from K7.67/US$ in July 2015 to K10.20/US$ in September 2015, when the next petroleum feedstock cargo was purchased.
As a result of falling international oil prices, there was public expectation of a reduction in wholesale and pump prices, consistent with the principles of the CPM. However, no adjustment was made to the pump price, because while international oil prices had significantly fallen, the Kwacha had experienced substantial depreciation that cancelled any benefit or gains that could have reflected in reduced wholesale and pump prices. With such extreme exchange rate volatility, principally, it would have been imprudent to adjust prices in any direction, not until the movement of the exchange rate was certain and predictable.
3.8 Transport Differentials
During the year under review, the ERB continued to use the Uniform Pump Pricing (UPP) framework that entails that the national pump price for petrol, diesel, kerosene and low sulphur gasoil sold at the retail level is the same throughout the country. Prior to the introduction of the UPP in September 2010, the cost of petrol, diesel and kerosene at retail sites furthest from the Ndola Fuel Terminal (NFT), was higher than the price obtaining at sites closer to the terminal.
Jan Feb Mar Apr May Jun Jul Aug Sep Oct Nov DecWTI Midland 47.22 50.88 47.60 53.63 59.45 59.81 51.17 42.77 45.48 46.22 42.44 37.21Murban 46.40 56.55 56.20 56.65 65.75 63.70 57.70 48.85 46.60 47.30 43.55 37.25Exchange Rate 6.47 6.75 7.34 7.41 7.26 7.33 7.67 8.09 10.20 12.02 12.18 10.84
3.0
4.0
5.0
6.0
7.0
8.0
9.0
10.0
11.0
12.0
13.0
30.00
35.00
40.00
45.00
50.00
55.00
60.00
65.00
70.00
K/US$ US/bbl

Energy Regulation Board
Energy Sector Report 2015 47
The UPP is administered through a transport cross subsidy mechanism. OMCs or independent dealers delivering fuel to retail sites near a national fuel wholesaling facility (i.e. NFT or Fuel Storage Depot) are required to remit the transport differential for each litre of fuel into the UPP fund. OMCs or independent dealers delivering fuel to sites far from a national fuel wholesaling depot are reimbursed the transport differential for each litre of fuel delivered.
The transportation cost in the price build-up of petrol, diesel and kerosene is kept constant for all the districts. This is done by calculating ‘adjustors’ or ‘differentials’ for each district in the country. These differentials are added to the actual transport cost for each litre of fuel to have a uniform cost in the price build-up for each district. This is shown in the formula below:
Differential = Actual Transport Cost - Transportation Cost in Price Build-Up
The differential may be positive (OMC pays into the UPP Fund) or negative (OMC claims from the UPP Fund). As the differentials are calculated based on the national point of distribution of fuel, the differentials have to be calculated each time a new national fuel wholesaling point is commissioned. This implies that when a fuel storage depot is commissioned, the differentials have to be calculated for all the districts to be supplied fuel from the fuel storage depot.
During the year under review, the ERB computed the transport differentials to support the operations of Solwezi District, whose depot was commissioned in December, 2015. Previously, the ERB had required OMCs to uplift fuel from the fuel distribution hub designated for each particular district. Each district was required to source its fuel from the national fuel terminal/depot nearest to it. However, recent logistical challenges have made it necessary for the OMCs to be able to uplift fuel from non-designated distribution hubs that have petroleum products in stock. In such cases, the ERB has computed transport differentials for such operations.
3.8.1 Margins review
In September, 2015, the ERB revised the transport margins for Transporters by 37.0 percent effective that month. The increase followed the recommendations of a study concluded in 2014. The study was steered by a committee comprising the following: ERB, Department of Energy, selected OMCs, Petroleum Transporters Association of Zambia (PTAZ), UPP Manager and representatives of rural and urban Dealers. Apart from transport margins, the study also recommended adjustment to the OMC and Dealer margins. However, by the end of 2015, the margins for OMCs had not been adjusted.
The implementation of the downstream margins increase was phased to avoid a significant impact on the pump price. Notably, the transporter margin increase was achieved by use of the UPP Fund such that there was no impact at the pump price.
The next phase will consider revising margins for OMCs and Dealers. The implementation of new margins for OMCs and Dealers is expected to provide them with the necessary revenue required to meet the increased cost of doing business.
3.8.2 Strategic Reserve Fund
The Strategic Reserve Fund (SRF) was introduced in 2005, to finance the procurement of the Strategic Petroleum Reserves (SPRs).
The SRF is financed through a cost-line in the price build-up of petroleum products. The SRF fee is charged at the rate of K0.15/litre for petrol, diesel, kerosene and jet A-1, and K0.15/kg for HFO and LPG. The OMCs collect and remit the SRF fees to the ERB.

Energy Regulation Board
Energy Sector Report 201548
The SRF has mainly been used to finance the development of petroleum infrastructure such as the provincial fuel depots that have been commissioned in Lusaka, Mpika, Solwezi and soon to be commissioned in Mongu. Other uses of the SRF in the past included:
a. Importation of finished petroleum products;
b. Road works around fuel storage depots;
c. Rehabilitation of fuel tanks at storage depots; and
d. Rehabilitation of upstream infrastructure, for example, the bitumen plant at INDENI.
3.8.3 National fuel pump prices
In 2015, the ERB made three (3) adjustments to the pump prices. Pump prices were reduced in January and increased in May and July. The price reduction in January was caused by falling international oil prices and a stable exchange rate of the Kwacha to the United States Dollar. Meanwhile, the price increases in May and July were caused by the depreciation of the Kwacha against the United States Dollar. The quantum of the three (3) price adjustments is depicted in Figure 3-15. Meanwhile, Appendices 3 and 4 shows the wholesale and pump price build-ups, respectively.
Figure 3-15: Fuel pump price adjustments in 2015
3.8.4 Trends in domestic fuel pump prices
Figure 3-16 shows the trends in the domestic fuel pump prices for petrol, diesel and kerosene. The domestic pump prices for the three commodities have generally increased during the period 2000 to 2015. The price increases were gradual from 2000 to 2008, however, beyond 2009 the price increases were steeper. One of the factors that contributed to the steep increase was the removal of subsidies by Government in 2013. The prices of petrol, diesel and kerosene closed the year at K9.87, K8.59 and K6.12 respectively in 2015.
0.00
1.00
2.00
3.00
4.00
5.00
6.00
7.00
8.00
9.00
10.00
Petrol Diesel KeroseneJan 7.60 6.59 4.69May 8.74 7.59 5.40July 9.87 8.59 6.12
K/Litre

Energy Regulation Board
Energy Sector Report 2015 49
Figure 3-16 : Trends in the domestic fuel pump prices, 2000 - 2015
Note: prices used are for end year
3.8.5 Fuel pump prices in selected African countries
Figure 3-17 shows a comparison of average pump prices of petrol, diesel and kerosene in US$ per litre in 2015, for selected countries in the region. It is noted that different countries have different supply options (crude vs finished products), pricing regimes, levies and tax structures, and policy instruments such as subsidies, that account for the different prices.
Figure 3-17: Regional prices of petrol, diesel and kerosene in US Dollars19 in 2015
Generally, the price of petrol was higher than that of diesel in most countries, except in Malawi and Namibia. The price of petrol was highest in Zimbabwe, followed by Malawi and Kenya. Meanwhile, the price of diesel was highest in Malawi, followed by Zimbabwe. Notably, the price of diesel in Tanzania was higher than that of Zambia. Further, the price
19 Prices for petrol and diesel in figures 5 are for the year end (December 2015)
2000 2001 2002 2003 2004 2005 2006 2007 2008 2009 2010 2011 2012 2013 2014 2015Petrol 3.40 3.34 3.53 3.75 4.91 5.12 5.40 7.19 5.82 5.82 7.64 8.16 8.16 9.91 9.89 9.87Diesel 3.38 3.32 2.91 3.19 4.42 4.77 4.97 6.00 5.48 5.48 7.00 7.57 7.57 9.20 9.19 8.59Kerosene 1.85 2.02 2.35 2.40 3.43 3.51 3.92 4.39 3.83 3.83 5.01 5.15 5.15 6.83 6.77 6.12
0.00
2.00
4.00
6.00
8.00
10.00
12.00
Fuel
price
(K)
-
0.50
1.00
1.50
2.00
2.50
Malawi Zambia South Africa Zimbabwe Kenya Tanzania NamibiaPrice of Petrol (US$) 1.16 0.91 0.86 1.30 1.03 0.92 0.74
Price of Diesel (US$) 1.20 0.79 0.77 1.14 0.77 0.85 0.74
Price of Kerosene (US$) 0.94 0.56 0.48 0.94 0.52 0.82 2.15
US$/
Litre
s

Energy Regulation Board
Energy Sector Report 201550
of kerosene was highest in Namibia, followed by Malawi and Zimbabwe. Meanwhile, the price of kerosene in Zambia was third lowest. Despite being landlocked, Zambia’s price of petroleum products in 2015 was relatively lower in comparison to some countries in the region which are on the coastline.
3.8.6 Price support
Price support, in cases where the landed cost of imported petroleum products was higher, than the TAZAMA wholesale price, was sometimes given to OMCs when they were authorised by MEWD to import finished petroleum products, particularly Jet A-1. Thus, Government through MEWD would compensate the OMCs in instances where they made losses when importing Jet A-1. In 2015, the ERB audited four (4) price support claims. However, the Government discontinued with price support, effective 1st July 2015.
3.8.7 Development of technical standards
In 2015, the ERB working in collaboration with Zambia Bureau of Standards (ZABS) and in consultation with other stakeholders concluded the development of the following Zambian Standards (ZS):
a. ZS 385: The Petroleum Industry – Code of Practice
Part 1: Storage and distribution of petroleum products in above-ground bulk installations;
Part 2: Electrical installations in the distribution and marketing sector;
Part 3: The installation of underground storage tanks, pumps/dispensers and pipework at service stations and consumer installations; and
Part 4: Above-ground Containerised Tank Installation.
b. ZS 703: Rural Filling Station Specifications.
c. ZS 908: Biogas Systems – Code of practise
Part 1: Bio-gas Design, Installation, Operation and Maintenance of Biogas Systems; and
Part 2: Bio-gas Microgrids.
d. ZS 867: Bio-diesel Fuel Blend Quality Standard for Automotive Compression Ignition Engines.
e. ZS 868: Bio-ethanol Fuel Blend Quality Standard for Automotive Spark Ignition Engines.
f. ZS 869: Blending, Handling and Usage of Biofuels – Code of Practice.
3.9 Challenges in the petroleum sub-sector
During the year under review, the key challenges in the petroleum sub-sector were the following: irregular fuel supply, illegal fuel vending and contamination of petroleum feedstock.

Energy Regulation Board
Energy Sector Report 2015 51
3.9.1 Irregular fuel supply
In 2015, the country experienced isolated incidences of fuel shortages. These shortages usually occurred when there was a disruption in the fuel supply system. To manage the risk, the ERB, Government and other stakeholders started the process of reviewing the current fuel supply system in order to agree on the most sustainable supply options.
3.9.2 Illegal fuel vending
During 2015, the country continued to experience cases of illegal fuel vending in various parts of the country especially in rural areas. The sale of illegal fuel continued and was of major source of concern to the public. The major factors fuelling illegal fuel vending activities among others are:
a. Lack of service stations in certain areas particularly in rural settings;
b. Cheaper sources of fuel across some border towns; and
c. Alleged misconduct by some petroleum tanker drivers who siphon fuel from tanks which are in transit to filling stations or other countries.
In 2015, the ERB undertook the following measures to curb these vices:
a. Undertook an aggressive sensitisation programme to increase awareness of the general public on the dangers of fuel procured from illegal vendors (from a health, safety, environmental and quality perspective);
b. Devised collaborative compliance and enforcement mechanisms with all associated stakeholders such as the Police, Drug Enforcement Commission (DEC), the Road Traffic Safety Agency (RTSA), Zambia Revenue Authority (ZRA), ZEMA and others; and
c. Engaged with Government on the possibility of setting up an energy fund to encourage the establishment of rural and community based service stations.
3.9.3 Contamination of petroleum feedstock
During the year under review, the country experienced incidences of poor quality petroleum feedstock. Specifically, in June 2015, Government was supplied with petroleum feedstock that was contaminated with organic chlorides. This particular feedstock threatened the operations of the refinery and consequently led to the shutdown of the refinery and the resultant fuel shortage in the country. Going forward, within 2015, the Government undertook several measures, the key one being the appointment of an independent inspector who would ensure that contaminated petroleum feedstock is detected either at the loading port in the Middle East and/or before the petroleum feedstock is offloaded into the TAZAMA tank farm in Dar-es-Salaam. Further, it is expected that the measures adopted by Government would ensure that punitive measures are taken against any supplier of contaminated petroleum feedstock.
Energy Regulation Board
Energy Sector Report 201552
3.10 Prospects for 2016
In 2016, the petroleum sub-sector is expected to experience significant developments such as the following:
3.10.1 Low international oil prices
It is expected that international oil prices will remain low and exhibit a similar pattern as in 2015, owing to the continued unwillingness by OPEC, to intervene and cut production of crude oil. Further, the lifting of trade sanctions on Iran, expected in 2016, is also expected to lead to increased production and export of crude oil to the global market and therefore increase supply that would lead to suppressed prices.
3.10.2 Implementation of Fuel Marking Programme
Fuel adulteration with low grade fuels and other substances, and dumping with tax – free transit or export fuels possess serious threats to Government revenues and compromises the quality of fuel for the consumers. In light of the foregoing, the ERB has engaged a consulting firm to undertake fuel marking services beyond 2015.
3.10.3 New pricing framework for Jet A-1 using Import Parity Pricing
In 2015, the ERB held consultative meetings with the key stakeholders to agree on the way forward with regard to the pricing of Jet A-1. This followed complaints, particularly by the airline industry, that the CPM that was being used for pricing Jet A-1 was not favourable for their operations. They proposed that the ERB, instead adopts the Import Parity Pricing Model. Pricing using the Import Parity Pricing model, would promote maximum efficiency in the supply chain for Jet A-1, while ensuring that the domestic prices of Jet A-1 reflect the cost trends of the product on the international market. This would also enable consumers to pay fair prices for fuel, while allowing OMCs to generate sufficient income to operate viably. In 2015, the ERB and the stakeholders agreed that the Import Parity Pricing model shall be used to price Jet A-1 in the near future.

Energy Regulation Board
Energy Sector Report 2015 53
20 Dry Season April to September21 Dry Season October to March the following year22 The transmission losses KPI will only be monitored and will not form part of the scoring23 Kafue Gorge, Kariba North Bank, and Victoria Falls power plants24 Lusiwasi, Musonda Falls, Chishimba, Lunzua and Shiwang’andu power plants
APPENDICES
Appendix 1: ZESCO’s KPI framework, October 2014 - December 2016
KPI Details Assigned Weight
Customer Metering
i. All new connections are metered upon connection;ii. Zero unmetered customers from April 2014 onwards;iii. Quotations for all types of connections must be issued within 30 days from
the date of application; and iv. All new standard residential connection to supply must be done within 30
days upon payment.
10%
Cash Management
i. Reduce non-GRZ debtor days to not more than 60 days; andii. Reduce GRZ debtor days to not more than 90 days.
20%
Staff productivity
i. Maintain the Corporate customer employee ratio of 100:1;ii. Maintain the Lusaka division customer employee ratio of 100:1;iii. Maintain the Copperbelt division customer employee ratio of 100:1;iv. Maintain the Northern division customer employee ratio of 100:1;v. Maintain the Southern division customer employee ratio of 100:1; andvi. Reduce staff costs to 45% as a share of operations and maintenance costs.
15%
Quality of Service Supply
i. Maintain the Dry Season (DS)20System Average Interruption Duration Index (SAIDI) at 27 hours or less and Wet Season (WS)21 SAIDI at 36 hours or less;
ii. Maintain the DS System Average Interruption Frequency Index (SAIFI) at 5 times or less and WS-SAIFI at 5.5 times or less;
iii. Maintain the DS-Customer Average Interruption Duration Index (CAIDI) at 5 hours or less and WS-CAIDI at 7 hours or less; and
iv. Maintain the Average System Availability Index (ASAI) at 90% or better.
20%
System losses i. Maintain Transmission losses at 5% or less22; andii. Maintain distribution Losses at 12% or better, per quarter.
10%
Power Generation
i. Maintain the Unit Capability Factor (UCF) for large hydro plants23 at 80% or better per quarter; and
ii. Maintain the UCF for Mini hydro plants24 at 60% or better per quarter.
10%
Safety i. Achieve Zero fatality per quarter; andii. Achieve Zero Lost Time Injury (LTI) per quarter.
5%
Customer Complaints
i. Replacement of faulty Meters must be done within 5 days after a complaint is lodged; and
ii. Maintain a total customer complaint resolution rate of 90% or better per quarter.
10%
Total 100%

Energy Regulation Board
Energy Sector Report 201554
Appendix 2: Petroleum feedstock imports in 2014 and 2015
Cargo Name Month Tonnage in metric tonnes
MT. Sharp Lady March 2014 92,419
MT. Lovinna May 2014 96,202
MT. Ambrosia June 2014 95,895
MT. Euro Strength August 2014 92,748
MT. Samos September 2014 89,060
MT. Phoenix Beta December 2014 93,592
Total 559,916
MT. Euro Strength II January 2015 92,900
MT. Euro Strength III March 2015 92,600
MT. Phoenix Concord April 2015 90,000
MT. Ambrosia June 2015 91,903
MT. Spike July 2015 89,100
MT. Nectar September 2015 95,187
MT. Alberta December 2015 91,490
Total 643,180
Appendix 3: Wholesale price build-up
Cost Element Unit Cost Basis
Cost-Insurance-Freight (CIF) Contract/Supplier Invoice
Ocean Losses 0.30% Best Practice
Wharfage 1.25% Tanzanian Harbour Authority
Finance Charges 4.00% Financier
Collateral Manager (US$/MT) 0.39 Stock Monitoring Agreement
Insurance 0.15% Insurer
TAZAMA Storage Fee (US$/MT) 2.00 TAZAMA
TAZAMA Pumping Fee (US$/MT) 54.00 Approved ERB Pumping Tariff
TAZAMA Pipeline Losses 1.48% Determined by ERB
Agency Fee (US$/MT) 5.00 Agency Agreement
Refinery Fee (US$/MT) 60.38 Approved ERB Processing Fee
Refinery Processing Losses 9% Determined by ERB
Terminal Losses (LPG, Petrol, Diesel/Kerosene/Jet A-1 respectively) 1%, 0.5%, 0.3% Best Practice
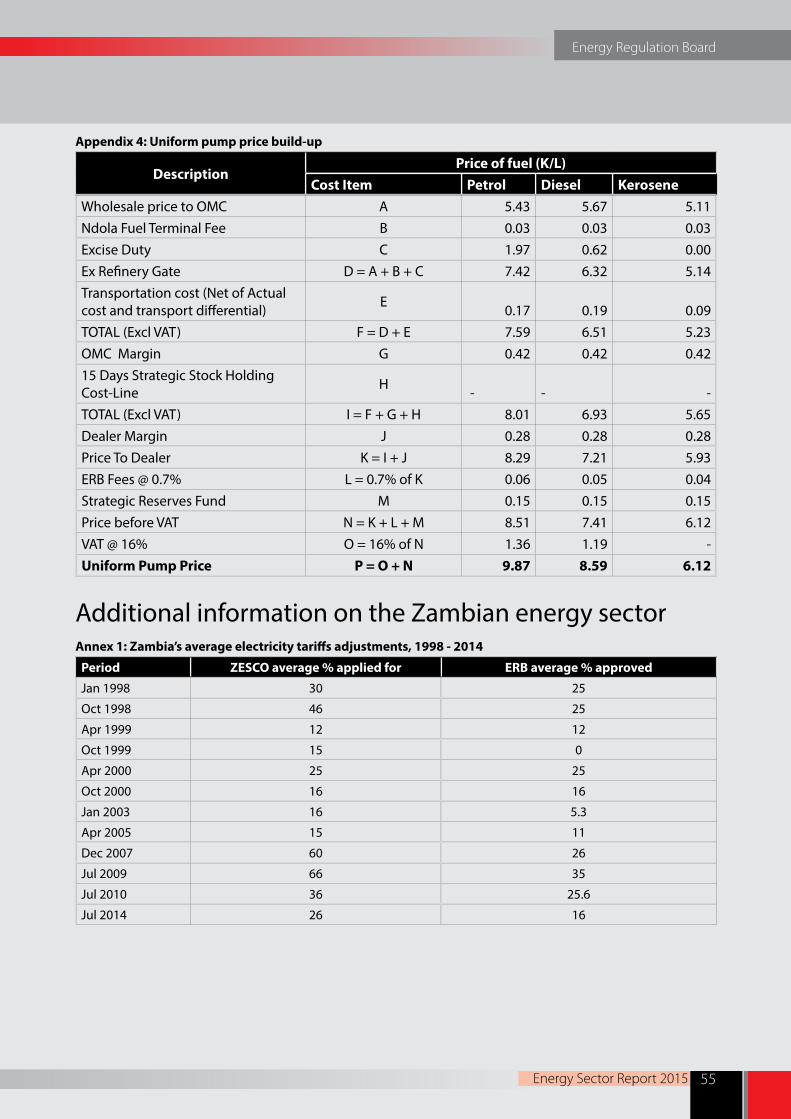
Energy Regulation Board
Energy Sector Report 2015 55
Appendix 4: Uniform pump price build-up
DescriptionPrice of fuel (K/L)
Cost Item Petrol Diesel KeroseneWholesale price to OMC A 5.43 5.67 5.11Ndola Fuel Terminal Fee B 0.03 0.03 0.03Excise Duty C 1.97 0.62 0.00Ex Refinery Gate D = A + B + C 7.42 6.32 5.14Transportation cost (Net of Actual cost and transport differential) E 0.17 0.19 0.09TOTAL (Excl VAT) F = D + E 7.59 6.51 5.23OMC Margin G 0.42 0.42 0.4215 Days Strategic Stock Holding Cost-Line H - - -TOTAL (Excl VAT) I = F + G + H 8.01 6.93 5.65Dealer Margin J 0.28 0.28 0.28Price To Dealer K = I + J 8.29 7.21 5.93ERB Fees @ 0.7% L = 0.7% of K 0.06 0.05 0.04Strategic Reserves Fund M 0.15 0.15 0.15Price before VAT N = K + L + M 8.51 7.41 6.12VAT @ 16% O = 16% of N 1.36 1.19 - Uniform Pump Price P = O + N 9.87 8.59 6.12
Additional information on the Zambian energy sectorAnnex 1: Zambia’s average electricity tariffs adjustments, 1998 - 2014
Period ZESCO average % applied for ERB average % approved
Jan 1998 30 25
Oct 1998 46 25
Apr 1999 12 12
Oct 1999 15 0
Apr 2000 25 25
Oct 2000 16 16
Jan 2003 16 5.3
Apr 2005 15 11
Dec 2007 60 26
Jul 2009 66 35
Jul 2010 36 25.6
Jul 2014 26 16
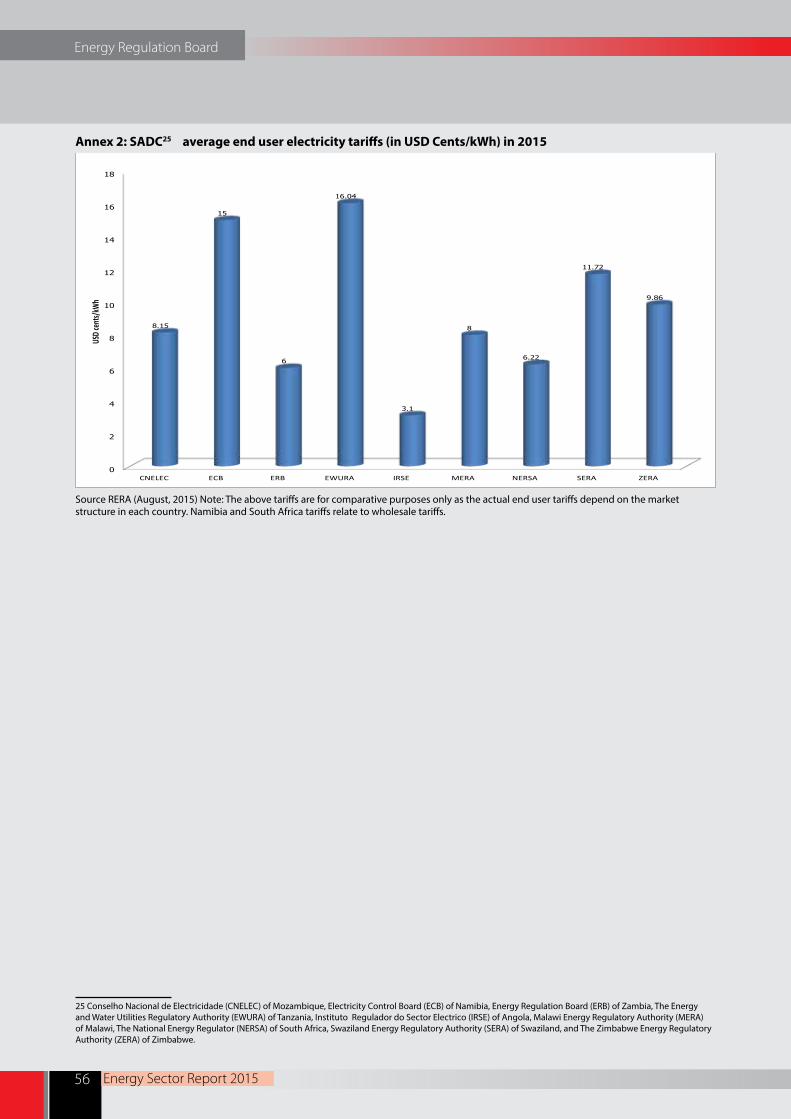
Energy Regulation Board
Energy Sector Report 201556
Annex 2: SADC25 average end user electricity tariffs (in USD Cents/kWh) in 2015
Source RERA (August, 2015) Note: The above tariffs are for comparative purposes only as the actual end user tariffs depend on the market structure in each country. Namibia and South Africa tariffs relate to wholesale tariffs.
25 Conselho Nacional de Electricidade (CNELEC) of Mozambique, Electricity Control Board (ECB) of Namibia, Energy Regulation Board (ERB) of Zambia, The Energy and Water Utilities Regulatory Authority (EWURA) of Tanzania, Instituto Regulador do Sector Electrico (IRSE) of Angola, Malawi Energy Regulatory Authority (MERA) of Malawi, The National Energy Regulator (NERSA) of South Africa, Swaziland Energy Regulatory Authority (SERA) of Swaziland, and The Zimbabwe Energy Regulatory Authority (ZERA) of Zimbabwe.
0
2
4
6
8
10
12
14
16
18
CNELEC ECB ERB EWURA IRSE MERA NERSA SERA ZERA
8.15
15
6
16.04
3.1
8
6.22
11.72
9.86
USD c
ents/
kWh

Energy Regulation Board
Energy Sector Report 2015 57
Annex 3: Licensing procedures
The following are the current licensing procedures:
1 Once an applicant lodges a licence application, the Legal department assesses the application to determine whether the activity applied for is one that requires to be licensed under the Energy Regulation Act and Electricity Act and to verify whether or not a licence application is complete;
2 Upon being satisfied that an application has been duly lodged and that the activity applied for is one authorized by the relevant legislation, the application is forwarded to the Directorate of Technical Regulation for a technical assessment of the licence application;
3 Where an application is not duly lodged or the activity applied for is not regulated by the ERB, the applicant is informed in writing of any additional information required or the fact that the activity applied for is not subject to regulation;
4 Where an application has been forwarded to the Directorate of Technical Regulation, a technical assessment of the application is carried out by way of inspection of the Applicant’s energy facility in order to determine whether or not the applicant is technically capable of carrying out the activity applied for;
5 Once the technical assessment of the application is successful, the application is forwarded to the Directorate of Economic Regulation for the carrying out of a financial assessment of the application to determining the licence application fee;
6 In the event that the technical assessment of an application is not successful, the Applicant is notified of the technical anomalies of the energy facility inspected which need to be addressed before a financial assessment is carried out;
7 It is worth noting that the purpose of a financial assessment of a licence application is to determine the financial capability of the applicant to carry out the licensed activity and to determine the licence application fee for the activity applied for;
8 The application is, where a financial assessment is successful, subsequently referred to the Executive Director for approval of the licence application fee;
9 After the Executive Director approves the licence application fee, the application is submitted to the Director of Finance and Administration who causes an invoice to be issued to the applicant;
10 Once an invoice is issued, the applicant is notified in writing of the licence application fee to be paid to the MoF (Ministry of Finance) – Energy Regulation Board (ERB) Revenue Account within thirty (30) days of the date of receipt of the invoice;
11 Upon payment of the application fee, applicant is required to request for a provisional licence which is valid for six (06) months once issued. Thereafter, a notice of intention to issue a licence to the applicant for Executive Director’s approval is prepared and once approved, a search is conducted at PACRA for verification of shareholding/directorship before the Notice is published in the Government Gazette for thirty (30) days inviting members of the public to present objections (if any) to the issuance of a licence to the listed Applicants; and
12 In the event that there are no objections to the licence application gazetted, the Board approves the issuance of a standard licence to the applicant and the Board decision to issue or not to issue a licence is communicated to the applicant within fourteen (14) days of the date of the Board decision.
Additional licensing procedures relating to the revocation, refusal or renewal of a Licence are provided for under the Energy Regulation Act CAP 436 of the Laws of Zambia.

Energy Regulation Board
Energy Sector Report 201558
ENERGY REGULATION BOARD
ZESC
O’S
Maj
or H
ydro
-Pow
er P
lant
Kafu
e Go
rge
Pow
er P
lant
(990
MW
)Ka
riba
Nor
th B
ank
Pow
er P
lant
(72
0MW
)Vi
ctor
ia F
alls
Pow
er P
lant
(108
MW
) ZESC
O’s
Tran
smiss
ion
Syst
em33
0kV
& 22
0kV
ZESC
O’s
Sub-
trans
miss
ion
Syst
em22
0kV,
132
kV,
88kV
& 6
6kV
ZESC
O’s
Prim
ary
Dist
ribut
ion
33kV
ZESC
O’s
Dist
ribut
ion
Syst
em
Nor
th-W
este
rn E
nerg
yCo
mpa
ny(O
pera
ting
at 3
3kV)
Priv
atel
y ow
ned
com
pany
MIN
ES
ZAMB
IAN
ELEC
TRIC
AL P
OWER
SYS
TEM
OVER
VIEW
ZESCOʼ
s Ma
jor
Hydr
oPo
wer S
tatio
ns
?Ka
fue
Gorg
e Po
wer S
tatio
n (9
90MW
)?
Karib
a No
rth
Bank
Pow
er S
tatio
n (7
20MW
)?
Vict
oria
Falls
Pow
er S
tatio
n (1
08MW
)?
on?
Kafu
e Go
rge
Powe
r (9
90M
ZEZz
zzW
)?
Karib
a No
rth
Bank
Pow
er S
tatio
n (7
20MW
)?
Vict
oria
Falls
Pow
er S
tatio
n (1
08MW
)
Gene
ratio
nPla
nts
ZESC
OTr
ansm
issio
nSy
stem
330K
v &
220K
v
ZESC
OSu
b-tr
ansm
issio
n Sy
stem
220k
V, 1
32kV
, 88K
v&
66Kv
ZESCOʼs
Prim
ary
Dist
ribut
ion
33KV
ZESCOʼs
Dist
ribut
ion
syst
em
New
Proj
ects
Copp
erbe
lt En
ergy
Corp
orat
ion
(ope
ratin
g at
220
KV, 6
6KV
)Pr
ivate
Tra
nsm
issio
nCo
mpa
ny
Luns
emfw
a Hy
dro
Powe
r Com
pany
Luns
emfw
a &
Mulun
gush
i (58
MW)
Nort
h W
este
rn E
nerg
y Co
mpa
ny(O
pera
ting
at 3
3kV)
Priva
tely
owne
d co
mpa
ny
Zeng
amina
Pow
er C
ompa
ny(0
.75M
W)
New
The
rmal
Plant
s (M
aam
ba–
600M
W,E
MCO
–60
0MW
& NE
C–
50MW
)
Indu
stria
l, co
mm
ercia
l &do
mes
tic lo
ads
Islan
ded
/isol
ated
grid
Min
es
Expo
rt
ISLA
ND
ED/IS
OLA
TED
GRI
D
Maa
mba
– 6
00M
W,
EM
CO –
600
MW
NEW
PR
OJE
CTS
ZEN
GAM
INA
POW
ER C
OM
PAN
Y(0
.75M
W)
COPP
ERBE
LT E
NER
GYCO
RPO
RATI
ON
LTD
(ope
ratin
g at
220
KV, 6
6KV)
Priv
ate
tran
smiss
ion
com
pany
LUN
SEM
FWA
HYD
RO-P
OW
ERCO
MPA
NY
Luns
emfw
a an
d M
ulun
gush
i(5
6MW
)
EXPO
RT
ZAMB
IAN
ELEC
TRIC
AL P
OWER
SYS
TEM
OVER
VIEW
ZESCOʼ
s Ma
jor
Hydr
oPo
wer S
tatio
ns
?Ka
fue
Gorg
e Po
wer S
tatio
n (9
90MW
)?
Karib
a No
rth
Bank
Pow
er S
tatio
n (7
20MW
)?
Vict
oria
Falls
Pow
er S
tatio
n (1
08MW
)?
on?
Kafu
e Go
rge
Powe
r (9
90M
ZEZz
zzW
)?
Karib
a No
rth
Bank
Pow
er S
tatio
n (7
20MW
)?
Vict
oria
Falls
Pow
er S
tatio
n (1
08MW
)
Gene
ratio
nPla
nts
ZESC
OTr
ansm
issio
nSy
stem
330K
v &
220K
v
ZESC
OSu
b-tr
ansm
issio
n Sy
stem
220k
V, 1
32kV
, 88K
v&
66Kv
ZESCOʼs
Prim
ary
Dist
ribut
ion
33KV
New
Proj
ects
Copp
erbe
lt En
ergy
Corp
orat
ion
(ope
ratin
g at
220
KV, 6
6KV
)Pr
ivate
Tra
nsm
issio
nCo
mpa
ny
Luns
emfw
a Hy
dro
Powe
r Com
pany
Luns
emfw
a &
Mulun
gush
i (58
MW)
Zeng
amina
Pow
er C
ompa
ny(0
.75M
W)
New
The
rmal
Plant
s (M
aam
ba–
600M
W,E
MCO
–60
0MW
& NE
C–
50MW
)
Islan
ded
/isol
ated
grid
Min
es
IND
USTR
IAL,
COM
MER
CIAL
&D
OM
ESTI
C LO
ADS
ZAMB
IAN
ELEC
TRIC
AL P
OWER
SYS
TEM
OVER
VIEW
ZESCOʼ
s Ma
jor
Hydr
oPo
wer S
tatio
ns
?Ka
fue
Gorg
e Po
wer S
tatio
n (9
90MW
)?
Karib
a No
rth
Bank
Pow
er S
tatio
n (7
20MW
)?
Vict
oria
Falls
Pow
er S
tatio
n (1
08MW
)?
on?
Kafu
e Go
rge
Powe
r (9
90M
ZEZz
zzW
)?
Karib
a No
rth
Bank
Pow
er S
tatio
n (7
20MW
))
ZESC
OTr
ansm
issio
nSy
stem
330K
v &
220K
v
ZESC
OSu
b-tr
ansm
issio
n Sy
stem
220k
V, 1
32kV
, 88K
v&
66Kv
ZESCOʼs
Prim
ary
Dist
ribut
ion
33KV
ZESCOʼs
Dist
ribut
ion
syst
em
New
Proj
ects
Copp
erbe
lt En
ergy
Corp
orat
ion
(ope
ratin
g at
220
KV, 6
6KV
)Pr
ivate
Tra
nsm
issio
nCo
mpa
ny
Luns
emfw
a Hy
dro
Powe
r Com
pany
Luns
emfw
a &
Mulun
gush
i (58
MW)
Nort
h W
este
rn E
nerg
y Co
mpa
ny(O
pera
ting
at 3
3kV)
Priva
tely
owne
d co
mpa
ny
Zeng
amina
Pow
er C
ompa
ny(0
.75M
W)
New
The
rmal
Plant
s (M
aam
ba–
600M
W,E
MCO
–60
0MW
& NE
C–
50MW
)
Indu
stria
l, co
mm
ercia
l &do
mes
tic lo
ads
Islan
ded
/isol
ated
grid
Min
es
Expo
rtPO
WER
GEN
ERAT
ION
PLAN
TS
ZAMB
IAN
ELEC
TRIC
AL P
OWER
SYS
TEM
OVER
VIEW
ZESCOʼ
s Ma
jor
Hydr
oPo
wer S
tatio
ns
?Ka
fue
Gorg
e Po
wer S
tatio
n (9
90MW
)?
Karib
a No
rth
Bank
Pow
er S
tatio
n (7
20MW
)
?
)
ZESC
OTr
ansm
issio
nSy
stem
330K
v &
220K
v
ZESC
OSu
b-tr
ansm
issio
n Sy
stem
220k
V, 1
32kV
, 88K
v&
66Kv
ZESCOʼs
Prim
ary
Dist
ribut
ion
33KV
ZESCOʼs
Dist
ribut
ion
syst
em
New
Proj
ects
Copp
erbe
lt En
ergy
Corp
orat
ion
(ope
ratin
g at
220
KV, 6
6KV
)Pr
ivate
Tra
nsm
issio
nCo
mpa
ny
Luns
emfw
a Hy
dro
Powe
r Com
pany
Luns
emfw
a &
Mulun
gush
i (58
MW)
Nort
h W
este
rn E
nerg
y Co
mpa
ny(O
pera
ting
at 3
3kV)
Priva
tely
owne
d co
mpa
ny
Zeng
amina
Pow
er C
ompa
ny(0
.75M
W)
New
The
rmal
Plant
s (M
aam
ba–
600M
W,E
MCO
–60
0MW
& NE
C–
50MW
)
Indu
stria
l, co
mm
ercia
l &do
mes
tic lo
ads
Islan
ded
/isol
ated
grid
Min
es
Expo
rt
FIGURE 1.1: ZAMBIAN ELECTRICAL POWER SYSTEM OVERVIEW
NEC
L –
50M
W
Karib
a N
orth
Ban
k Ex
tens
ion
Pow
er P
lant
(360
MW
)
Itezh
i-Tez
hi -
120M
WKa
bom
po -
40M
W
IMPORTS
EXPORTS
EXPORTS
IMPORTS
EXPORTS
Annex 4: Zambian electrical power system overview
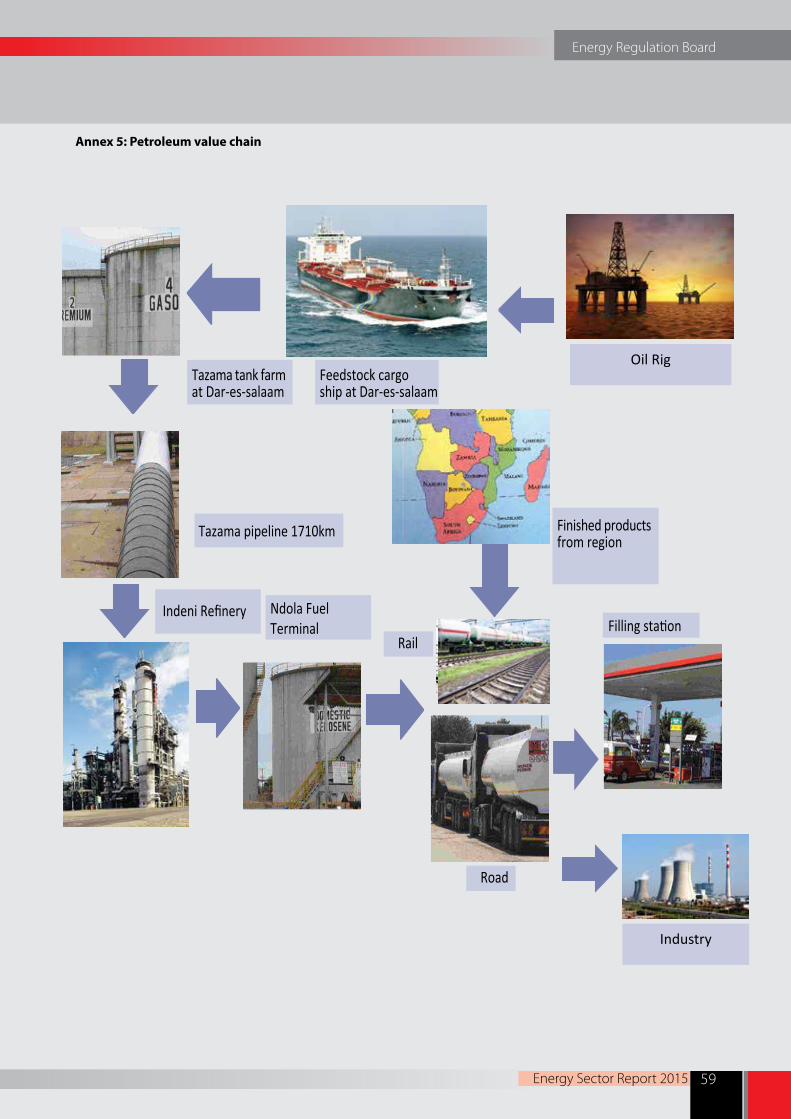
Energy Regulation Board
Energy Sector Report 2015 59
Annex 5: Petroleum value chain
ENERGY SECTOR REPORT
AND
2012
2013
Tazama tank farmat Dar-es-salaam
Feedstock cargoship at Dar-es-salaam
Tazama pipeline 1710km
Indeni Refinery Ndola Fuel Terminal
Finished productsfrom region
Rail
1.3.2 PETROLEUM SUB-SECTOR
Zambia has an over dependency on crude oil imports which directly affects growingsectors like manufacturing; construc ; mining; tourism and agriculture. With ever-rising crude oil prices, for example, from US$76.6/bbl in 2010 to US$105/bbl in 2013,there is now demand for cheaper and environmentally friendly forms ofenergy that can be produced locally.
Zambia has no known proven reserves of crude oil and therefore imports all its fuelrequirements. The impor is in two modes, namely, the petroleum feedstock
mode through the 1,710 km long TAZAMA pipeline from the port of Dar-es-Salaam in Tanzania to Ndola in Zambia for refining at INDENI refinery. The other
The petroleum feedstock imported is specifically tailored to the configur of theINDENI Refinery and is best suited to mee g the needs of the Zambian market. Therefinery is not configured to process pure crude oil but is configured to process a spikedor commingled feedstock which typically comprises pure crude oil, condensate, naphthaand gasoil (diesel). Figure 1.2 shows the key players in the Zambian fuel supply valuechain.
FIGURE 1.2: PLAYERS IN THE FUEL SUPPLY VALUE CHAIN
Road
Oil Rig
Industry

Energy Regulation Board
Energy Sector Report 201560
Annex 6: Energy Regulation Board complaints handling procedure
Type of complaint Time frames for complaint resolution
Electricity complaints
Connection to Supply 5 – 30 working days, depending on nature of works pre-scribed under ZS397
Unplanned interruptions Up to 48 hours
Billing 10 working days
Faulty meters 15 working days
Poor voltage 30 working days
Disconnection Within 24 hours after payment of outstanding bill
Wrong tariffs 30 working days
Compensation claims 60 working days
Other complaints Up to 30 working days
Petroleum complaints
Pump prices (fuel price per litre) Up to 48 hours
Poor quality of fuel 30 working days
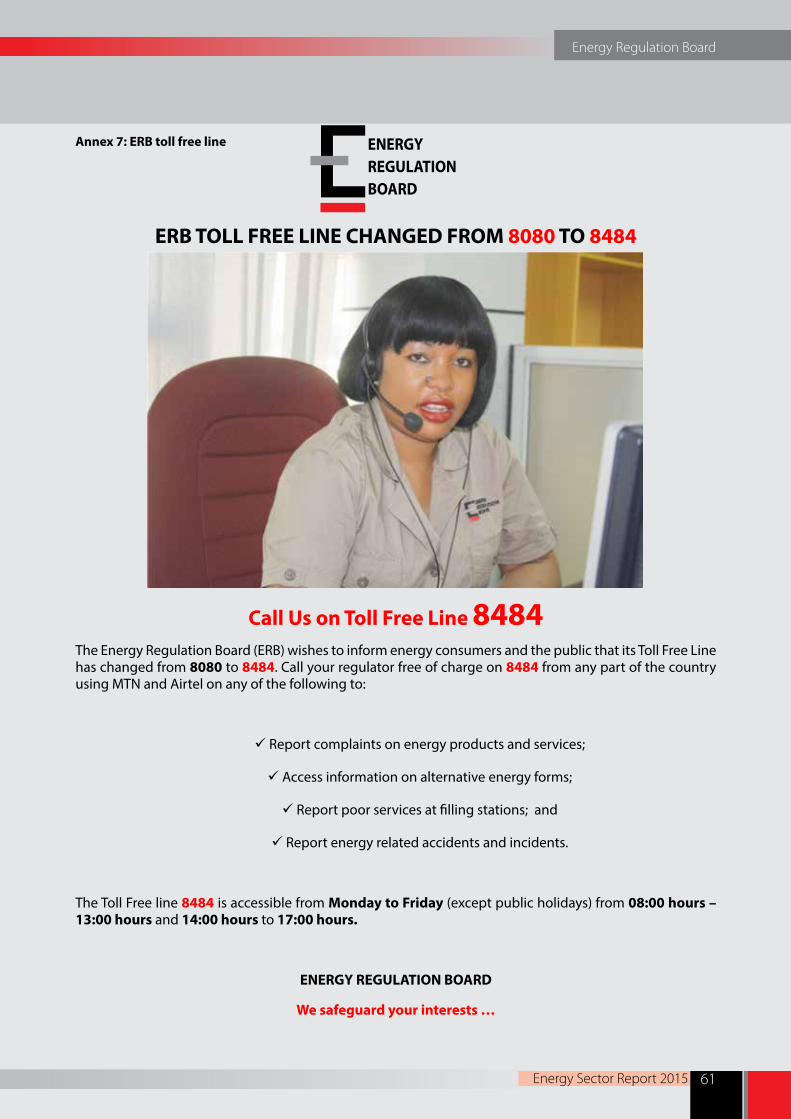
Energy Regulation Board
Energy Sector Report 2015 61
Annex 7: ERB toll free line
ERB TOLL FREE LINE CHANGED FROM 8080 TO 8484
Call Us on Toll Free Line 8484The Energy Regulation Board (ERB) wishes to inform energy consumers and the public that its Toll Free Line has changed from 8080 to 8484. Call your regulator free of charge on 8484 from any part of the country using MTN and Airtel on any of the following to:
ü Report complaints on energy products and services;
ü Access information on alternative energy forms;
ü Report poor services at filling stations; and
ü Report energy related accidents and incidents.
The Toll Free line 8484 is accessible from Monday to Friday (except public holidays) from 08:00 hours – 13:00 hours and 14:00 hours to 17:00 hours.
ENERGY REGULATION BOARD
We safeguard your interests …
ENERGYREGULATIONBOARD

Energy Regulation Board
Energy Sector Report 201562
Annex 8: Provincial retail service station network in 2015
OMC/DEALER Central Copperbelt Eastern Luapula Lusaka Muchinga N/Western Northern Southern Western Grand Total
ALPHA ENTERPRISES 2 0 0 0 0 0 0 0 0 0 2
CENTRALINA 0 1 0 0 0 0 0 0 0 0 1
CONTINENTAL OIL 1 1 0 1 0 2 0 0 0 0 5
ECO 0 2 0 0 0 0 0 0 0 0 2
ENGEN PETROLEUM 1 6 1 0 17 0 0 2 3 0 30
EXCESS OIL 0 0 0 0 0 0 0 0 1 0 1
LAKE PETROLEUM 3 8 0 1 0 0 0 0 0 0 12
LANTIAN PETROLEUM 0 0 0 0 1 0 0 0 0 0 1
LBM 0 0 0 1 0 0 0 2 0 0 3
LUSHOMO INDEPENDENT DEALER 1 0 0 0 0 0 0 0 0 0 1
LUKULU SERVICE STATION 0 0 0 0 0 0 0 0 0 1 1
MOUNT MERU 2 6 2 1 14 1 1 0 3 0 30
NGUCHA ENERGY 0 0 0 2 2 0 0 0 0 0 4
OASIS 0 0 4 0 0 0 0 0 0 0 4
ODYS 0 0 0 0 1 0 0 0 0 0 1
ORYX 0 2 2 1 2 0 0 0 0 0 7
OIL BAY ZAMBIA LIMITED 1 0 0 0 0 0 0 0 0 0 1
PEGASUS 0 0 0 0 1 0 0 0 2 1 4
PETRODA 0 5 0 0 12 0 0 0 0 0 17
PUMA ENERGY 3 15 5 1 19 1 3 1 6 3 57
RAVASIA 1 0 0 0 1 0 0 0 0 0 1
SABOT 0 1 0 0 0 1 0 1 0 0 3
SAMFUEL 1 6 0 0 0 0 0 0 0 0 7
SGC 1 12 2 0 5 1 1 1 2 25
SPECTRA OIL 1 1 0 0 2 0 0 0 0 0 4
STAR OIL 0 1 0 0 0 0 0 0 0 0 1
SUBAN 0 3 0 0 1 1 0 0 0 1 6
TOTAL LIMTED 5 14 1 1 18 0 2 1 3 1 46
ZAF CREDIT UNION & SAVINGS 1 0 0 0 0 0 0 0 0 0 1
ZACKS 1 0 0 0 0 1 0 0 0 0 2
U-FUEL PETROLEUM 1 0 0 0 0 0 0 0 0 0 1
KOBIL 3 6 3 0 9 0 0 0 5 1 27
GRAND TOTAL 28 90 20 8 106 8 7 8 25 8 308
Energy Regulation Board
Energy Sector Report 2015 63
Annex 9: Petroleum retail service station construction license requirements
1. Decision letter giving a no objection from ZEMA;
2. Two (02) copies of complete, consistent and properly referenced site layout drawings indicating all safety distances and position of other important provisions such as tank farm, drainage system, offloading points, oil interceptor, vent pipes and egress/ingress. The site layout should comply with ZS 385 Part 3 and other ERB requirements;
3. Two (02) copies of complete, consistent and properly referenced detailed engineering and structural drawings of the following; tank farm, oil interceptor, canopy and price display. The said drawings should be consistent with the site layout and should comply with ZS 385 Part 3 and other ERB requirements;
4. Zoning approval from the Local authority;
5. Approval from the Road Development Agency or its designated agent;
6. Valid practicing certificate for the Registered Engineering Professional that will supervise the project. The said certificate is issued by the Engineers Registration Board in accordance with the provisions of the Engineering Institution Act; and
7. Documentary evidence of the Registered Engineering professional’s commitment to the project on the said location. Such commitment could be in form of acceptance letter from the Registered Engineer or a contract signed by both parties.
Energy Regulation Board
Energy Sector Report 201564
Annex 10: List of licenced solar energy dealers in 2015
No Company Name Physical Address Town
1 Captain Electrical Limited 39-A First Floor, Carousel Shopping Centre Lusaka
2 Chloride Zambia Limited Plot No. 3682, Cnr Dr Aggrey Avenue and Natwange Roads
Lusaka
3 DEV Technologies Limited Plot No. 10A Jesmondine, Great East Road Lusaka
4 Electric Maintenance Lusaka Limited
Plot No. 195 Luanshya Road Lusaka
5 Electrical Instrumentation Ser-vices Limited
Plot No. 1023 Eshowe Road Kitwe
6 Greenfields Energy Corporation Limited
Plot No. 5091, Lumumba Road Lusaka
7 Hopelinks Zambia Limited Plot No. 7256 Nkana East off Kalene Street Lusaka
8 Kenol Zambia Limited Plot No. 5797, Great East Road, Northmead Lusaka
9 Khondwala Enterprises Limited Plot No. 233 Chilimbulu Road, Opposite Kamwala Market
Lusaka
10 Melcome Marketing and Dis-tributors Limited
Plot No. 7200, Kachidza Road, Light Industrial Area Lusaka
11 Midrand Business Systems Limited
Plot No. 2563 Lubu Road, Longacres Lusaka
12 Muhanya Solar Limited Plot No. 7928 Chozi Road, Alpha Building, Northmead Lusaka
13 Necor Zambia Limited Lonrho House, Cairo Road Lusaka
14 Norwood Enterprises Limited Plot No. 114, Lumumba Road Lusaka
15 Notch Resources Limited Plot No. 5487 Msanzala Road, Kalundu Lusaka
16 Power Link Solutions Limited Plot No. 1841, Lubambe Road Lusaka
17 Reba Industrial Corporation Limited
Plot No. 1, Brilliance Street, ZCCZ, MFEZ Kalulushi
18 Riders Energy Zambia Limited Plot 30073, Chinika Industrial Area Lusaka
19 Sabi and Mak Zambia Limited Plot No. 6226 Kabundi Road, Riverside Chingola
20 Samifran Construction and Proj-ect Managers Zambia Limited
Plot No. 6606, Ngwenya Crescent, Riverside Extension Kitwe
21 Saro Agro Industrial Limited Plot No. 5284, Buyantanshi Road Lusaka
22 Savenda Management Services Limited
Plot No. 1534, 36 Milima Road, Woodlands Lusaka
23 Sharemix Limited Plot No. 661 Zimbabwe Road Chingola
24 Smartnet Networks Limited Plot No. 2393, Kaoma House, Longolongo Road Lusaka
25 Solaraid Zambia Plot No 2B/25/377A, House B, Off Roan Road, Kabu-longa
Lusaka
26 Solaris Africa Hardware Limited 177A Chiparamba Road Lusaka
27 Solartech Limited Plot No. 7221, Kachidza Road Lusaka
28 Sunpower Limited Sun House, 4483, Katima Mulilo Road Lusaka
29 Tiambo International Company Limited
Plot No. 4, Kawama Road, Lusaka; Plot 25957, Wood-lands Extension
Lusaka

Energy Regulation Board
Energy Sector Report 2015 65

Energy Regulation Board
Energy Sector Report 201566

Energy Regulation Board
Energy Sector Report 2015 67

Energy Regulation Board
Energy Sector Report 201568

Energy Regulation Board
Energy Sector Report 2015 69
Energy Sector Report 201570
Head OfficePlot No. 9330, Mass MediaOff Alick Nkhata Road,P. O. Box 37631, Lusaka, Zambia.Tel: 260-211-258844 - 49 Fax: 260-211-258852
E-mail: [email protected] I Website: www.erb.org.zm
Copperbelt OfficePlot No. 332Independence AvenueP.O. Box 22281Kitwe, ZambiaTel: +260 212 220944Fax: +260 212 220945
Livingstone OfficePlot No. 708Chimwemwe RoadNottie BroadieP.O. Box 60292Livingstone, ZambiaTel: +260 213 321562-3Fax: +260 213 321576
Chinsali OfficePlot No. 76MayadiP.O. Box 480052Chinsali, ZambiaTel: +260 214 565170Fax: +260 214 565171
ENERGYREGULATIONBOARD