Embed Size (px)
Citation preview
1
Energy Saving and Capacity Gain of Micro Sites in
Regular LTE Networks: Downlink Traffic Layer
AnalysisTeklemariam T. Tesfay∗, Ramin Khalili∗, Jean-Yves Le Boudec∗, Fred Richter† and Albrecht J. Fehske†
∗ EPFL, IC-LCA2, CH-1015 Lausanne, Switzerland
Email: tech.tesfay, ramin.khalili, [email protected] † Vodafone Chair Mobile
Communications systems, Technische Universitaet Dresden
Email: fred.richter, [email protected]
Abstract
We study the impact of deployment of low cost, low power micro base stations along with macro base stations
on energy consumption and capacity of downlink LTE. We add three important elements to the existing studies:
a traffic layer analysis that take both the physical and traffic layer specifications of LTE downlink into account;
a threshold-based policy to associate users to base stations; and an allocation scheme to allocate the frequency
band to macro and micro sites. We investigate all combinations of these elements through numerical evaluation. We
observe that 1. there are important differences between traffic layer and physical layer analysis, 2. threshold-based
user association policy improve the capacity of the network by up to 33% without affecting the energy profile of
the network, and 3. considerable energy saving and capacity gain can be achieved thought an optimal allocation of
the frequency band to macro and micro sites. Finally, we show that up to 46% saving in energy can be achieved
by a careful network deployment as compared to the case that no micro sites are deployed in the network.
I. INTRODUCTION
Energy consumption of telecommunication networks is not negligible, and wireless networks alone consume
approximately 60 billion kWh per year which is about 2% of global CO2 emission [12]. Predictions show that
mobile data traffic will double every year, increasing 39 times between 2009 − 2014 [9]. Hence, future wireless
networks must provide more capacity and will, therefore, consume much more energy than today’s networks. Thus,
there are major environmental and social issues to reduce energy consumption of wireless networks. There is also an
important economic incentive for wireless operators to design more energy efficient networks. A published report by
Unstrung Insider in 2007 shows that revenue growth of telecom operators is much slower than data traffic growth
over their networks [15]. Energy costs account for as much as half of a mobile operators’ operating expenses.
Hence, it is critical for operators to reduce energy consumption of their networks to decrease their operating cost.
2
In this paper, we focus on saving energy on the radio access part of wireless networks, more specifically on base
stations, which represent about 80% of energy costs [14]. We study the impact of deployment of low cost, low
power micro base stations along with macro base stations on energy consumption and capacity gain of wireless
LTE networks.
Recent studies show that there is a huge potential to reduce energy consumption of LTE networks by using
micro base stations to supplement the capacity of the macro cell network [10]. Fehske et al. elaborate this idea in
detail and show that significant energy saving can be achieved through a careful deployment of micro base stations
along with macro base stations in a cellular network [13]. The performance metric studied in [13] is area spectral
efficiency introduced in [2], which takes only the physical layer data rate into account. However, majority of the
traffic in future cellular networks is expected to be elastic traffic composed of data flows. The rate of a flow does
not only depend on the physical layer metrics (e.g. spectral efficiency) but also on the number of competing flows in
progress and the way the available bandwidth is shared among these flows [5]. Hence, physical layer performance
metrics such as spectral efficiency and signal to interference noise ratio (SINR), as considered in many papers
such as [1], [7], [13], [17], [19], [22], may not be appropriate metrics to model the performance of wireless data
networks.
Similar to the model used in [13], we consider a regular hexagonal LTE network, where the locations of micro
base stations in the hexagonal cells are chosen such that the received signal level from macro base stations at those
locations is expected to be relatively low.We add the following elements to the analysis proposed in [13] that we
believe are important:
• E1: A traffic layer analysis that takes both the physical and traffic layer specifications of LTE downlink into
account (refer to VI). We determine the traffic capacity of the network which we believe is a more appropriate
metric than spectral efficiency to model the performance of wireless data networks [4].
• E2: A threshold-based user association policy which extends the area served by micro base stations without
increasing their transmit power (refer to V). As macro base stations are usually the bottlenecks, we expect to
see higher traffic capacity using this policy.
• E3: A novel frequency band allocation scheme that allocates the frequency band to macro and micro base
stations (refer to IV). Note that a full frequency reuse in macro and micro base stations will cause a high level
of interference in the network which is not optimal in term of traffic capacity and energy consumption.
We investigate all combinations of elements E1-E3. We use a detailed model of the physical layer including
shadowing and interference which makes the problem very difficult to be studied analytically. Hence, we perform
numerical evaluations. The results show that:
• There is a nonlinear relationship between the number of micro sites per macro cell (N ) and the traffic capacity
gain. In particular, we observe that out of the scenarios we study N = 5 brings much higher capacity gain,
irrespective of the other network planning parameters. This differs from the previous findings in [13], which
3
did not consider a traffic layer as we do in E1, and found a linear relationship between N and the spectral
efficiency gain. Hence, traffic capacity and spectral efficiency are different metrics that may result in different
network planning strategies.
• Threshold-based association policy can improve the traffic capacity of a heterogenous network by up to 33%
without affecting the energy profile of the network. Hence, the usual policy that associates users to base stations
with best average signal levels is not optimal.
• The optimal frequency band allocation scheme is to allocate a fraction of the frequency band to both macro
and micro sites and divide the rest of the frequency band between macro and micro sites. We show for a
specific scenario that using our frequency band allocation scheme 20% saving in energy and 10% gain in
traffic capacity can be achieved as compared to a full frequency reuse between macro and micro sites.
Finally, we determine though numerical evaluation the optimal network configuration that minimizes the energy
consumption in the network for a 30 Mbits/s/km2 target traffic capacity. As control parameters we consider the
macro inter site distance, the density and the transmit power of micro sites, the fraction of the frequency band
allocated to macro and micro sites, and the threshold-based user association policy parameter. The results show
that 46% saving in energy can be achieved compared to the case that no micro sites are deployed in the network.
The rest of this paper is structured as follows. In the following section we give a brief overview of the state
of the art. Section III describes the network model and assumptions for our study. In Section IV, we propose our
traffic layer analysis and we derive the capacity of the network. We also define our energy saving optimization
problem. The evaluation results are presented in Section V. Finally, Section VI concludes this paper and discusses
possible direction for future work.
II. RELATED WORK
Energy saving in heterogeneous LTE networks consisting of base stations with different energy-performance
tradeoffs is studied in [10], [13]. They show that significant energy saving can be achieved by shifting traffic from
macro to micro base stations.
The possibility of saving energy by switching off less utilized base stations is investigated in [11], [18]. Park et
al. consider heterogeneous networks and show that significant energy saving can be achieved by turning off base
stations that are less utilized [21]. They use a very abstracted model of physical and traffic layer in their paper.
Note that switching off a base station might decrease the level of coverage in the network that is not desirable by
operators.
Power control schemes are used for interference, energy, and coverage management in cellular networks to
enhance spectral reuse, reduce overall energy consumption, and improve connectivity [8]. Energy saving and spectral
efficiency gain of power control schemes in OFDMA-based networks is studied in [19]. In [17], [22], it is shown that
improvement in overall power consumption and throughput can be obtained using joint power-frequency allocation
mechanisms. Chen et al. follow a network planning approach and determine a cell coverage that minimizes power
4
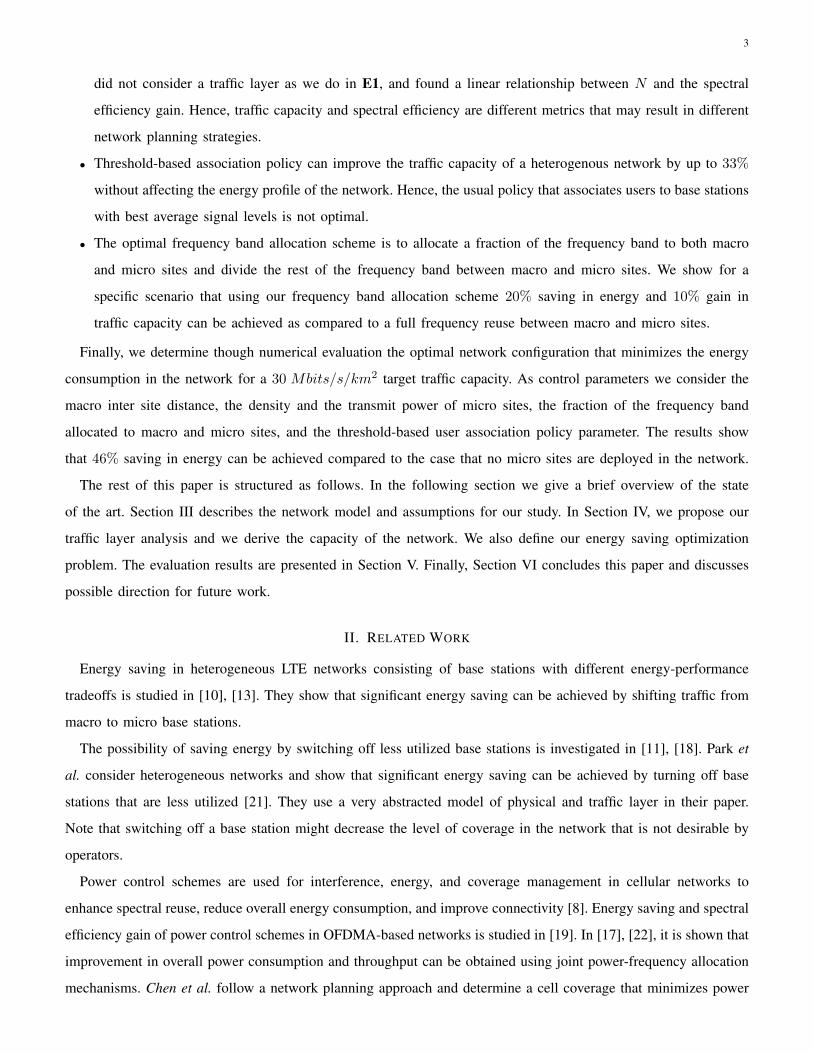
Fig. 1. A regular hexagonal network with three sectors per cell, a reference cell of area A and inter site distance D. The three sectors are
served by collocated directional macro site antennas.
consumption of the network [1]. The performance metrics studied in [17], [19], [22] are physical layer metrics such
as bit error rate, SINR, and spectral efficiency.
A traffic layer analysis of the capacity gain of different frequency reuse schemes in the downlink of LTE networks
is proposed in [5]. Their results are proposed for different network configurations where only macro base stations
are deployed. Moreover, they did not study the energy profile aspect of their network.
III. NETWORK MODEL AND ASSUMPTIONS
The cellular network is modeled as a set of regular hexagonal cells as shown in Figure 1. We consider a two-tier
multi-cell urban environment composed of 19 hexagonal cells where the distance between neighboring macro-sites
is denoted by D and the area of the reference cell at the center is denoted by A. Two types of base stations
are deployed in the network: macro base stations which cover large areas and micro base stations which have a
relatively small transmission range. Each cell is partitioned into three macro sectors where each sector is served
by directional macro site antennas positioned at the center of the hexagonal cell. The bore-sight of the directional
antennas point towards the flat sides of the cell.
As depicted in Figure 2, micro base stations are deployed at locations in the hexagonal cells where the received
signal level from the macro base stations is expected to be relatively low. We consider different network config-
urations with different average numbers of micro base stations per cell. Unlike macro base stations, micro base
stations are equipped with omnidirectional antennas.
We use the notation B = Bmi ∪Bma for the set of all base stations in the network where the subsets Bma and Bmi
are the set of all macro base stations and the set of all micro base stations, respectively.
Since the cellular network is symmetric, restricting the study on the reference area A only provides results which
can be reproduced for other parts of the network. The reference area A is served by three co-located macro base
stations serving the three sectors and is further covered partially by one or more micro sites depending on the
configuration we choose.
This paper studies the downlink traffic of LTE networks only assuming uplink traffic is of secondary importance
for web browsing and video streaming users. However, studying the uplink can be an issue depending on how the
spectrum or time is shared between uplink and downlink traffic. It is not possible to ignore the case where the

5
Fig. 2. A two tier heterogenous cellular network with different deployment strategies. Micro base stations are positioned at locations where
signal strength from macro base stations is expected to be weak.
uplink would be the bottleneck. In fact, a good engineering policy would be to balance resources between uplink
and downlink. Further, operators may be interested in restricting uplink capacity to reduce the amount of peer to
peer traffic.
A. Channel model
The quality of the signal transmitted over a wireless channel is affected by several factors such as deterministic
path-loss, random shadowing, random multipath fading, penetration loss, and antenna pattern in the case of direc-
tional antennas. In what follows, we provide a detailed description of each of these factors and explain how to
aggregate their effects to calculate the signal level at a receiver. A more detailed description of our model can be
found in the 3GPP specification, [20].
1) Path loss: Path loss is the attenuation of a signal’s power as it propagates through the space. Let r be the
distance between transmitter and receiver, then
PLdB(r) = ∆dB + η · 10 · log10 r
where PLdB(r) is the path loss in decibel and ∆ is a parameter that encompasses the effects of carrier frequency,
receiver and transmitter antenna heights, and other propagation environment factors. η is the path loss exponent
which indicates the rate at which the path loss increases with the distance.
As shown in Table I, the values of η and ∆ depend on line-of-sight (LOS) conditions and on whether or not the
distance from the transmitter to the receiver is larger than the break point distance (rb). For urban scenarios, the
probability that a user at a distance r from a macro base station has a LOS reception is
PmaLOS(r) = min
18
r, 1
(1− e−
r
63 ) + e−r
63 .
For a micro base station, the probability is expressed as
PmiLOS = min
18
r, 1
(1− e−
r
36 ) + e−r
36 .
The break point distance is a function of carrier frequency (fc), speed of light in free space (c), effective antenna
height of the base station (h′b), and effective antenna height of the user equipment (h′u):
rb = 4h′bh′ufc/c.
6
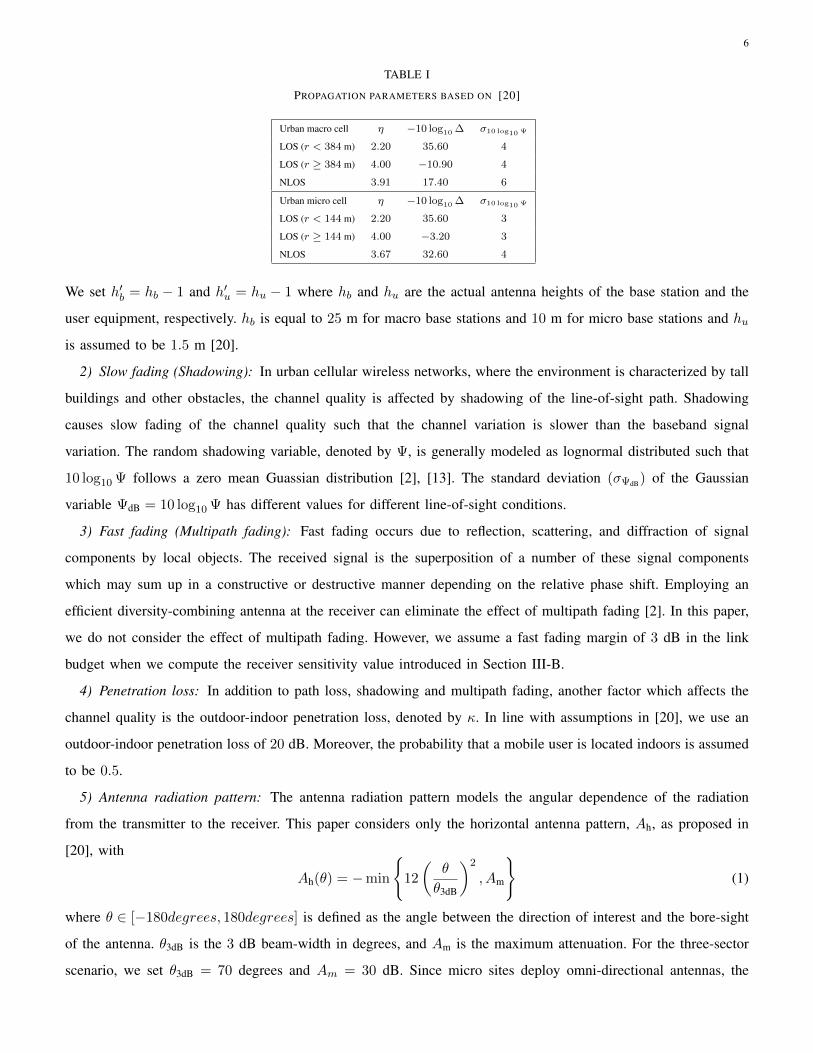
TABLE I
PROPAGATION PARAMETERS BASED ON [20]
Urban macro cell η −10 log10 ∆ σ10 log10 Ψ
LOS (r < 384 m) 2.20 35.60 4
LOS (r ≥ 384 m) 4.00 −10.90 4
NLOS 3.91 17.40 6
Urban micro cell η −10 log10 ∆ σ10 log10 Ψ
LOS (r < 144 m) 2.20 35.60 3
LOS (r ≥ 144 m) 4.00 −3.20 3
NLOS 3.67 32.60 4
We set h′b = hb − 1 and h′u = hu − 1 where hb and hu are the actual antenna heights of the base station and the
user equipment, respectively. hb is equal to 25 m for macro base stations and 10 m for micro base stations and hu
is assumed to be 1.5 m [20].
2) Slow fading (Shadowing): In urban cellular wireless networks, where the environment is characterized by tall
buildings and other obstacles, the channel quality is affected by shadowing of the line-of-sight path. Shadowing
causes slow fading of the channel quality such that the channel variation is slower than the baseband signal
variation. The random shadowing variable, denoted by Ψ, is generally modeled as lognormal distributed such that
10 log10 Ψ follows a zero mean Guassian distribution [2], [13]. The standard deviation (σΨdB) of the Gaussian
variable ΨdB = 10 log10 Ψ has different values for different line-of-sight conditions.
3) Fast fading (Multipath fading): Fast fading occurs due to reflection, scattering, and diffraction of signal
components by local objects. The received signal is the superposition of a number of these signal components
which may sum up in a constructive or destructive manner depending on the relative phase shift. Employing an
efficient diversity-combining antenna at the receiver can eliminate the effect of multipath fading [2]. In this paper,
we do not consider the effect of multipath fading. However, we assume a fast fading margin of 3 dB in the link
budget when we compute the receiver sensitivity value introduced in Section III-B.
4) Penetration loss: In addition to path loss, shadowing and multipath fading, another factor which affects the
channel quality is the outdoor-indoor penetration loss, denoted by κ. In line with assumptions in [20], we use an
outdoor-indoor penetration loss of 20 dB. Moreover, the probability that a mobile user is located indoors is assumed
to be 0.5.
5) Antenna radiation pattern: The antenna radiation pattern models the angular dependence of the radiation
from the transmitter to the receiver. This paper considers only the horizontal antenna pattern, Ah, as proposed in
[20], with
Ah(θ) = −min
12
(θ
θ3dB
)2
, Am
(1)
where θ ∈ [−180degrees, 180degrees] is defined as the angle between the direction of interest and the bore-sight
of the antenna. θ3dB is the 3 dB beam-width in degrees, and Am is the maximum attenuation. For the three-sector
scenario, we set θ3dB = 70 degrees and Am = 30 dB. Since micro sites deploy omni-directional antennas, the
7
antenna pattern value for micro sites is considered to be 0 dB.
We denote by
$(θ, r) = PLdB(r) + κdB +Ah(θ).
the aggregate signal attenuation factor due to path loss, outdoor-indoor penetration loss, and radiation pattern. The
received power, Pr, from a base station at a distance of r and angle θ from the main lobe of the antenna can be
calculated as
Pr(θ, r,Ψ) = Pteff −$(θ, r) + ΨdB (2)
where Pteff is the effective transmitted power in decibels and Ψ is the lognormal shadowing variable.
B. Cell coverage and power consumption model
The effective transmit power of a base station depends on the size of the covered area and the degree of coverage
required. We define degree of coverage ζ of a cell as the fraction of a cell of area Ac where the receive power per
subcarrier is greater than a given level Pmin, i.e.
ζ =1
|Ac|
∫Ac
r · P(Pr(r, θ,Ψ) ≥ Pmin)drdθ, (3)
where the operator P denotes the probability. Pmin, also known as the receiver sensitivity, is a target minimum
received power level below which performance becomes unacceptable [3]. The target minimum received power
level depends on thermal noise, noise figure of a mobile terminal, fast fading margin, inter-cell interference margin,
and required SNR values among other factors. This paper uses Pmin per subcarrier equal to −120 dBm.
Combining (2) and (3), the coverage ζ can be evaluated as
ζ =1
|Ac|
∫Ac
r ·Q(Pmin − Pteff +$(θ, r)
σΨdB
)drdθ, (4)
where Q(x) is the probability that a standard normal random variable will obtain a value greater than x and σΨdB
is the standard deviation of the Gaussian variable ΨdB. Pmin and Pteff are in dB [3].
We compute Pteff of the macro and micro sites by numerically inverting (4). We assume that micro sites do not
contribute to the coverage of macro sites, i.e. the effective transmit power of a macro site is determined such that it
provides ζ coverage to the hexagonal cell irrespective of the presence of micro sites. For the sake of simplicity, we
assume that a macro cell has a a circular shape of radius D/√
3, where D is the distance between two neighboring
macro sites. The effective transmit power of a micro site is computed such that it gives ζ coverage to a circular
cell of radius Rmi. In this paper, the transmit power of a micro site is considered as a network planning parameter
and the network performance is determined for different transmit power levels.
Note that the effective transmit power per subcarrier obtained from (4) is the Equivalent Isotropically Radiated
Power in dBi (EIRP), i.e., it is the the emitted transmission power of a theoretical isotropic antenna to produce the
same peak power density as in the direction of the maximum antenna gain. The actual total transmitted powers of
8
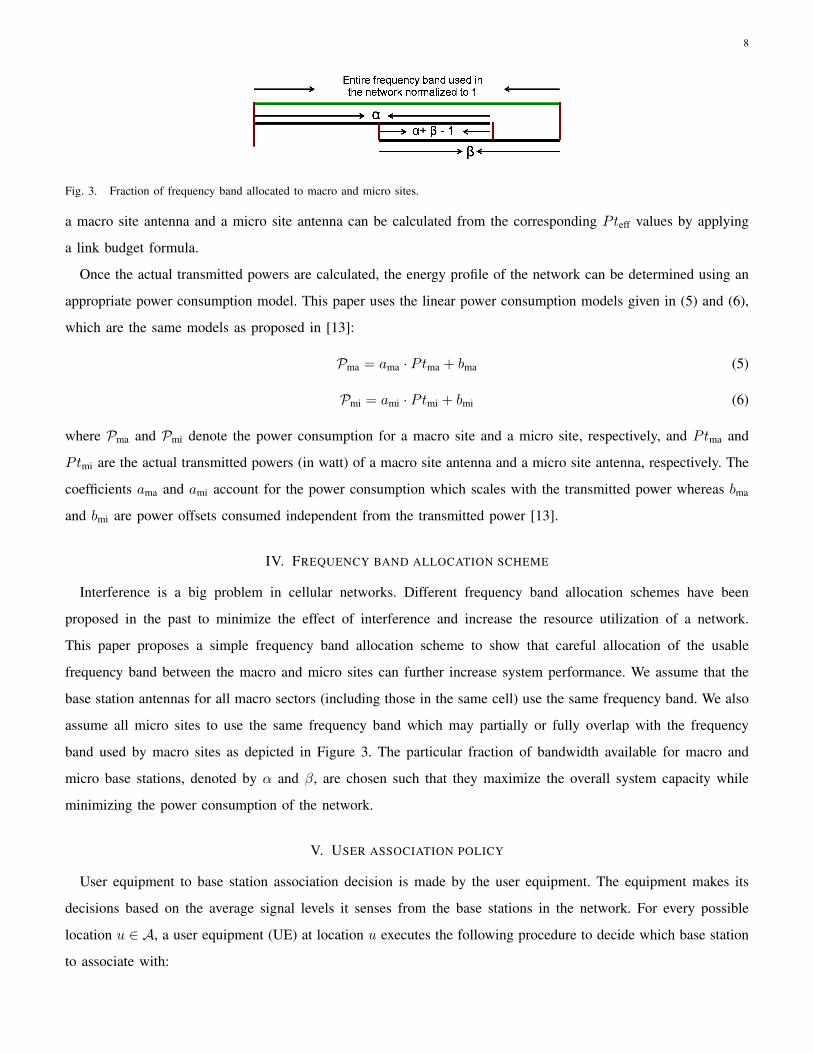
Fig. 3. Fraction of frequency band allocated to macro and micro sites.
a macro site antenna and a micro site antenna can be calculated from the corresponding Pteff values by applying
a link budget formula.
Once the actual transmitted powers are calculated, the energy profile of the network can be determined using an
appropriate power consumption model. This paper uses the linear power consumption models given in (5) and (6),
which are the same models as proposed in [13]:
Pma = ama · Ptma + bma (5)
Pmi = ami · Ptmi + bmi (6)
where Pma and Pmi denote the power consumption for a macro site and a micro site, respectively, and Ptma and
Ptmi are the actual transmitted powers (in watt) of a macro site antenna and a micro site antenna, respectively. The
coefficients ama and ami account for the power consumption which scales with the transmitted power whereas bma
and bmi are power offsets consumed independent from the transmitted power [13].
IV. FREQUENCY BAND ALLOCATION SCHEME
Interference is a big problem in cellular networks. Different frequency band allocation schemes have been
proposed in the past to minimize the effect of interference and increase the resource utilization of a network.
This paper proposes a simple frequency band allocation scheme to show that careful allocation of the usable
frequency band between the macro and micro sites can further increase system performance. We assume that the
base station antennas for all macro sectors (including those in the same cell) use the same frequency band. We also
assume all micro sites to use the same frequency band which may partially or fully overlap with the frequency
band used by macro sites as depicted in Figure 3. The particular fraction of bandwidth available for macro and
micro base stations, denoted by α and β, are chosen such that they maximize the overall system capacity while
minimizing the power consumption of the network.
V. USER ASSOCIATION POLICY
User equipment to base station association decision is made by the user equipment. The equipment makes its
decisions based on the average signal levels it senses from the base stations in the network. For every possible
location u ∈ A, a user equipment (UE) at location u executes the following procedure to decide which base station
to associate with:

9
1) UE senses the channel.
2) UE estimates the average received signal level from each macro and micro site in the network.
3) a) UE selects the micro base station which yields the best average signal level compared to all micro base
stations.
b) UE selects the macro base station which yields the best average signal level compared to all macro base
stations.
4) If the ratio of the best average signal from the micro base station to the best average signal from the macro
base station is greater than threshold T,
Then
• UE is associated with the micro base station.
Else
• UE is associated with the macro base station.
End
T is chosen such that it maximizes the overall system capacity. Using the above association procedure, each
point u in the reference area A is associated with a base station i ∈ B. Let Ai be the set of all locations u ∈ A
such that a user equipment at location u is associated with base station i ∈ B. It can be shown that the following
conditions hold:
1) ∪i∈B Ai = A
2) Ai ∩Aj = ∅ for all ∀i, j ∈ B and i 6= j.
A. Feasible Throughput
A user in a network experiences different levels of interference depending on which portion of the frequency
band it is using and depending on which interfering base stations are active. This paper assumes a full buffer
scenario where there is always data available at every base station to be transferred in the downlink, i.e., every base
station antenna transmits data all the time over the whole available frequency band. Note that due to the three-fold
sectorization of macro base stations, every base station serving a sector of a macro cell other than the base station
which the user is associated with contributes to the interference experienced by the user.
Assume there is an active user at location u ∈ Ai, i ∈ B, who can utilize the entire available resource blocks. We
determine the instantaneous feasible throughput (data rate) the user can get when there is no other active user in
cell Ai. As a result of the frequency band allocation scheme proposed in Section IV, the user experiences different
levels of interference on different portions of the frequency band. In the following, we first determine the different
SINR values. Then we compute the overall feasible throughput as the expected rate using the available frequency
band.
10
The SINR using the frequency band which is jointly allocated to macro and micro base stations is
γi,1(u,Ψ) =Pri(u,Ψi)∑
j∈B\i Prj(u,Ψj) + σ2(7)
where σ2 denotes the thermal noise density, Pri(u,Ψi), i ∈ B is the desired instantaneous received signal, and
Prj(u,Ψj) j ∈ B, j 6= i is the instantaneous received signal from an interfering base stationj.
If i ∈ Bma, then the SINR over the part of the spectrum which is allocated exclusively to macro base stations is
γi,2(u,Ψ) =Pri(u,Ψi)∑
j∈Bma\i Pj(u,Ψj) + σ2. (8)
Whereas if i ∈ Bmi, then the SINR over the frequency band which is assigned only to micro base stations is
γi,3(u,Ψ) =Pri(u,Ψi)∑
j∈Bmi\i Pj(u,Ψj) + σ2. (9)
Let the total available frequency bandwidth be denoted by W. If i ∈ Bma, the instantaneous feasible throughput
at location u is
Ri(u,Ψ) = (α+ β − 1)W minlog2(1 + γi,1(u,Ψ)), Smax
+ (1− β)W minlog2(1 + γi,2(u,Ψ)), Smax.
Otherwise, if i ∈ Bmi, the instantaneous feasible throughput at location u will be
Ri(u,Ψ) = (α+ β − 1)W minlog2(1 + γi,1(u,Ψ)), Smax
+ (1− α)W minlog2(1 + γi,3(u,Ψ)), Smax.
LTE supports QPSK, 16-QAM and 64-QAM modulation formats in the physical downlink shared channel. The
maximum achievable data rate using a 64-QAM modulation format is 6 bits/sec/Hz. Thus, we set Smax to 6
bits/sec/Hz.
VI. TRAFFIC LEVEL ANALYSIS
In this section, we introduce a traffic level analysis of the downlink layer of an LTE regular hexagonal network.
We assume users in the references area A to generate data requests (for example, ftp downloads and web browsing)
randomly according to a poisson process of intensity λ. The probability that a random request is generated in an
infinitesimal disk du around u ∈ A is given by δ(u)du such that∫A δ(u)du = 1. Therefore, the fraction of request
arrivals in subarea Ai ⊆ A is given by δiλ where,
δi =
∫Ai
δ(u)du. (10)
Let Ni(t) be the number of active users in subarea Ai at time t. We assume a fair sharing of the available LTE
resource blocks among all active users being served by base station i [5]. Therefore, the instantaneous actual data
rate which an active user at location u ∈ Ai would get is Ri(u,Ψ)/Ni(t) where Ri(u,Ψ) is the instantaneous
feasible throughput at location u and when the channel shadowing state is Ψ, as defined in Section V-A.
11
The state of subarea Ai ⊆ A with Ni(t) active users can be defined by a vector Xi(t) that contains the position
of each active user and the instantaneous shadowing seen by each active user. The number of active users in subarea
Ai ⊆ A behaves as the number of customers in a multi-class product form queuing network with a processor sharing
service discipline [16, Ch. 8]. The class of a customer is defined by u, the position of the customer relative to the
associated base station as well as Ψ, the random channel variation due to shadowing. Thanks to the insensitivity
property of multi-class processor sharing queuing models, the stability of this apparently complex system can be
analyzed without knowing the fine traffic statistics [4], [6]. As shown in [5], the figure of merit required to analyze
the stability conditions and the capacity of the system is the average service time.
A. Stability analysis and system capacity
We assume that a user which submits a request stays in its position until the request is fully served. The average
service time required to serve a request of mean size Ω bits submitted from u ∈ Ai is
τi(u) =
∫Ψ
Ω
Ri(u,Ψ)f(Ψ)dΨ (11)
where f(Ψ) is the probability density function of the lognormal distributed variable Ψ. Therefore, the mean of the
service times of requests generated from all possible locations in subsystem Ai is computed as
τi =1
δi
∫Ai
[∫Ψ
Ω
Ri(u,Ψ)f(Ψ)dΨ
]δ(u)du (12)
A queuing system is said to be stable if the distribution of the queue sizes has a stationary distribution; for a
product form queuing network, this is true whenever the mean service rate of the system is greater than the rate
at which traffic is generated. Therefore, for subsystem Ai to be stable, i.e., for the number of active users being
served by base station i ∈ B not to grow indefinitely, the following condition has to be satisfied:
(δiλ)τi = λΩ
∫Ai
[∫Ψ
f(Ψ)
Ri(u,Ψ)dΨ
]δ(u)du < 1. (13)
From this we obtain
λΩ <
(∫Ai
[∫Ψ
f(Ψ)
Ri(u,Ψ)dΨ
]δ(u)du
)−1
. (14)
Note that ρ = λΩ is the traffic intensity in the reference area A. The traffic intensity of a network is defined as
the amount of traffic in bits per second generated in the network. Hence, the maximum achievable traffic intensity
in the network (i.e. the capacity of the network) is given by
C = ρmax = mini∈B′
(CAi) (15)
where
CAi=
(∫Ai
[∫Ψ
f(Ψ)
Ri(u,Ψ)dΨ
]δ(u)du
)−1
(16)
and B′ is the set of all i ∈ B such that Ai is nonempty.

12
B. Optimization problem
We denote
Carea =CA
(17)
the network capacity per unit area. C is the system capacity in Mbits/s introduced in (15) and A is the area of
the reference cell in km2. The area power consumption of a network with an average of N micro sites per cell, as
defined in [13], is given by:
P =Pma +NPmi
A(18)
where Pma and Pmi are the power consumption of macro and micro sites (in watt), respectively.
Our goal is to find an optimal deployment strategy that yields a network capacity per unit area Carea ≥ Cmin with
minimum area power consumption where Cmin is the minimum target capacity per unit area that we wish to achieve.
As control parameters we consider the macro inter site distance D, the average number of micro base stations per
cell N , transmit power of micro sites, the association policy parameter T, and the fraction of bandwidth available
for macro and micro base stations (α and β).
VII. SYSTEM SIMULATION
In this section, we first describe the simulation settings then give details of our findings.
A. Simulation settings
For our simulation we consider a two-ring multi-cell heterogenous LTE network depicted in Figure 2. No inter-site
cooperation mechanism is used for interference mitigation.
We run the simulation over a range of macro inter site distance D values; specifically from 600 m to 2100 m.
LTE networks are expected to satisfy targeted higher data rates. However mobile terminals have limitations on the
level of transmit power to achieve such data rates for cell edge users. This constraint on the uplink budget will,
therefore, necessitate the need for smaller cell sizes. Thus the range of macro inter site distance values used in this
paper are representative for actual urban area LTE networks.
The effective transmit power of a macro site is computed using (4) for all possible inter site distances such that
the site provides ζ = 95% coverage to the cell. We consider three different effective transmit power levels of a
micro base station such that it gives ζ = 95% coverage to a circular cell of radius Rmi equal to 50 m, 100 m, and
150 m.
The values for the power consumption parameters ama, ami, bma and bmi depend on the number of antennas per
sector and on the type of antenna used. In this paper, we use the same values proposed in [13], i.e., ama = 22.6,
ami = 5.5, bma = 412.4, and bmi = 32.0. These values are obtained from comparing data of several existing base
station types as well as operator’s experience for the specific link budget given in Table II.
13
A uniform distribution of users in the reference area A is assumed. In order to simplify the cumbersome work
of integrating over every possible location in the reference area, we partition the cell into a finite square grid of
points representing user locations in the cell and use these discrete locations to approximate the reference area.
Numerically evaluating the signal levels from each base station overall possible shadowing effects to compute
the SINR value at a certain location in the reference cell is complex. Thus, a Monte Carlo simulation is employed
to approximate the shadowing variations. We assume a user equipment experiences on average 200 variations in
signal quality during a flow’s life time due to random shadowing. The user equipment, therefore, adapts its data
rate to serve the flow accordingly. We use the following steps to simulate the random shadowing effect.
FOR every location u ∈ A do
1) Generate 200 samples of Ψj from a lognormal distribution for every j ∈ B.
2) Compute Prj(u,Ψj) using (2) for every j ∈ B and for every sample Ψj .
3) Association:
• Compute the average received signal level from every j ∈ B from the Prj(u,Ψj) values obtained from
step 2.
• Associate u with i for some i ∈ B using the association policy in Section V and the average signal levels
computed in step 3.
4) Compute an array of 200 different Ri(u,Ψ) from the values obtained in step 2.
END
Once the association of every location u ∈ A is determined and an array of 200 Ri(u,Ψ) values are computed for
every point, we compute the system capacity for given values of the parameters α, β and threshold T, using (15)
and (16).
B. Simulation results
Figure 4 and Figure 5 show the area power consumption and the system capacity per unit area for different
number of micro base stations per cell when the parameters α, β and T are set to 1, and when the micro site
transmitted power is computed such that it gives a ζ = 95% coverage to a circular cell of radius Rmi = 100 m.
This is the default network deployment strategy when no optimization is made on any of the parameters α, β and
T . The results show that merely adding micro sites without any parameter optimization improves the capacity of
the network for a given macro inter site distance D. Figures 5 shows the capacity gain increases as the average
number of micro sites per cell increases.
Besides the density of micro sites, the exact positioning of the micro sites affects the amount of capacity gain.
If we look at the results for three micro sites per cell deployment strategy both in Figures 5 and 6, the capacity
gain is not as much as it is expected to be. This is because the micro sites are deployed directly in front of the
bore-sight of the macro site antennas. Therefore, the strong interference from the macro sites on the locations being
14
TABLE II
LTE-BASED LINK BUDGET AND OTHER PARAMETER VALUES
Carrier frequency 2.4 GHz
Bandwidth 5 MHz
Subcarrier spacing Bsc 15 KHz
Fast fading margin 2 dB
Inter-cell interference margin 3 dB
Thermal noise −174 dBm/Hz
SNR required 0 dB
Receiver sensitivity per subcarrier (Pmin) −120 dBm
Number of antennas (per sector):
Macro / Micro / MS 2/1/1
Number of sectors per cell:
Macro / Micro 3/1
Antenna gain (main lobe):
Macro / Micro / MS 15 dBi / 2 dBi / −1 dBi
Noise figure:
Macro / Micro / MS 4 dB / 4 dB / 7 dB
Coverage (both Macro and Micro cells) 95%
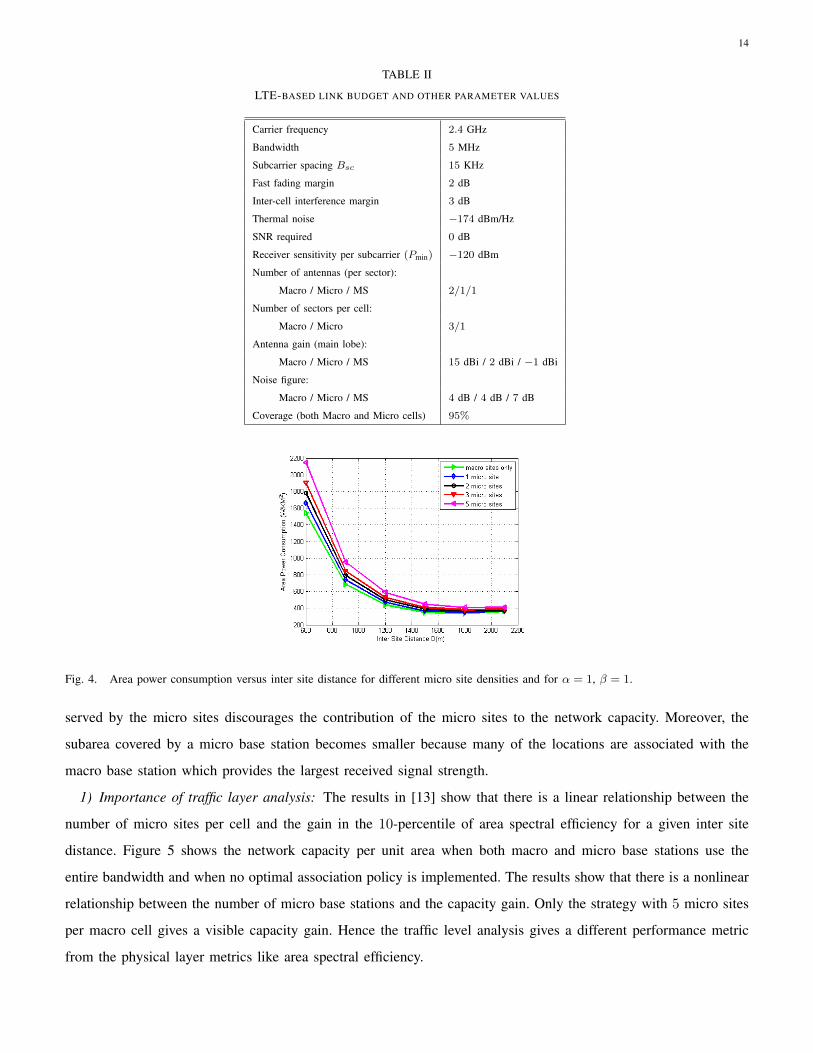
Fig. 4. Area power consumption versus inter site distance for different micro site densities and for α = 1, β = 1.
served by the micro sites discourages the contribution of the micro sites to the network capacity. Moreover, the
subarea covered by a micro base station becomes smaller because many of the locations are associated with the
macro base station which provides the largest received signal strength.
1) Importance of traffic layer analysis: The results in [13] show that there is a linear relationship between the
number of micro sites per cell and the gain in the 10-percentile of area spectral efficiency for a given inter site
distance. Figure 5 shows the network capacity per unit area when both macro and micro base stations use the
entire bandwidth and when no optimal association policy is implemented. The results show that there is a nonlinear
relationship between the number of micro base stations and the capacity gain. Only the strategy with 5 micro sites
per macro cell gives a visible capacity gain. Hence the traffic level analysis gives a different performance metric
from the physical layer metrics like area spectral efficiency.

15
Fig. 5. System capacity per unit area versus inter site distance for different micro site densities and for α = 1, β = 1, T = 1.
Fig. 6. System capacity per unit area versus inter site distance for different micro site densities computed for optimal T and α = 1, β = 1.
2) Micro site range extension: In this subsection we seek to characterize the effect of expanding the coverage
area of the low-power micro sites on network capacity without altering their transmit power. The value of the
association policy parameter T dictates by how much to expand the micro site coverage.
Figure 6 presents the system capacity per unit area computed for optimal T values when the parameters α and
β are set to 1. The transmit power of micro sites is computed for a circular cell of radius Rmi = 100 m. Table III
shows the system capacities per unit area for a specific macro inter site distance D = 1200 m. C is the system
capacity per unit area shown in Figure 5 whereas C∗ is the system capacity per unit area obtained for optimal
threshold T ∗. It is to be noted that varying T value does not affect the area power consumption of the system.
From these results we can infer that choosing an appropriate T value for our association policy significantly
increases the system capacity without affecting the power consumption. Therefore, the usual user association policy
TABLE III
SYSTEM CAPACITY PER UNIT AREA IN MBITS/S/km2 WITH AND WITHOUT RANGE EXTENSION.
number of micro sites per cell
0 1 2 3 5
C 13.34 13.85 15.02 15.49 23.46
C∗ 13.34 16.11 20.40 19.86 31.23
T ∗ - 0.4 0.5 0.7 0.6
16
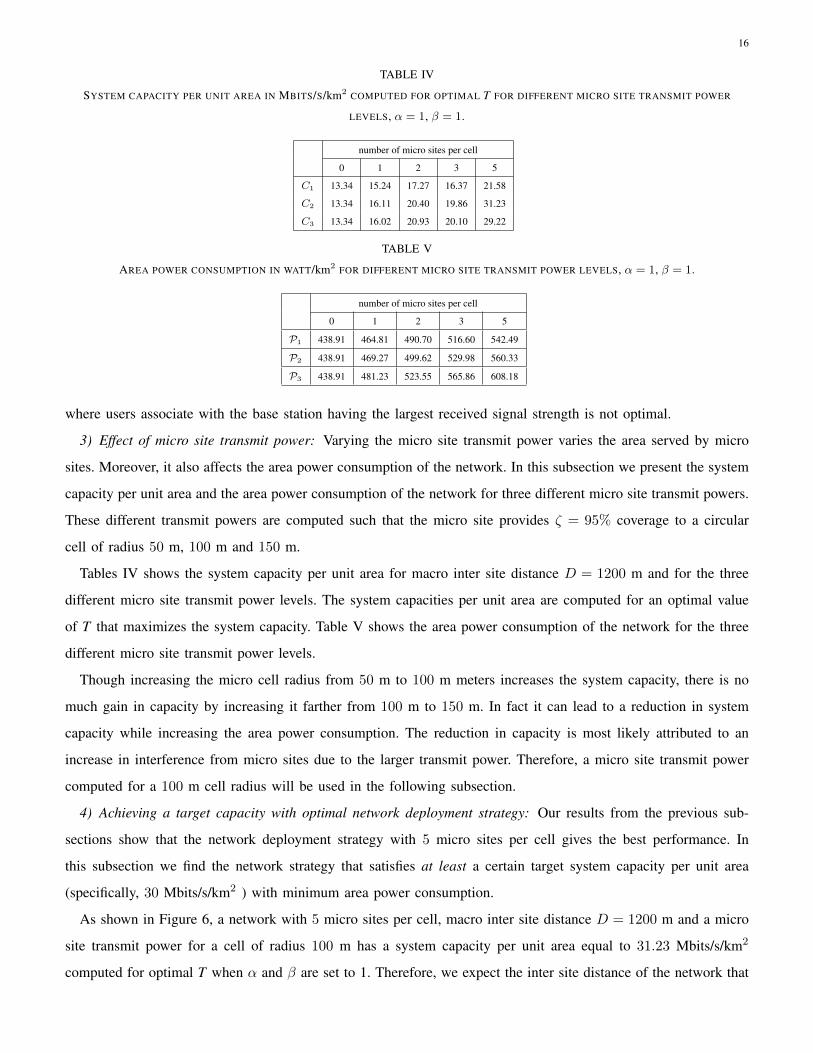
TABLE IV
SYSTEM CAPACITY PER UNIT AREA IN MBITS/S/km2 COMPUTED FOR OPTIMAL T FOR DIFFERENT MICRO SITE TRANSMIT POWER
LEVELS, α = 1, β = 1.
number of micro sites per cell
0 1 2 3 5
C1 13.34 15.24 17.27 16.37 21.58
C2 13.34 16.11 20.40 19.86 31.23
C3 13.34 16.02 20.93 20.10 29.22
TABLE V
AREA POWER CONSUMPTION IN WATT/km2 FOR DIFFERENT MICRO SITE TRANSMIT POWER LEVELS, α = 1, β = 1.
number of micro sites per cell
0 1 2 3 5
P1 438.91 464.81 490.70 516.60 542.49
P2 438.91 469.27 499.62 529.98 560.33
P3 438.91 481.23 523.55 565.86 608.18
where users associate with the base station having the largest received signal strength is not optimal.
3) Effect of micro site transmit power: Varying the micro site transmit power varies the area served by micro
sites. Moreover, it also affects the area power consumption of the network. In this subsection we present the system
capacity per unit area and the area power consumption of the network for three different micro site transmit powers.
These different transmit powers are computed such that the micro site provides ζ = 95% coverage to a circular
cell of radius 50 m, 100 m and 150 m.
Tables IV shows the system capacity per unit area for macro inter site distance D = 1200 m and for the three
different micro site transmit power levels. The system capacities per unit area are computed for an optimal value
of T that maximizes the system capacity. Table V shows the area power consumption of the network for the three
different micro site transmit power levels.
Though increasing the micro cell radius from 50 m to 100 m meters increases the system capacity, there is no
much gain in capacity by increasing it farther from 100 m to 150 m. In fact it can lead to a reduction in system
capacity while increasing the area power consumption. The reduction in capacity is most likely attributed to an
increase in interference from micro sites due to the larger transmit power. Therefore, a micro site transmit power
computed for a 100 m cell radius will be used in the following subsection.
4) Achieving a target capacity with optimal network deployment strategy: Our results from the previous sub-
sections show that the network deployment strategy with 5 micro sites per cell gives the best performance. In
this subsection we find the network strategy that satisfies at least a certain target system capacity per unit area
(specifically, 30 Mbits/s/km2 ) with minimum area power consumption.
As shown in Figure 6, a network with 5 micro sites per cell, macro inter site distance D = 1200 m and a micro
site transmit power for a cell of radius 100 m has a system capacity per unit area equal to 31.23 Mbits/s/km2
computed for optimal T when α and β are set to 1. Therefore, we expect the inter site distance of the network that
17
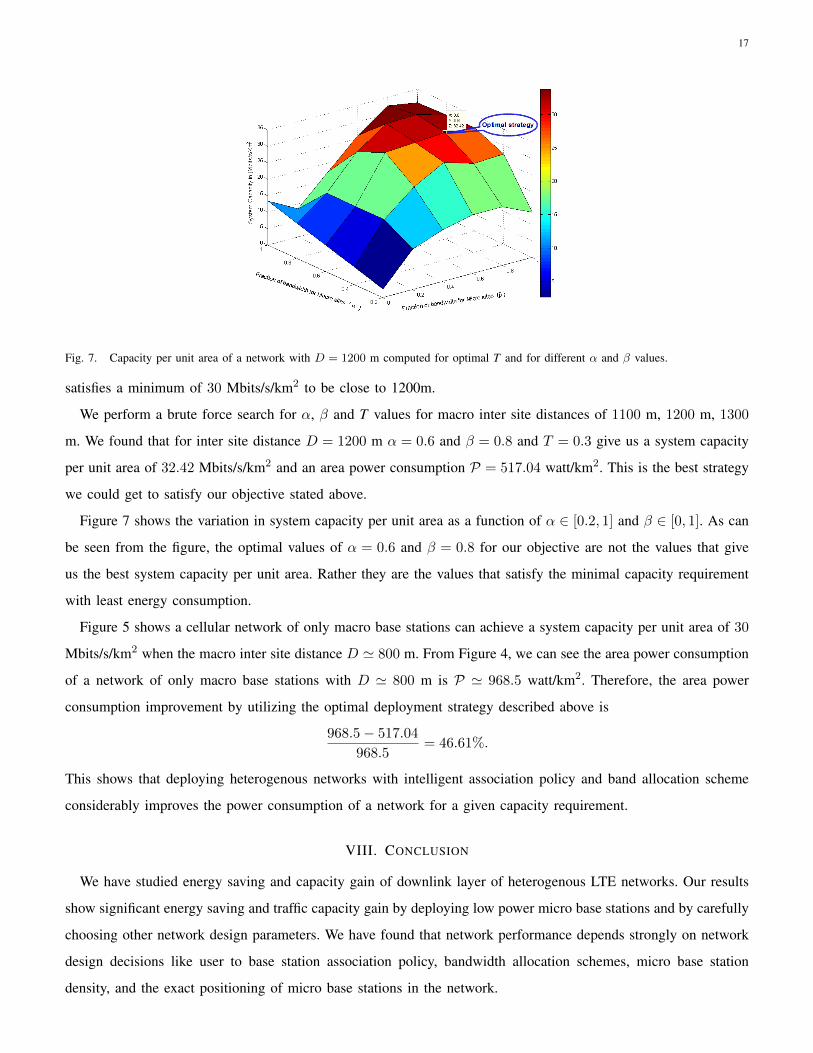
Fig. 7. Capacity per unit area of a network with D = 1200 m computed for optimal T and for different α and β values.
satisfies a minimum of 30 Mbits/s/km2 to be close to 1200m.
We perform a brute force search for α, β and T values for macro inter site distances of 1100 m, 1200 m, 1300
m. We found that for inter site distance D = 1200 m α = 0.6 and β = 0.8 and T = 0.3 give us a system capacity
per unit area of 32.42 Mbits/s/km2 and an area power consumption P = 517.04 watt/km2. This is the best strategy
we could get to satisfy our objective stated above.
Figure 7 shows the variation in system capacity per unit area as a function of α ∈ [0.2, 1] and β ∈ [0, 1]. As can
be seen from the figure, the optimal values of α = 0.6 and β = 0.8 for our objective are not the values that give
us the best system capacity per unit area. Rather they are the values that satisfy the minimal capacity requirement
with least energy consumption.
Figure 5 shows a cellular network of only macro base stations can achieve a system capacity per unit area of 30
Mbits/s/km2 when the macro inter site distance D ' 800 m. From Figure 4, we can see the area power consumption
of a network of only macro base stations with D ' 800 m is P ' 968.5 watt/km2. Therefore, the area power
consumption improvement by utilizing the optimal deployment strategy described above is
968.5− 517.04
968.5= 46.61%.
This shows that deploying heterogenous networks with intelligent association policy and band allocation scheme
considerably improves the power consumption of a network for a given capacity requirement.
VIII. CONCLUSION
We have studied energy saving and capacity gain of downlink layer of heterogenous LTE networks. Our results
show significant energy saving and traffic capacity gain by deploying low power micro base stations and by carefully
choosing other network design parameters. We have found that network performance depends strongly on network
design decisions like user to base station association policy, bandwidth allocation schemes, micro base station
density, and the exact positioning of micro base stations in the network.
18
As possible extension of this work, we intend to address irregular (random) cellular network topology which is
a more realistic scenario in real world cellular networks. We also plan to study a random positioning of micro cells
to take care of hotspot locations in a network. It is also important to study the impact of uplink traffic on the over
all network performance. The amount of traffic in the uplink can affect our association policy due to the limitations
on the level of transmit power of a mobile terminal. Applying a more robust bandwidth allocation scheme along
with base station cooperation for interference mitigation may further improve our findings.
REFERENCES
[1] Solving a minimum-power covering problem with overlap constraint for cellular network design. European Journal of Operational
Research, 203, 2010.
[2] Mohamed-Slim Alouini and Andrea Goldsmith. Area spectral efficiency of cellular mobile radio systems. IEEE Transactions on
vehicular technology, 48, 1999.
[3] Goldsmith Andrea. Wireless Communications. Cambridge University Press, New York, NY, USA, 2004.
[4] Thomas Bonald. Insensitive queueing models for communication networks. In VALUETOOLS, 2006.
[5] Thomas Bonald and Nidhi Hegde. Capacity gains of some frequency reuse schemes in ofdma networks. In GLOBECOM, 2009.
[6] Thomas Bonald and Alexandre Proutiere. On performance bounds for the integration of elastic and adaptive streaming flows.
SIGMETRICS, 2004.
[7] R. Y. Chang, Z. Tao, J. Zhang, and C.-C. J. Kuo. A graph approach to dynamic fractional frequency reuse (ffr) in multi-cell ofdma
networks. ICC, 2009.
[8] M. Chiang, P Hande, T Lan, and CW Tan. Power control in wireless cellular networks. now Publishers Inc, 2008.
[9] Cisco. Cisco visual networking index: Global mobile data traffic forecast update, 2009-2014. White paper, 2010.
[10] H. Claussen, T. W. Ho Lester, and F. Pivit. Leveraging advances in mobile broadband technology to improve environmental sustainability.
Telecommunications Journal of Australia, 59(1):4.1–4.18, 2009.
[11] K. Dufkova, M. Bjelica., K. M. Byongkwon, L. Kencl, and J.-Y. Le Boudec. Energy savings for cellular network with evaluation of
impact on data traffic performance. European Wireless Conference, 2010.
[12] Ericsson. Sustainable energy use in mobile communications. White paper, 2007.
[13] Albrecht J. Fehske, Fred Richter, and Gerhard P. Fettweis. Energy efficiency improvements through micro sites in cellular mobile radio
networks. Globecome Workshops, 2009.
[14] G. P. Fettweis and E. Zimmermann. Ict energy consumption - trends and challenges. International Symposium on Wireless Personal
Multimedia Communications, 2008.
[15] Unstrung Insider. Mobile backhaul and cell site aggregation. White paper, 2007.
[16] Le Boudec Jean-Yves. Performance Evaluation of Computer and Communication Systems. EPFL Press, Lausanne, Switzerland, 2010.
[17] Y. M. Kwon, O. K. Lee, J. Y. Lee, and M. Y. Chung. Power control for soft fractional frequency reuse in ofdma system. ICCSA, 2010.
[18] M. A. Marsan, L. Chiaraviglio, D. Ciullo, and M. Meo. Optimal energy savings in cellular access networks. ICC Workshops, 2009.
[19] G. Miao, N. Himayat, G. Y. Li, A. T. Koc, and S. Talwar. Interference-aware energy-efficient power optimization. In ICC, 2009.
[20] Technical Specification Group Radio Access Network. Further advancements for e-utra physical layer aspects (release 9). Technical
report, 2009. 3rd Generation Partnership Project, Tech. Rep.
[21] C. Park, T. T. Kwon, and Y. Choi. Power-consumption minimization mechanism for heterogeneous multi-cell cellular network. NCS,
2009.
[22] C. Y. Wong, R. S. Cheng, K. B. Letaief, and R. D. Murch. Multiuser ofdm with adaptive subcarrier, bit, and power allocation. IEEE
JOURNAL ON SELECTED AREAS IN COMMUNICATIONS, 17, 1999.