Embed Size (px)
Citation preview

Energy Risk Management in the Nigerian Market and the Value of the ERP Designation
Razaq Ahmed, CFA, ERP Executive Director Energy and Investments Sart Partners, Nigeria October 2014

2!
The views expressed in the following material are the
author’s and do not necessarily represent the views of
the Global Association of Risk Professionals (GARP),
its Membership or its Management.

3 | ���© 2014 Global Association of Risk Professionals. All rights reserved.
Table of Content
1. Nigerian Energy Market: Evolution, Size and Projection
2. The Need for Risk Management
3. The Value of The ERP Designation
4. Wrap-Up
5. Q & A

4 | ���© 2014 Global Association of Risk Professionals. All rights reserved.
Today’s Interactive session is a blend of 3 focused areas
Nigerian Energy Market
Energy Risk Management
Value of ERP
Designation
Today’s interactive
session
5 | ���© 2014 Global Association of Risk Professionals. All rights reserved.
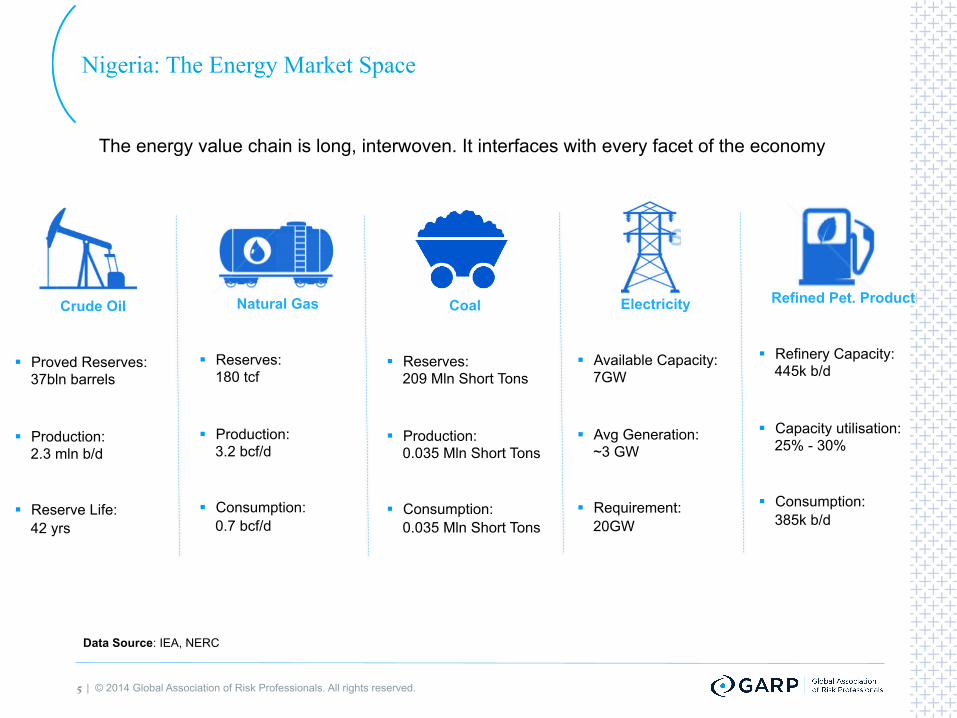
Nigeria: The Energy Market Space
The energy value chain is long, interwoven. It interfaces with every facet of the economy
Crude Oil
§ Proved Reserves: 37bln barrels
§ Production: 2.3 mln b/d
§ Reserve Life: 42 yrs
Natural Gas
§ Reserves: 180 tcf
§ Production: 3.2 bcf/d
§ Consumption: 0.7 bcf/d
Coal
§ Reserves: 209 Mln Short Tons
§ Production: 0.035 Mln Short Tons
§ Consumption: 0.035 Mln Short Tons
Electricity
§ Available Capacity: 7GW
§ Avg Generation: ~3 GW
§ Requirement: 20GW
Refined Pet. Product
§ Refinery Capacity: 445k b/d
§ Capacity utilisation: 25% - 30%
§ Consumption: 385k b/d
Data Source: IEA, NERC

6 | ���© 2014 Global Association of Risk Professionals. All rights reserved.
Nigeria: The Energy Market Space
The energy value chain is long, interwoven. It interfaces with every facet of the economy
Crude Oil
§ Proved Reserves: 37bln barrels
§ Production: 2.3 mln b/d
§ Reserve Life: 42 yrs
Natural Gas
§ Reserves: 180 tcf
§ Production: 3.2 bcf/d
§ Consumption: 0.7 bcf/d
Coal
§ Reserves: 209 Mln Short Tons
§ Production: 0.035 Mln Short Tons
§ Consumption: 0.035 Mln Short Tons
Electricity
§ Available Capacity: 7GW
§ Avg Generation: ~3 GW
§ Requirement: 20GW
Refined Pet. Product
§ Refinery Capacity: 445k b/d
§ Capacity utilisation: 25% - 30%
§ Consumption: 385k b/d
Data Source: IEA, NERC
7 | ���© 2014 Global Association of Risk Professionals. All rights reserved.
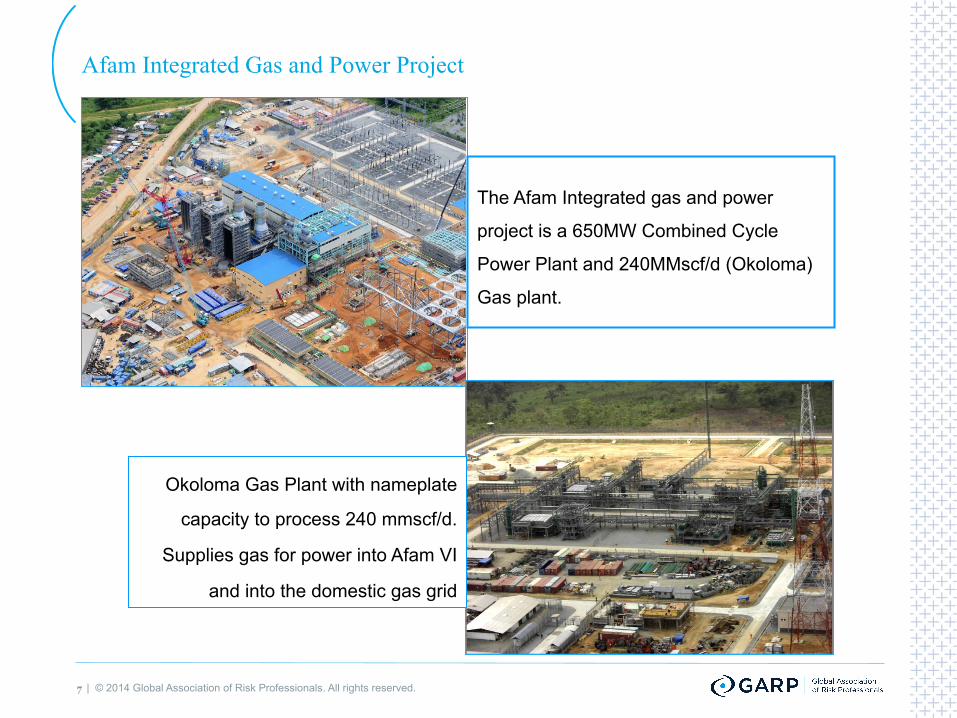
Afam Integrated Gas and Power Project
The Afam Integrated gas and power
project is a 650MW Combined Cycle
Power Plant and 240MMscf/d (Okoloma)
Gas plant.
Okoloma Gas Plant with nameplate
capacity to process 240 mmscf/d.
Supplies gas for power into Afam VI
and into the domestic gas grid

8 | ���© 2014 Global Association of Risk Professionals. All rights reserved.
Electricity Consumption Evolution: Nigeria vs. Peers -1
0
20
40
60
80
100
120
140
160
180
200
1980 1985 1990 1995 2000 2005 2010
Population Evolution Numbers in millions
Angola Libya Nigeria South Africa
0
50
100
150
200
250
1980 1985 1990 1995 2000 2005 2010
Electricity Net Consumption (in billion kilowatt hour)
Angola Libya Nigeria South Africa
*Electric power consumption measures the production of power plants and combined heat and power plants less transmission, distribution, and transformation losses and own use by heat and power plants.
Data Source: IEA (1980 – 2011), Sart Partners’ estimates (2012-2013)
1980 – 2013 Growth : Population • Nigeria: 133% (CAGR: 2.6%)
• South Africa: 68% (CAGR: 1.6%)
• Angola: 158% (CAGR: 2.9%)
• Libya: 103% (CAGR: 2.2%)
1980 – 2013 Growth: Electricity Consumption • Nigeria: 413% (CAGR: 5.1%)
• South Africa: 156% (CAGR: 2.9%)
• Angola: 589% (CAGR: 6.0%)
• Libya: 597% (CAGR: 6.1%)

9 | ���© 2014 Global Association of Risk Professionals. All rights reserved.
Electricity Consumption Evolution: Nigeria vs. Peers -2
-
1,000
2,000
3,000
4,000
5,000
6,000
1980 1985 1990 1995 2000 2005 2010
Electricity Consumption Per Capita In kilowatt hour
Angola Libya
Nigeria South Africa
-
5
10
15
20
25
30
35
40
45
50
Angola Libya Nigeria South Africa
2013: Installed Capacity In GW
• An average South African consumes 30x more electricity than an average Nigerian
• An average Libyan consumes 18x more electricity than an average Nigerian
*Electric power consumption measures the production of power plants and combined heat and power plants less transmission, distribution, and transformation losses and own use by heat and power plants.
Data Source: IEA (1980 – 2011), Sart Partners’ estimates (2012-2013)

10 | ���© 2014 Global Association of Risk Professionals. All rights reserved.
Where does Nigeria’s Primary Energy Come From?
Biomass
Natural Gas Hydro
Oil
Angola: Primary energy consumption
Biomass
Natural Gas
Hydro Oil
Nigeria: Primary energy consumption
Natural Gas
Oil
Libya: Primary energy consumption
Natural Gas
Hydro
Oil
Coal
Nuclear Renewable
South Africa Primary energy consumption
Data Source: IEA

11 | ���© 2014 Global Association of Risk Professionals. All rights reserved.
7
112
90
67
45
22
-
20
40
60
80
100
120
Nigeria: Available Capacity Scenarios
Scenarios of Required Capacity In GW
Nigerian Electricity Market: How Big Can It Get?
Scenario 5: 50% of SA per Capita Consumption
Scenario 4: 40% of SA per Capita Consumption
Scenario 3: 30% of SA per Capita Consumption
Scenario 2: 20% of SA per Capita Consumption
Scenario 1: 10% of SA per Capita Consumption
$105bln (NGN 17Tln)
$83bln (NGN 14Tln)
$22bln (NGN 4Tln)
$38bln (NGN 6Tln)
$60bln (NGN 10Tln)
Incremental Investment in
Generation Only
Data Source: Author’s estimation
12 | ���© 2014 Global Association of Risk Professionals. All rights reserved.
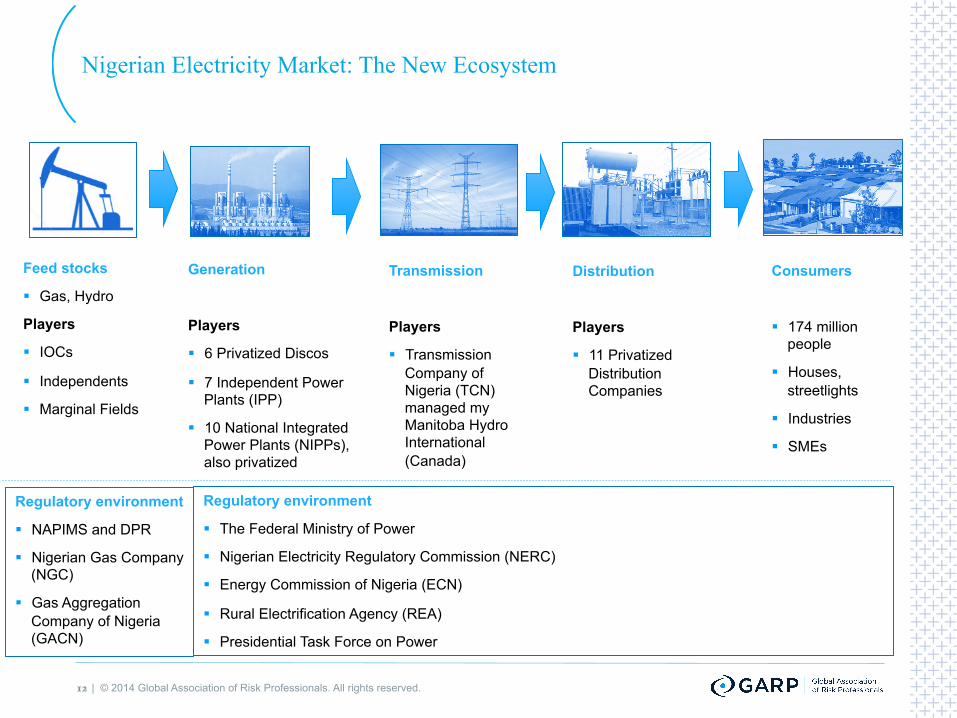
Nigerian Electricity Market: The New Ecosystem
Feed stocks
§ Gas, Hydro
Players
§ IOCs
§ Independents
§ Marginal Fields
Generation
Players
§ 6 Privatized Discos
§ 7 Independent Power Plants (IPP)
§ 10 National Integrated Power Plants (NIPPs), also privatized
Transmission
Players
§ Transmission Company of Nigeria (TCN) managed my Manitoba Hydro International (Canada)
Distribution
Players
§ 11 Privatized Distribution Companies
Consumers
§ 174 million people
§ Houses, streetlights
§ Industries
§ SMEs
Regulatory environment
§ NAPIMS and DPR
§ Nigerian Gas Company (NGC)
§ Gas Aggregation Company of Nigeria (GACN)
Regulatory environment
§ The Federal Ministry of Power
§ Nigerian Electricity Regulatory Commission (NERC)
§ Energy Commission of Nigeria (ECN)
§ Rural Electrification Agency (REA)
§ Presidential Task Force on Power
13 | ���© 2014 Global Association of Risk Professionals. All rights reserved.
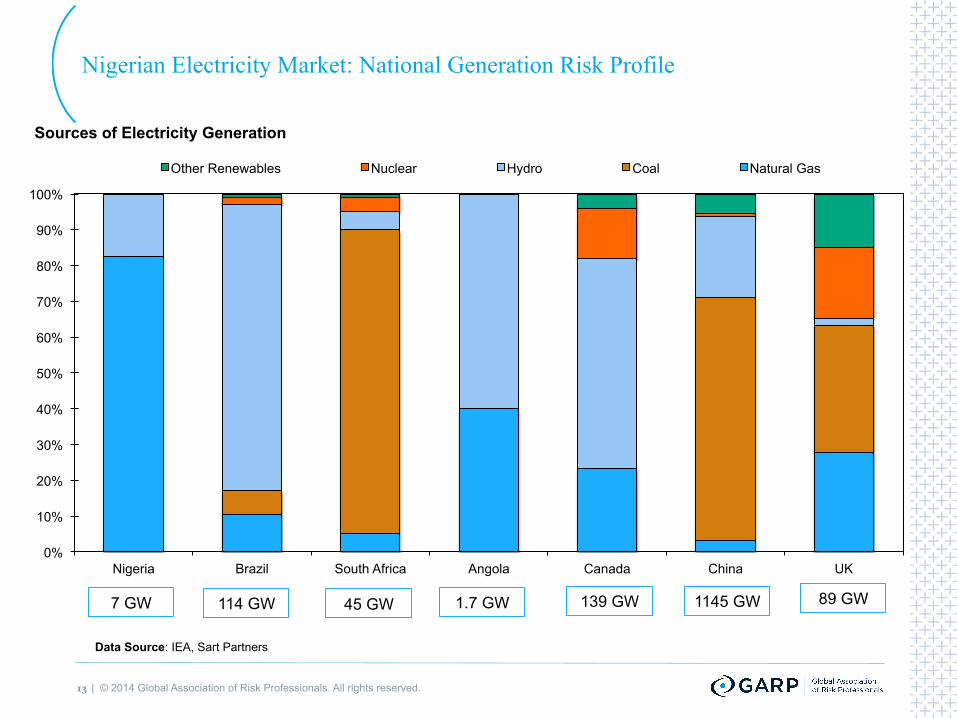
Nigerian Electricity Market: National Generation Risk Profile
0%
10%
20%
30%
40%
50%
60%
70%
80%
90%
100%
Nigeria Brazil South Africa Angola Canada China UK
Sources of Electricity Generation
Other Renewables Nuclear Hydro Coal Natural Gas
114 7 GW 114 GW 45 GW 1.7 GW 139 GW 1145 GW 89 GW
Data Source: IEA, Sart Partners

14 | ���© 2014 Global Association of Risk Professionals. All rights reserved.
How Should the Next GW of Electricity be Generated? -1
North America
Central and South America
Europe
Eurasia
Middle East Africa
Asia & Oceania
-
5,000
10,000
15,000
20,000
25,000
30,000
35,000
1980 1984 1988 1992 1996 2000 2004 2008 2012
Global Carbon Footprint C02 Emission in Million Metric Tones
Global C02 Emission has grown by a factor of
1.8x between 1980 – 2012
Data Source: IEA, Sart Partners

15 | ���© 2014 Global Association of Risk Professionals. All rights reserved.
-
2
4
6
8
10
12
14
16
18
1980 1984 1988 1992 1996 2000 2004 2008 2012
Global C02 Emission Per Capita In Metric Tones
North America Central & South America Europe Eurasia Middle East Africa Asia & Oceania World
Who is Driving Global Per Capita C02 Footprint?
§ Noticeable decline in C02 per
capita in North America and Europe despite sluggish population growth
§ Global C02 growth drivers are Middle East and Asia
§ Africa has been growth neutral
Emission saving GW are becoming more commercially viable globally: § Long term winners:
Renewables
§ Long term losers: Fossil Fuel
How Should the Next GW of Electricity be Generated? -2
Data Source: IEA, Sart Partners

16 | ���© 2014 Global Association of Risk Professionals. All rights reserved.
Nigerian Electricity Market: The Risk Spectrum -1
Electricity market privatization in Nigeria is changing the risk profile of the industry in the following dimensions:
Policy and Regulation More active regulatory
oversight from licensing to pricing
Multi-Stakeholders Increased number of private
actors: Gas producers, Gencos, Discos, others
Investment Massive private sector capital
requirement from generation to distribution
Green Technology Global sustainability requires increased intensity of carbon
saving technology
Social Performance Industry growth means
increased community footprint and community engagements

17 | ���© 2014 Global Association of Risk Professionals. All rights reserved.
Nigerian Electricity Market: The Risk Spectrum
Electricity market privatization in Nigeria is changing the risk profile of the industry in the following dimensions:
Policy and Regulation More active regulatory
oversight from licensing to pricing
Multi-Stakeholders Increased number of private
actors: Gas producers, Gencos, Discos, others
Investment Massive private sector capital
requirement from generation to distribution
Green Technology Global sustainability requires increased intensity of carbon
saving technology
Social Performance Industry growth means
increased community footprint and community engagements
Regulatory risks Credit risks
Market risks
Country risks
Gas Transportation Risk
Power Transmission Risk
18 | ���© 2014 Global Association of Risk Professionals. All rights reserved.
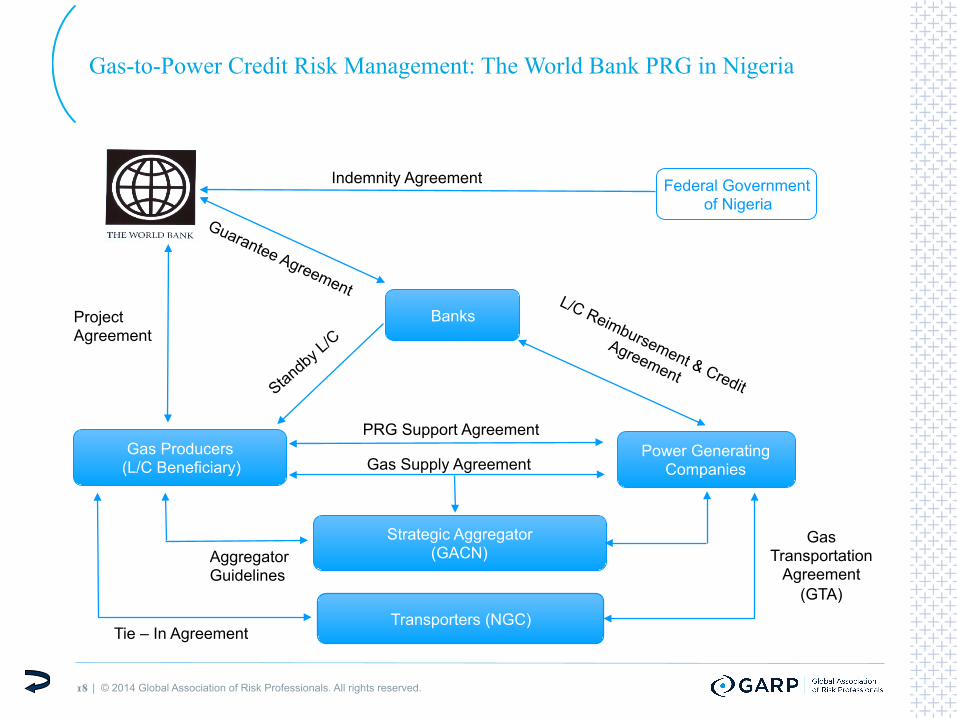
Gas-to-Power Credit Risk Management: The World Bank PRG in Nigeria
Banks
Gas Producers (L/C Beneficiary)
Indemnity Agreement
Project Agreement
Strategic Aggregator (GACN)
PRG Support Agreement
Transporters (NGC)
Gas Transportation
Agreement (GTA)
Tie – In Agreement
Gas Supply Agreement
Aggregator Guidelines
Power Generating Companies
Federal Government of Nigeria

19 | ���© 2014 Global Association of Risk Professionals. All rights reserved.
Credit Risk Management: Bankable PPA with NBET Backed by World Bank PRG
Banks
Power Generators (L/C Beneficiary)
Indemnity Agreement
Project Agreement
NBET
PPA
PPAs
Discos and Eligible Customers
Federal Government of Nigeria
Vesting Contracts
20 | ���© 2014 Global Association of Risk Professionals. All rights reserved.
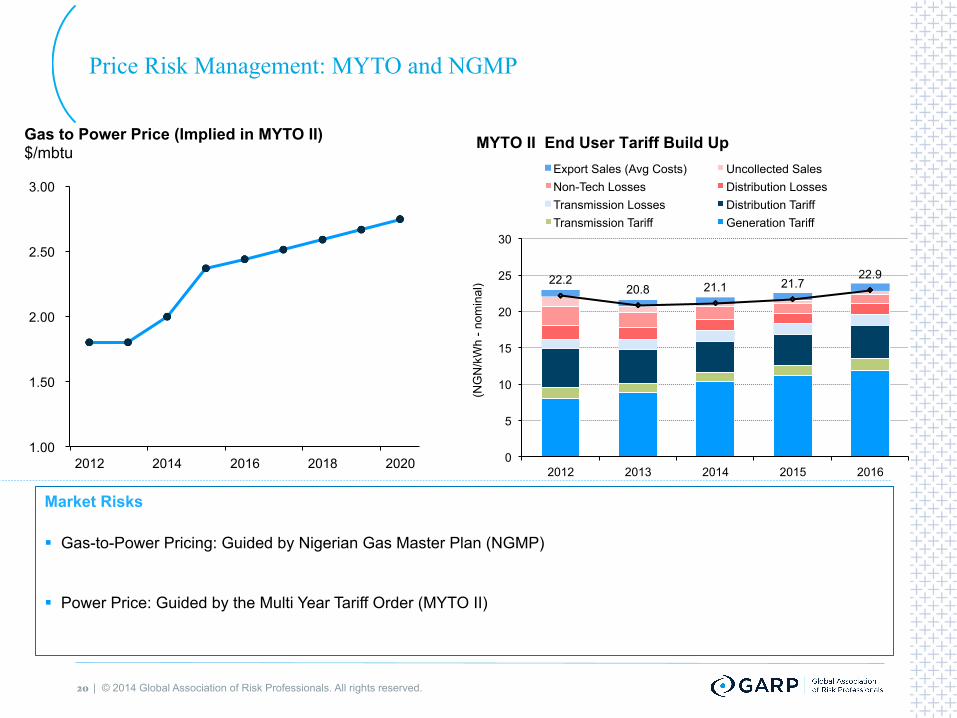
Price Risk Management: MYTO and NGMP
1.00
1.50
2.00
2.50
3.00
2012 2014 2016 2018 2020
Gas to Power Price (Implied in MYTO II) $/mbtu
22.2 20.8 21.1 21.7
22.9
0
5
10
15
20
25
30
2012 2013 2014 2015 2016 (N
GN
/kW
h - n
omin
al)
Export Sales (Avg Costs) Uncollected Sales Non-Tech Losses Distribution Losses Transmission Losses Distribution Tariff Transmission Tariff Generation Tariff
MYTO II End User Tariff Build Up
Market Risks
§ Gas-to-Power Pricing: Guided by Nigerian Gas Master Plan (NGMP)
§ Power Price: Guided by the Multi Year Tariff Order (MYTO II)

21 | ���© 2014 Global Association of Risk Professionals. All rights reserved.
The Value of The ERP Designation
Physical Energy Commodities and
Market
Financial Products and Risk
Management
25%: Oil, gas and Coal Markets
25%: Electricity Markets and Renewable Generation
15%: Financially Traded Energy Products and
Structured Transaction
15%: Energy Commodity Price Formation and Market
Risk
15%: Credit, Counterparty and Country Risk
Assessment
5%: Enterprise Risk Management and Business
Ethics
An end-to-end coverage of the energy ecosystem

22 | ���© 2014 Global Association of Risk Professionals. All rights reserved.
Q & A
Thank You
23 | ���© 2014 Global Association of Risk Professionals. All rights reserved.
Contact
Razaq Ahmed Tel +234(0) 703 926 2406 [email protected] www.sartpartners.com

Creating a culture of risk awareness®
Global Association of Risk Professionals 111 Town Square Place 14th Floor Jersey City, New Jersey 07310 U.S.A. + 1 201.719.7210 2nd Floor Bengal Wing 9A Devonshire Square London, EC2M 4YN U.K. + 44 (0) 20 7397 9630 www.garp.org
About GARP | The Global Association of Risk Professionals (GARP) is a not-for-profit global membership organization dedicated to preparing professionals and organizations to make better informed risk decisions. Membership represents over 150,000 risk management practitioners and researchers from banks, investment management firms, government agencies, academic institutions, and corporations from more than 195 countries and territories. GARP administers the Financial Risk Manager (FRM®) and the Energy Risk Professional (ERP®) Exams; certifications recognized by risk professionals worldwide. GARP also helps advance the role of risk management via comprehensive professional education and training for professionals of all levels. www.garp.org.
24 | ���© 2014 Global Association of Risk Professionals. All rights reserved.


![Risk Management (3C05/D22) Unit 3: Risk Management · 2004. 4. 29. · Risk-management planning Risk resolution [Boehm 1991] Risk monitoring Software risk management steps & techniques](https://img.dokumen.tips/doc/110x75/6122993708b35f7a264d6759/risk-management-3c05d22-unit-3-risk-2004-4-29-risk-management-planning.jpg)