Embed Size (px)
Citation preview
IB 12
1
Energy, Power and Climate Change
Degraded energy: Examples:
Second Law of Thermodynamics:
1) The total entropy of the universe is increasing. 2) No cyclical process (engine) is ever 100% efficient. Some energy is transferred
out of the system (lost to the surroundings) as unusable energy (degraded energy).
Sankey diagrams (energy flow diagrams) are used to keep track of energy transfers and transformations in any process.
1) Thickness of arrow is proportional to amount of energy. 2) Degraded energy points away from main flow of energy. 3) Total energy in = total energy out.
Sankey diagram for a flashlight:
Sankey diagram for a car engine:
Sankey diagram for an electric motor:
See Hamper p. 171
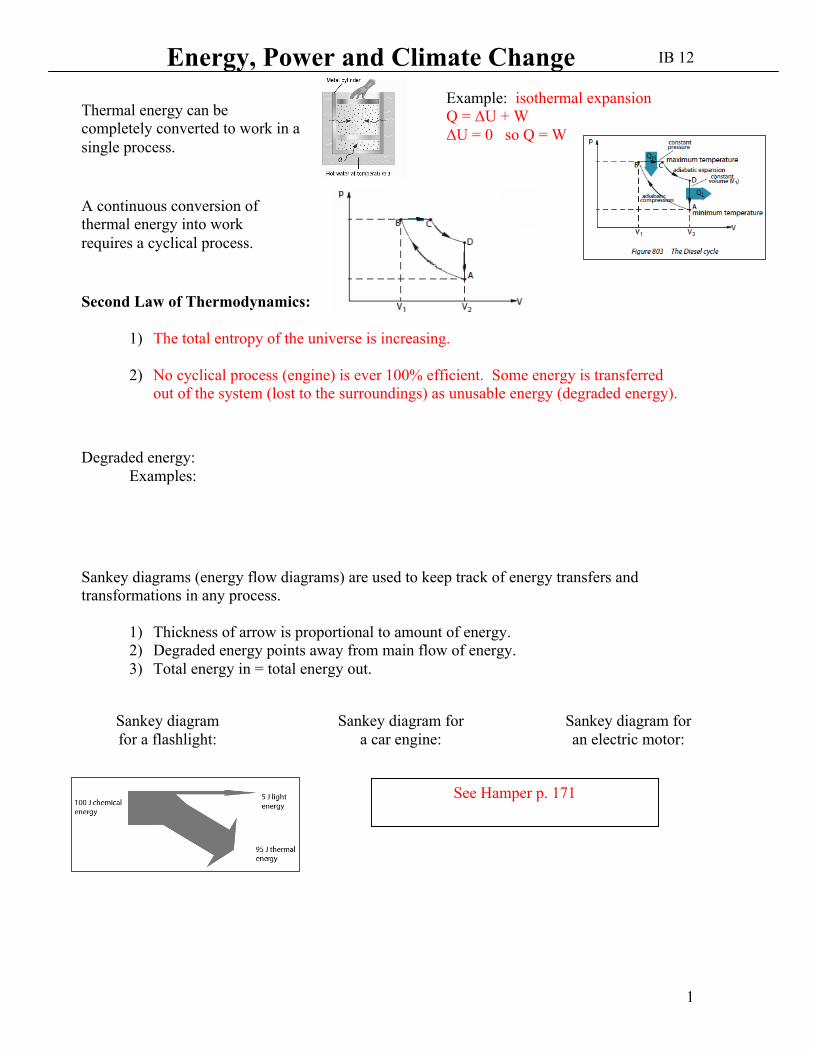
Thermal energy can be completely converted to work in a single process.
Example: isothermal expansion Q = ΔU + W ΔU = 0 so Q = W
A continuous conversion of thermal energy into work requires a cyclical process.
IB 12
2
Type of fuel Renewable? CO2 emissions?
Fossil fuels
Nuclear
Hydroelectric
Wind
Solar
Wave
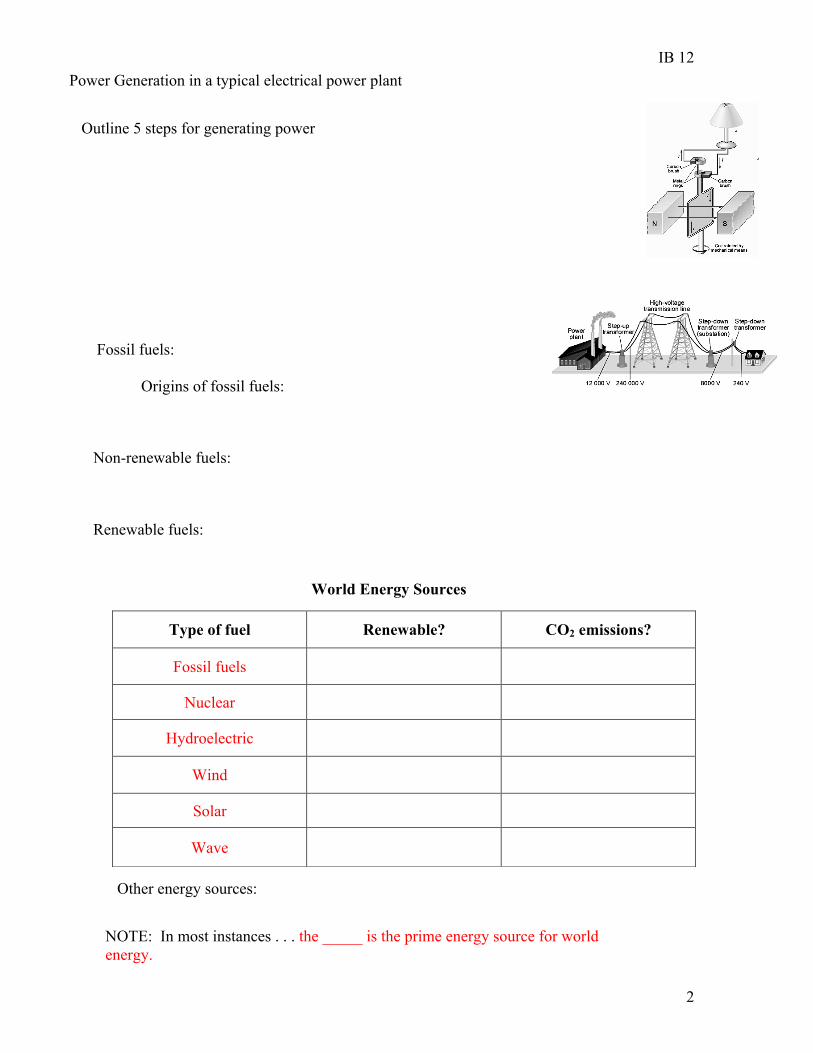
Power Generation in a typical electrical power plant
Outline 5 steps for generating power
Fossil fuels:
Origins of fossil fuels:
Non-renewable fuels:
Renewable fuels:
World Energy Sources
Other energy sources:
NOTE: In most instances . . . the _____ is the prime energy source for world energy.
IB 12
3
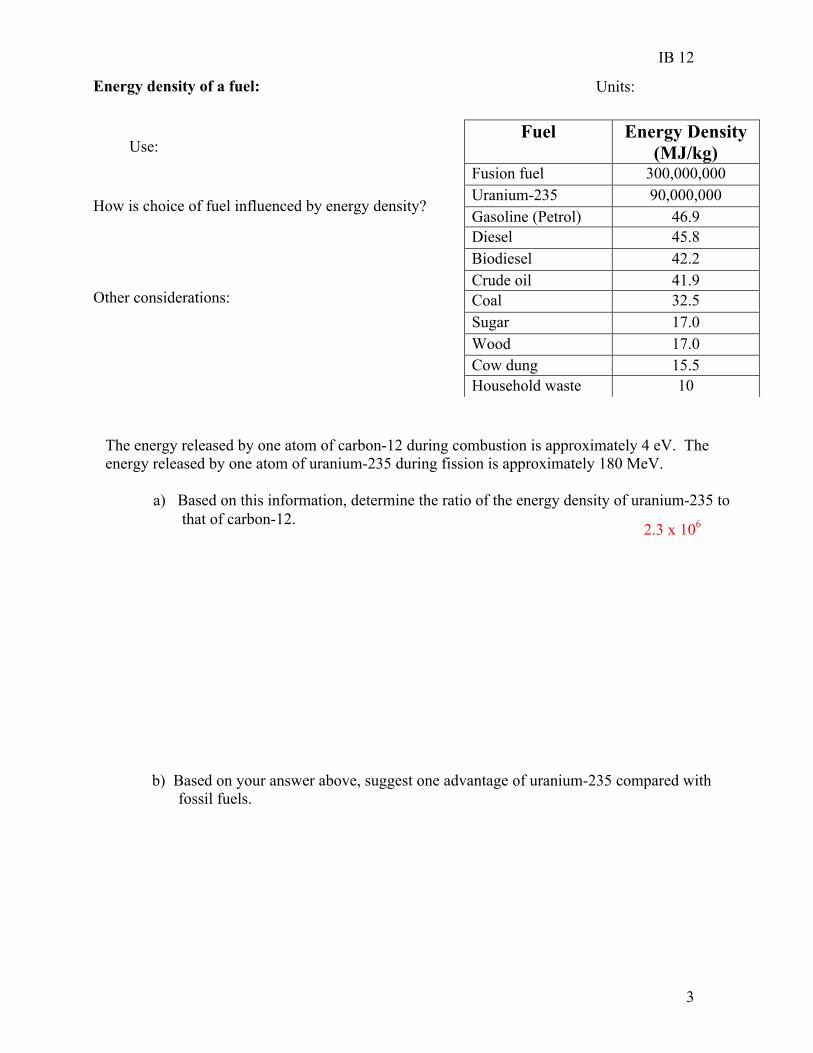
Fuel Energy Density (MJ/kg)
Fusion fuel 300,000,000 Uranium-235 90,000,000 Gasoline (Petrol) 46.9 Diesel 45.8 Biodiesel 42.2 Crude oil 41.9 Coal 32.5 Sugar 17.0 Wood 17.0 Cow dung 15.5 Household waste 10
Energy density of a fuel: Units:
Use:
How is choice of fuel influenced by energy density? Other considerations:
The energy released by one atom of carbon-12 during combustion is approximately 4 eV. The energy released by one atom of uranium-235 during fission is approximately 180 MeV.
a) Based on this information, determine the ratio of the energy density of uranium-235 to that of carbon-12.
2.3 x 10⁶
b) Based on your answer above, suggest one advantage of uranium-235 compared with fossil fuels.

IB 12
4
Fossil Fuel Power Production
Historical and geographical reasons for the widespread use of fossil fuels:
1. industrialization led to a higher rate of energy usage (Industrial Revolution) 2. industries developed near large deposits of fossil fuels (coal towns)
Transportation and storage considerations:
1. Natural gas is usually transported and stored in pipelines.
Advantages:
Disadvantages: unsightly
2. Many oil refineries are located near the sea close to large cities. Oil is transported via ships, trucks, and pipelines.
Advantages: Disadvantages:
3. Power stations using coal and steel mills are usually located near coal mines.
Advantages:
Disadvantages:
Use of fossil fuels for generating electricity Advantages: Disadvantages:
IB 12
5
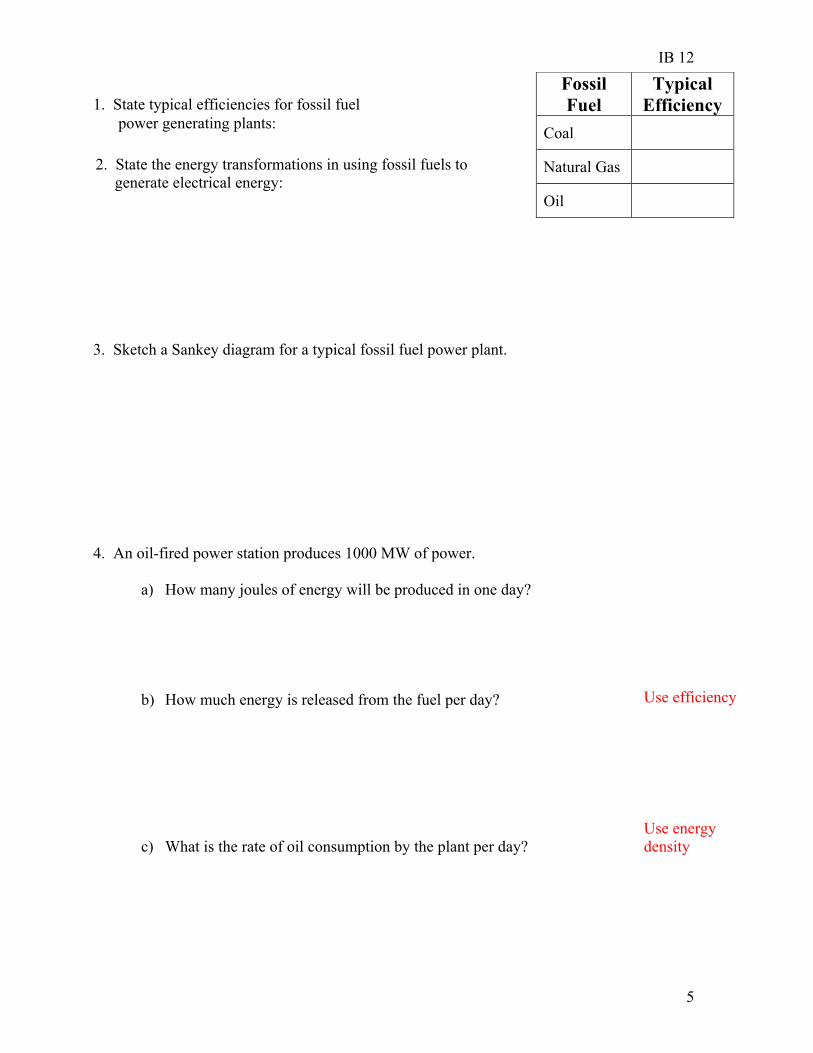
Fossil Fuel
Typical Efficiency
Coal
Natural Gas
Oil
2. State the energy transformations in using fossil fuels to generate electrical energy:
3. Sketch a Sankey diagram for a typical fossil fuel power plant.
1. State typical efficiencies for fossil fuel power generating plants:
4. An oil-fired power station produces 1000 MW of power.
a) How many joules of energy will be produced in one day?
b) How much energy is released from the fuel per day?
c) What is the rate of oil consumption by the plant per day?
Use efficiency
Use energy density
IB 12
6
5. A 250 MW coal-fired power plant burns coal with an energy density of 35 MJ/kg. Water enters the cooling tower at a temperature of 293 K and leaves at a temperature of 350 K and the water flows through the cooling tower at a rate of 4200 kg/s.
a) Calculate the energy removed by the water each second. 1000 MW
b) Calculate the energy produced by the combustion of coal each second. 1250 MW
c) Calculate the overall efficiency of the power station. 20%
d) Calculate the mass of coal burned each second. 35.7 kg
IB 12
7
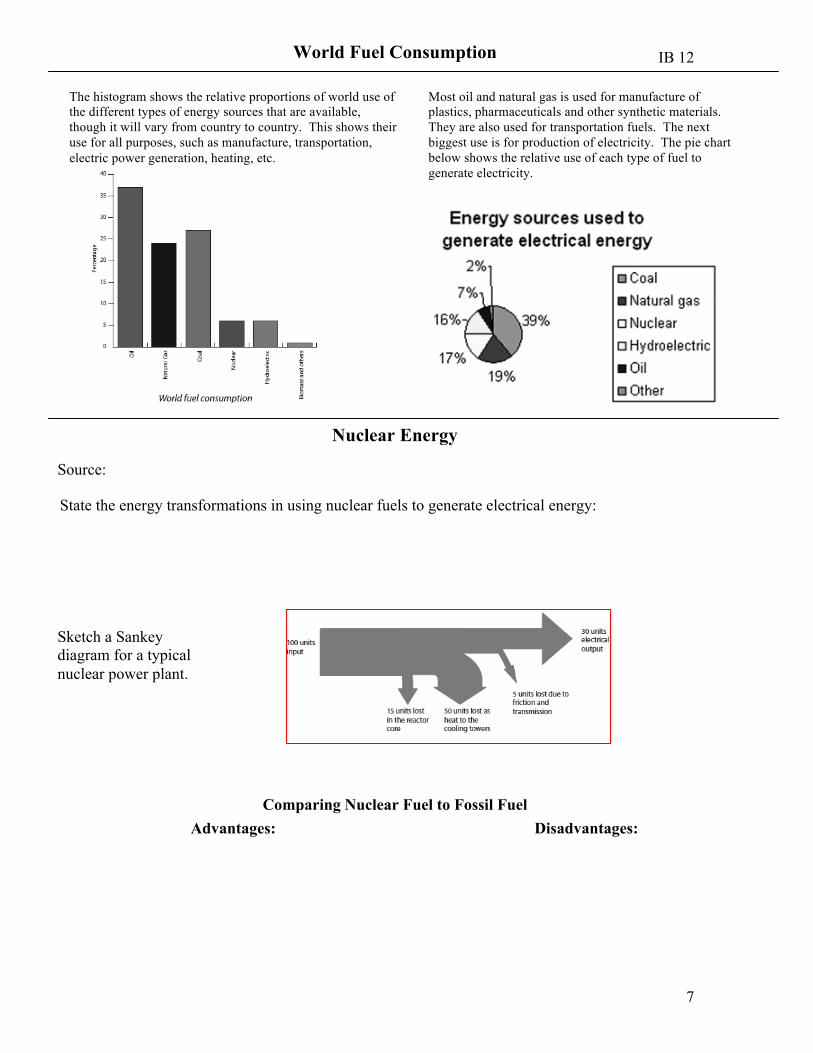
World Fuel Consumption
The histogram shows the relative proportions of world use of the different types of energy sources that are available, though it will vary from country to country. This shows their use for all purposes, such as manufacture, transportation, electric power generation, heating, etc.
Most oil and natural gas is used for manufacture of plastics, pharmaceuticals and other synthetic materials. They are also used for transportation fuels. The next biggest use is for production of electricity. The pie chart below shows the relative use of each type of fuel to generate electricity.
Nuclear Energy
Source:
Sketch a Sankey diagram for a typical nuclear power plant.
State the energy transformations in using nuclear fuels to generate electrical energy:
Comparing Nuclear Fuel to Fossil Fuel Advantages:
Disadvantages:
IB 12
8
Solar Power
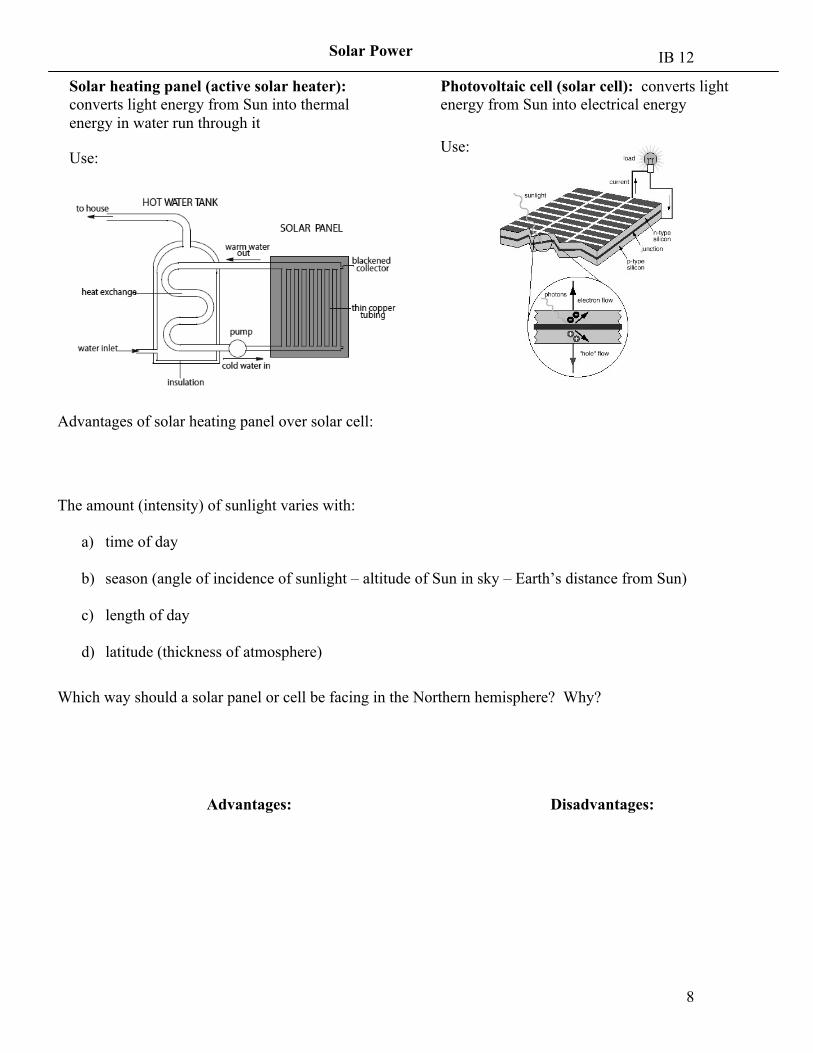
Solar heating panel (active solar heater): converts light energy from Sun into thermal energy in water run through it
Photovoltaic cell (solar cell): converts light energy from Sun into electrical energy
Use: Use:
The amount (intensity) of sunlight varies with:
a) time of day b) season (angle of incidence of sunlight – altitude of Sun in sky – Earth’s distance from Sun)
c) length of day
d) latitude (thickness of atmosphere)
Which way should a solar panel or cell be facing in the Northern hemisphere? Why?
Advantages:
Disadvantages:
Advantages of solar heating panel over solar cell:

IB 12
9
1. An active solar heater whose efficiency is 32% is used to heat 1400 kg of water from 200 C to 500 C. The average power received from the Sun in that location is 0.90 kW/m2.
a) How much energy will the solar heater need to provide to heat the water?
b) How much energy will be needed from the Sun to heat the water?
c) Calculate the area of the solar heater necessary to heat the water in 2.0 hours.
2. A photovoltaic cell with an area of 0.40 m2 is placed in a position where the intensity of the Sun is 1.0 kW/m2. a) If the cell is 15% efficient, how much power does it produce?
b) If the potential difference across the cell is 0.50 V, how much current does it produce?
c) Compare placing 10 of these solar cells in series and in parallel.
IB 12
10
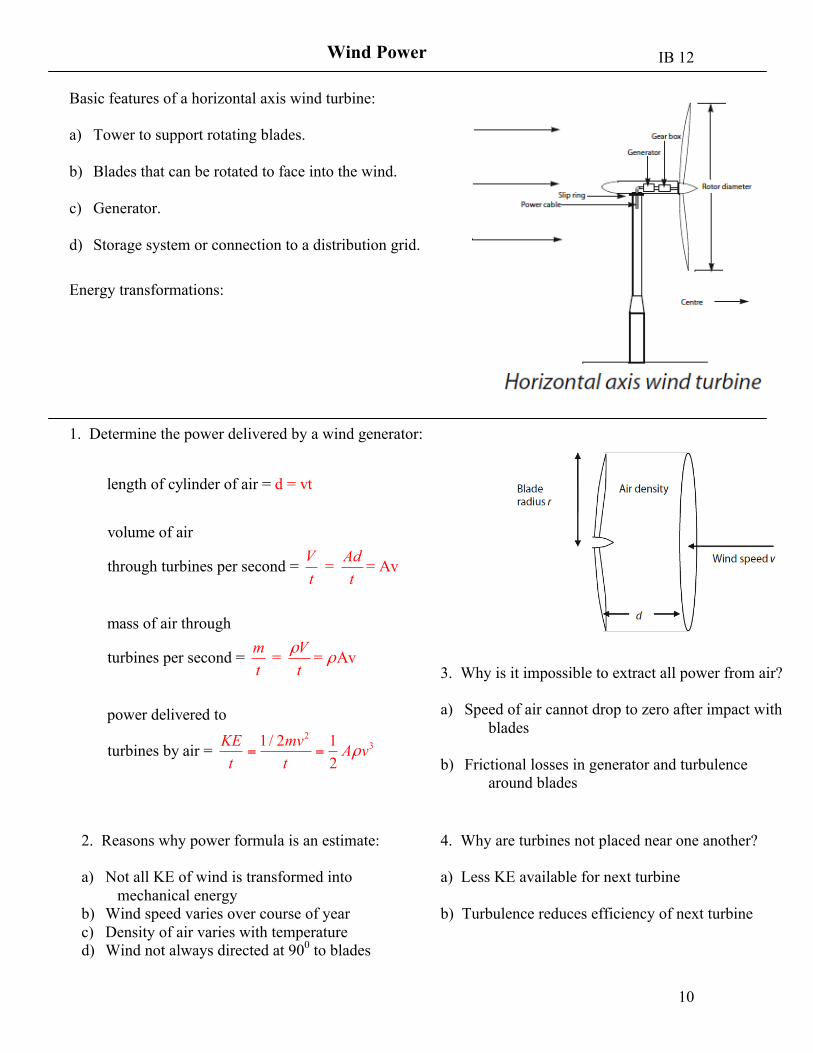
3. Why is it impossible to extract all power from air? a) Speed of air cannot drop to zero after impact with
blades b) Frictional losses in generator and turbulence
around blades
4. Why are turbines not placed near one another? a) Less KE available for next turbine b) Turbulence reduces efficiency of next turbine
Wind Power
Basic features of a horizontal axis wind turbine: a) Tower to support rotating blades. b) Blades that can be rotated to face into the wind. c) Generator.
d) Storage system or connection to a distribution grid.
Energy transformations:
1. Determine the power delivered by a wind generator:
23
length of cylinder of air =
volume of air
through turbines per second =
mass of air
d = vt
= = Av
= =
through
turbines per second =
power delivered to
turbines by air =
Av
1/ 2 1 2
V Adt t
m Vt t
KE mv A vt t
ρρ
ρ= =
2. Reasons why power formula is an estimate: a) Not all KE of wind is transformed into
mechanical energy b) Wind speed varies over course of year c) Density of air varies with temperature d) Wind not always directed at 900 to blades

IB 12
11
1. A wind turbine has blades 20 m long and the speed of the wind is 25 m/s on a day when the air density is 1.3 kg/m3. Calculate the power that could be produced if the turbine is 30% efficient.
2. A wind generator is being used to power a solar heater pump. If the power of the solar heater pump is 0.50 kW, the average local wind speed is 8.0 m/s and the average density pf air is 1.1 kg/m3, deduce whether it would be possible to power the pump using the wind generator.
Advantages: Disadvantages:
IB 12
12
Hydroelectric Power
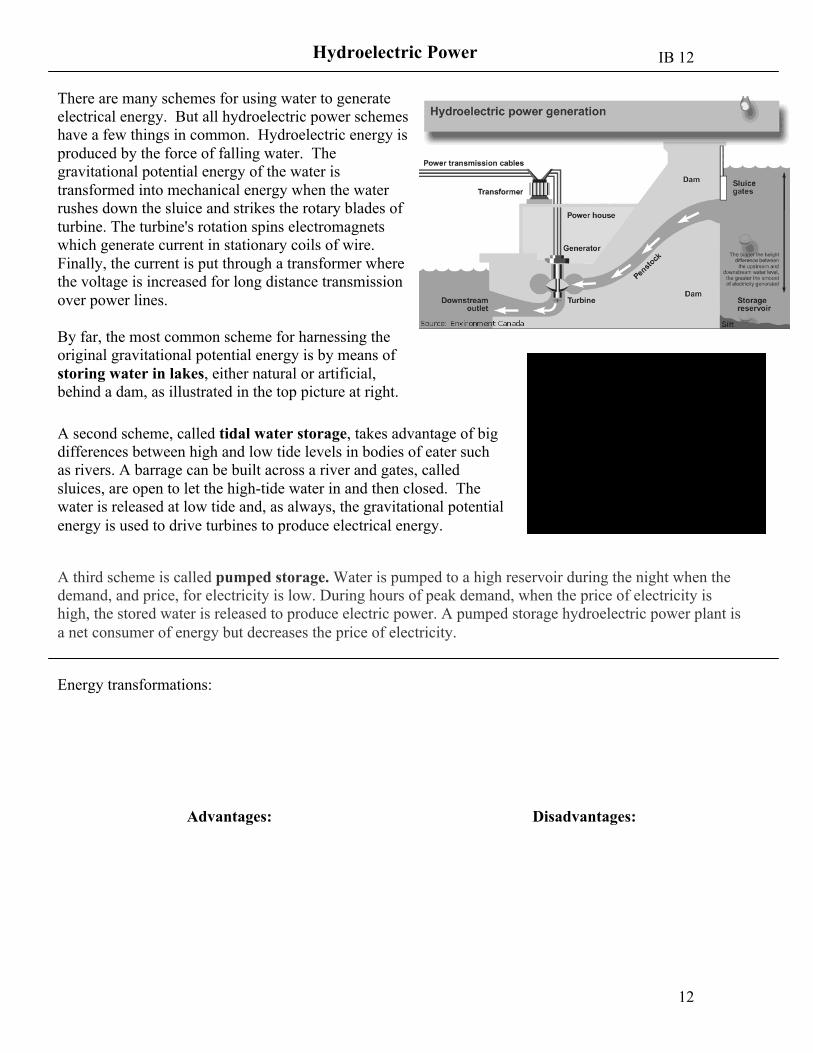
A third scheme is called pumped storage. Water is pumped to a high reservoir during the night when the demand, and price, for electricity is low. During hours of peak demand, when the price of electricity is high, the stored water is released to produce electric power. A pumped storage hydroelectric power plant is a net consumer of energy but decreases the price of electricity.
A second scheme, called tidal water storage, takes advantage of big differences between high and low tide levels in bodies of eater such as rivers. A barrage can be built across a river and gates, called sluices, are open to let the high-tide water in and then closed. The water is released at low tide and, as always, the gravitational potential energy is used to drive turbines to produce electrical energy.
There are many schemes for using water to generate electrical energy. But all hydroelectric power schemes have a few things in common. Hydroelectric energy is produced by the force of falling water. The gravitational potential energy of the water is transformed into mechanical energy when the water rushes down the sluice and strikes the rotary blades of turbine. The turbine's rotation spins electromagnets which generate current in stationary coils of wire. Finally, the current is put through a transformer where the voltage is increased for long distance transmission over power lines. By far, the most common scheme for harnessing the original gravitational potential energy is by means of storing water in lakes, either natural or artificial, behind a dam, as illustrated in the top picture at right.
Energy transformations:
Advantages:
Disadvantages:
IB 12
13
1. A barrage is placed across the mouth of a river at a tidal power station. If the barrage height is 15 meters and water flows through 5 turbines at a rate of 100 kg/s in each turbine, calculate the power that could be produced of the power plant is 70% efficient. 2.6 x 10⁴W
Use average height for EP = mgh
2. A reservoir that is 1.0 km wide, 2.0 km long and 25 meters deep is held behind a dam. The top of this artificial lake is 100 meters above the river where the water is let out at the base of the dam. Assume the density of water is 1000 kg/m3.
a) Calculate the energy stored in the reservoir. 4.3 x 10¹³ J
b) Calculate the power generated by the water if it flows at a rate of 1.0 m3 per second through the turbine. 875 kW
IB 12
14
Wave Power
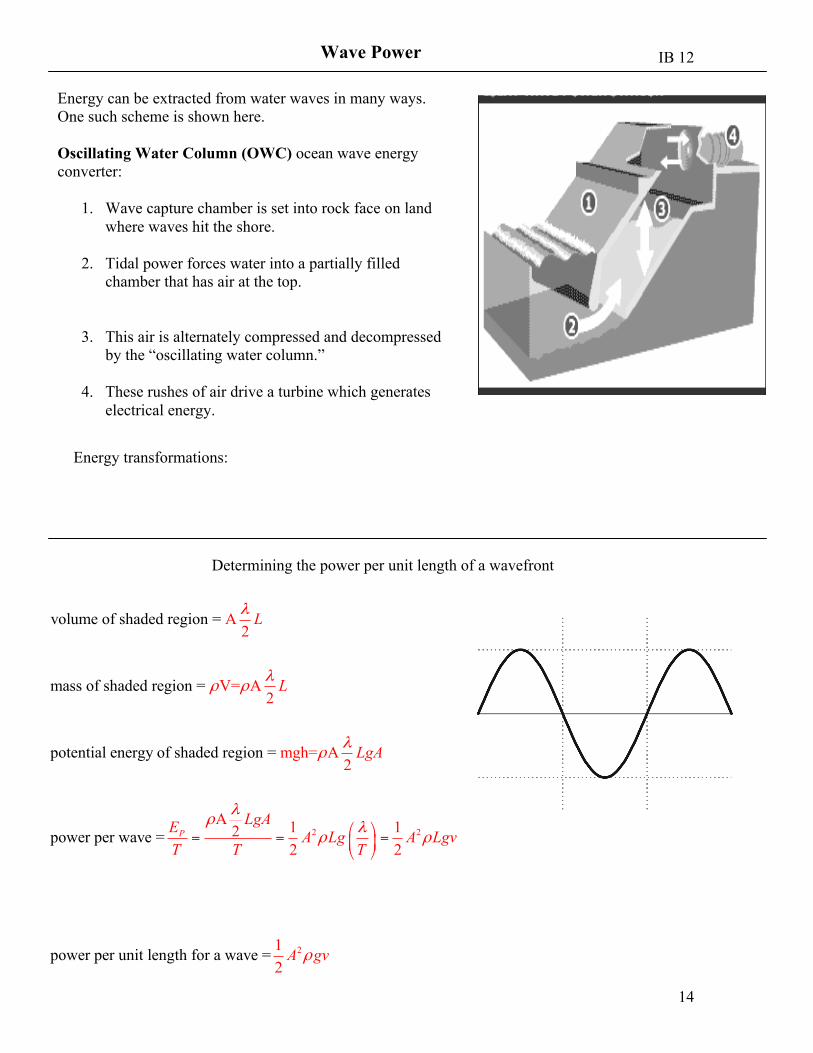
Energy can be extracted from water waves in many ways. One such scheme is shown here. Oscillating Water Column (OWC) ocean wave energy converter:
1. Wave capture chamber is set into rock face on land where waves hit the shore.
2. Tidal power forces water into a partially filled
chamber that has air at the top.
3. This air is alternately compressed and decompressed by the “oscillating water column.”
4. These rushes of air drive a turbine which generates
electrical energy.
Energy transformations:
Determining the power per unit length of a wavefront
2 2
2
A2
V= A2
mgh
volume of shaded region =
mass of shaded region =
potential energy of shaded region =
power per wave =
power per unit length for a w
= A2
A 1 122 2
e = 1av2
P
L
L
LgA
LgAE A Lg A LgvT T T
A
λ
λρ ρ
λρ
λρ λ
ρ ρ⎛ ⎞= = =⎜ ⎟⎝ ⎠
gvρ

IB 12
15
Advantages:
Disadvantages:
1. If a wave is 3 meters high and has a 100 meter wavelength and 0.1 Hz frequency, estimate the power of each meter of the wavefront. 114 kW per meter
2. Waves of amplitude 1.5 meter roll onto a beach at a rate of one every 12 seconds with a speed of 10 m/s. Calculate:
a) how much power they carry per meter of shoreline
b) the power along a 2 km stretch of beach.
IB 12
16
Black-Body Radiation
Black-body radiation:
When heated, a low-pressure gas will . . . When heated, a solid will . . .
This means that an object that acts as a black body will . . .
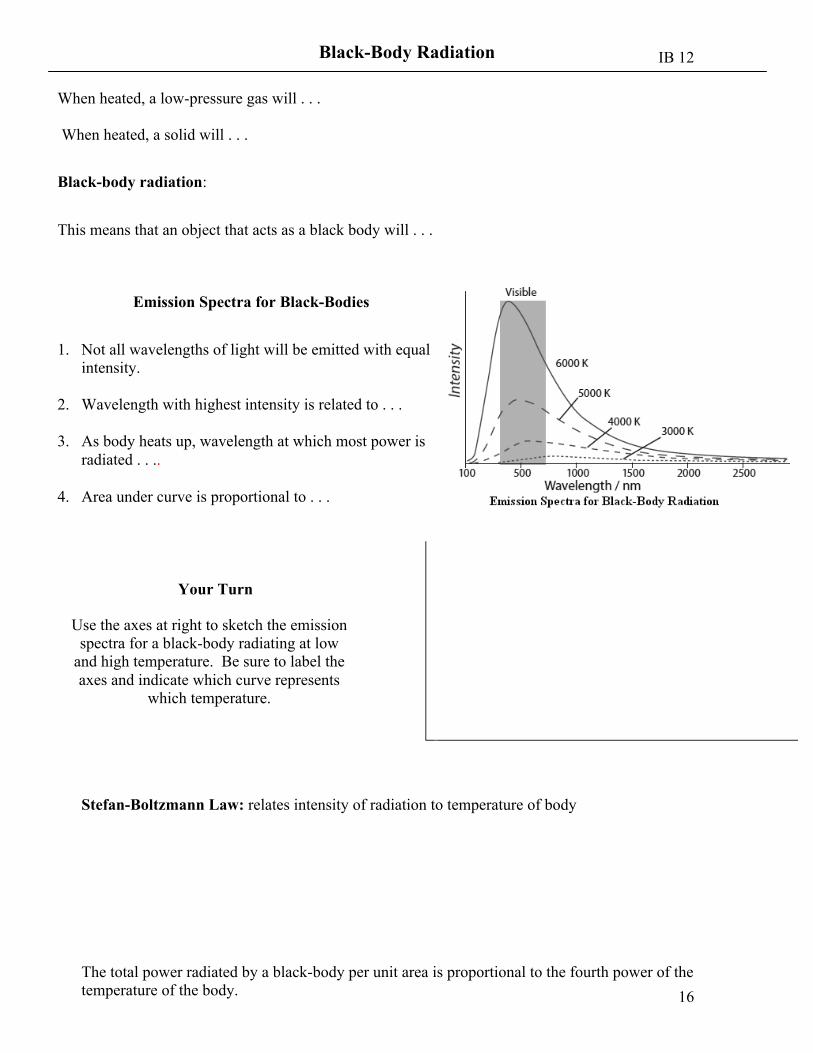
Emission Spectra for Black-Bodies
1. Not all wavelengths of light will be emitted with equal intensity.
2. Wavelength with highest intensity is related to . . . 3. As body heats up, wavelength at which most power is
radiated . . .. 4. Area under curve is proportional to . . .
Your Turn
Use the axes at right to sketch the emission spectra for a black-body radiating at low
and high temperature. Be sure to label the axes and indicate which curve represents
which temperature.
Stefan-Boltzmann Law: relates intensity of radiation to temperature of body
The total power radiated by a black-body per unit area is proportional to the fourth power of the temperature of the body.
IB 12
17
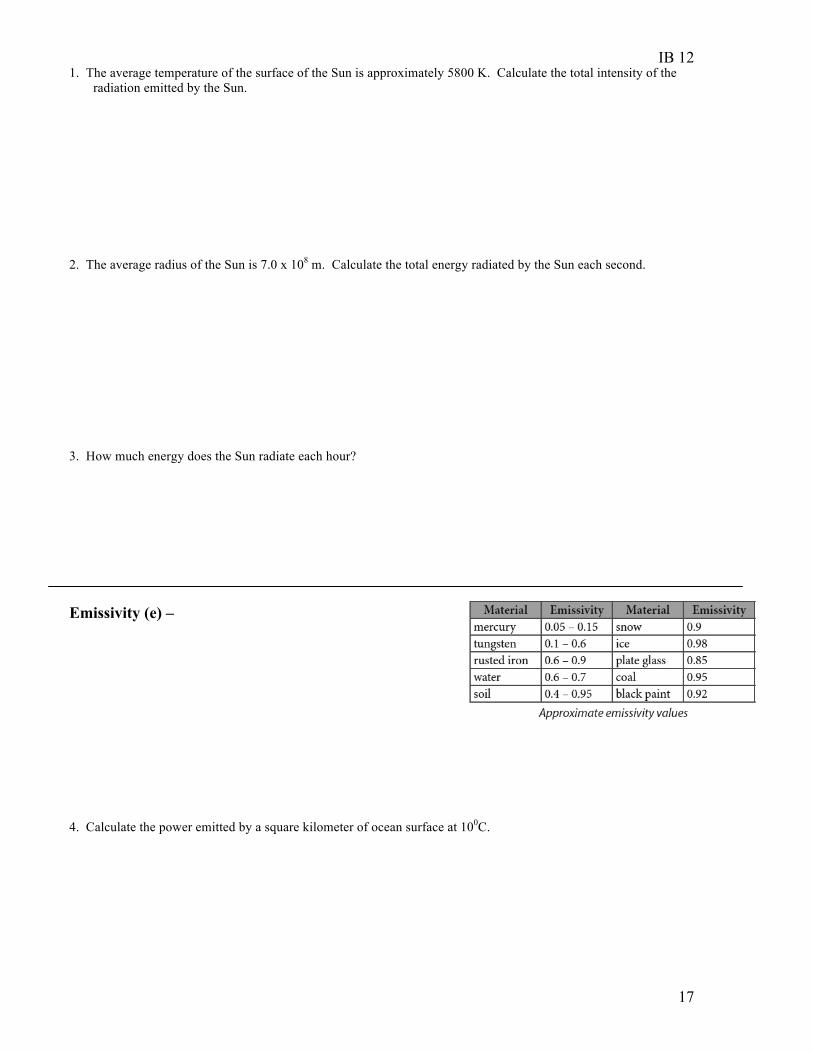
1. The average temperature of the surface of the Sun is approximately 5800 K. Calculate the total intensity of the radiation emitted by the Sun.
2. The average radius of the Sun is 7.0 x 10⁸ m. Calculate the total energy radiated by the Sun each second.
3. How much energy does the Sun radiate each hour?
Emissivity (e) –
4. Calculate the power emitted by a square kilometer of ocean surface at 100C.

IB 12
18
Solar Radiation
Calculate the intensity of the Sun’s radiation incident on Earth.
See pg. 3 of data booklet for 1.5 x 10¹¹ m
State some assumptions made in the above calculation.
Solar Constant: Accepted value:
Average incoming solar radiation:
Accepted value: =
IB 12
19
Albedo
Meaning:
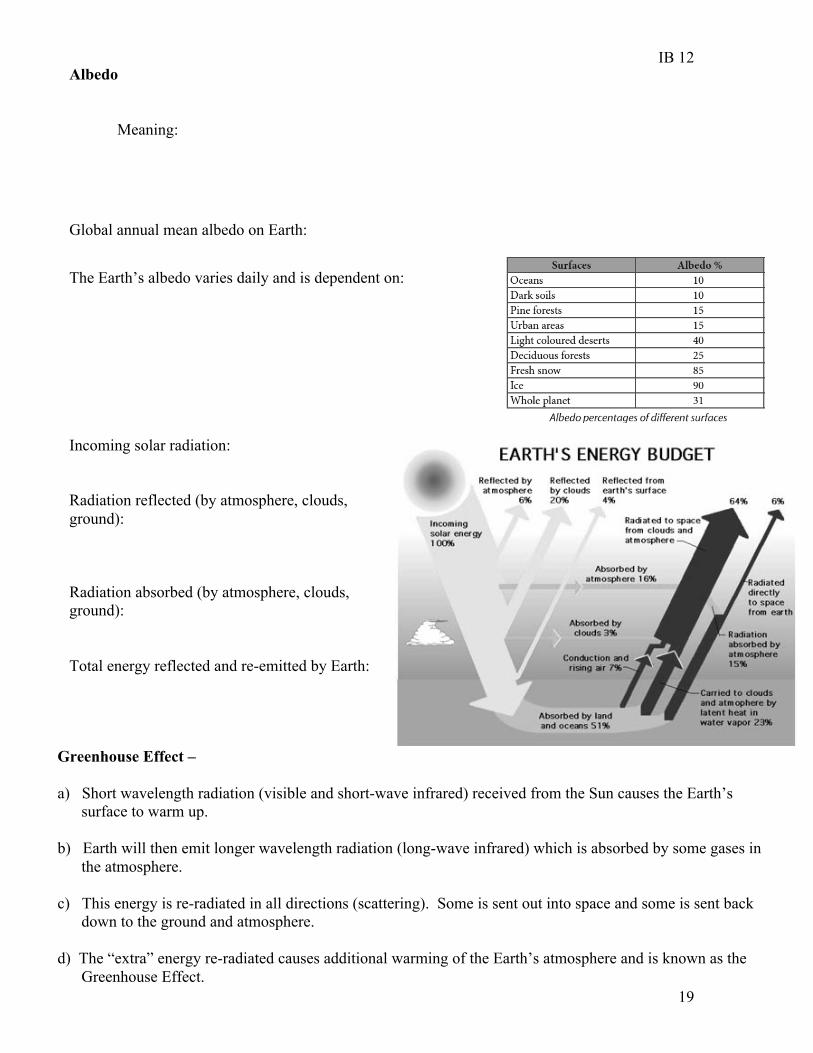
Global annual mean albedo on Earth:
The Earth’s albedo varies daily and is dependent on:
Greenhouse Effect – a) Short wavelength radiation (visible and short-wave infrared) received from the Sun causes the Earth’s
surface to warm up. b) Earth will then emit longer wavelength radiation (long-wave infrared) which is absorbed by some gases in
the atmosphere. c) This energy is re-radiated in all directions (scattering). Some is sent out into space and some is sent back
down to the ground and atmosphere. d) The “extra” energy re-radiated causes additional warming of the Earth’s atmosphere and is known as the
Greenhouse Effect.
Incoming solar radiation: Radiation reflected (by atmosphere, clouds, ground): Radiation absorbed (by atmosphere, clouds, ground): Total energy reflected and re-emitted by Earth:
IB 12
20
Greenhouse Gases: each has natural and man-made origins
1. Carbon Dioxide (CO2): product of photosynthesis in plants, product of fossil fuel combustion 2. Methane (CH4): product of decay and fermentation and from livestock, component of natural gas
3. Water Vapor (H2O): evaporation
4. Nitrous Oxide (N2O): product of livestock, produced in some manufacturing processes
Enhanced (Anthropogenic) Greenhouse Effect – Human activities have released extra carbon dioxide into the atmosphere, thereby enhancing or amplifying the greenhouse effect. Major cause: Possible effect: Outcome:
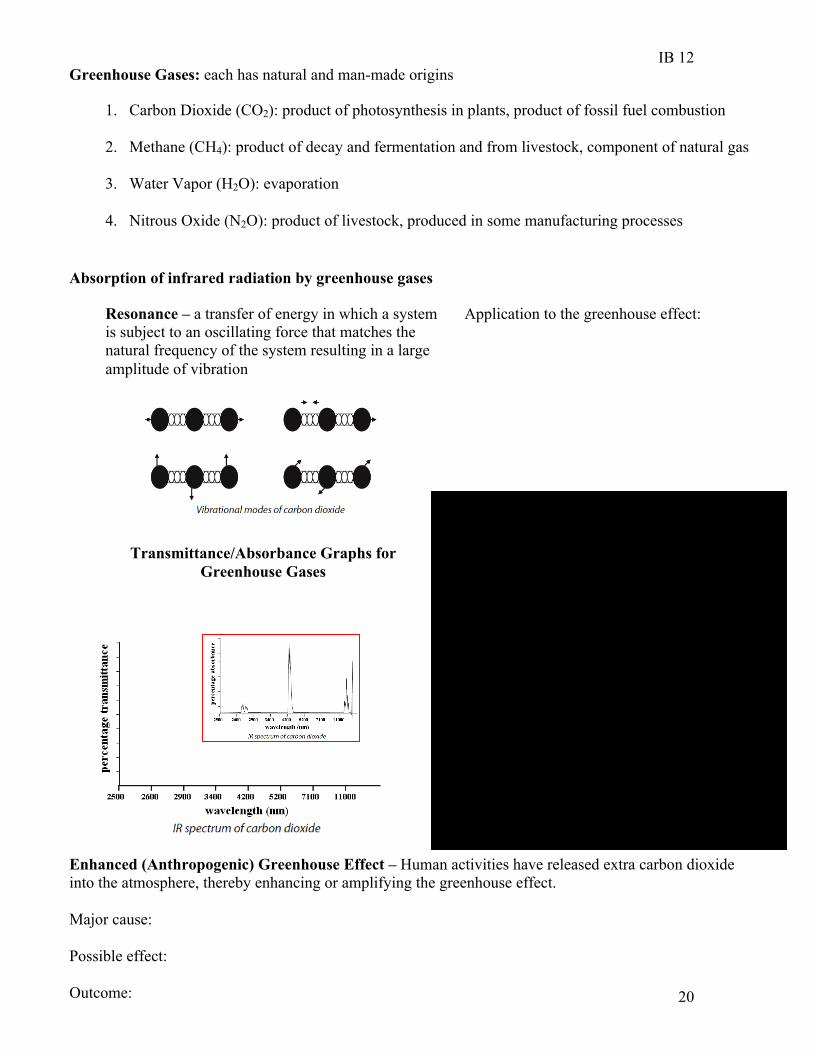
Absorption of infrared radiation by greenhouse gases
Resonance – a transfer of energy in which a system is subject to an oscillating force that matches the natural frequency of the system resulting in a large amplitude of vibration
Application to the greenhouse effect:
Transmittance/Absorbance Graphs for Greenhouse Gases
IB 12
21
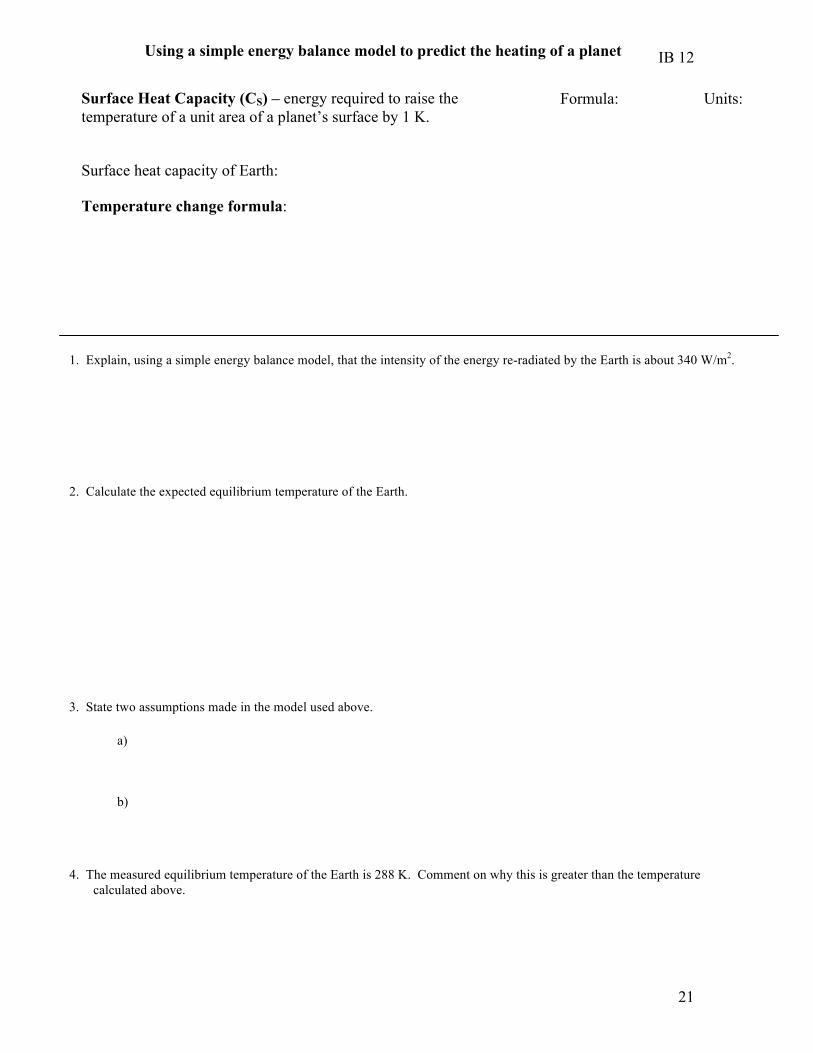
2. Calculate the expected equilibrium temperature of the Earth.
4. The measured equilibrium temperature of the Earth is 288 K. Comment on why this is greater than the temperature calculated above.
Surface Heat Capacity (CS) – energy required to raise the temperature of a unit area of a planet’s surface by 1 K.
Formula: Units:
Using a simple energy balance model to predict the heating of a planet
Temperature change formula:
Surface heat capacity of Earth:
1. Explain, using a simple energy balance model, that the intensity of the energy re-radiated by the Earth is about 340 W/m2.
3. State two assumptions made in the model used above. a)
b)
IB 12
22
5. Use the measured equilibrium temperature of Earth to determine the emissivity of Earth.
6. Suppose a change causes the intensity of the radiation emitted by Earth to decrease 10%. a) Suggest a mechanism by which this might happen. I
b) Calculate the new intensity of radiation emitted by Earth.
c) Calculate the amount by which earth’s temperature would rise over the course of a year as a result.
d) State some limitations of the model used in the calculation above. 1. 2.

IB 12
23
Global Warming
Possible models suggested to explain global warming:
1. changes in the composition of greenhouse gases may increases amount of solar radiation trapped in Earth’s atmosphere
2. increased solar flare activity may increase solar radiation
3. cyclical changes in the Earth’s orbit may increase solar radiation
4. volcanic activity may increases amount of solar radiation trapped in Earth’s atmosphere
Global Warming: records show that the mean temperature of Earth has been increasing in recent years.
Global mean surface temperature anomaly relative to 1961–1990
In specific terms, an increase of 1 or more Celsius degrees in a period of one hundred to two hundred years would be considered global warming. Over the course of a single century, an increase of even 0.4 degrees Celsius would be significant. The Intergovernmental Panel on Climate Change (IPCC), a group of over 2,500 scientists from countries across the world, convened in Paris in February, 2007 to compare and advance climate research. The scientists determined that the Earth has warmed .6 degrees Celsius between 1901 and 2000. When the timeframe is advanced by five years, from 1906 to 2006, the scientists found that the temperature increase was 0.74 degrees Celsius.
In 2007, the IPCC report stated that:
“Most of the observed increase in globally averaged temperature since the mid-20th century is very likely due to the increase in anthropogenic [human-caused] greenhouse gas concentrations.” (the enhanced greenhouse effect) Major likely cause of the enhanced greenhouse effect:
Evidence linking global warming to increased levels of greenhouse gases
International Ice Core Research: Between 1987 and 1998, several ice cores were drilled at the Russian Antarctic base at Vostok, the deepest being more than 3600 meters below the surface. Ice core data are unique: every year the ice thaws and then freezes again, forming a new layer. Each layer traps a small quantity of the ambient air, and radioactive isotopic analysis of this trapped air can determine mean temperature variations from the current mean value and carbon dioxide concentrations. The depths of the cores obtained at Vostok means that a data record going back more than 420,000 years has been built up through painstaking analysis.
Inspect the graphical representation of the ice core data and draw a conclusion.
IB 12
24
Mechanisms that may increase the rate of global warming
1. 2. 3. 4. 5.
Coefficient of Volume Expansion (β) – Formula: Units:
Rise in sea-levels
As the temperature of a liquid rises, it expands. If this is applied to water, then as the average temperature of the oceans increases, they will expand and the mean sea-level will rise. This has already been happening over the last 100 years as the sea level has risen by 20 cm. This has had an effect on island nations and low-lying coastal areas that have become flooded.
Precise predictions regarding the rise in sea-levels are hard to make for such reasons as:
1. 2.
IB 12
25
Possible solutions for reducing the enhanced greenhouse effect
List 4.
International efforts to reduce the enhanced greenhouse effect
1. Intergovernmental Panel on Climate Change (IPCC): Explain
2. Kyoto Protocol: Explain
3. Asia-Pacific Partnership of Clean Development and Climate (APPCDC): Explain