Embed Size (px)
Citation preview
Wireless Sensor Network, 2010, 2, 100-107 doi:10.4236/wsn.2010.22014 y 2010 (http://www.SciRP.org/journal/wsn/).
Copyright © 2010 SciRes. WSN
Published Online Februar
Energy Harvesting Strategy Using Piezoelectric Element Driven by Vibration Method
Dong-Gun Kim, So-Nam Yun, Young-Bog Ham, Jung-Ho Park Energy Plant Research Div., Korea Institute of Machinery& Materials, Daejeon, Korea
E-mail: dgkim82, ysn688, [email protected] Received October 28, 2009; revised November 17, 2009; accepted December 8, 2009
Abstract This study demonstrates a method for harvesting the electrical power by the piezoelectric actuator from vi-bration energy. This paper presents the energy harvesting technique using the piezoelectric element of a bi-morph type driven by a geared motor and a vibrator. The geared motor is a type of PWM controlled device that is a combination of an oval shape cam with five gears and a speed controller. When using the geared motor, the piezoelectric element is size of 36L×13W×0.6H. The output voltage characteristics of the piezo-electric element were investigated in terms of the displacement and vibration. When using the vibrator, the electric power harvesting is based on piezoelectric effect and piezoelectric vibrator consists of a magnetic type oscillator, a cantilever, a bimorph actuator and controllers. Low frequency operating technique using piezoelectric vibrator is very important because normal vibration sources in the environment such as building, human body, windmill and ship have low frequency characteristics. We can know from this study results that there are many energy sources such as vibration, wind power and wave power. Also, these can be used to the energy harvesting system using smart device like piezoelectric element. Keywords: Energy Harvester, Piezoelectric Element, Wind Energy, Vibration Energy, USN
1. Introduction
The Brilliant technological advancements have allowed low-power consuming elements and modules to be de-veloped, and the Ubiquitous Sensor Network (USN), to be commercialized in 2010, is attracting a high level of interest. The USN is an intelligent social infrastructure that can create information and knowledge from situation perceptions, by detecting, saving, processing and inte-grating the objects and environmental information ob-tained through tags and sensor nodes, which are main-tained in many locations.
However, when a battery or electrical wires are used to drive the sensor nodes in the USN, it can become quite costly, as well as damaging to the environment. Recogni-tion of this fact has led to the pursuit of studies on wire-less energy harvesters that can easily convert energy sources such as solar energy, vibration, heat, wind power or wave energy, which can be commonly found in the environment, into electricity [1–3].
An example of this type of research is the energy har-vesting devices invented by a group of MIT researchers. The researchers inserted devices under the sole of shoes, one of which used PZT and the other of which used
PVDF. They reported that when using PZT, the maxi- mum voltage of PZT was 150V at a load resistance of 250kΩ. In this case, the maximum electricity was re-corded as 80mW, and the average electricity was 1.8mW. For PVDF, the maximum voltage was 60V at a load re-sistance of 250kΩ. In this case, the maximum electricity was recorded to be 20mW, and the average electricity to be 1.1Mw [4,5].
At Nebraska University (U.S.), Prof. Stephen R. Platt et al. conducted, by inserting an energy harvester into a keen joint, a study on a PZT energy harvester to be used as the energy source for a sensor and microprocessor that can convey the information of the status of the energy harvester using the electricity converted from the force put on the knee joint [6]. Shashank Priya of Texas Uni-versity (U.S.) suggested a theoretical model to calculate electricity generated from a piezoelectric bimorph ele-ment in the low frequency band, and announced that it is possible to generate 7.5mW of electricity at a wind ve-locity of 10mph when a prototype windmill was used to verify the theoretical analysis [7].
These devices are some examples of power generation based on the PZT method, which converts unconsciously wasted energy such as human power, vibration, wind
D. G. KIM ET AL. 101 power, or wave power into electricity using a simple structure. Representative materials for piezoelectric ele-ments include Pb(ZrTi)O3, and PVDF. A great deal of research has been conducted to investigate methods for maximizing the effectiveness of piezoelectric power generation. This paper suggests a method of generating electrical energy with a piezoelectric ceramic using wind, an energy source that is easily applied and from which we can obtain “clean” energy [8].
A characteristic of the piezoelectric ceramic is that it is very difficult to generate energy using small vibrations. Worse still, the piezoelectric ceramic will break when it is the object of a large deformation. This paper presents the energy harvesting technique using the piezoelectric actuator of a bimorph type driven by a geared motor and a vibrator. The geared motor of this study is an equiva-lent model of the windmill which is rotated by natural wind. The geared motor is a type of PWM controlled device that is a combination of an oval shape cam with five gears and a speed controller. The piezoelectric ele-ment is a size of 36L×13W×0.6H. The output voltage characteristics of the piezoelectric element were investi-gated in terms of the displacement and vibration. The experiments were performed at the geared motor rpm of 40, 81, 126, 172rpm and the piezoelectric element dis-placement of 100μm, 200μm, 300μm, 400μm, 500μm. The power of 0.068mW was generated in the motor speed of 172 rpm and the piezoelectric element dis-placement of 500μm. The piezoelectric cantilever (the method by which a piezoelectric element can be attached to a long board with good elasticity) was applied in order to complement this weakness, improve the efficiency of energy harvesting, and effectively convey the mechanical energy to the piezoelectric element.
In addition, to efficiently deliver the mechanical en-ergy to the piezoelectric cantilever, resonance, which is generated only when the natural frequency of the piezo-electric cantilever is the same as the vibration source, should be generated. However, the natural frequency of the piezoelectric element is higher than the 10 to 300Hz generated by the electric products, such as buildings, automobiles, airplanes, refrigerators and washing ma-chines, on which an energy harvester can be attached. As such, the natural frequency of the piezoelectric element should be lowered, so that it can be attached to such places. There are several ways that have been suggested to lower the natural frequency of a piezoelectric cantile-ver, including lengthening the cantilever or making the end weight heavier.
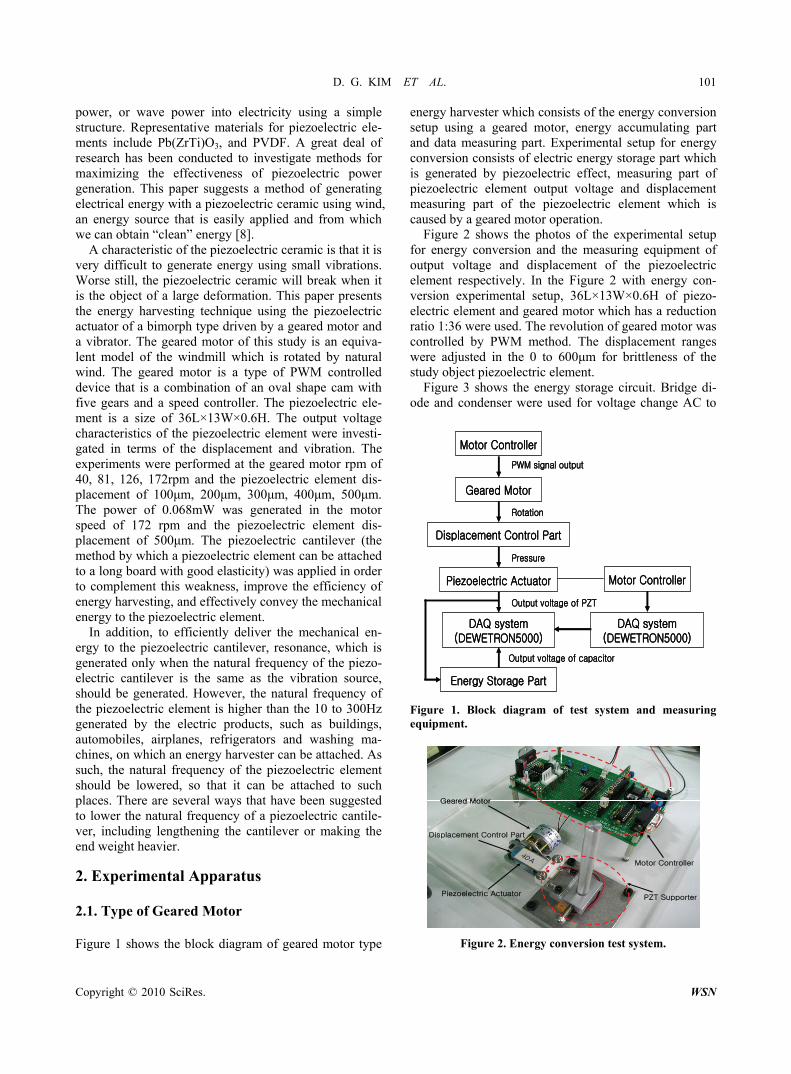
2. Experimental Apparatus 2.1. Type of Geared Motor Figure 1 shows the block diagram of geared motor type
energy harvester which consists of the energy conversion setup using a geared motor, energy accumulating part and data measuring part. Experimental setup for energy conversion consists of electric energy storage part which is generated by piezoelectric effect, measuring part of piezoelectric element output voltage and displacement measuring part of the piezoelectric element which is caused by a geared motor operation.
Figure 2 shows the photos of the experimental setup for energy conversion and the measuring equipment of output voltage and displacement of the piezoelectric element respectively. In the Figure 2 with energy con-version experimental setup, 36L×13W×0.6H of piezo-electric element and geared motor which has a reduction ratio 1:36 were used. The revolution of geared motor was controlled by PWM method. The displacement ranges were adjusted in the 0 to 600μm for brittleness of the study object piezoelectric element.
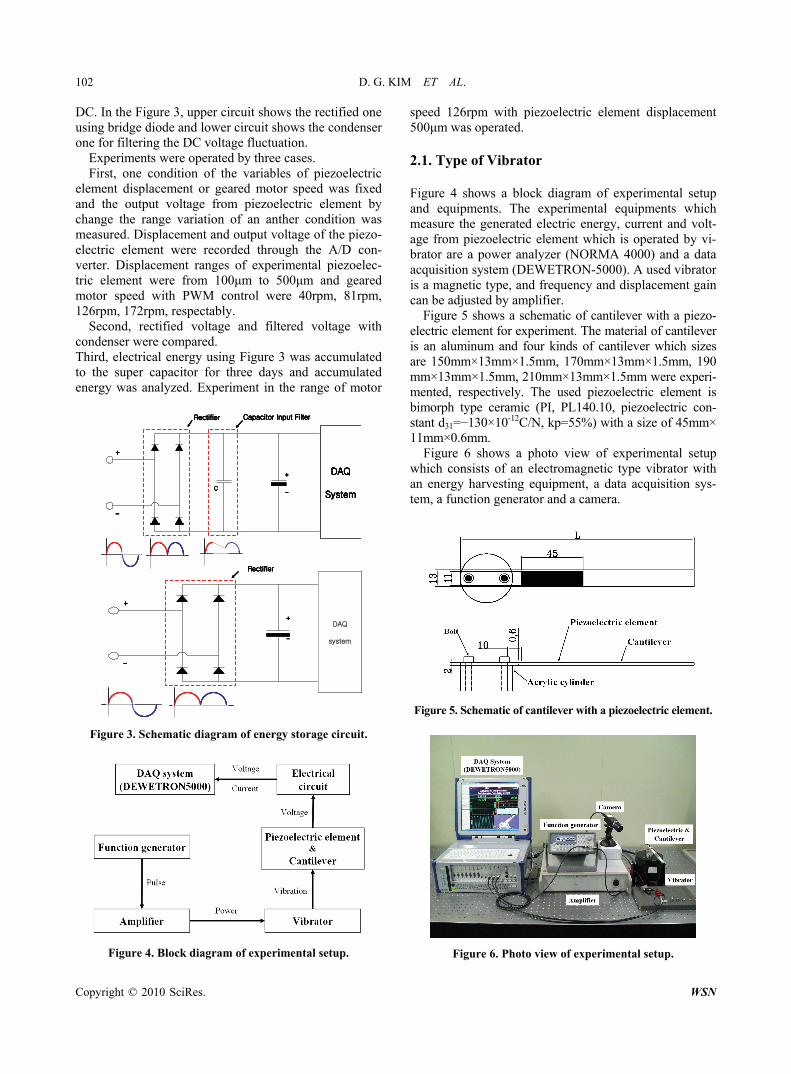
Figure 3 shows the energy storage circuit. Bridge di-ode and condenser were used for voltage change AC to
Motor Controller
Geared Motor
Displacement Control Part
Piezoelectric Actuator
DAQ system(DEWETRON5000)
Motor Controller
DAQ system(DEWETRON5000)
Energy Storage Part
PWM signal output
Rotation
Pressure
Output voltage of PZT
Output voltage of capacitor
Motor Controller
Geared Motor
Displacement Control Part
Piezoelectric Actuator
DAQ system(DEWETRON5000)
Motor Controller
DAQ system(DEWETRON5000)
Energy Storage Part
PWM signal output
Rotation
Pressure
Output voltage of PZT
Output voltage of capacitor
Figure 1. Block diagram of test system and measuring equipment.
Piezoelectric Actuator
Displacement Control Part
Geared Motor
Motor Controller
PZT SupporterPiezoelectric Actuator
Displacement Control Part
Geared Motor
Motor Controller
PZT Supporter
Figure 2. Energy conversion test system.
Copyright © 2010 SciRes. WSN
D. G. KIM ET AL.
Copyright © 2010 SciRes. WSN
102
DC. In the Figure 3, upper circuit shows the rectified one using bridge diode and lower circuit shows the condenser one for filtering the DC voltage fluctuation.
Experiments were operated by three cases. First, one condition of the variables of piezoelectric
element displacement or geared motor speed was fixed and the output voltage from piezoelectric element by change the range variation of an anther condition was measured. Displacement and output voltage of the piezo-electric element were recorded through the A/D con-verter. Displacement ranges of experimental piezoelec-tric element were from 100μm to 500μm and geared motor speed with PWM control were 40rpm, 81rpm, 126rpm, 172rpm, respectably.
Second, rectified voltage and filtered voltage with condenser were compared. Third, electrical energy using Figure 3 was accumulated to the super capacitor for three days and accumulated energy was analyzed. Experiment in the range of motor
+
-
Rectifier
DAQ
System
Capacitor Input Filter
+
-C
+
-
Rectifier
DAQ
System
Capacitor Input Filter
+
-C
+
-
Rectifier
+
-
DAQ
system
+
-
Rectifier
+
-
DAQ
system
+
-
Rectifier
DAQ
System
Capacitor Input Filter
+
-C
+
-
Rectifier
DAQ
System
Capacitor Input Filter
+
-C
+
-
Rectifier
+
-
DAQ
system
+
-
Rectifier
+
-
DAQ
system
Figure 3. Schematic diagram of energy storage circuit.
Figure 4. Block diagram of experimental setup.
speed 126rpm with piezoelectric element displacement 500μm was operated. 2.1. Type of Vibrator Figure 4 shows a block diagram of experimental setup and equipments. The experimental equipments which measure the generated electric energy, current and volt-age from piezoelectric element which is operated by vi-brator are a power analyzer (NORMA 4000) and a data acquisition system (DEWETRON-5000). A used vibrator is a magnetic type, and frequency and displacement gain can be adjusted by amplifier.
Figure 5 shows a schematic of cantilever with a piezo-electric element for experiment. The material of cantilever is an aluminum and four kinds of cantilever which sizes are 150mm×13mm×1.5mm, 170mm×13mm×1.5mm, 190 mm×13mm×1.5mm, 210mm×13mm×1.5mm were experi- mented, respectively. The used piezoelectric element is bimorph type ceramic (PI, PL140.10, piezoelectric con-stant d31=−130×10-12C/N, kp=55%) with a size of 45mm× 11mm×0.6mm.
Figure 6 shows a photo view of experimental setup which consists of an electromagnetic type vibrator with an energy harvesting equipment, a data acquisition sys-tem, a function generator and a camera.
Figure 5. Schematic of cantilever with a piezoelectric element.
Figure 6. Photo view of experimental setup.
D. G. KIM ET AL. 103
Figure 7 shows the electric circuit used to measure the output of electric current and the electric power gener-ated from the piezoelectric element.
In order to drive the vibrator, the output terminal of the amplifier for the vibrator was linked to the vibrator, and then the output terminal of the function generator was linked to the vibrator as well. The signal coming out of the function generator was set to ±1Vpp, and the out-put voltage of the amplifier was set to ±12V for the ex-periment. At this time, the frequency of the function generator ranged from 10~200Hz, which was within the frequency range of the vibrator. The natural frequency of the cantilever was changed to be 0.1Hz unit of the
Figure 7. Electric circuit for power measurement.
Figure 8. Output voltage by motor speed variation.
Figure 9. Output voltage by displacement variation.
function generator. As the natural frequency, we selected the frequency of the function generator when the voltage generated from piezoelectric element was at a peak.
In order to verify the manner in which the character-istics of the voltage were affected by changes in length and weight at the end of the cantilever, we chose a length from among 150, 170, 190,and 210mm in turn, and changed the weight from 0, to 2.22, 4.34, 5.87, 8.66, and to 11.01g, in that order. The electric power gener-ated from the piezoelectric cantilever was calculated by measuring electric current and voltage generated at each part when changing the resistance value. 3. Results and Discussion 3.1. Type of Geared Motor
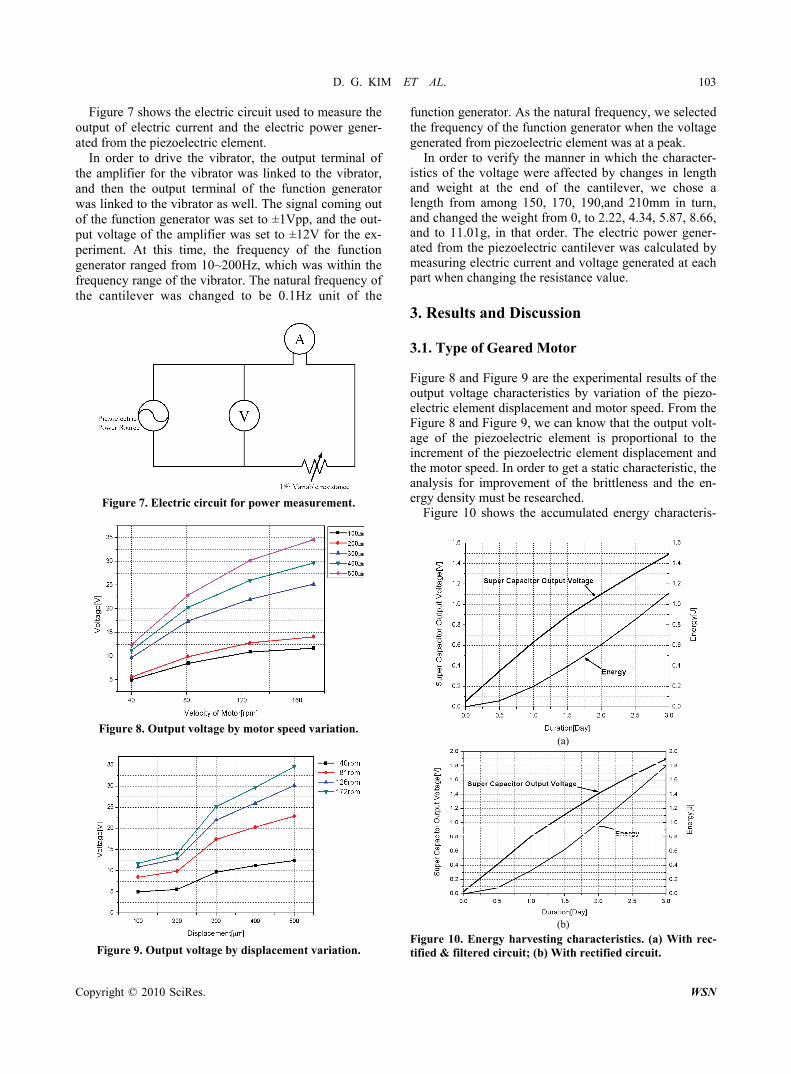
Figure 8 and Figure 9 are the experimental results of the output voltage characteristics by variation of the piezo-electric element displacement and motor speed. From the Figure 8 and Figure 9, we can know that the output volt-age of the piezoelectric element is proportional to the increment of the piezoelectric element displacement and the motor speed. In order to get a static characteristic, the analysis for improvement of the brittleness and the en-ergy density must be researched.
Figure 10 shows the accumulated energy characteris-
(a)
(b)
Figure 10. Energy harvesting characteristics. (a) With rec-tified & filtered circuit; (b) With rectified circuit.
Copyright © 2010 SciRes. WSN
D. G. KIM ET AL.
Copyright © 2010 SciRes. WSN
104
tics. Experiment was accomplished under the condition of the fixed motor speed, 126rpm and piezoelectric ele-ment displacement, 500μm. Electrical energy was accu-mulated for three days and the characteristics of rectified and filtered one were compared. Energy of the Figure 10 was calculated using Equation (1).
temperature data using a wireless system is calculated by Equation (2).
min 55 600 145 10 10U mW ms mW ms
mJ45.34 (2)
From the Equation (2), consumed energy for one time transmission of the temperature information is 34.45 (mJ).
2
2
1rre VcE (1)
Finally, we can know from this study results that there are many energy source such as vibration, wind power and wave power. Also, these can be used to the energy harvesting system using smart device like piezoelectric element.
where, Ee: Charged energy in the super capacitor, cr: Capacitor capacity, Vr: Output voltage.
The thin line of Figure 10 shows the energy derived from the Equation (1). Charged energy using filtered circuit is 1,116mJ and charged energy using rectified circuit is 1,801mJ. From the Figure 10, we can know that the capacitor is an important parameter and optimal cir-cuit of energy conversion system using windmill is needed.
3.2. Type of Vibrator Figure 12 indicates the natural frequency measured by changing the length and weight at the end of the cantile-ver. When there was no mass applied, the natural fre-quency stood at 132.6, 99.5, 58.9, and 50.0Hz for weights of 0, to 2.22, 4.34, 5.87, 8.66, and 11.01g, respectively, from which it can be observed that as the weight at the end increases, the natural frequency decreases.
Figure 11 shows the full charge characteristics of the super capacitor and experiment was accomplished under the same condition of Figure 11. The maximum charge voltage of used capacitor is 5V. It was confirmed from the Figure 11 that charging time for 5V is 16 days and charged energy is 12,720mJ. This means that charged
The natural frequency of the cantilever(fn) is known to exist in N inverse proportion to the weight applied at the end. The experimental results are consistent with this theory. It is confirmed that as the weight applied at the end increased, the natural frequency was lessened. In addition, as the length of the cantilever was longer, the natural frequency became lower.
energy per an hour is 33.125mJ. Table 1 shows the wireless sensor system consists of microprocessor, temperature sensor and wireless trans-mission module. And this table shows operating voltage, consumption current and consumption power for one time transmission of the temperature data.
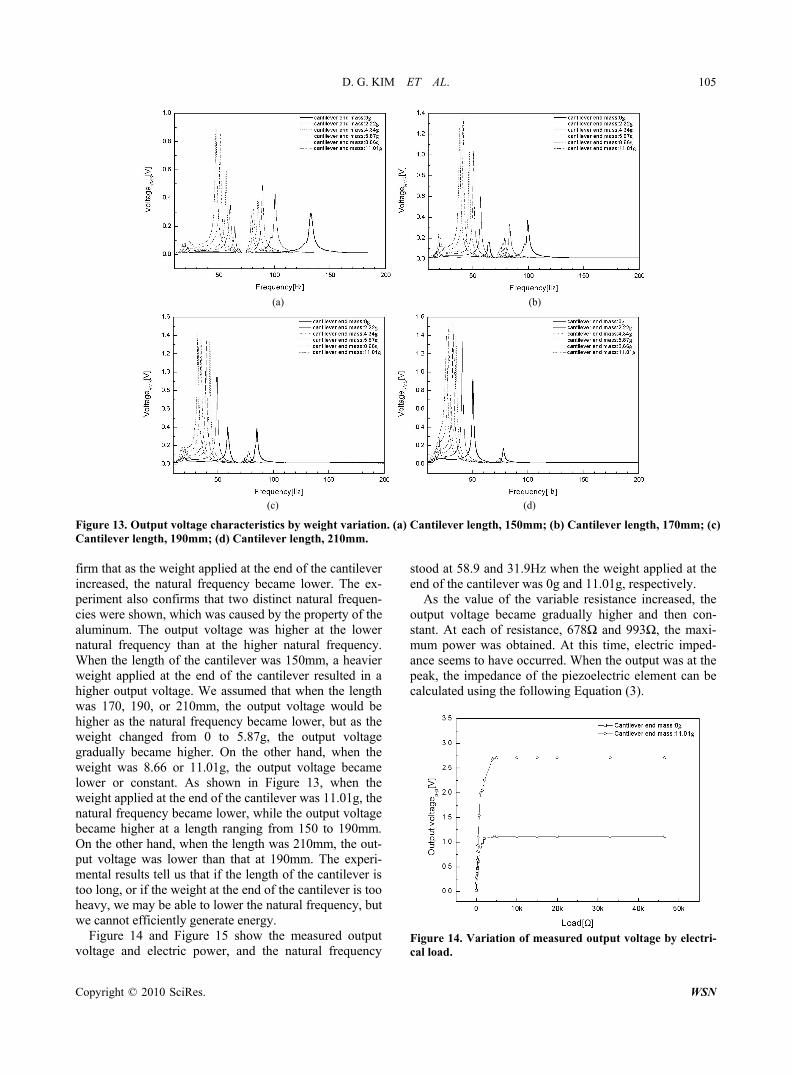
The minimum energy for one time transmission of the Figure 13 shows the results of measuring output volt-
age depending on the weight applied at the end of the cantilever. The weights applied were 0, 2.22, 4.34, 5.87, 8.66, and 11.01g, respectively. The output voltage was written using RMS values. It is confirmed that as the weight applied at the end of the cantilever increased, the natural frequency became lower.
The experimental results from Figure 13 (a) to (d) con-
Figure 11. Energy harvesting characteristics of piezo-elec-tric element. Table 1. Consumption power of energy conversion system.
Items
OperatingVoltage
[V]
Consumption current[]
Consumption power[]
Remarks
7 35 Op
25 125(10) Source/Sink
Sensor 5 1 5 Temp. sensor
3 15 Supply
4 20(10) Transmission
200Full load power consumption[]
eratingMCU(PIC16F) 5
Tx Module 5
Figure 12. Resonance frequency characteristics by change of cantilever length and mass.
D. G. KIM ET AL. 105
(a) (b)
(c) (d)
Figure 13. Output voltage characteristics by weight variation. (a) Cantilever length, 150mm; (b) Cantilever length, 170mm; (c) Cantilever length, 190mm; (d) Cantilever length, 210mm. firm that as the weight applied at the end of the cantilever increased, the natural frequency became lower. The ex-periment also confirms that two distinct natural frequen-cies were shown, which was caused by the property of the aluminum. The output voltage was higher at the lower natural frequency than at the higher natural frequency. When the length of the cantilever was 150mm, a heavier weight applied at the end of the cantilever resulted in a higher output voltage. We assumed that when the length was 170, 190, or 210mm, the output voltage would be higher as the natural frequency became lower, but as the weight changed from 0 to 5.87g, the output voltage gradually became higher. On the other hand, when the weight was 8.66 or 11.01g, the output voltage became lower or constant. As shown in Figure 13, when the weight applied at the end of the cantilever was 11.01g, the natural frequency became lower, while the output voltage became higher at a length ranging from 150 to 190mm. On the other hand, when the length was 210mm, the out-put voltage was lower than that at 190mm. The experi-mental results tell us that if the length of the cantilever is too long, or if the weight at the end of the cantilever is too heavy, we may be able to lower the natural frequency, but we cannot efficiently generate energy.
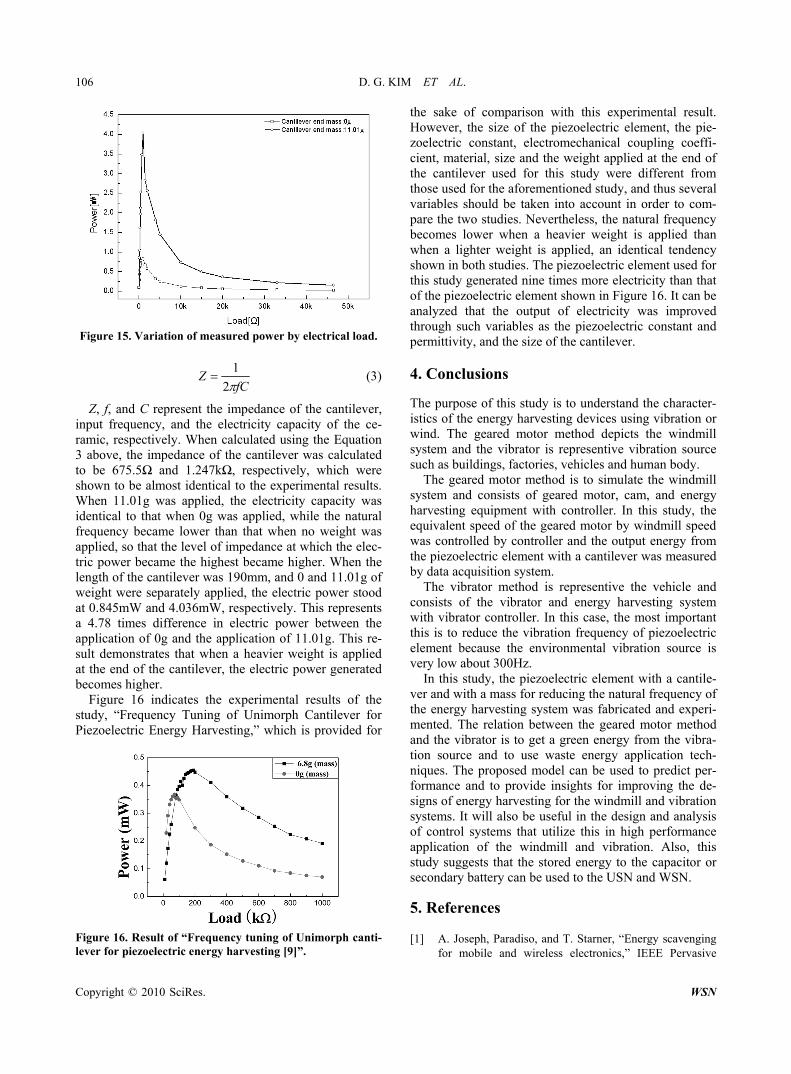
Figure 14 and Figure 15 show the measured output voltage and electric power, and the natural frequency
stood at 58.9 and 31.9Hz when the weight applied at the end of the cantilever was 0g and 11.01g, respectively.
As the value of the variable resistance increased, the output voltage became gradually higher and then con-stant. At each of resistance, 678Ω and 993Ω, the maxi-mum power was obtained. At this time, electric imped-ance seems to have occurred. When the output was at the peak, the impedance of the piezoelectric element can be calculated using the following Equation (3).
Figure 14. Variation of measured output voltage by electri-cal load.
Copyright © 2010 SciRes. WSN
D. G. KIM ET AL.
Copyright © 2010 SciRes. WSN
106
Figure 15. Variation of measured power by electrical load.
fCZ
2
1 (3)
Z, f, and C represent the impedance of the cantilever, input frequency, and the electricity capacity of the ce-ramic, respectively. When calculated using the Equation 3 above, the impedance of the cantilever was calculated to be 675.5Ω and 1.247kΩ, respectively, which were shown to be almost identical to the experimental results. When 11.01g was applied, the electricity capacity was identical to that when 0g was applied, while the natural frequency became lower than that when no weight was applied, so that the level of impedance at which the elec-tric power became the highest became higher. When the length of the cantilever was 190mm, and 0 and 11.01g of weight were separately applied, the electric power stood at 0.845mW and 4.036mW, respectively. This represents a 4.78 times difference in electric power between the application of 0g and the application of 11.01g. This re-sult demonstrates that when a heavier weight is applied at the end of the cantilever, the electric power generated becomes higher.
Figure 16 indicates the experimental results of the study, “Frequency Tuning of Unimorph Cantilever for Piezoelectric Energy Harvesting,” which is provided for
Figure 16. Result of “Frequency tuning of Unimorph canti-lever for piezoelectric energy harvesting [9]”.
the sake of comparison with this experimental result. However, the size of the piezoelectric element, the pie-zoelectric constant, electromechanical coupling coeffi-cient, material, size and the weight applied at the end of the cantilever used for this study were different from those used for the aforementioned study, and thus several variables should be taken into account in order to com-pare the two studies. Nevertheless, the natural frequency becomes lower when a heavier weight is applied than when a lighter weight is applied, an identical tendency shown in both studies. The piezoelectric element used for this study generated nine times more electricity than that of the piezoelectric element shown in Figure 16. It can be analyzed that the output of electricity was improved through such variables as the piezoelectric constant and permittivity, and the size of the cantilever. 4. Conclusions
The purpose of this study is to understand the character-istics of the energy harvesting devices using vibration or wind. The geared motor method depicts the windmill system and the vibrator is representive vibration source such as buildings, factories, vehicles and human body.
The geared motor method is to simulate the windmill system and consists of geared motor, cam, and energy harvesting equipment with controller. In this study, the equivalent speed of the geared motor by windmill speed was controlled by controller and the output energy from the piezoelectric element with a cantilever was measured by data acquisition system.
The vibrator method is representive the vehicle and consists of the vibrator and energy harvesting system with vibrator controller. In this case, the most important this is to reduce the vibration frequency of piezoelectric element because the environmental vibration source is very low about 300Hz.
In this study, the piezoelectric element with a cantile-ver and with a mass for reducing the natural frequency of the energy harvesting system was fabricated and experi-mented. The relation between the geared motor method and the vibrator is to get a green energy from the vibra-tion source and to use waste energy application tech-niques. The proposed model can be used to predict per-formance and to provide insights for improving the de-signs of energy harvesting for the windmill and vibration systems. It will also be useful in the design and analysis of control systems that utilize this in high performance application of the windmill and vibration. Also, this study suggests that the stored energy to the capacitor or secondary battery can be used to the USN and WSN. 5
. References
[1] A. Joseph, Paradiso, and T. Starner, “Energy scavenging for mobile and wireless electronics,” IEEE Pervasive
D. G. KIM ET AL.
Copyright © 2010 SciRes. WSN
107
Computing, Vol. 4, Issue 1, pp.18–27, 2005.
[2] R. Stephen, Platt, S. Farritor, and H. Haider, “On low- frequency electric power generation with PZT ceramics,” IEEE/ASME Transactions on Mechatronics, Vol. 10, No. 2, pp. 240–252, 2005.
[3] T. Starner, “Thick clients for personal wireless devices,” IEEE Computer, Vol. 35, No. 1, pp.133–135, 2002.
[4] S. R. Anton and H. A. Sodano, “A review of power har-vesting using piezoelectric materials (2003–2006),” Smart material and Structures, Vol. 16, No. 3, pp. 1–21, 2007.
[5] J. Kymissis, C. Kendall, J. Paradiso, and N. Gershenfeld, “Parasitic power harvesting in shoes,” Proceeding of the Second IEEE International Conference on Wearable Computing (ISWC), pp. 132–139, 1998.
[6] R. P. Stephen, S. Farritor, K. Garvin, and H. Haider, “The
use of piezoelectric ceramics for electric power genera-tion within orthopedic implants,” IEEE/ASME Transac-tions on Mechatronics, Vol. 10, No. 4, pp. 455–461, 2005.
[7] S. Priya, “Modeling of electric energy harvesting using piezoelectric windmill,” Applied Physics Letters, Vol. 87, No. 18, 184101–1–3, 2005.
[8] H. A. Sodano, G, Park and D. J. Inman, “Estimation of electric charge output for piezoelectric energy harvest-ing,” Blackwell Publishing Ltd, Vol. 40, No. 2, pp. 49–58, 2004.
[9] H. C. Kim, H. C. Song, D.-Y. Jeong, H.-J. Kim, S.-J. Yoon, and B. K. Ju, “Frequency tuning of unimorph can-tilever for piezoelectric energy harvesting,” Korean Journal of Materials Research, Vol. 17, No. 12, 660–663, 2007.

![AFM cantilever with integrated piezoelectric thin film for micro …iap.iisc.ac.in/~kraj/images/files/Sudeep Joshi/AFM cantilever with... · area imaging [2]. ZnO is a widely used](https://img.dokumen.tips/doc/110x75/5f19f26af208125e2354d662/afm-cantilever-with-integrated-piezoelectric-thin-film-for-micro-iapiiscacinkrajimagesfilessudeep.jpg)