Embed Size (px)
Citation preview
UNITED NATIONS INDUSTRIAL DEVELOPMENT ORGANIZATION
w o r k i n g p a p e r 0 4 /20 1 1
Energy efficient production in the automotive and clothing/textiles industries in South Africa

UNITED NATIONS INDUSTRIAL DEVELOPMENT ORGANIZATIONVienna, 2011
DEVELOPMENT POLICY, STATISTICS AND RESEARCH BRANCHWORKING PAPER 04/2011
Energy efficient production in the automotive and clothing/textiles
industries in South Africa
Mike MorrisPRISM, University of Cape Town
Justin BarnesBenchmarking and Manufacturing Analysts
Jake MorrisBenchmarking and Manufacturing Analysts
RBB Economics, The Hague

Acknowledgements This working paper was prepared as background material for the UNIDO Industrial Development Report 2011 by Mike Morris, PRISM, University of Cape Town, Justin Barnes, Benchmarking and Manufacturing Analysts and Jake Morris, Benchmarking and Manufacturing Analysts, RBB Economics, The Hague; under the supervision of Ludovico Alcorta, Director, Development Policy, Statistics and Research Branch, UNIDO.
The designations employed, descriptions and classifications of countries, and the presentation of the material in this report do not imply the expression of any opinion whatsoever on the part of the Secretariat of the United Nations Industrial Development Organization (UNIDO) concerning the legal status of any country, territory, city or area or of its authorities, or concerning the delimitation of its frontiers or boundaries, or its economic system or degree of development. The views expressed in this paper do not necessarily reflect the views of the Secretariat of the UNIDO. The responsibility for opinions expressed rests solely with the authors, and publication does not constitute an endorsement by UNIDO. Although great care has been taken to maintain the accuracy of information herein, neither UNIDO nor its member States assume any responsibility for consequences which may arise from the use of the material. Terms such as “developed”, “industrialized” and “developing” are intended for statistical convenience and do not necessarily express a judgment. Any indication of, or reference to, a country, institution or other legal entity does not constitute an endorsement. Information contained herein may be freely quoted or reprinted but acknowledgement is requested. This report has been produced without formal United Nations editing.
This document reflects work in progress and, as such, has been edited neither in language nor in style. Its distribution is limited for the purposes of eliciting comments and reviews only.

iii
Table of contents
Introduction................................................................................................................................... 1
1 Energy efficiency opportunities and the will to implement.................................................. 2
Opportunities in the Auto and textile industries................................................................... 4
Market forces, lean production, barriers to improving energy efficiency............................ 6
Global energy efficiency policy............................................................................................ 9
2 South Africa’s energy efficiency policy............................................................................. 13
3 Contextualizing the energy efficiency challenge to industry ............................................. 17
4 Energy efficiency as a strategic imperative........................................................................ 24
5 Case studies of four firms................................................................................................... 31
Case Study 1 Energy efficiency performance of a multinational
automotive component manufacturer in South Africa.............................. 31
Case Study 2 Electricity blackouts threats induces energy efficiency savings............... 33
Case Study 3 Optimisation of production planning on key energy
using equipment to improve energy efficiency......................................... 36
Case Study 4 Improving energy efficiency through upgrade of capital
equipment in the textiles sector................................................................ 39
Conclusion................................................................................................................................... 40
Appendix A note on research methodology......................................................................... 43
References................................................................................................................................... 45

iv
List of figures
Figure 1 Indexed increase in utility costs for textiles firms in the Durban
Metro Area: 2000-2005. .......................................................................................... 18
Figure 2 Automotive industry’s electricity usage (2007 -2008) ........................................... 22
Figure 3 Automotive industry’s water usage (2007-2008) ................................................... 23
Figure 4 Drivers of clothing and textile firms ‘green production’ ........................................ 25
Figure 5 Drivers of automotive firms ‘green production’..................................................... 26
Figure 6 Federal Mogul Friction Products Electricity Output (KwH)................................... 32
Figure 7 Allwear’s average KvA consumption per month from 2007 to 2009..................... 35
Figure 8 Allwear’s average electricity expenditure March 2007 to Feb 2009...................... 36
Figure 9 Struandale’s average electricity output per square meter glass .............................. 37
Figure 10 Struandale’s average maximum electricity demand per square meter glass........... 37
List of tables Table 1 Key elements of the Industrial Standards Framework............................................10
Table 2 Electricity, rates, water and effluent costs as a percentage of real sales
2000-2005............................................................................................................... 18
Table 3 Financial sustainability of firms in the automotive, clothing and
textile industry ........................................................................................................ 20
Table 4 Scrap rate usage in automotive and clothing/textile firms...................................... 24
Table 5 Firm strategic imperatives re green production ...................................................... 24
Table 6 Major energy efficiency interventions of all firms (automotive,
clothing, textile)...................................................................................................... 28
Table 7 Internal and external, enabling and hindering factors for clothing/textile firms .... 29
Table 8 Internal and external, enabling and hindering factors for automotive firms........... 30
1
Introduction
Energy efficiency is the most effective means with which to address concerns over climate
change, rising energy prices, and security of supply while at the same time supporting economic
growth (Price and McKane, 2009). The industrial sector presents the biggest opportunity for
savings as it is the primary contributor to global final energy consumption and energy-related
carbon dioxide (CO2) emissions, at 33 percent and 38 percent respectively in 2005 (IEA, 2008).
The case for industrial energy efficiency is even stronger for developing countries. Firstly, the
industrialization process causes these shares in energy consumption and energy-related CO2
emissions to be considerably higher than in industrialized countries. Indeed, in 2005, industry in
non-OECD countries accounted for 38 percent of energy consumption compared to 27 percent
in OECD countries, and exceeded 50 percent in some cases (IEA, 2008). Secondly, and with
exceptions, developing countries tend to be more carbon intensive than their industrialized
counterparts due to a higher share of pollutive sources, such as coal, making up their final
energy mix (IEA 2008). To illustrate, carbon intensity decreased in OECD countries over the
period 1990 to 2005, helping to limit growth in CO2 emissions to 15 percent. In non-OECD
countries, however, carbon intensity continued to increase, contributing to growth in CO2
emissions of 39 percent over the same period (IEA 2008). Furthermore, this trend is expected to
continue, with most growth in industrial sector energy use and CO2 emissions forecast to come
from developing and transition economies (McKane et al, 2007).
Developing countries face a difficult dilemma. Most have been eagerly awaiting their turn to set
off on the path of industrialization and enjoy the much needed fruits of economic growth. But
they are also under pressure to choose their manner and speed of industrialization carefully in
order to minimize the impact on the environment. This creates an obvious development
challenge for government and industry, who are understandably concerned that expensive clean
development could undermine international competitiveness, and they are especially reluctant to
foot the bill when industrialized countries are largely to blame for our current climate concerns.
But even though the goals of economic growth and environmental sustainability are often at
odds, developing countries do have a particular opportunity to upgrade international
competitiveness by adopting energy efficient best practices from the outset in new industrial
facilities (McKane et al, 2007). Energy is usually costly and the gains to be made by conserving
it are well documented. Based on proven technologies, improvements to industrial energy
efficiency are estimated at 18-26 percent, reducing industry’s CO2 emissions by 19-32 percent
(IEA, 2007). Apart from the direct economic gains, forward-thinking governments and firms
would also ensure compliance with future environmental regulation.

2
The bulk of energy consumption is accounted for by energy-intensive industry - minerals
extraction and processing industries, and within manufacturing the production of commodities
such as iron and steel, paper, and cement. Correspondingly, the vast majority of the literature on
industrial energy efficiency relates to energy-intensive industry. Consuming less energy, the
automobile and clothing & textile sectors fall into the category of light manufacturing industry.
However, economic development patterns indicate a shift from energy-intensive industries
towards lighter, higher value-added industries, which are predicted to account for over half of
all manufacturing energy use by 2050 (Price and Worrell, 2004).
In this paper we perform case studies on a selection of firms in the automobile and clothing and
textiles sectors in South Africa. Our aim is to understand what drives and enables successful
energy efficiency strategies in these sectors and extend the lessons to other developing
countries. At the same time we also seek to identify factors that hinder progress in this area. We
focus on internal commercial influences within firms and their supply chains in order to unpack
the role of value chain drivers and governance structures in pursuing energy efficient production
processes. In addition we also examine the impact of South Africa’s energy policies in order to
better define the role of developing country governments in initiating and supporting industrial
energy efficiency improvements and creating a business environment conducive to the private
pursuit of energy efficiency.
We begin in Section 1 by outlining the types of energy efficiency opportunities available to the
manufacturing industry, describing the direction that global energy efficiency policy has taken,
and paying specific attention to the automotive and clothing and textiles sectors. Section 2
positions South Africa’s energy efficiency policy in global context. In Section 3 we begin the
analysis of the energy efficiency challenges driving South African industry. Section 4 presents
the case study interviews, methodology, and findings. Section 5 presents four selected case
studies of pertinent firm experiences. We conclude by discussing the policy shortcomings
apparent in respect of the automotive and clothing and textile industries.
1 Energy efficiency opportunities and the will to implement
Energy efficiency can be considered the main energy saving opportunity for the manufacturing
industry (Moomaw et al, 2001). In theory, three factors should drive industry towards achieving
it. The first is cutting energy costs. If energy constitutes a substantial input to industrial
processes then this should be a straightforward incentive to improve energy efficiency. The
second is regulation. Firms all over the world can expect growing pressure from their
3
governments to cut carbon emissions. Such regulation could take the form of mandatory energy
efficiency standards and targets, and/or market-based incentive schemes such as the European
cap-and-trade system or a simple tax on carbon emissions, both of which penalize high energy
consumption and reward emissions reductions. The third factor is that of shifting consumer
preferences. Consumers are gradually beginning to favor firms who credibly demonstrate
minimal environmental impact. This presents forward-thinking firms with an opportunity to
develop and market low carbon products and gain market share from or collect a premium over
more environmentally harmful alternatives.
The UK’s Carbon Trust (2006) puts forward two broad categories of energy saving
opportunities available to industry. The first is the direct reduction of energy consumption by
optimizing internal production processes. The second involves indirectly reducing energy
consumption by changing or reconfiguring the firm’s products to consume less energy during
use and disposal. The former is more within the scope of this paper than the latter. This is due to
the fact that the products manufactured by South African automotive and clothing and textile
manufacturers are designed and developed in high-income developed countries. The opportunity
for local firms to shape the nature of the products they manufacture is very limited, particularly
in the automotive industry, which has clear homologation rules relating to the manufacture of
globally branded products.
To generate energy savings in production, firms should invest in new energy efficient plant
equipment or in technologies that optimize the energy use of existing equipment. Moomaw et al
(2001) assert that the technologies that offer the most scope for energy savings throughout the
broad manufacturing sector are process control and energy management systems, process
integration, and cogeneration of heat and power, while further savings are achievable through
the adoption of high-efficiency electric motors and electronic adjustable speed drives. They
estimate that the widespread adoption of these general utility measures would result in a 5
percent saving in global primary energy demand, with potential for further savings coming from
industry- or process-specific measures. A case study on South Africa performed by Winkler et
al (2007) explores the potential impact of energy efficiency measures on total national energy
demand and emissions. Based on available technologies relating to, in order of impact,
compressed air management; variable speed drives; efficient motors; efficient lighting; load
shifting; heating, ventilation, and cooling; and other thermal measures, they estimate annual
energy savings of 3 percent and a 5 percent reduction in total projected national emissions by
2020.

4
McKane et al (2007) stress the importance of system optimization in addition to the replacement
or optimization of individual system components. While individual components such as motors
and drives, compressors, pumps, and boilers offer an improvement potential of 2-5 percent,
motor systems and steam and process heating systems offer an improvement potential upwards
of 20 percent and 10 percent respectively.
If the national grid delivers energy generated from carbon-intensive sources, then firms with
substantial electricity requirements could do more for the environment by generating their own
power on-site, employing cleaner technologies such as those based on renewable sources or
natural gas. This is often the case in developing countries, whose economies tend to rely on
ageing coal-fired plants for their energy supply (IEA, 2008). In addition to the reduction in
carbon emissions, generating power in close proximity to the end-user reduces system electrical
losses and increases the potential for combined heat and power technology (Moomaw et al,
2001).
More generally, firms should gauge their supply chains for energy efficiency opportunities and
roll out lean production strategies aimed at eliminating over-production and energy-intensive
storage and waste (Carbon Trust, 2006). Firms should run internal campaigns to build
awareness of the benefits of energy efficiency and develop the organizational structure and
capacity to incorporate these benefits into their decision-making.
Opportunities in the auto and textile industries
As Galitsky and Worrell (2003) point out, the primary forms of energy utilized in the
automobile parts and assembly sector are electricity, steam, gas, and compressed air. Energy
costs in assembly plants represent on average only 1-2 percent of total operating costs
(Canadian Auto Parts Association 2005; Galitsky and Worrell, 2003; BMA database). The
figure for automotive component manufacturers is very similar, with the average for South
African automotive component manufacturers also calculated at between 1-2 percent of total
operating costs (B&M Analysts’ automotive component manufacturer database). However, this
average masks a highly variable rate of energy usage between component manufacturing sub-
sectors. Automotive foundries and forges average well over 4 percent, whilst other (more labour
intensive) sub-sectors, such as harness and electronics assembly, operate at levels well below
the assembly plant average of 1-2 percent. Electricity consumes approximately two thirds of the
energy budget for vehicle assembly plants, utilized primarily for compressed air, metal forming,

5
lighting, ventilation, air conditioning, painting, material handling, and welding. Motors that
drive plant equipment consume around 70 percent of total electricity demand, highlighting the
importance of energy efficient motor systems. Fuel usage primarily centers on general heating
as well as ensuring correct temperature and humidity in the painting line (Galitsky and Worrell,
2003).
Galitsky and Worrell (2003) conduct an analysis on the energy saving opportunities available to
automobile assembly facilities, using a number of US assembly plants as case studies. They
identify over 90 energy saving practices and technologies, splitting them into cross cutting
utility measures and process-specific measures. Cross cutting utility measures offer immediate
energy savings without impacting on the assembly process. They involve energy efficiency
improvements to motors, compressed air, lighting, hot water and steam distribution, hot water
and steam generation, power supply, and heating, ventilation, and air conditioning. While the
savings brought about by each individual measure are small, the cumulative savings are
substantial. Importantly, the majority of measures are financially profitable, offering relatively
quick payback periods or even coming at a net negative cost depending on the size, age, and
specific activity of the plant. The process-specific energy efficiency measures identified relate
to painting, welding, and stamping. In addition to energy savings, many of the identified
technologies yield improvements to product quality.
The production of textiles and leather constitute only 2 percent of total global industrial energy
use (IEA, 2009). The way in which energy is used in the textiles industry is not well understood
and the general literature on energy savings in this sector is somewhat sparse, despite this sector
being of special importance in developing countries (Price and McKane, 2009). For this reason
Price and McKane (2009) recommend that for these sectors, specific indicators be developed
and, on this basis, appropriate data collected. Of course, this does not mean that energy
efficiency opportunities do not exist in the sector.
A case study undertaken by the US Department of Energy (2001) exemplifies the benefit of
system optimization in the textile industry. The study identified annual energy cost savings
through the optimization of the compressed air system and the modernization of the mill’s
production equipment. Production was increased by 2 percent per annum whilst annual
compressed air energy costs fell by 4 percent and maintenance costs by 35 percent.
Simultaneously, the improved compressed air system resulted in a 90 percent reduction in

6
compressor downtime and better product quality. Most importantly the project’s payback period
was only 2.9 years.
There clearly exist a number of presently available technologies that can be utilized in industrial
facilities within the automotive and clothing and textile sectors. While the applicability of
technologies differ per industry and plant activity, the majority of energy efficiency measures
are shown to be cost effective or even at net negative cost, with payback periods typically less
than three years.
Market forces, lean production, barriers to improving energy efficiency
Despite the various energy efficiency measures available to industry, do market forces alone
have the potential to induce industrial energy efficiency? Market forces do have the potential to
play a somewhat more prominent role if certain obstacles (such as information and the price of
electricity) are overcome. However, market forces alone will not induce privately motivated
firms to implement these measures on their own. Hence, policy intervention will still be
required to drive the widespread uptake of energy efficiency measures.
The argument behind market forces inducing energy efficiency is essentially based on the
application of lean production to energy use. Lean production describes production practice that
delivers a given output using minimum resources - in other words the minimization of waste
throughout the value chain. Environmentally efficient production, or clean production, describes
production practice that delivers a given output while exerting a minimum negative externality
on the environment. These concepts are to a large extent aligned insofar as both deliver more
value at the lowest possible economic and environmental cost respectively. If energy is costly
and constitutes an essential and significant input to industrial processes, it makes business sense
for firms to invest in minimizing energy use. And since energy generation is the primary source
of greenhouse gas (GHG) emissions, such investment is good news for the environment.
It is thus tempting to believe that due to the overlapping of lean and clean production practices
rational, profit-maximizing firms will become energy efficient on their own. In practice it is not
so simple.
Firstly, the profitability of saving energy and thus the amount of attention afforded to improving
energy efficiency will depend on the quantity of energy used per unit of output in the production
process. An alternative (indirect) measure of this is the cost of energy input as a proportion of

7
total production cost. Energy costs in vehicle assembly plants and automotive component
manufacturers represent on average only 1-2 percent of total operating costs (Galitsky and
Worrell 2003; Canadian Auto Parts Association 2005) and similarly 1.81 percent for textile
firms in South Africa (BMA database). Although this is the average, there is a wide variance
between different types of operations and firms within these sectors. For example, for a spinning
operation energy costs can constitute up to 5 percent of total operating costs.
Secondly, the degree of pressure on firms to cut direct energy costs will depend on the price of
electricity. If this price is very low, then firms may simply feel that optimizing energy use is not
worth the cost and effort required to do so. This was indeed the case in South Africa, whose
electricity price of 22.1c/kWh ($0.03/kWh or €0.02/kWh) in 2008 was one of the lowest in the
world. This is likely to be the case in many developing countries where utility firms are often
still state-run and so low electricity prices may be applied as a tool to encourage local industrial
development and attract foreign investment. Raising electricity prices is politically sensitive in
developing countries as it conflicts with the goal of extending access to electricity to the poor,
but clever policy design could insulate certain social groups from the prescribed price hikes.
The elimination of conventional energy subsidies would allow market forces to come into play,
amplifying the benefits of incorporating energy management into lean production strategies
(Price and McKane, 2009).
Thirdly, benchmarking industrial energy use, selecting the appropriate energy saving
technology, and undertaking energy efficient measures require technical expertise that is not
readily available at many firms, even less so in developing countries (Price and McKane, 2009).
Firms lacking expertise will thus have difficulty quantifying the costs and benefits of energy
efficiency measures, which discourages them from committing capital to this cause. Thus,
despite the fact that research and experience indicate financially profitable energy saving
technologies with relatively short payback periods, a lack of awareness and organizational
capacity may render industry reluctant to undertake costly energy efficiency measures.
Fortunately, the cost-benefit issue appears founded more in perception, or at least in a lack of
knowledge and experience, than reality. As awareness and technical know-how spread through
industry, one would expect firms to increasingly incorporate energy efficiency into lean
production strategies.
More difficult is on-site power generation from clean sources. Currently, renewable
technologies are too costly relative to conventional energy sources and privately motivated

8
firms will not have an economic incentive to invest in their own generation capacity if grid
sourcing remains significantly cheaper. On the other hand, on-site generation derived from
natural gas may be more cost effective and there is a strong economic case for the efficiencies
yielded by cogeneration technologies. However, due to the non-storability of electricity, on-site
generation also carries the added risk of mismatching energy supply and demand in production,
especially if the technology is driven by intermittent factors, such as weather, or cannot be
switched on and off at short notice. Feed-in tariffs are one possibility to overcome these
barriers. Finally, industry’s inherent slow capital stock turnover will invariably delay the
replacement of energy inefficient machinery with efficient plant equipment (Bernstein et al,
2007). This may also delay individual or system optimization measures if the facility chooses to
wait until the arrival of new plant equipment.
In summary, there are a number of barriers to the adoption of energy-efficient technologies.
Critically these include willingness to invest, information and transaction costs, profitability
barriers, lack of skilled personnel, and slow capital stock turnover (Worrel et al. 1996).
Fundamentally the gap between opportunity and implementation lies in the fact that “the
principal business of an industrial facility is production, not energy efficiency. This is the
underlying reason why market forces alone will not achieve industrial energy efficiency on a
global basis, “price signals” notwithstanding. High energy prices or constrained energy supply
will motivate industrial facilities to try to secure the amount of energy required for operations at
the lowest possible price. But price alone will not build awareness within the corporate culture
of the industrial firm of the potential for energy savings, maintenance savings, and production
benefits that can be realized from the systematic pursuit of industrial energy efficiency. It is this
lack of awareness and the corresponding failure to manage energy use with the same attention
that is routinely afforded production quality, waste reduction, and labor costs that is at the root
of the opportunity.” (McKane et al. 2007: 2).
Theoretically therefore, driven by lean production, market forces do have the potential to
pressure firms into the efficient use of energy. However, a market failure is likely to occur in
sectors in which energy is a relatively small cost factor and in the context of a lack of awareness
of the benefits of energy efficiency and a lack of expertise in implementing energy efficiency
measures. Moreover, any market forces that are present will be weakened by a very low
electricity price.

9
Policy intervention providing some form of incentives and penalties is thus required to induce
the widespread uptake of energy efficiency measures in the automotive and clothing and textile
industries. Awareness and training programs are also required to expose the means and benefits
of energy efficiency. At the same time electricity prices need to be raised to a sufficiently high
level. These actions will enable market forces to gain traction and increase the benefits of
energy-focused lean production.
Global energy efficiency policy
In order to overcome these barriers it seems to be necessary to adopt effective industrial policies
and programs to provide enabling environments for industry to easily implement energy
efficiency technologies, practices, and measures (Price and McKane, 2009). In their proposed
Industrial Standards Framework, McKane et al (2007) detail a comprehensive government-led
approach to improving industrial energy efficiency. The key elements of their approach are
outlined in Table 1. Their major policy recommendation is the establishment of industrial sector
energy efficiency targets together with recognition of exceptional energy efficiency
performance. This includes the provision of economic incentives as well as technical and
financial support for participating industries. They emphasize government’s role in increasing
awareness and building organizational capacity through the establishment of energy
management standards, the initial provision of system optimization training, and the creation of
a system optimization library as a platform for the retention and dissemination of best practices.
Target setting agreements (or ‘voluntary agreements’) have been implemented in industrialized
countries since the early 1990’s. They are voluntary or legally-binding agreements concluded
between government and industry with the aim of achieving specified energy efficiency
improvements and emissions reductions over a specified time period, typically five to ten years
(Bernstein et al, 2007). McKane et al (2007) outline the key elements of a target setting program
as follows:
• Target setting process
• Identifying energy saving technologies and measures
• Benchmarking current energy efficiency practices
• Establishing an energy management plan
• Conducting energy efficiency audits
• Developing an energy savings action plan
• Developing incentives and supporting policies

10
• Measuring and monitoring progress towards targets
• Program evaluation
Table 1 Key elements of the Industrial Standards Framework
Source: McKane et al 2007

11
Price (2005) reviews 23 national energy efficiency target setting agreements in 18 countries
around the globe. They are found to be more effective when applied within the context of a
coordinated set of policies that provide economic incentives together with technical and
financial support to the participating industries. Participation and probability of success are also
found to be significantly higher within or under the credible threat of increased regulation or
energy/GHG emissions tax programs if the reduction goals are not met. Consequently, some
countries have adapted their programs to incorporate stronger incentives and penalties.
The Climate Change Agreements (CCA’s) in the UK are an example of a national target setting
program between government and industry. It forms an integral part of the Climate Change
Program (CCP), initiated by the government in 2000 in order to achieve its Kyoto Protocol
target of a 12.5 percent reduction in CO2 emissions below 1990 levels by 2008-2012 and its
more ambitious domestic goal of a 20 percent reduction in CO2 emissions below 1990 levels by
2010. The CCA’s are emissions targets negotiated between the government and 44 sector
associations. They have since extended to 52 sectors, spanning over 9000 industrial facilities. In
return for achieving their targets, participating facilities receive an 80 percent rebate on the
Climate Change Levy (CCL), a tax on the use of energy applied to industry and the public
sector as part of the Climate Change Program (DECC, 2000). The CCA’s also include an
emissions trading scheme, where firms can purchase additional allowances or sell excess
allowances. The results of each biannual target assessment period compiled by AEA Energy &
Environment (2009) are excellent, showing that total CO2 emissions reductions were almost
three times the target for the first assessment period, more than twice the target for the second
assessment period and almost twice the target for the third and fourth assessment periods.
Energy management standards are important for facilitating the achievement of energy
efficiency targets as they provide guidance to industrial facilities on how to incorporate energy
efficiency into their management activities. Typical features include establishing accountability
of energy management in a firm’s organizational structure and the measurement, management,
and documentation of all aspects of energy use and disposal (Price and McKane, 2009). The
International Organization for Standardization (ISO) is currently preparing an energy
management standard (ISO 50001), scheduled for release in early 2011. Targeting broad
applicability across sectors and countries, it will be compatible with ISO’s existing quality (ISO
9001) and environmental (ISO 14001) management standards and serve as a framework for
industrial plants, commercial facilities, or entire organizations to manage energy (ISO, 2008).

12
Applying energy management standards to achieve emissions targets requires specific expertise
relating to management systems and energy efficiency (Price and McKane, 2009). Capacity
building programs are thus required in order to filter technical capacity from international
experts to local experts and industry on a large scale. Government has a prominent role to play
in initiating such capacity building programs.
The Carbon Trust was established by the UK government in 2001 to provide specialist support
to business and the public sector in cutting emissions, saving energy, and commercializing low
carbon technologies (Carbon Trust, 2009). The Carbon Trust also provides financial support to
businesses wishing to reduce their carbon footprint.
In the US, since 1976, the Department of Energy’s Industrial Technologies Program and
Industrial Assessment Centers have conducted and made publicly available over 14,000 energy
efficiency assessments, making over 100,000 recommendations (Rutgers University, 2009). The
US Environmental Protection Agency’s Energy Star for Industry program facilitates the sharing
of best practices and promotes networking between industry partners (US EPA, 2008).
Specific expertise is required for the relatively specialized task of system optimization. To
overcome the skills shortage, UNIDO, the US Department of Energy, the Energy Foundation,
and the Chinese government coordinated the China Motor System Energy Conservation
Program, a pilot training program aimed at building the required technical capacity to
implement system optimization evaluations and solutions. Within two years after completing the
program the trained experts conducted 38 industrial plant assessments and identified average
savings per system of 23 percent (LBL, 2009).
The most successful efforts in improving energy efficiency have consisted of the simultaneous
application of a combination of policies and programs (McKane et al, 2007). Denmark has
experienced the greatest proportional impact on energy consumption. It has had financial
incentives in place since 1992 through a tax on CO2 emissions combined with target setting
agreements, with supporting energy management standards introduced in 2001. The US, on the
other hand, has placed more emphasis on exposing energy efficiency opportunities available to
industry than on providing economic incentives to undertake these measures or on encouraging
the use of energy management standards. Correspondingly, relatively few facilities make use of
the energy management standard (McKane et al, 2007).

13
2 South Africa’s energy efficiency policy
South Africa has followed a particularly environmentally harmful industrialization path. Its
economy is dependent on energy-intensive industrial and mining sectors, which consume over
two-thirds of its national electricity supply, and it relies heavily on cheap, indigenous coal as its
main source of primary energy (DME 2008). Consequently, South Africa exhibits an
exceptionally high carbon intensity in its final energy mix, exceeding that of both the US and
China (IEA, 2008). Partly due to its abundance of cheap coal, South Africa has thus far enjoyed
an exceptionally low price of electricity. But this has provided firms, as well as consumers, with
little incentive to adopt energy efficiency measures and, from an energy standpoint, has
contributed to a relatively wasteful production culture (DME, 2008). Conversely, this also
means that there is substantial scope for energy savings through energy-focused lean production
strategies that eliminate energy waste.
South Africa has no obligation to reduce GHG emissions under the Kyoto Protocol.
Nevertheless, industrial energy efficiency has the potential to increase profitability,
competitiveness, and employment (Howells and Laitner, 2005). The Department of Minerals
and Energy (DME) released its first national energy efficiency strategy in 2005, and a review at
the end of the first phase in October 2008. It sets a national target for energy efficiency
improvement of 12 percent by 2014 relative to projected consumption. The program is
implemented on a sector-by-sector basis with progress monitored and the targets reviewed after
each of three stages. The strategy aims to achieve the required energy efficiency improvements
through the following enabling instruments and interventions:
1. energy efficiency standards
2. appliance labeling
3. education, information, and awareness
4. research and technology development
5. energy audits
6. monitoring and targeting
7. energy management systems
South Africa’s industrial sector is set a target for the reduction in final energy demand of 15
percent by 2014. Within the industrial sector the target is focused on the following sectors – iron
and steel, chemical/petrochemicals, mining, paper and pulp, cement. The strategy is thus
focused on energy intensive industry with no mention of light industry. While the DME

14
(2005/8) notes that the sector offers energy savings of around 50 percent of current consumption
in comparison with international best practices, a “savings potential of at least 11 percent is
readily achievable using low-cost to medium-cost technical interventions. Furthermore an
additional 5 percent - 15 percent energy saving would be achievable via proven no-cost and
low-cost techniques of energy management and good housekeeping” (DME, 2008:15).
The strategy notes the following principal barriers to the widespread implementation of energy
efficiency measures: the historically low price of electricity, a lack of knowledge and
understanding of energy efficiency opportunities, institutional barriers and resistance to change
(principally at the firm level), and a lack of investment confidence. It sets out a number of steps
to overcome these and emphasizes the importance of including stakeholders in the process. The
strategy promises government-led energy efficiency demonstrations and the introduction of
energy management standards as means to build industrial capacity in the field of energy
management. This would increase awareness and expertise and could indirectly increase
investment confidence as the cost and benefits of energy efficiency measures become more
certain. However, the review of the first phase (2008) reports very little in terms of actual
progress made.
A critical barrier not identified by the strategy is the voluntary nature of the energy efficiency
improvement target. The DME (2005) states, “it should be stressed that this target is by no
means a mandatory requirement, but rather a guideline to aspire to.” International experience of
target setting programs suggests that participation will be relatively low with unsatisfactory
results in the absence of or without the threat of strict regulation or energy/GHG emissions taxes
(Price, 2005).
Taking account of South Africa’s various other pressing social concerns, no provision is made
for financial support to industries or firms who actively pursue the energy efficiency target.
Indeed the DME claims that the general measures proposed, such as energy standards and
energy management systems, do not require substantial financial investment and that financing
can be obtained through enabling mechanisms such as the Clean Development Mechanism
(CDM). Price and McKane (2009), however, point out that the CDM project-based framework
is not well suited to energy efficiency projects as the relatively invariably high transaction and
carbon credit development costs tend to outweigh the relatively small emissions reductions
resulting from energy efficiency projects. International experience suggests that target setting

15
agreements are more effective in the context of a wider range of support instruments, of which
finance is included (McKane et al, 2007).
The DME energy efficiency strategy is very much in its infancy. Little change has occurred
between the 2005 and 2008 policy publications. The 2008 variant still contains little on
achievements in regard to practical implementation.
The National Cleaner Production Center - South Africa (NCPC-SA) was launched during the
World Summit for Sustainable Development in Johannesburg 2002 (www.ncpc.co.za). The
programme is a collaboration between South Africa and UNIDO with financial assistance from
the Department of Trade and Industry, the Council for Scientific and Industrial Research and the
Governments of Austria and Switzerland. The aim is to enhance the competitiveness and
productive capacity of industry, focusing on SME’s through cleaner production techniques that
minimize waste and pollution (NCPC, 2009). The NCPC-SA promotes the application of
cleaner production and sustainable industrial development in South Africa using the UNIDO
integrated cleaner production approach and provides:
• Promotion of environmentally sound technologies and investments
• Training
• Audits and technical assistance
• Information dissemination
• Technical advice to government on the application of multi-lateral environmental
protocols
• Policy advice to government on the adoption of cleaner production guidelines and
practices
The NCPC-SA offers training and skills development and technical services such as in-plant
audits and assessments. It also aims to build a local and international clean production network.
Both the automotive and clothing and textiles sectors are described as priority areas (along with
chemicals and agro-processing). The textile sector program is claimed to be the most advanced
while in contrast the automotive program has yet to be developed. Encouragingly, the
Automotive Industrial Development Centre (AIDC) are said to have formed an agreement with
the NCPC to implement cleaner production programmes in the automotive industry. The aim of
developing these priority sectors is to address the specific demands of these sectors and to run
sustainable cleaner production programmes in partnership with the identified sectors.

16
The clothing and textiles sector-specific project was officially established in January 2006, as a
result of the incorporation of the Cleaner Textiles Production Project (CTPP) and its extension
project, the Clothing and Textiles Environmental Linkage Centre (CTELC) into the NCPC. The
CTPP was established in 2000 with funding from the Danish International Development
Agency (DANIDA). The main aim of the CTPP was to address waste minimization within the
textile industry and to facilitate implementation of activities that will illustrate improved
environmental performance of cotton growing and textile manufacturing firms. In line with the
planned conclusion of this project in 2003, the project was extended with the formation of
CTELC, supported by both the DTI and DANIDA. CTELC focused on operations further down
the textiles and clothing pipeline, aiming to strengthen the link between the clothing industry,
retailers and cleaner textile production in South Africa. The objective was to raise awareness
and knowledge of environmental issues in the manufacture of textiles and how these can be
incorporated into textile products. To achieve this, most activities were focused on designers,
buyers and retailers of textile products. With the conclusion of CTPP and its extension project
CTELC, all activities of the project were incorporated into the NCPC clothing and textiles
sector component.
A number of ‘cleaner production quick scan assessments’ have been undertaken at various
clothing and textile plants. These are demonstrations of the benefits and potential for savings
under clean production. In 2005/6 the NCPC-SA had undertaken 6 assessments of textiles
plants, and 15 clothing companies were assessed in 2007/8 (NCPC-SA Management Report
2006, 2008). As an example, an assessment at Glodina textile plant in 2005/6 identified
opportunities for savings in the following areas – boiler condensate recovery, energy losses in
stenters, effluent sulphate concentration and air conditioning control. The assessment claimed
that savings of R400 000 ($53,000 or €37,000) per annum could be realized through recovery of
the condensate and a reduction in energy losses from stenters. (NCPC-SA Management Report
2006).
Relative to the US Department of Energy’s Industrial Technologies Program and Industrial
Assessment Centers, the NCPC-SA is also still in its infancy in terms of impacting on its target
sectors.
The most significant factor driving energy efficiency within industry has not been government
policy, strategy and institutional mechanisms such as the NCPC – SA. Rather this has been the
17
sudden and cataclysmic rise in the cost of electricity, which has had the greatest impact on firm
production behavior across all sectors. Although the original DME strategy document identified
the need to address cheap electricity and apply a price that reflects the true economic,
environmental and social cost of electricity generation, the sudden rise in the cost of electricity
has not been a consequence of the DME strategy.
Electricity has historically been extremely cheap in South Africa. Indeed up until the mid
2000’s electricity costs were amongst the lowest internationally. However, a major energy crisis
arose in late 2007 when supply could no longer cope with demand, resulting in persistent,
widespread blackouts. The crisis was a consequence of a lack of foresight in building sufficient
supply capacity on the part of ESKOM, the government parastatal responsible for electricity
generation and distribution. Eskom has since responded through a demand-side management
(DSM) scheme based on a major increase in the price of electricity. In order to generate
sufficient funding to build the requisite new power stations, ESKOM has chosen to raise the
capital through a series of massive price hikes in the unit cost of electricity to be phased in over
the next few years. The National Energy Regulator of South Africa (NERSA) approved an
increase in the price of electricity of 27 percent in June 2008. It then approved a further increase
of 31.3 percent in June 2009 (NERSA, 2009). For the period June 2010 to March 2012 ESKOM
has submitted a proposal to increase electricity tariffs by 45 percent per annum. NERSA is
unlikely to approve an increase of this magnitude but the increase is expected to be substantial.
How industry reacts is key to determining not only where South Africa positions itself in terms
of environmental impact, but also in terms of global industrial competitiveness. In the next
section we analyse the response of firms in the South African automotive and clothing and
textile sectors.
3 Contextualizing the energy efficiency challenge to industry
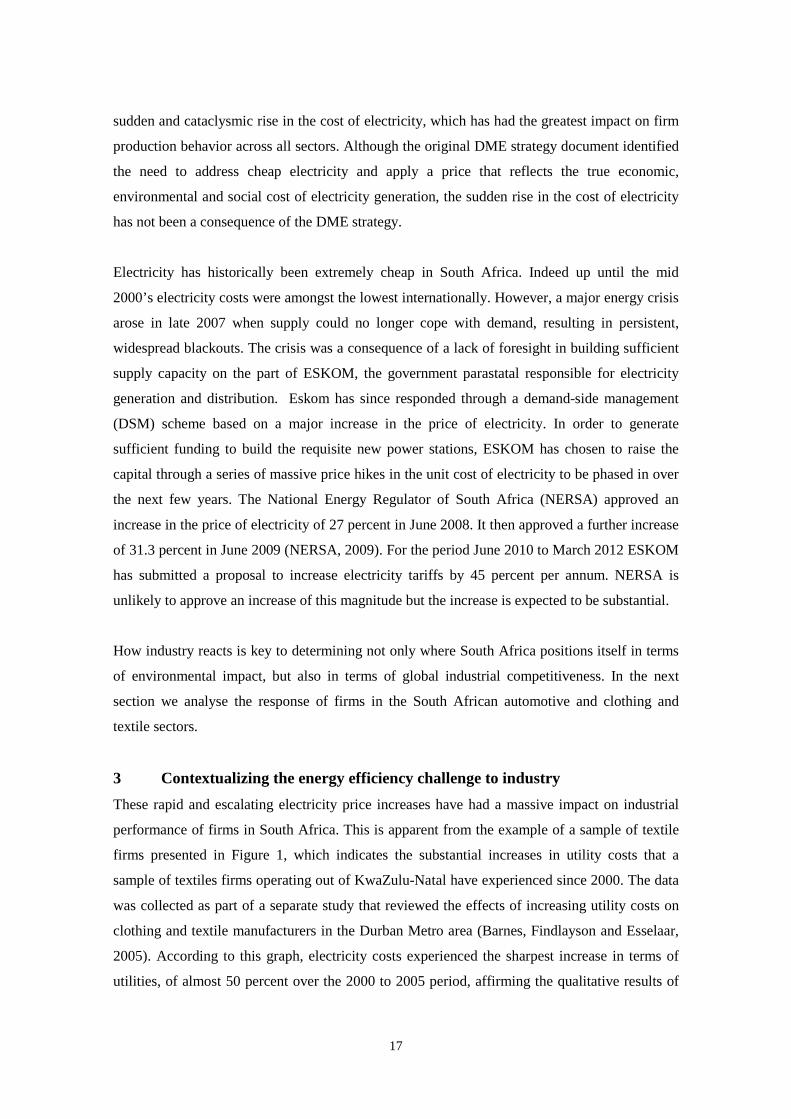
These rapid and escalating electricity price increases have had a massive impact on industrial
performance of firms in South Africa. This is apparent from the example of a sample of textile
firms presented in Figure 1, which indicates the substantial increases in utility costs that a
sample of textiles firms operating out of KwaZulu-Natal have experienced since 2000. The data
was collected as part of a separate study that reviewed the effects of increasing utility costs on
clothing and textile manufacturers in the Durban Metro area (Barnes, Findlayson and Esselaar,
2005). According to this graph, electricity costs experienced the sharpest increase in terms of
utilities, of almost 50 percent over the 2000 to 2005 period, affirming the qualitative results of

18
interviews conducted for this study, which indicated electricity costs as a major- if not the
predominant- factor affecting “green” performance at clothing, textiles and automotive firms
alike. In addition, Table 2 indicates the effect that this had in terms of the associated costs of
production over the same time period: electricity as a proportionate share of total costs of
production among the sample of textiles firms escalated from 1.58 percent of sales in 2000 to
1.81 percent by 2005. Since then, the industry has been subjected to numerous tariff hikes, the
most recent of which has potentially undermined any competitive advantage that the region may
have had over other production locations around the world.
Source: Barnes, Findlayson and Esselaar (2005)
Table 2 Electricity, rates, water and effluent costs as a percentage of real sales, 2000-2005
2000 2003 2004 2005 % Change: 2000 - 2005
Electricity 1.58 1.51 1.74 1.81 14.74% Rates 0.32 0.42 0.54 0.57 74.57% Water 0.52 0.56 0.75 0.71 35.99% Effluent 0.16 0.16 0.22 0.22 39.19%
Source: Barnes, Findlayson and Esselaar (2005)
Inflation-adjusted index of utility costs
100
110
120
130
140
150
Year
Ind
ex
Cost of electricity 100.00 117.83 131.13 145.77
Rates 100.00 121.68 134.45 132.61
Water 100.00 124.83 148.66 133.11
Effluent 100.00 108.90 126.36 140.95
2000 2003 2004 2005
Figure 1 Indexed increase in utility costs for textiles firms in the Durban Metro Area: 2000-2005

19
In 2009, Benchmarking and Manufacturing Analysts conducted an analysis of the
competitiveness of the KwaZulu-Natal automotive industry relative to its counterpart in
Thailand. During the course of this study, the relative cost of electricity in each location was
compared for a given load profile, based on actual firm-level data. The analysis revealed a cost
advantage for KwaZulu-Natal automotive firms of approximately 72 percent (VAT inclusive)
prior to 2009. However, the further hikes embodied in the revised 2009/2010 tariff structure
indicated that this would not be the case going forward. A modelling exercise applying the new
cost structure suggested that a firm operating under the same load profile would incur a 77
percent increase in its monthly electricity bill. Effectively, manufacturers operating out of the
Kwazulu-Natal area lost any competitive advantage over competitors in Thailand as of the end
of 2009. In an unprecedented reversal of circumstances, KwaZulu-Natal manufacturers are
presently factoring in electricity costs that are 3 percent steeper than they would have incurred if
they were operating in Thailand.
Electricity comprises 1 percent of the cost of sales (COS) of the average automotive component
manufacturer in KwaZulu-Natal. Given that materials comprises 59 percent of COS, then
electricity represents 2.5 percent of the COS controlled by auto component manufacturers.
Based on 35 percent price increases over three years, this will more than double, potentially
rendering firms uncompetitive (Barnes, Comrie and Hartogh, 2009), particularly when factoring
in the very low operating margins automotive component manufacturers secure from their
vehicle assembler customers. Shifts of only a couple of percent in the portion of a firm’s COS
that they control (generally only 30 percent to 40 percent of their total COS) can render a firm
uncompetitive. This point is equally relevant to clothing and textiles manufacturers. Energy
costs may not always represent a large component of the firms’ overall COS, but they do
represent an important part of the portion controlled by firms.
These increases are occurring in the context of a significant downturn in the performance of all
of South Africa’s major manufacturing sectors. The automotive and clothing/textile industries
are no exception. Indeed it could be argued that they have been hit harder than most. This
creates a crucial contextualization and external driving factor for the adoption of energy
efficient ‘green production’ initiatives.
The extent of the challenges confronting firms in the automotive and clothing/textiles industries
over the period 2005 – 9 is apparent from Table 3.

20
Table 3 Financial sustainability of firms in the automotive, clothing and textile industry
Component Manufacturers n
2005 2006 2007 2008 2009 Avg. 05-8
Avg. 06-9
Sales (indexed, inflation adjusted) 61 100 107.69 105.43 85.03 Value added (indexed, inflation adjusted) 59
100 97.64 98.25 94.61
Employment 65 100 104.42 100.51 87.92
Operating profit (% of sales) 57 10.89 9.21 9.29 8.83 9.55
ROI % 47 20.09 18.05 14.24 18.67 17.76
Capex (% of sales) 61 4.98 5.55 4.88 3.25 4.67
Training spend (% remuneration) 60 1.72 1.92 1.82 1.89 1.84
R&D expenditure (% of sales) 52 0.58 0.57 0.73 0.67 0.64
Clothing Manufactures Sales (indexed, inflation adjusted) 24 100 100.06 93.47 75.19 Value added (indexed, inflation adjusted) 21
100 115.41 93.83 86.90
Employment 24 100 100.96 97.26 82.39
Operating profit (% of sales) 23 6.00 6.06 5.54 4.08 5.42
ROI % (for manufacturers only) 15 5.08 9.28 9.64 2.98 6.74
Capex (% of sales) 23 1.45 2.54 0.97 0.35 1.33
Training spend (% of remuneration) 22 1.60 1.47 1.41 1.17 1.41 Product development spend (% of sales) 20
1.76 2.07 2.10 1.81
1.93
Cut Make and Trim operators Sales (indexed, inflation adjusted) 19 100 99.90 99.22 93.08
Employment 20 100 95.74 98.17 106.82
Operating profit % 16 11.27 11.89 9.73 12.29 11.29
Capex % 20 3.20 2.23 2.28 2.66 2.59
Training spend 18 3.40 2.99 2.86 2.29 2.89
Textile Mills
Sales (indexed, inflation adjusted) 12 100 99.30 96.34 85.96 95.40 Value added (indexed, inflation adjusted) 10 100 95.52 97.15 81.82
93.62
Employment 12 100 102.01 96.12 88.28 96.60
Operating profit % 10 12.54 11.12 8.28 5.37 9.33
ROI % 6 8.41 7.39 4.39 2.58 5.69
Capex % 11 3.01 3.39 5.87 2.80 3.77
Training spend 11 1.68 1.05 1.77 1.38 1.47
R&D spend % 9 3.58 4.00 4.51 1.79 3.47
Source: B&M Analysts database
The key conclusion from Table 3 is the decline in financial performance for both the automotive
and clothing and textile industries from 2005-9. The trend for automotive component
manufacturers is severe in respect of declining sales and employment. After a period of stability
(2006-8) the industry clearly took a battering in 2009, with sales down 20 percent and
employment 15 percent. Capex and R&D spend was reduced accordingly in 2009, although
training expenditure remained consistent (although total remuneration declined in line with

21
decreasing employment). Whilst ROI improved in 2009 this is on the back of firms not
investing in new assets and therefore “sweating” their declining investment base more
effectively. Operational profitability was also not too severely dented as a proportion of sales,
although the actual value of sales has declined significantly and so the Rand value of profits
secured would be substantially lower through 2009.
The trend for clothing and textiles manufacturers in terms of declining levels of investment is
equally severe. This is evident for capex, R&D and training spend. Justifying future investment
in the firms is becoming increasingly difficult given the poor operating (operating profits) and
investment (ROI) returns. Most strikingly, B & M Analysts was unable to update its textiles
database for 2009 because of insufficient benchmarks, primarily because a number of the firms
normally benchmarked have either closed (SBH, Frame Vertical Pipeline) or are in such serious
financial trouble that they did not believe they would benefit from being benchmarked.
Amongst the clothing firms, the only flicker of hope lies with the CMTs who continue to
perform “reasonably” – in respect of returns and investment levels.
Fundamentally, the context is one of severe market and operational conditions for firms;
although the crisis for automotive component manufacturers is far more recent (and less severe)
than for clothing and textiles manufacturers, who have experienced poor financial performance
for a period of time.
The evidence above naturally calls into question the sustainability of the local industries, given
their declining margins and sales. As electricity costs increase exponentially as a proportion of
cost, firms’ returns on investment are diminishing and the viability of operations are
compromised. The result is a forced response from industry participants, although the evidence
from proactive firms that have implemented energy saving measures suggests that all efforts to
date have failed to address the disjunction that exists between their resultant decreasing kilowatt
usage and rising energy costs: the magnitude of the increase in tariffs is simply too great to be
addressed in most cases. The risk to their respective industries is that major energy users are
increasingly finding it more feasible to close down operations, rather than invest the capital
required to address the problem of energy inefficiencies, in light of increasingly uncompetitive
energy costs.
A fundamental challenge confronting manufacturers in SA is their inability to transfer utility
cost increases on to the market. This is due to the liberalization of the SA economy and the

22
surge in imports of tradable products. Evidence of this pressure is exhibited in Figure 2, which
explores the consumption and cost of electricity at South African based automotive component
manufacturers.
Figure 2 Automotive industry’s electricity usage (2007 -2008)
Electricity usage in rand value per final product manufactured (n=13)
2.25 2.29
0.00
0.20
0.40
0.60
0.80
1.00
1.20
1.40
1.60
1.80
2.00
2.20
2.40
2007 2008Year
Ran
d p
er u
nit
Electricity usage in kilo-Watt (kWh) hour per final product manufactured (n=12)
6.31
5.74
0
1
2
3
4
5
6
7
2007 2008Year
kWh p
er u
nit
Source: B&M Analysts database
Figure 2 shows that the Rand cost of electricity per product manufactured increased marginally
(1.8 percent) from 2007 to 2008 despite the 8.9 percent reduction in the amount of electricity
used to manufacture each product. The same challenge exists for textiles manufacturers. Whilst
the B&M Analysts’ database does not capture the Rand value of electricity usage, it does
capture usage against kilogram of production, and in this regard performance improved from

23
8.72 to 8.18 kWh per kilogram of production from 2007 to 2008, an improvement of 6.2
percent.
Further evidence of firms attempting to better use the resources available to them within their
plants emerges in respect of water utilization (Fig 3) and scrap rate levels (Table 4).
Figure 3 Automotive industry’s water usage (2007-2008)
Water consumption in kilo-litre (KL) per final product manufactured (n=11)
0.01
0.02
0.00
0.01
0.01
0.02
0.02
0.03
2007 2008Year
KL p
er u
nit
Source: B&M Analysts database
In respect of water usage, the data suggests that automotive component manufacturers decreased
the Rand value of their water usage per product manufactured by a full 40 percent, although the
average actual reduction in water usage for a slightly larger population of firms was 100
percent.
Water usage in rand value per final product manufactured (n=13)
0.10
0.14
0.00
0.02
0.04
0.06
0.08
0.10
0.12
0.14
0.16
2007 2008Year
Ran
d per
unit

24
In contrast to the automotive component manufacturers, the four textiles firms for which we
have data did not improve their water usage from 2007 to 2008. In fact, a small deterioration
was evident – from 72.8 litres per kg of product manufactured to 73.3 litres, a decline of 0.6
percent. This is perhaps unsurprising in the context of the negligible investments made and very
poor returns secured by textiles mills in 2008.
Table 4 Scrap rate usage in automotive and clothing/textile firms
Scrap rate change n 2007 2008 Improvement Automotive component manufacturers 40 1.58% 1.50% 5.1% Clothing and textiles manufacturers 15 2.45% 2.39% 2.5%
Source: B&M Analysts’ database
In terms of better utilization of scrap, Table 4 summarizes the available data for firms in the
automotive and clothing/textile industries. Both sets of firms improved their scrap rates from
2007 to 2008, with their scrap loss value (expressed as a % of materials purchased) declining by
5.1 percent (autos) and 2.5 percent (clothing and textiles) respectively.
4 Energy efficiency as a strategic imperative
Arising from the interviews conducted with our sample, there is very limited evidence that firms
view “green production” as a strategic imperative. When interviewed, only 20 percent of firms
indicated that they had both a policy and a set of key performance indicators (KPIs) relating to
enhanced green production within their operations, with 13.3 percent of firms indicating neither
a policy framework nor the measurement of any KPIs. The majority of firms (56.7 percent) does
not have a policy relating to green production, but do claim to be measuring “green” KPIs. The
predominant KPI focused on by firms (in fact in 100 percent of the cases where firms do have
KPIs) is their electricity consumption – most notably because this is a substantial, and growing,
cost element within their business.
Table 5 Firm strategic imperatives re green production
n
Policy and KPIs
Policy but No KPIs
No Policy but KPIs
No Policy and No KPIs
Automotive component 17 17.6% 11.7% 64.7% 5.9%
Clothing and textiles 13 23.1% 7.7% 46.2% 23.1%
Total 30 20.0% 10.0% 56.7% 13.3%

25
The importance of cost factors to the firms’ response to improving their environmental
performance is further emphasized in Figures 4 and 5. These figures unpack the factors driving
green production at 13 surveyed clothing and textiles firms and 17 automotive component
manufacturers. Respondents were asked to rate the importance of 12- predetermined factors on
a 1-10 scale (where 1 represents total unimportance, 5 moderate importance; and 10 critical
importance).
Amongst the clothing and textiles firms (Figure 4) only one factor emerges as critical:
Electricity costs (rating of 9.3). While four other factors were rated as important (operational
management, water costs, local government and parent company/shareholder demands – all
rated between 6.4 and 7.2), the balance of the factors were deemed either only moderately
important, or not important at all. The least important factors in this regard – all rated below 3 -
were suppliers, consultants, and the National Cleaner Production Centre, the government
institution established to support green production in South Africa.
The responses received from the 17 automotive component manufacturers (Figure 5) were
similar. Electricity costs (8.8) are again the only critical driver of green production, with
operational management (6.8) again an important factor. However, unlike the firms in the
clothing and textile sector, national government policy (6.2) and customers (6.2) were noted as
important factors. The importance of the Motor Industry Development Programme to the
automotive industry - in terms of the manner in which it forces the export orientation of the
Figure 4 Drivers of clothing and textile firms ‘green production’

26
industry - and the producer nature of the value chain driving the automotive components
industry stand out as potentially important factors.
This raises the following questions:
• Does a developing economy firm’s export orientation influence its focus on green
production?
• Do MNC dominated producer driven global value chains “force” environmental issues
into developing economy manufacturers?
The three least important factors to automotive component manufacturers are consistent with
that of the clothing and textiles firms - consultants, suppliers, and the National Cleaner
Production Centre. The least important driver for the automotive component manufacturers is
the NCPC - SA, scoring only 1.5.
The lack of a material enabling relationship of the National Cleaner Production Centre, the
South African government’s major institutional driver, to the process of driving energy
efficiency in these two sectors is very problematic. Despite the fact that the National Cleaner
Production Centre has historically been involved in projects within the clothing and textiles
industry and has identified this sector as its model project, only three of the thirteen firms have
utilized the National Cleaner Production centre. Furthermore none of the automotive component
Figure 5 Drivers of automotive firms ‘green production’

27
firms have ever utilized the NCPC – SA. Indeed, much more seriously, sixteen of the seventeen
that were interviewed had never heard of the National Cleaner Production Centre. Whilst both
the clothing and textile and automotive industry identified the national and local government’s
policy as important factors that are driving their green performance (with an average rating of
between 5.5 and 6.8) the interviews show that this little to do with energy efficiency policy or
‘green production’ strategic interventions. The driving force has largely been exercised through
punitive means of electricity shortages and the threat of penalties if firms do not reduce their
electricity consumption by 10 percent.
Given the importance of external electricity costs as the main driver of energy efficiency efforts
by the firms, it is not at all surprising that the majority of firms across both sectors (70 percent)
reported that their energy efficiency interventions they have implemented are financially
profitable. The reasons for this are obvious from an analysis of the key energy efficiency
interventions being practiced by most of these firms (Table 6).
The most common energy efficiency intervention implemented in the clothing and textiles and
automotive industries is the revision of lighting systems, with eight firms (three clothing and
textiles and five automotive firms) identifying this as their key energy efficiency intervention.
These involved simple changes to lighting systems, such as removal of excess light bulbs,
change of light bulbs to energy efficient lighting, and installation of automatic off switches. This
intervention had a success rate of 87.5 percent, required capital expenditure which was 100
percent funded internally by the firms, and did not require any training.
The upgrading of the power supply is the other most commonly identified major energy
efficiency intervention with eight firms (three clothing and textiles and five automotive firms),
identifying this as their key energy efficiency intervention. As with the lighting, the specific
firm-level interventions varied across firms. However, overall, the firms focused on upgrading
or installation of power factor correction, and recapitalization of the entire electricity supply
layout. In line with the lighting interventions, all of the firms who upgraded their power supply
financed the interventions themselves, and claimed a 100 percent success rate. The latter
interventions were upgrade of power supply, air-conditioning reduction or removal, and
changing of air compressors. The only intervention not requiring capital expenditure is the peak
usage restructuring. The majority of interventions that were identified by the participating South
African clothing and textile and automotive component manufacturers do not require training,
with an average of only 28.57 percent of projects requiring training.

28
Table 6 Major energy efficiency interventions of all firms (automotive, clothing, textile)
Intervention EntailedNo of firms that implemented
% projects req. capex
% projects req. training
Interrupted production? Finance by project
Lighting
Removal of excess lightbulbs; change to e.e. bulbs; automatic offswitch 3 C&T; 5 Autos 87.50 87.50 0.00 no 100% of projects self-financed
Upgrade power supply
Power factor correction; recapitalisation of electricity supply layout 3 C&T; 5 Autos 100.00 75.00 0.00
yes on one account 100% of projects self-financed
Capital upgrade
Investment in plant (eg. Dyehouse) or equipment (dryers/machinery) 3 C&T; 1 Autos 75.00
One firm involved in ongoing upgrade 83.30 66.70 no
1 firm had investment in dyehouse. This required borrowing from IDC at prime minus 5%; other projects self-financed by firms
Peak usage restructuring
Switching off machines on weekend; usage of high output machines in off-peak periods 1 C&T; 2 Autos 66.70
One firm experienced mixed success 0.00 33.30 no Not necessary
Monitoring and measurement
Meter installation; fuel monitoring; analysis and intervention in compressors to lower demand 2 C&T; 3 Autos 60.00
One firm in ongoing development; one firm
had not yet experienced success 80.00 50.00 no
Monitoring of fuel and compressor intervention did not require; one meter installation project not self-financed
Air conditioning Switching off; reduction in usage 2 C&T; 2 Autos 100.00 25.00 0.00 no3 projects did not require, one project self-financed by firm
Air compressorsChanged air compressors to be more efficient 2 Autos 100.00 50.00 50.00 no
One project did not require, other was self-financed
Average 84.17 57.26 28.57 no Financed by firm
% projects experiencing success
* In some instances the firms provided more than one major energy efficiency intervention
In the light of the importance of electricity as a cost driver, it is hardly surprising that both the
lighting and upgrade of power supply relate to firms electrical systems and did not require any
training. Cumulatively, therefore sixteen of the thirty firms (53.3 percent) that were interviewed
had interventions that were specifically related to their electrical systems.
In the firm interviews we attempted to dig deeper into the drivers of green production by asking
firms to rank the internal and external factors both enabling and hindering the advancement of
green production within their operations (Table 7 and 8).
The 13 clothing and textiles manufacturers again focused on electricity/energy costs as the
major factor – however as an internal and external enabler, rather than hindering factor. Firms
clearly view escalating electricity costs as an enabler insofar as it provides management with the

29
opportunity to convince their shareholders to invest in systems to reduce energy consumption.
This appears to be the reason why management capacity is ranked as the most important internal
enabler.
The clothing and textiles manufacturers (Table 7) again focused on electricity/energy costs as
the major factor – however as an internal and external enabler, rather than hindering factor.
Firms clearly view escalating electricity costs as an enabler insofar as it provides management
with the opportunity to convince their shareholders to invest in systems to reduce energy
consumption. This appears to be the reason why management capacity is ranked as the most
important internal enabler.
Table 7 Internal and external, enabling and hindering factors for clothing/textile firms
Internal Factors External Factors
Enable Score Hinder Score Enable Score Hinder Score
1 Management
capacity 15
Lack of financial resources
33 Cost of
electricity 13
Lack of national
government support
12
2 Energy costs 13
Lack of knowledge of
practical solutions
11 Customer pressures
11 Recession 11
3 Environmental
awareness 9
Lack of environmental
awareness 5
Cost of fuel
7 Lack of local government
support 10
4 Shareholder
demands 6 Lack of drive 3
Cost of water
6
Lack of customer demand/
incentives
6
5 New capital expenditure
4 Lack of human
resources 2
Cost of coal
6
Lack of incentives
from government
6
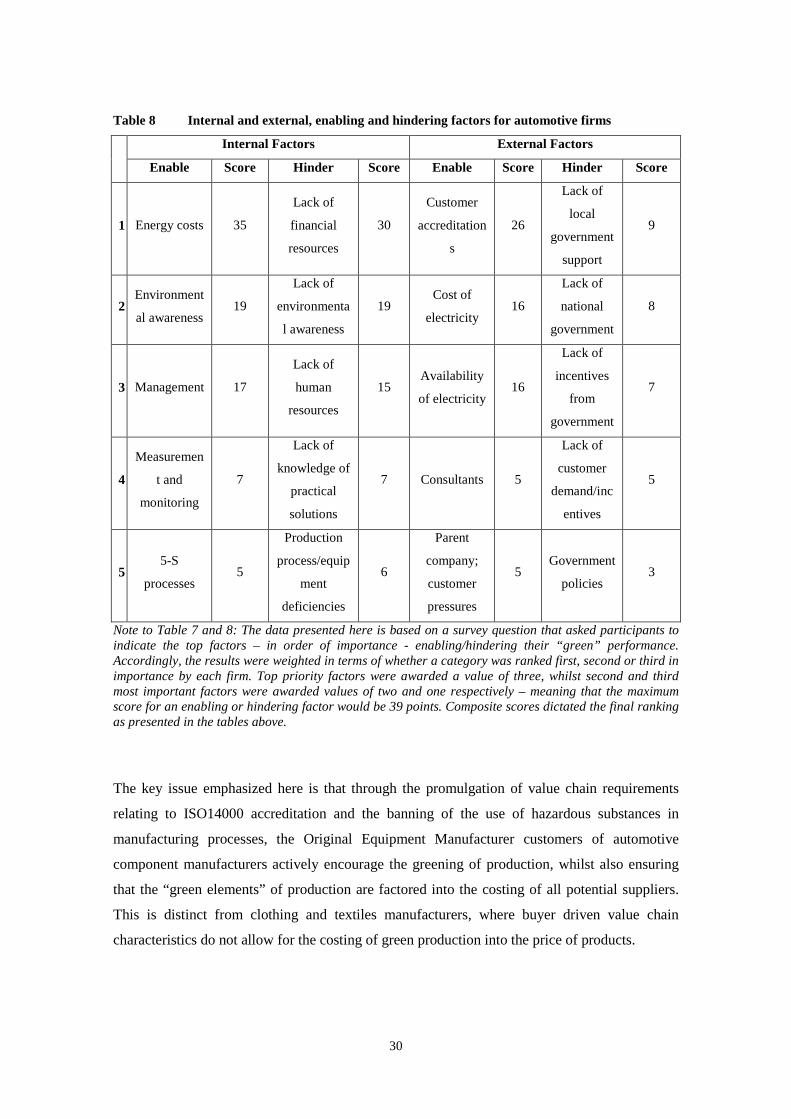
As reflected in Table 8, the automotive component manufacturers similarly focused on energy
related costs as an enabling factor (for the same reasons as the clothing and textiles firms). A
major distinction again relates to the producer driven nature of the automotive value chain, with
firms emphasizing customer accreditation requirements as a critical external enabler of green
production.
30
Table 8 Internal and external, enabling and hindering factors for automotive firms
Internal Factors External Factors
Enable Score Hinder Score Enable Score Hinder Score
1 Energy costs 35
Lack of
financial
resources
30
Customer
accreditation
s
26
Lack of
local
government
support
9
2 Environment
al awareness 19
Lack of
environmenta
l awareness
19 Cost of
electricity 16
Lack of
national
government
8
3 Management 17
Lack of
human
resources
15 Availability
of electricity 16
Lack of
incentives
from
government
7
4
Measuremen
t and
monitoring
7
Lack of
knowledge of
practical
solutions
7 Consultants 5
Lack of
customer
demand/inc
entives
5
5 5-S
processes 5
Production
process/equip
ment
deficiencies
6
Parent
company;
customer
pressures
5 Government
policies 3
Note to Table 7 and 8: The data presented here is based on a survey question that asked participants to indicate the top factors – in order of importance - enabling/hindering their “green” performance. Accordingly, the results were weighted in terms of whether a category was ranked first, second or third in importance by each firm. Top priority factors were awarded a value of three, whilst second and third most important factors were awarded values of two and one respectively – meaning that the maximum score for an enabling or hindering factor would be 39 points. Composite scores dictated the final ranking as presented in the tables above.
The key issue emphasized here is that through the promulgation of value chain requirements
relating to ISO14000 accreditation and the banning of the use of hazardous substances in
manufacturing processes, the Original Equipment Manufacturer customers of automotive
component manufacturers actively encourage the greening of production, whilst also ensuring
that the “green elements” of production are factored into the costing of all potential suppliers.
This is distinct from clothing and textiles manufacturers, where buyer driven value chain
characteristics do not allow for the costing of green production into the price of products.

31
5 Case studies of four firms
The four case studies presented in this section were selected on the basis of the firms’
proactiveness in embracing energy efficiency processes. The findings are not therefore
representative of the general findings from the research, as presented above, but rather to
illustrate the nature of interventions taking place at firms that have recognized the importance of
enhancing their energy efficiency performance.
Case Study 1 Energy efficiency performance of a multinational automotive component
manufacturer in South Africa
Federal Mogul Friction Products is a leading global automotive component manufacturer in
South Africa. As the firm is part of a large multinational group its head office is abroad and the
firm reports directly to this head office. Federal Mogul’s energy efficiency interventions form
part of the Environmental, Health and Safety Manager’s responsibility. As with the vast
majority of South African participant firms in the clothing, textile and automotive industries,
Federal Mogul does not have a formal written energy efficiency policy in place. However, the
firm does have specific energy targets that are set by the head office for the firm to adhere to.
Specifically, Federal Mogul’s directive from head office is to reduce both electricity and gas
usage by 3 percent.
In 2008, the firm conducted two levels of intervention in an effort to reach the required energy
efficiency targets set by head office. Firstly, the firm systematically created buy-in and
environmental awareness of employees through the incorporation of training on the importance
of environmental awareness in the firm’s induction programme and refresher training. Secondly,
the firm conducted a broad array of projects to reduce the firm’s energy consumption. These
include:
1. Utilization of pyrostic controls on furnaces so that they start slowly instead of
immediately;
2. Lowering compressors so that only have compression that is necessary for current
demand;
3. Programmed geysers are only utilized in low tariff periods;
4. Changing of fluorescent lighting to low voltage lighting;
5. Conducting analysis of top ten electricity utilizing machines in order to maximize
utilization in low tariff periods.

32
Federal Mogul Friction Products also learns from sister companies through a group database
where the group’s member firms interventions are recorded and thereby create a database of
ideas for the companies within the group. The firm has an environmental, health and safety
committee which consists of both employee representatives and management representatives. In
order to ensure project progress and success, this committee monitors the firm’s monthly energy
consumption and costs. As a large corporation with high levels of skill, knowledge and human
resources, it is clear that firms such as Federal Mogul have an inherent advantage in terms of
their ability to implement energy efficiency interventions.
Figure 6 below represents Federal Mogul’s total electricity output (KwH) for 2007, 2008 and
2009 for each of the different tariff periods. Federal Mogul Friction Products is situated in the
eThekwini municipality and there are different tariff periods for electricity for different times.
Peak electricity hours are from 7h00 – 10h00 and 18h00 – 20h00. Off-peak electricity hours are
from 22h00 to 7h00 and Standard electricity hours are from 10h00 – 18h00 and 20h00 to 22h00.
As is evidenced by Figure 6, Federal Mogul managed to decrease their electricity output in all
three tariff periods with an overall total reduction in electricity consumption from 2007 to 2009
of 35.5 percent.
Figure 6 Federal Mogul Friction Products Electricity Output (KwH)

33
Federal Mogul’s key driver of energy efficiency performance has been directives from its
corporate headquarters’. Other important factors identified as enabling the firm’s performance
include cost savings opportunities, the environmental awareness of staff, consultants and
external awareness generation through seminars and workshops. Federal Mogul specified that
support, in the form of newsletters and meetings, from the South African Metal Finishing
Association had been pivotal in terms of informing industry on opportunities for energy reform.
The key factors which were identified as hindering the firm’s progress with respect to energy
efficiency are the lack of knowledge of staff on other opportunities to reduce energy
consumption; the cost of capital equipment and process constraints.
Case Study 2 Electricity blackouts threats induces energy efficiency savings
Allwear is a local clothing manufacturer of school, corporate and menswear in Northern
KwaZulu-Natal, South Africa. The firm is a large manufacturer, and employs approximately 1
100 people. Whilst Allwear’s management indicate that they have not identified a need to create
a formal energy efficiency policy, the firm has had a number of energy efficiency interventions
and does monitor and measure its electricity output (KwH and maximum demand (KvA) on a
monthly basis.
In order to improve the firm’s energy efficiency,
Allwear installed power factor correction in 1997.
Power factor correction reduces the maximum
demand (KvA) and assists electricity users to lower
their electricity tariffs where they are billed for
maximum demand (KvA) and maximum output
(KwH).
The firm’s power factor corrector was sourced from
a South African firm and management indicated that
the investment payback period was two years.
In 2008, as a consequence of the electricity crisis and ESKOM’s inability to meet demand, local
municipalities, who distribute the electricity from Eskom, were forced to conduct load shedding
exercises. Consequently different municipal zones underwent power cuts for specific time
periods on a daily or weekly basis. As a result, the South African manufacturing sector was
severely impacted. Allwear consulted with their local municipal authority and set up an

34
agreement in which the industrial lists in the town would be exempted from the effects of load
shedding, if they in turn agreed to reduce their electricity usage by ten percent. The firm’s
approach to achieving this objective was twofold.
Allwear’s knitting division
Firstly, the firm’s management team analysed its electricity expenditure and identified that the
firm’s air-conditioning system was the firm’s major electricity consumer. Thereafter, the firm
made the decision to stop all use of the air-conditioning system throughout the firm. Employee
buy-in was cultivated through open communication and consultation with the workforce,
highlighting the necessity of reducing electricity consumption so as to ensure the firm’s
sustainability was not undermined. Shop stewards were part of the firm’s team from the very
first meeting with the municipality. The office block also switched off their air conditioners so
that the workforce knew that the CEO would work under the same conditions as the machinists.
The second initiative adopted involved the removal of excess light bulbs from the firm’s offices
and to adopt a policy of switching off lights when areas were not in use. The results of these
initiatives were staggering and allowed the firm to reduce its monthly consumption from
660KwH to 410KwH in the summer months when air conditioning is utilized. This is a
reduction of 37 percent in electricity output per month. Figure 7 below indicates that the firm’s
average maximum demand per month (KvA) reduced from 717 KvA in 2007, to 488 KvA in
2008 to 492 KvA in 2009. As a result of these initiatives the firm was successfully able to
reduce its output and avoid electricity blackouts.

35
Figure 7 Allwear’s average KvA consumption per month from 2007 to 2009
0
100
200
300
400
500
600
700
800
900
2007
2008
2009
KvA Consumption 2007 - 2009
Figure 8 indicates that the firm’s average electricity expenditure reduced from an average of
R40 666 per month in 2007 to R38 958 per month in 2008. This is due to the increase in
electricity cost over this period. Whilst the magnitude of the Rand savings achieved is not high,
the firm has still managed to contain energy costs by becoming more efficient. Should the firm
not have had these energy efficiency interventions, its electricity expenditure would have
increased considerably and the firm would have been exposed to blackouts.
Management identified that the key factors which have driven Firm Z to improve its energy
efficiency have been the threat of blackouts by the local municipality and the increasing cost of
energy. Conversely, the major factors which have hindered the firm’s progress with respect to
energy efficiency were identified as poor operator attitude and the lack of innovative
government policies. The firm identified that if the government provided the Firm with
incentives to reduce energy efficiency, this would encourage them to do a lot more.

36
Figure 8 Allwear’s average electricity expenditure March 2007 to Feb 2009
R 0
R 5 000
R 10 000
R 15 000
R 20 000
R 25 000
R 30 000
R 35 000
R 40 000
R 45 000
R 50 000
Mar Apr May June July Aug Sep Oct Nov Dec Jan Feb
March 07 to Feb 08
March 08 to Feb 09
Actual electricity expenditure comparison 07/08 and 08/09
Case Study 3 Optimization of production planning on key energy using equipment to
improve energy efficiency
Shatterprufe manufactures glass windows for the automotive industry in South Africa. The firm
has three manufacturing facilities which manufacture over three million pieces of safety glass
per annum. Shatterprufe’s Struandale plant participated in the energy efficiency research. The
Struandale plant is located in Port Elizabeth and is the exclusive producer of original equipment
toughened rear-lights and door glasses for South African motor manufacturers. The plant
supplies replacement glass locally and exports to international markets. This plant employs
approximately 300 employees. In line with the research findings from the majority of
automotive component manufacturers, Struandale does not have a formal energy efficiency
policy. Despite this, the firm does monitor its maximum demand (KvA) and electricity output
(KwH) per square metre of glass manufactured. In 2009, Struandale’s management identified
that it has a specific objective of reducing electricity output per square metre of glass
manufactured by 30 percent and to reduce its maximum demand by 10 percent.
In order to achieve these energy efficiency targets, Struandale established an energy forum. This
forum consists of a factory environmental manager, general manager and technical manager.
The intervention initially analysed the firm’s electricity output and the major contributors to this

37
electricity output. It was revealed that the factory furnaces which are coupled with fans were
the highest consumers of electricity. As a result of these findings, management made the
decision to adjust the production schedule so that the fans and furnaces were: 1) utilized to the
maximum in off peak periods; 2) switched off when not in use, and; 3) switched on in a
staggered way, one machine at a time, so as to lower the maximum demand peak. These
interventions were conducted in the middle of 2009.
Figure 10 Struandale’s average maximum electricity demand per square meter glass
Year: 2007 2008 2009 2010 YTD
Average kWh/m2 41.83 53.37 48.73 41.72
Year: 2007 2008 2009 2010 YTD
KvA/m 2 0.084 0.116 0.125 0.105
Figure 9 Struandale’s average electricity output per square meter glass

38
Figure 9 indicates that the firm’s energy efficiency interventions have had an extremely positive
impact on the firm’s electricity consumption which has dropped from 48.73KwH/m2 in 2009 to
41.72KwH/m2 in 2010 YTD which are on par with the firm’s 2007 electricity consumption
levels and is a 14.34 percent reduction in electricity output. Similarly the interventions have also
had a positive impact on the firm’s average maximum electricity demand. Figure 10 indicates
that the firm’s maximum demand levels have been increasing year on year from 2007 to 2009.
The energy efficiency interventions were then implemented in mid-2009. Overall a 16 percent
reduction in maximum demand is evident from 2009 to 2010 YTD.
Shatterprufe’s management indicated that this initiative is still in its infancy, as their objective is
to go a step further by installing an electricity meter for every furnace (coupled with fan). This
will enable the firm to develop a detailed understanding of the electricity usage of the individual
machines and will allow the firm to then take further steps to optimize production in order to
improve its energy efficiency. At the time of the interview, the Struandale plant was in the
process of raising finance for this initiative. Struandale will be funding this initiative itself and
the payback period for this investment is estimated to be within a year. Other initiatives
identified by the energy forum include water recycling and the utilization of gas to heat water to
recoup lost energy.
Struandale’s management recognizes that, in order to ensure the success of their energy
efficiency interventions, it must generate environmental awareness and buy-in from the entire
company and not just from top management. The firm has utilized its mission-directed work
teams to communicate this environmental awareness to all employees.
The firm’s management identified the following key internal and external factors which have
enabled or hindered its energy efficiency performance (in order of importance):
Internal enabling factors:
1) Management’s commitment to improving the firm’s energy efficiency;
2) Management’s understanding of the firm’s production processes and,
3) General environmental awareness.
External enabling factors:
1) The increasing cost of electricity;
2) Customer accreditation requirements obliging suppliers to have ISO 14001;
3) Local government policy;

39
4) Media awareness of the importance of the environment and energy saving.
Internal hindrances:
1) Limited technical resources internally;
2) Limited capital with the downturn in the world economy, and;
3) Lack of staff drive.
External hindrances:
1) the Lack of clarity in local government policy;
2) Lack of support from Eskom;
3) Lack of financial support;
4) Lack of support from National government.
Case Study 4 Improving energy efficiency through upgrade of capital equipment in the
textiles sector
Firm X represents a major textile manufacturer in South Africa. This firm’s major operations
include knitting, dyeing and finishing. Whilst the firm does not have a formal energy efficiency
policy in place, the firm’s management indicated during the course of their interview that
operating in the most energy efficient manner has become part of the way in which the firm
operates. The key driver of this response is to necessarily save money and drive costs
downwards. Firm X’s managing director identified that whilst the firm’s energy efficiency
policies are being driven downwards by top management, everyone in the firm is aware of the
need to operate in an energy efficient manner.
Firm X measures the following three key performance indicators: 1) Litres of water per
kilogram of fabric produced, 2) Litres of Hfo Oil per metre fabric stented, and 3) Tons of coal
per kilogram of fabric dyed. These key performance indicators are measured and correlated on a
daily and weekly basis. Encouragingly, firm X has managed to improve its performance in
relation to these key performance indicators. There have been two major interventions enabling
the firm to improve its performance in this regard.
The first major energy intervention has been the upgrading of the dyehouse’s capital equipment.
The South African textiles industry has an aging capital base, with the average age of equipment
in this sector being 13 years old in 2008 (BMA Database). One of the key factors which has
undermined capital investment in this sector has been the availability of financial support. The

40
poor performance of this sector in response to international competition has undermined the
willingness of commercial lending institutions to lend finance to this sector. Firm X, however
has been able to secure a loan from the Investment Development Corporation (IDC) at the prime
lending rate less 5 percent. This IDC loan forms part of the R70 million in loan finance that has
been set aside by the government as part of a comprehensive rescue package for the ailing South
African clothing and textile sectors. This loan has enabled the firm to upgrade its capital
equipment in the dyehouse, thereby enabling it to halve its water and steam consumption
through: 1) A reduction in process time from 14 to 6 hours; 2) Utilizing less energy in their
production process as a result of newer, more efficient machines; and 3) Lowering the reprocess
rate and thereby lowering energy consumption. Firm X’s management team has estimated that
the dyehouse’s carbon footprint will be reduced by approximately 40 percent and the total
firm’s carbon footprint will be reduced by an estimated 30 percent.
The second major intervention conducted by the firm to improve energy efficiency is investing
in a dryer. The new dryer utilizes half the steam that the firm’s old dryer utilized. Overall, the
management estimate that the new dryer has resulted in a 10-15 percent reduction in the firm’s
total steam consumption.
The firm’s management identified that the most important factors driving the firm’s energy
efficiency performance have been increasing water, electricity and fuel costs. On the other hand,
the lack of readily available financial support has thwarted the firm’s progress in this regard.
This has been exacerbated by a lack of environmental awareness and deficiency of knowledge
and skills of the firm’s staff relating to opportunities for improvement. Firm X indicated that the
lack of external support relating to opportunities for manufacturers to reduce their energy
consumption and the lack of incentives from customers to become green have inhibited the
firm’s energy efficiency performance.
Conclusion
Energy efficiency in South African manufacturing has only recently appeared on the real agenda
of manufacturing enterprises. The internalization of this awareness has however not been driven
by government policy. Nor has it primarily emanated from the demanding requirements of the
value chain drivers to whom the automotive component firms and clothing textile firms are
supplying product. Quite simply the sudden awareness of the need to achieve some form of
energy efficiency has clearly been driven by the external force of rapidly and unexpectedly
rising electricity costs.

41
This focus on immediate cost drivers has conditioned the manner in which energy efficiency has
been internalized in these firms. Their immediate reaction has been to seek the low hanging fruit
of fairly superficial, albeit very real in terms of short term cost savings, initiatives focused on
the plant context of lighting and air conditioning. These savings have clearly not been
insignificant and should not be dismissed in and of themselves. They have made a financial
difference to these firms and raised awareness of some of the issues concerned with energy
efficiency.
However the fact that electricity cost saving aimed at short term gain has driven the process has
meant that energy efficiency has not been internalized in the strategic framework driving long
term objectives. Likewise nor have the principles of green production been translated into a
restructuring of their plant production processes to achieve long term energy savings.
Given the extremely cheap electricity available to industry in the past, manufacturers clearly did
not take energy efficiency seriously. They treated it as an externally imposed ‘credence good’
and hence wanted to be rewarded for good behaviour of acknowledging green issues. They are
now taking it seriously because of the impact of utility costs and the threats of punitive action if
cost savings are not achieved. The irony is that the very driver pushing them into green
awareness is simultaneously the same factor inhibiting their capacity to fully embrace energy
efficiency principles, and translate it into long term restructuring to achieve green production.
For the combination of difficult economic conditions compounded by prohibitive utility costs
weakens the ability of the firms to realize sufficient financial returns to recapitalize and achieve
long term restructuring.
This is most apparent amongst the clothing and textile firms who are squeezed by a combination
of a difficult operating and financial environment within which they are severely constrained by
a lack of competitiveness, as well retail chain customers who are simultaneously very
undemanding in respect of green issues and very demanding in respect of meeting cost
requirements. It is therefore not surprising that issues of energy efficiency and green production
remain at the most superficial level in this industry.
The position of the automotive component manufacturers is however more complicated. They
are in a very different position from the clothing and textile firms, for they face an escalating set
of value chain requirements from their most demanding customers (such as Toyota) insisting
that green production becomes integrated into the component manufacturers production KPIs.

42
As is apparent from the interviews, the rising cost of electricity forced these automotive firms to
put energy efficiency on the immediate agenda. But these producer value chain demands mean
that they cannot rest on their laurels and focus solely on lighting savings. The utility cost rises
have therefore done them an immense favour, for this has shocked them into the appropriate
strategic space to deal with the value chain requirements emanating from increasingly green
automotive assemblers. If they fail to internalize energy efficiency they face the medium term
risk of losing their hard fought place in the assemblers supply chains, and this means long term
economic ruin. For there is no such thing as an independent automotive manufacturer at the
level these domestic manufacturers operate.
In these conditions government policy and strategic intervention should have a special role to
play. However this has not been the case. Government policy has remained vague and at a paper
policy level. Government should have a special role in a context where there are severe
pressures to move towards energy efficiency but where there are insufficient financial returns to
internalize green production processes. Under these conditions government should be providing
a range of supporting mechanisms – financial, training, consulting etc – in order to align public
goods with a firms private good. The interviewed firms identified government as one of their
biggest constraints in achieving energy efficiency. Yet there are precious few government
interventions to provide direct green incentives for firms to embrace energy efficiency in a
deeply rooted manner. Instead the principle intervention has been indirect through the punitive
stick of ESKOM’s electricity pricing strategy. In a financial and sales environment where firms
are treading water just to survive, one would expect much greater array of government energy
efficiency mechanisms to incentivize firms to restructure and internalize green production
methods for the medium to long term.
This is not only an issue of financial incentives. The firms also identified the lack of technical
skills to deal with the requirements for achieving sustainable energy efficiency. They made it
clear that if they do not have high levels of technical skills in energy efficiency then they will be
unable to influence plant activities and ensure that all staff embrace green production awareness
and behaviour. But the severe lack of skills and government failure to address the problem has
been highlighted by numerous studies on the South African economy. This is cited as the
biggest problem hobbling the long term competitiveness of South African industry. If the
general problem of skill gaps and skill lacks is a problem, how much more so is it in respect of
energy efficiency knowledge. In this respect government initiatives seem also to be lagging far
behind.

43
Appendix A note on research methodology
The findings contained in this document are the result of an intensive research process that was
initiated in October 2009. The research process comprised a mix of two research methodologies
namely:
• Quantitative analysis of existing benchmarking data
• Firm level (automotive, and clothing/textile) interviews.
The quantitative data that was utilized for this research was sourced from Benchmarking and
Manufacturing Analysts (BMA) database. BMA has run clusters in both the automotive and
clothing and textile sectors, collecting data from these industries over a considerable period of
time. BMA is the service provider to the South African Automotive Benchmarking Club in the
automotive sector, and the KwaZulu-Natal Clothing and Textile Cluster and the Cape Clothing
and Textile Cluster with a cluster membership of over 80 firms in each of these industries.
BMA’s benchmarking methodology includes the analysis of firm-level quantitative data that is
provided by the firms, the application of a customer and supplier benchmarking questionnaire,
as well as a process benchmark which includes qualitative interviews with the firm’s
management and employees. The quantitative data that has been utilized for this report has been
sourced from the clothing and textile clusters and the automotive benchmarking club databases.
In addition firm level interviews were undertaken in order to analyse the strategic and
operational changes that are taking place with respect to energy efficiency at South African
automotive manufacturers and clothing and textile firms. Firms in both these sectors
participating in the automotive benchmarking club and the clothing and textile clusters were
asked to participate. Ultimately thirty firm level interviews spread over the two industries were
conducted. This consisted of seventeen automotive component manufacturers and thirteen
clothing and textiles firms. The interviews were conducted with senior management in each of
the firms interviewed. A list of participating firms as well as the status of the management
interviewed is enclosed below.

44
Table 9 List of clothing and textile firms interviewed.
NO FIRM NAME OWNERSHIP NO. OF EMPLOYEES INDIVIDUAL
INTERVIEWED
DESIGNATION
1 Allwear Locally Owned 1168 Dr. Jan-Henk
Boer
Managing
Director
2 Celrose Locally Owned 638 John Comley Managing
Director
3 Colibri Locally Owned 323 Mike Scott Technical
Manager
4 Dyefin Locally Owned 162 Brenton
Pooley
Managing
Director
5 House of Monatics Locally Owned 750 David
Hampton
Works
Engineer
6 International Trimmings Locally Owned 418 Fred
Christopher
Managing
Director
7 Monviso Locally Owned 1297 Ian Stein Managing
Director
8 Ninian & Lester (Textiles) Locally Owned 333 Malcom Tyler Managing
Director
9 Prestige Clothing Locally Owned 525 Graham
Choice
Managing
Director
10 Prilla Locally Owned 275 Enrique
Crouse
Managing
Director
11 Rotex Locally Owned 191 Martin
Rohner
Director of
Production
12 Spectrum Textiles Locally Owned 11 Wouter
Willemson
Managing
Director
13 Zorbatex Locally Owned 403 Mike Wood Managing
Director
Average Locally Owned 535
Table 10 List of automotive firms interviewed
NO FIRM NAME OWNERSHIP NO. OF
EMPLOYEES
INDIVIDUAL
INTERVIEWED
DESIGNATION
1 August Lapple Multinational 1037 Willem Olivier Purchasing
Executive
2 Automould Locally Owned 250 Brent Latter Managing
Director
3 Federal Mogul PE Multinational 400 Johan
Terblanche
QSHER Manager
4 Federal Mogul Friction
Products
Multinational 352 Yakesh Nirmal Energy
Programme
Manager
5 Feltex Fehrer PE Multinational 250 Gert Harmse Plant Manager
6 Formex Multinational 430 Werner van
Rensberg
Managing
Director
7 Hesto Harnesses Locally Owned 1639 John Chandler Managing
Director
8 Kaymac Locally Owned 164 Alvin Pillay Managing
Director
9 PFK Electronics Locally Owned 421 Martin Vermaak Production
Director
10 Pi Shurlock Locally Owned 320 At Davel Manufacturing
Manager
11 Ramsay Engineering Locally Owned 460 Andrew Turner Managing
Director
12 Rieter Feltex Multinational 49 Robert Gooch Managing
Director
13 Senior Automotive Multinational 256 Arnu Kreel
14 Shatterprufe Locally Owned 339 Gerhard
Pretorious
Technical
General
Manager
15 Smiths Manufacturing Locally Owned 259 Jéan Esterhuizen Operations
Director
16 Spicer Axle Multinational 400 Keith Vosloo Plant Manager
17 Webroy Locally Owned 100 Rob Royston Managing
Director
Average Locally Owned 419

45
References
AEA Energy & Environment (2009), Fourth period assessment report of Climate Change Agreements.
Barnes, J, Comrie, D, and Hartogh T (2009), A comparative study of the cost competitiveness of automotive production in Thailand relative to KwaZulu-Natal, Durban Automotive Cluster Research Report, 30th November 2009, 32 pages.
Barnes, J, Esselaar, J, and Finlayson, D (2005), Utility costs and their effect on the competitiveness of the KwaZulu-Natal clothing and textiles industries, Report compiled for the KwaZulu-Natal Clothing and Textiles Cluster, 27th October.
Bernstein, L., J. Roy, K. C. Delhotal, J. Harnisch, R. Matsuhashi, L. Price, K. Tanaka, E. Worrell, F. Yamba, Z. Fengqi, 2007: Industry. In Climate Change 2007: Mitigation. Contribution of Working Group III to the Fourth Assessment Report of the Intergovernmental Panel on Climate Change [B. Metz, O.R. Davidson, P.R. Bosch, R. Dave, L.A. Meyer (eds)], Cambridge University Press, Cambridge, United Kingdom and New York, NY, USA.
Canadian Industry Program for Energy Conservation, (2005), Best Practice Benchmarking in Energy Efficiency: Canadian Automotive Parts Industry. http://oee.nrcan.gc.ca/industrial/technical- info/benchmarking/apma/APMA_en.pdf
Carbon Trust, The UK Climate Change Programme: potential evolution for business and the public sector, 2005
Carbon Trust (2006): Carbon footprints in the supply chain: The next step for business
Carbon Trust website 2009
Council for an Energy-Efficient Economy (ACEEE), Washington, DC.
Department of Minerals and Energy, 2005, ‘Energy Efficiency Strategy of the Republic of South Africa, March 2005’, DME, Pretoria [available at http://www.dme.gov.za/pdfs/energy/efficiency/ee_strategy_05.pdf].
Department of Energy and Climate Change (DECC), 2000
http://www.decc.gov.uk/en/content/cms/what_we_do/change_energy/tackling_clima/programme/programme_2000/programme_2000.aspx
Galitsky and Worrell, (2003). Energy Efficiency Improvement and Cost Saving Opportunities for the Vehicle Assembly Industry
Howells, M., Laitner, J.A., 2005, Industrial Efficiency as an Economic Development Strategy for South Africa, American
International Energy Agency (IEA)
2008 Worldwide Trends in Energy Use and Efficiency Key Insights from IEA
Indicator Analysis 2008
2007 Tracking Industrial Energy Efficiency and CO2 Emissions
ISO, 2008. press release, http://www.iso.org/iso/pressrelease.htm?refid=Ref1157

46
LBL 2009 http://industrial-energy.lbl.gov/node/160
McKane, A., Price, L., and de la Rue du Can, S., 2007. Policies for Promoting Industrial Energy Efficiency in Developing Countries and Transition Economies. Vienna: United Nations Industrial Development Organization (LBNL- 63134).
Moomaw, W. R., J. R. Moreira, K. Blok, D. Greene, K. Gregory, T. Jaszay, T. Kashiwagi, M. Levine, M. MacFarland, N. S. Prasad, L. Price, H. Rogner, R. Sims, F. Zhou, E. Alsema, H. Audus, R. K. Bose, G. M. Jannuzzi, A. Kollmuss, L. Changsheng, E. Mills, K. Minato, S. Plotkin, A. Shafer, A. C. Walter, R. Ybema, J. de Beer, D. Victor, R. Pichs-Madruga, H. Ishitani. 2001. "Technological and Economic Potential of Greenhouse Gas Emissions Reduction.” Chapter 3 in Climate Change 2001: Mitigation. Intergovernmental Panel on Climate Change, United Nations and World Meteorological Organization, Geneva.
National Cleaner Production Centre Management Report 2005/6, http://www.ncpc.co.za/media/managementreports.html
National Cleaner Production Centre Management Report 2007/8, http://www.ncpc.co.za/media/managementreports.html
National Cleaner Production Centre Newsletter 2006, http://www.ncpc.co.za/media/newsletters.html
NERSA, 2009. Decision – ESKOM price increase application 2009.
Price, L., 2005. “Voluntary Agreements for Energy Efficiency or Greenhouse Gas Emissions Reduction in Industry: An Assessment of Programs Around the World,” Proceedings of the 2005 ACEEE Summer Study on Energy Efficiency in Industry. Washington, DC: American Council for An Energy-Efficient Economy. http://ies.lbl.gov/iespubs/58138.pdf
Price, L. and McKane, A., (2009). Industrial Energy Efficiency and Climate Change Mitigation: Policies and Measures to Realize the Potential in the Industrial Sector, Prepared in
support of the UN


Printed in AustriaV.11-87136—December 2011—300
UNITED NATIONS INDUSTRIAL DEVELOPMENT ORGANIZATIONVienna International Centre, P.O. Box 300, 1400 Vienna, AustriaTelephone: (+43-1) 26026-0, Fax: (+43-1) 26926-69E-mail: [email protected], Internet: www.unido.org