Embed Size (px)
Citation preview

Energy Efficiency Policies, Programs, and Practices in the Midwest:
A Resource Guide for Policymakers
Funded in part by
Energy Efficiency Policies, Programs, and Practices in the Midwest: A Resource Guide for Policymakers2
ABO
UT
The Midwest Energy Efficiency Alliance (MEEA) is a non-profit collaborative, membership organization whose mission is to promote energy efficiency policy and practices through research and analysis and by engaging a cross-section of stake-holders who are interested in energy efficiency. MEEA’s members include state and local governments, utilities, manufacturers, retailers, academic research institutions, and advocates in the 13 Midwestern states. MEEA’s footprint includes Illinois, Indiana, Iowa, Kansas, Kentucky, Michigan, Minnesota, Missouri, Nebraska, North Dakota, Ohio, South Dakota, and Wisconsin.
This report was funded in part by The Joyce Foundation. The Joyce Foundation supports the development of policies that both improve the quality of life for people in the Great Lakes, and serve as models for the rest of the country.
Acknowledgements
Principal Author: Kevin CullatherContributing Authors: Gregory Ehrendreich,
Isaac Elnecave, and Samantha WilliamsResearch and Review: Will Baker, Jessica Collingsworth,
Steve Kismohr, Chelsea Lamar, Stacey Paradis, Jay Wrobel
ABO
UT
© Copyright 2012Midwest Energy Efficiency Alliance20 North Wacker Drive, Suite 1301
Chicago, Illinois 60606www.mwalliance.org
3
INDEXTABLE OF CONTENTS
Preface...................................................................................................................................................................................... 4Executive.Summary..................................................................................................................................................................5-6Introduction..............................................................................................................................................................................7-8. .State.Governments:.Leading.by.Example...............................................................................................................................9-12Table 1: State Lead by Example Policies ....................................................................................................................................9State Energy Office ....................................................................................................................................................................9-10 State Energy Plan ......................................................................................................................................................................10 Reduction of State Energy Consumption ...................................................................................................................................10-12Table 2: Examples of New Government Building Energy Efficiency Requirements .......................................................................11 Recognition Programs ...............................................................................................................................................................12Table 3: State Recognition Programs .........................................................................................................................................12Statewide Energy Efficiency Policies ...................................................................................................................................13-35Integrated Resource Planning ....................................................................................................................................................13Table 4: State Utility Planning Requirements ..............................................................................................................................14Utility Energy Efficiency Policies .................................................................................................................................................14-17Chart: Energy Efficiency is a Bipartisan Issue .............................................................................................................................16Chart: Estimated Annual Investment in Energy Efficiency in the Midwest ....................................................................................17Table 5: Statewide Energy Efficiency Policies in the Midwest ......................................................................................................18 Participation ..............................................................................................................................................................................19Targets ......................................................................................................................................................................................19Table 6: Energy Efficiency Targets and Ramp-Up .......................................................................................................................19Ramp-Up ..................................................................................................................................................................................19Portfolio of Programs .................................................................................................................................................................20Cost Recovery ...........................................................................................................................................................................20-21Table 7: Utility Cost Recovery Mechanisms in the Midwest ........................................................................................................21Lost Revenue Recovery .............................................................................................................................................................21Chart: Lost Revenue Recovery in the MEEA Region ...................................................................................................................22 Table 8: Utility Lost Revenue Recovery Mechanisms in the Midwest ..........................................................................................23Utility Incentives .........................................................................................................................................................................24Table 9: Utility Incentive Mechanisms in the Midwest .................................................................................................................24Penalties ....................................................................................................................................................................................25Stakeholder Participation ...........................................................................................................................................................25-27Table 10: Energy Efficiency Stakeholder Groups in the Midwest .................................................................................................26Third Party Administrator ...........................................................................................................................................................27Measurement and Evaluation of Energy Savings ........................................................................................................................27-28 Cost Effectiveness Tests ............................................................................................................................................................28-30Table 11: Definitions and Discussions of Benefit-Cost Test .........................................................................................................29Table 12: Use of Benefit-Cost Testing ........................................................................................................................................30 Table 13: Summary Table of Benefits and Costs used in Cost-Effectiveness Tests .....................................................................30Net and Gross ...........................................................................................................................................................................31Table 14: Gross or Net Reporting ...............................................................................................................................................31Smart Grid .................................................................................................................................................................................31-34Table 15: Smart Grid Projects & Pilots in the Midwest ................................................................................................................34Efficiency, Customer Choice and Municipal Aggregation ............................................................................................................35Residential and Commercial Efficiency ................................................................................................................................36-43Home Performance Programs ...................................................................................................................................................36Table 16: Home Performance Programs in the Midwest .............................................................................................................37Building Energy Codes ..............................................................................................................................................................38-41Chart: Residential Building Energy Code Adoption in the Midwest .............................................................................................38Chart: Commercial Building Energy Code Adoption in the Midwest ...........................................................................................38 Table 17: Estimated Annual Savings from Statewide Adoption of the 2009 IECC .......................................................................38Table 18: Code Compliance Rates Achieved by Selected States ...............................................................................................40Benchmarking ...........................................................................................................................................................................42Access to Tenant Energy Consumption .....................................................................................................................................42 Disclosing Estimated Energy Costs Up Front .............................................................................................................................43Environmental Health and Indoor Air Quality ..............................................................................................................................43Industrial Efficiency ................................................................................................................................................................44-51Chart: Industrial Energy Efficiency Self-Direct and Opt-Out Policies ............................................................................................45Table 19: Midwest Industrial Opt-Out or Self-Direct Policies .......................................................................................................46A Robust Portfolio of Utility Programs for Industrial Customers ..................................................................................................48-49Combined Heat and Power .......................................................................................................................................................49-50Table 20: Combined Heat and Power in the Midwest .................................................................................................................49Demand Response ....................................................................................................................................................................50-51Table 21: Demand Response Policies in the Midwest ................................................................................................................51Financing .................................................................................................................................................................................52-58Property Assessed Clean Energy (PACE) Financing ...................................................................................................................52Chart: PACE Financing is a Bipartisan Issue ...............................................................................................................................52 Table 22: PACE Financing in the Midwest ..................................................................................................................................53On-Bill Financing .......................................................................................................................................................................54-55Table 23: On-Bill Financing in the Midwest .................................................................................................................................55 Other Energy Efficiency Financing Tools .....................................................................................................................................56Loan Loss Reserve Fund ...........................................................................................................................................................56Revolving Loan Funds ...............................................................................................................................................................56Sector-Focused Financing .........................................................................................................................................................57Table 24: Sample of State-Sponsored Energy Efficiency Financing Policies/Programs ...............................................................57Qualified Energy Conservation Bonds ........................................................................................................................................58Table 25: Midwest Allocation of Qualified Energy Conservation Bonds .......................................................................................58Conclusion ..............................................................................................................................................................................59Appendix 1: City of Philadelphia Benchmarking Ordinance ...............................................................................................60-64Appendix 2: Examples of Midwestern Utility Energy Efficiency Programs for Industrial Customers ........................................65-71Appendix 3: Green Multiple Listing Service .........................................................................................................................72-73Endnotes .................................................................................................................................................................................74-75

Energy Efficiency Policies, Programs, and Practices in the Midwest: A Resource Guide for Policymakers4
PREF
ACE Preface
Since the founding of the Midwest Energy Efficiency Alliance (MEEA) in 2000, state and local policies promoting energy efficiency as well as utility investment in energy efficiency have grown significantly. In 2004, electric and natural gas utilities in the 13 states in MEEA’s region collectively spent $170 million on energy efficiency programs. By 2012, this amount had grown to an estimated $1.2 billion. One of the driving forces behind this growth has been the adoption of statewide energy efficiency policy standards. At the same time, state and local governments have adopted policies aimed at reducing their own energy consumption, providing their residents and businesses with access to information, financing, and strategies for saving energy.
While much has been accomplished across the region with respect to the development of energy efficiency policies and the deployment of cost-effective programs, there is still more that can be done. This energy efficiency resource guide is intended to provide a snapshot of energy efficiency policies and programs across the region as well as to identify the regional examples that could be adopted by policymakers wanting to promote energy efficiency practices in their jurisdiction. In doing so, we have highlighted some of the programs in the region and elsewhere that are successfully promoting energy efficiency at the regional, state and local levels. But, these are by no means the only policies and programs out there.
Not every policy or program identified in this guide is going to be a good fit for every state or locality. Nor is it necessary to adopt every policy that has been addressed. Instead, policymakers should identify those that are a good fit for their state or community and to start with those and, as those policies take hold and their residents and businesses see the benefit, consider adopting additional policies that have been successful elsewhere.
As we are developing this guide, we are simultaneously working to make MEEA’s website (www.mwalliance.org) “the source on energy efficiency” information in the Midwest. We encourage you to visit it for more access and information to policies and programs across the region. In addition, we intend for this to be a “living” document housed on our website, so as policies change or new programs are launched, our website will reflect those developments.
Finally, we need to thank the Joyce Foundation and the MEEA membership for funding this project, as well as numerous individuals at organizations and agencies across the Midwest who have contributed and helped bring it to fruition.
5
EXECUTIVE SUMM
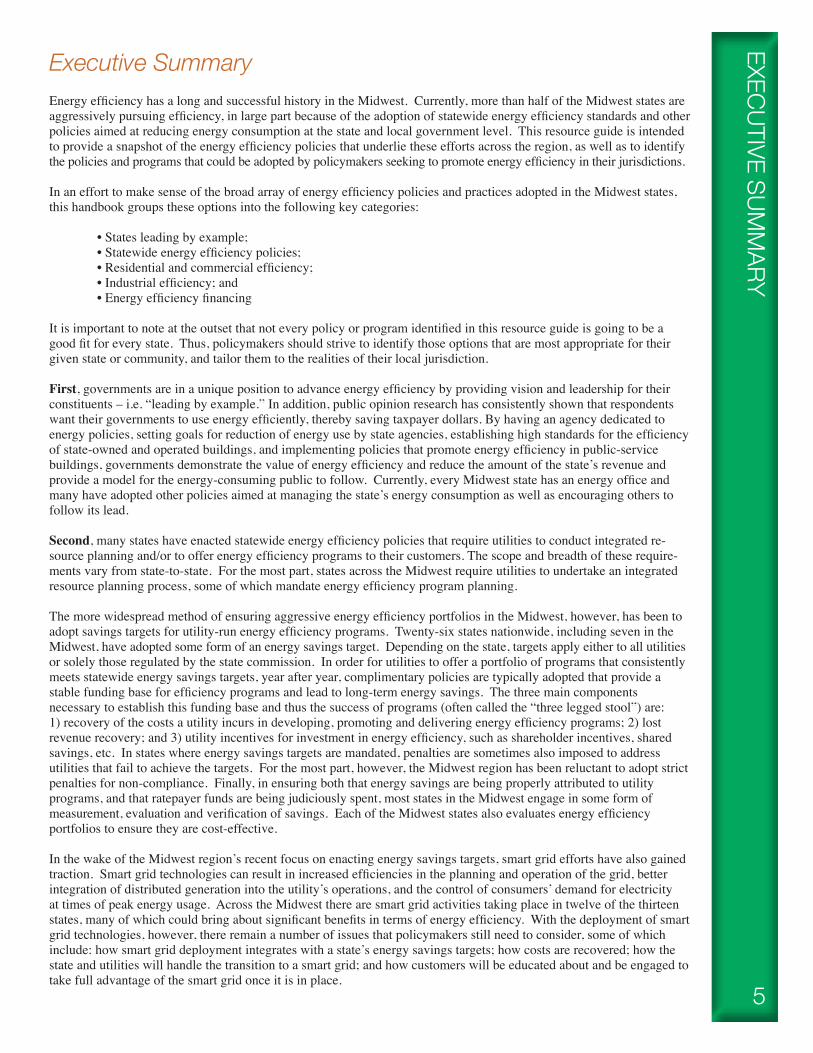
ARYExecutive SummaryEnergy efficiency has a long and successful history in the Midwest. Currently, more than half of the Midwest states are aggressively pursuing efficiency, in large part because of the adoption of statewide energy efficiency standards and other policies aimed at reducing energy consumption at the state and local government level. This resource guide is intended to provide a snapshot of the energy efficiency policies that underlie these efforts across the region, as well as to identify the policies and programs that could be adopted by policymakers seeking to promote energy efficiency in their jurisdictions.
In an effort to make sense of the broad array of energy efficiency policies and practices adopted in the Midwest states, this handbook groups these options into the following key categories:
• States leading by example; • Statewide energy efficiency policies; • Residential and commercial efficiency; • Industrial efficiency; and • Energy efficiency financing
It is important to note at the outset that not every policy or program identified in this resource guide is going to be a good fit for every state. Thus, policymakers should strive to identify those options that are most appropriate for their given state or community, and tailor them to the realities of their local jurisdiction.
First, governments are in a unique position to advance energy efficiency by providing vision and leadership for their constituents – i.e. “leading by example.” In addition, public opinion research has consistently shown that respondents want their governments to use energy efficiently, thereby saving taxpayer dollars. By having an agency dedicated to energy policies, setting goals for reduction of energy use by state agencies, establishing high standards for the efficiency of state-owned and operated buildings, and implementing policies that promote energy efficiency in public-service buildings, governments demonstrate the value of energy efficiency and reduce the amount of the state’s revenue and provide a model for the energy-consuming public to follow. Currently, every Midwest state has an energy office and many have adopted other policies aimed at managing the state’s energy consumption as well as encouraging others to follow its lead.
Second, many states have enacted statewide energy efficiency policies that require utilities to conduct integrated re-source planning and/or to offer energy efficiency programs to their customers. The scope and breadth of these require-ments vary from state-to-state. For the most part, states across the Midwest require utilities to undertake an integrated resource planning process, some of which mandate energy efficiency program planning.
The more widespread method of ensuring aggressive energy efficiency portfolios in the Midwest, however, has been to adopt savings targets for utility-run energy efficiency programs. Twenty-six states nationwide, including seven in the Midwest, have adopted some form of an energy savings target. Depending on the state, targets apply either to all utilities or solely those regulated by the state commission. In order for utilities to offer a portfolio of programs that consistently meets statewide energy savings targets, year after year, complimentary policies are typically adopted that provide a stable funding base for efficiency programs and lead to long-term energy savings. The three main components necessary to establish this funding base and thus the success of programs (often called the “three legged stool”) are: 1) recovery of the costs a utility incurs in developing, promoting and delivering energy efficiency programs; 2) lost revenue recovery; and 3) utility incentives for investment in energy efficiency, such as shareholder incentives, shared savings, etc. In states where energy savings targets are mandated, penalties are sometimes also imposed to address utilities that fail to achieve the targets. For the most part, however, the Midwest region has been reluctant to adopt strict penalties for non-compliance. Finally, in ensuring both that energy savings are being properly attributed to utility programs, and that ratepayer funds are being judiciously spent, most states in the Midwest engage in some form of measurement, evaluation and verification of savings. Each of the Midwest states also evaluates energy efficiency portfolios to ensure they are cost-effective.
In the wake of the Midwest region’s recent focus on enacting energy savings targets, smart grid efforts have also gained traction. Smart grid technologies can result in increased efficiencies in the planning and operation of the grid, better integration of distributed generation into the utility’s operations, and the control of consumers’ demand for electricity at times of peak energy usage. Across the Midwest there are smart grid activities taking place in twelve of the thirteen states, many of which could bring about significant benefits in terms of energy efficiency. With the deployment of smart grid technologies, however, there remain a number of issues that policymakers still need to consider, some of which include: how smart grid deployment integrates with a state’s energy savings targets; how costs are recovered; how the state and utilities will handle the transition to a smart grid; and how customers will be educated about and be engaged to take full advantage of the smart grid once it is in place.

Energy Efficiency Policies, Programs, and Practices in the Midwest: A Resource Guide for Policymakers6
EXEC
UTIV
E SU
MM
ARY Third, the backbone of many utility energy efficiency portfolios in the Midwest is residential and commercial
efficiency. In the residential sector, Home Performance with ENERGY STAR® (HPwES) is a national model run by the U.S. DOE and sponsored locally by state agencies, utilities, and non-profits that connect homeowners with qualified contractors and energy auditors who assess each home’s “performance” and recommend renovations resulting in energy savings and improved home comfort. HPwES has been successfully adopted in eight Midwest states, including Illinois, Iowa, Kentucky, Michigan, Minnesota, Missouri, Ohio, and Wisconsin.
Building energy codes – both for residential and commercial structures – are also best practices for generating significant, perpetual energy savings through efficiency upgrades. Because they are so effective at reducing energy usage year after year, building energy code adoption has accelerated across the Midwest. Nine Midwest states have adopted, or are about to adopt, either the 2009 or the latest 2012 code for either residential or commercial construction. Energy codes are recognized as a simple and cost-effective means to reduce energy consumption, lower energy bills, make housing more affordable, reduce air pollution and improve air quality.
Fourth, given that the Midwest is home to much of the nation’s manufacturing and industrial capacity, there is significant potential for energy savings through sound policies and programs focusing on industrial energy efficiency. In 2009, industrial energy consumption in the Midwest reached nearly 28% of the total U.S. industrial energy consumption. At the same time, industry in the Midwest is facing mounting economic pressures, including competition in both national and international markets, increased costs of labor, raw materials and marketing, as well as rising environmental compliance costs. The capacity for energy efficiency to mitigate these pressures, however, cannot be understated. The deployment of energy efficiency is an indispensable component of any effort to improve industrial productivity, as well as to maintain competitiveness and cut costs.
Despite the potential magnitude of energy savings that could be realized from this sector via efficiency, there is a wide breadth of approaches to funding industrial energy efficiency programs across the Midwest, with varying degrees of structure. Seven Midwestern states have adopted some form of “opt-out” or “self direct” policies permitting industrial energy consumers to opt-out of paying all or a portion of the costs recoverable by the utilities to run industrial efficiency programs. To ensure that all industrial customers are making progress toward using energy more efficiently, it is important that policymakers develop policies for opt-out and self-direct provisions just as they have for other ratepayer funded energy efficiency programs, which include a focus on: energy savings; evaluation, measurement and verification of these savings; verification of the self-direct customers’ expenditure of funds on energy efficiency measures; and attribution of energy savings to ensure that utilities are able to claim credit for the energy savings achieved by its industrial customers through their self-direct programs.
Even in states where opt-out or self-direct programs exist, robust industrial energy efficiency portfolios offer great potential for energy savings that is currently unmet. As policymakers and utilities establish and build the program offerings in their states and service territories, they cannot afford to overlook this potential. If a utility is expected to meet an energy savings target, then it will need to achieve some savings from its industrial customers just as it will need to realize savings from its residential and commercial customers. To do so, policymakers should ensure that states and utilities develop robust portfolios of prescriptive and custom programs targeted at industrial customers.
Fifth and finally, an overarching barrier to sustained and successful energy efficiency policy and programs confronting all classes of customers is the availability of energy efficiency financing. Investments in energy efficiency require the end-user to spend money up front on improvements with the promise that the consumer will use less energy and thereby save money. But, these up front investments are often significant, and traditional lending programs with high interest rates may make the investment uneconomic. Additionally, the amount individual projects save hinges at least partially on occupant behavior. This has hindered the ability to aggregate loans to sell on the secondary market, rendering the private capital market either unable or unwilling to finance energy efficiency improvements on a large scale. A number of financing tools have been developed in the Midwest to overcome these barriers, including Property Assessed Clean Energy (PACE) initiatives and on-bill financing. Currently, authorizing legislation or other authority for PACE financing has been enacted in six Midwest states. On-bill financing programs are also being used or in pilot phase in eight Midwest states, which allow customers to finance energy efficiency improvements and to repay the cost of the improvements plus interest through monthly energy savings. Other financing tools – such as loan loss reserve funds and revolving funds – are being used to fund efficiency improvements at low interest rates.
As is apparent, the Midwest has made great strides in adopting policies and launching programs that promote energy efficiency by state and local governments, as well as electric and natural gas utilities and their residential, commercial, and industrial customers. We intend for this resource guide to be a “living” document housed on our website, so as policies change or new programs are launched, our website will reflect those developments. We encourage you to visit MEEA’s website (www.mwalliance.org/policy) for more access and information to policies and programs across the region.

7
INTRODUCTIO
NIntroductionWhile energy efficiency is often considered the “Fifth Fuel”, efficiency can be a far less expensive alternative to natural gas or electricity and generates savings for the customer into the future. The know-how behind energy efficiency is based in American ingenuity and technologies that, in many cases, are being developed in American laboratories and factories, and they’re being installed by an American workforce. In addition, energy efficiency technologies have many consumer and state benefits, including reducing peak electricity or natural gas demand, reducing the risks of brown outs, avoiding or deferring the need for costly transmission and distribution expansion or power plant building, as well as saving customers money and leading to better utilization of our energy infrastructure. While energy efficiency will never replace the need for traditional energy sources, efficiency should be seen as more than just the ‘Fifth Fuel’ and should be considered as the “First Fuel” when making energy supply decisions.
Energy efficiency has a long and successful history in the Midwest. For example, Iowa and Minnesota have had energy efficiency policies in place, and have been running programs, for more than 20 years. Currently, more than half of states in the Midwest are aggressively pursuing efficiency and are mandating utilities to provide efficiency, and more importantly, to be held accountable for the success in promoting efficiency. In 2012 more than $1.2 billion in ratepayer dollars will be invested in energy efficiency, by 2015 that investment will increase to more than $1.67 billion.
Policymakers at the national, state, and local levels of government have recognized the importance of implementing sound and cost effective energy efficiency policies. They understand that saving energy brings about economic, societal, and environmental benefits that go beyond simply saving a kilowatt of electricity or a therm of natural gas. Energy efficiency programs can:
• Reduce customer energy use to better manage peak load • Avoid or delay the construction of expensive power plants • Help alleviate transmission and distribution issues, thus increasing reliability of the grid • Reduce the introduction of regulated air pollutants and greenhouse gases into the environment • Create better-informed, more aware and empowered consumers • Improve air quality and comfort in homes and businesses • Provide for the more efficient utilization of energy and the energy infrastructure and reduce waste • Help to revitalize the economy by investing in manufacturing of energy efficient products and energy efficiency services

Energy Efficiency Policies, Programs, and Practices in the Midwest: A Resource Guide for Policymakers8
INTR
ODU
CTIO
N The policies adopted by governors, state legislatures, and utility commissions and the programs implemented by utilities, government agencies, and nongovernmental organizations include a broad array of policies and programs including, the following:
• State and local governments initiatives to save energy and taxpayer dollars through energy efficiency improvements in their own operations • Ratepayer-financed energy efficiency policy goals • Policies and programs directed towards residential, commercial and industrial customers • Energy efficiency financing • Building Energy Codes for new construction • Federally funded actions, including home retrofit and industrial programming • Smart grid policies and pilot programs • Demand Response
In this resource guide, we will identify many of the policies and programs in place throughout the Midwest, and seek to identify the best practices so that others may replicate them in their states and communities. In addition to this report, MEEA is developing a more comprehensive web-based resource that will provide access to statutes, regulatory decisions, programs, and other energy efficiency resources throughout the Midwest.

9
STATE GO
VERNMENTS: LEADING
BY EXAMPLE
State Governments: Leading by ExampleBeyond simply enacting legislation and regulations to advance energy efficiency within the state’s residential, commercial, and industrial sectors, state (as well as county and municipal) governments can also provide vision and leadership for their constituents. According to a recent report by The Associated Press-NORC Center for Public Affairs Research, more than 80 percent of respondents feel that state and local governments play a significant role in increasing energy savings in the United States1. By having an agency dedicated to energy policies, setting goals for reduction of energy use by state agencies, establishing high standards for the efficiency of state-owned and operated buildings, and implementing policies that promote energy efficiency in public-service buildings, government demonstrate the value of energy efficiency and reduce the amount of the state’s revenue that is spent on energy purchases. As Table 1 illustrates, every Midwestern State has a state energy office and many have adopted other policies aimed at managing the state’s energy consumption as well as encouraging others to follow its lead.
State Energy OfficeHaving a state agency or office dedicated to energy, beyond the regulatory affairs addressed by the public service com-mission or the environmental affairs, provides an important function for the state, including the following:
• Developing state energy plans • Reaching out to local governments • Showing state commitment to energy and energy efficiency • Promoting energy efficiency in both the public and private sectors, • Providing technical expertise to residents, businesses, and other government agencies • Operating efficiency and weatherization programs for residents, • Providing access to capital through funding mechanisms, • Managing and redistributing federal funds, and • Being a repository of data on energy production, consumption, and efficiency savings.
In addition to these roles, many energy offices play a role in promoting energy businesses within the state, including, the extraction of fossil fuels, the development of renewable energy resources, and growth of energy markets. In the Midwest, every state has an energy office of some form. Where the agency is housed within the state government varies, including being an independent agency or an office with the public service commission, the department of natural resources, or the economic development agency. While the mission of the energy office could become lost within a
Table 1: State Lead By Example Policies State
State
Energy Office
State Energy Plan or Vision
State Agency Energy
Reduction Requirement
EE in New
State Buildings
Recognition
or Award Program
Illinois ✓ ✓ ✓ ✓ ✓ Indiana ✓ ✓ ✓ ✓ ✓ Iowa ✓ <> ✓ ✓ Kansas ✓ <> ✓ Kentucky ✓ ✓ ✓ ✓ Michigan ✓ ✓ ✓ ✓ ✓ Minnesota ✓ ✓ ✓ ✓ Missouri ✓ ✻ ✓ ✓ Nebraska ✓ ✓ North Dakota ✓ ✓ Ohio ✓ ✓ ✓ ≠ South Dakota ✓ ✓ ✓ Wisconsin ✓ <> ✓ ✓ ≠
<>indicates an old or out-dated plan was identified. * Missouri does not have an energy plan. HB 734 (2009) created the Joint Committee on Missouri’s Energy Future, which was to report to the General Assembly by December 31, 2009, “on Missouri’s energy needs to determine a strategy to ensure a plentiful, affordable, and clean supply of electricity to meet the needs of Missouri residents and businesses for the next 25 years and that they continue to benefit from low rates.” Under the legislation, the Joint Committee dissolved on December 31, 2009. ≠ Ohio and Wisconsin used to award the Governor’s Award for Excellence in Energy Efficiency, but no longer do.
Energy Efficiency Policies, Programs, and Practices in the Midwest: A Resource Guide for Policymakers10
STAT
E G
OVE
RNM
ENTS
: LEA
DING
BY
EXAM
PLE State Energy Office, con’t
larger department or be seen being in conflict with the public service commission, the organization location of the fund-ed agency is less important than whether the agency is robust, is mission-driven, and provides the necessary resources to the citizens, businesses, and other governmental agencies that are its customers.
State Energy PlanEnergy development, resources, and consumption need to be planned for not just by utilities and the state regulatory commission but by the state. Energy plans look at the collective energy markets within the state and identify strategies to ensure that residents and businesses have access to reliable energy supply at reasonable and affordable rates. In doing so, energy plans will often examine energy forecasts and identify strategies for meeting future energy needs, including strategies for reducing the state’s dependence on imported foreign fossil fuels, promoting the development of in-state renewable resources, adopting energy saving strategies for state agencies, and promoting energy efficiency and conservation by citizens and businesses. As Table 1 indicates, nearly every state in the Midwest has an energy plan, although many may be in need of updating.
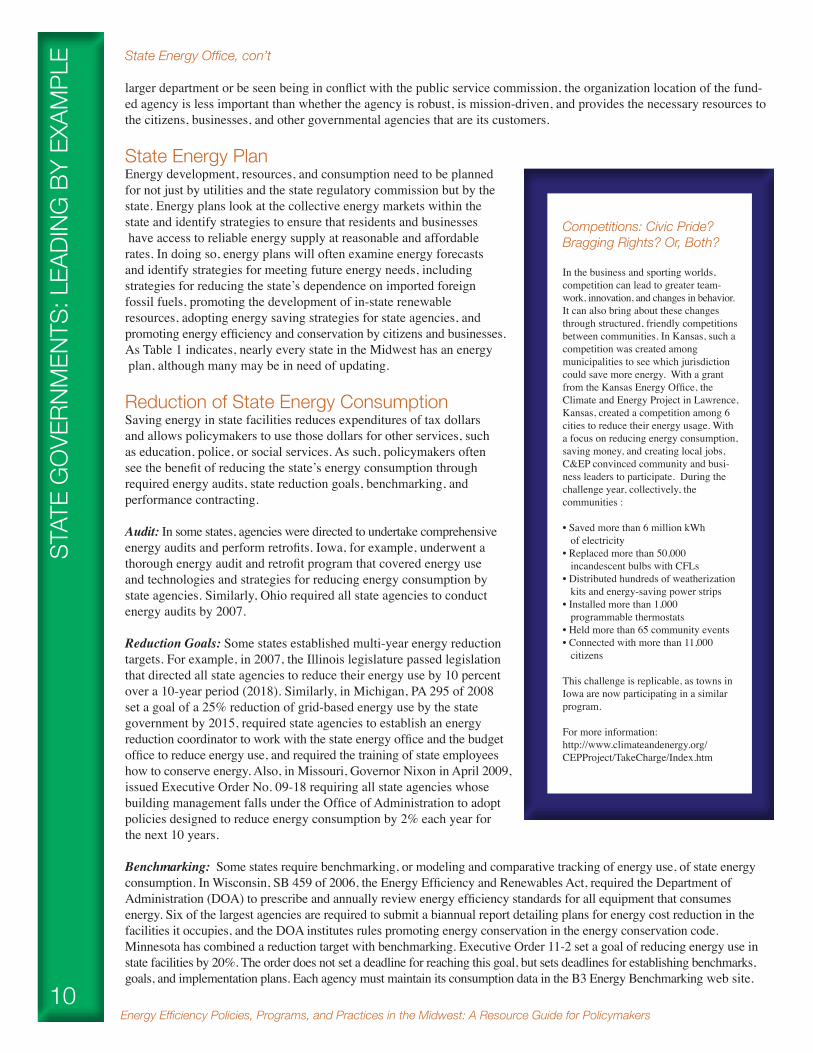
Reduction of State Energy ConsumptionSaving energy in state facilities reduces expenditures of tax dollars and allows policymakers to use those dollars for other services, such as education, police, or social services. As such, policymakers often see the benefit of reducing the state’s energy consumption through required energy audits, state reduction goals, benchmarking, and performance contracting.
Audit: In some states, agencies were directed to undertake comprehensive energy audits and perform retrofits. Iowa, for example, underwent a thorough energy audit and retrofit program that covered energy use and technologies and strategies for reducing energy consumption by state agencies. Similarly, Ohio required all state agencies to conduct energy audits by 2007.
Reduction Goals: Some states established multi-year energy reduction targets. For example, in 2007, the Illinois legislature passed legislation that directed all state agencies to reduce their energy use by 10 percent over a 10-year period (2018). Similarly, in Michigan, PA 295 of 2008 set a goal of a 25% reduction of grid-based energy use by the state government by 2015, required state agencies to establish an energy reduction coordinator to work with the state energy office and the budget office to reduce energy use, and required the training of state employees how to conserve energy. Also, in Missouri, Governor Nixon in April 2009, issued Executive Order No. 09-18 requiring all state agencies whose building management falls under the Office of Administration to adopt policies designed to reduce energy consumption by 2% each year for the next 10 years.
Benchmarking: Some states require benchmarking, or modeling and comparative tracking of energy use, of state energy consumption. In Wisconsin, SB 459 of 2006, the Energy Efficiency and Renewables Act, required the Department of Administration (DOA) to prescribe and annually review energy efficiency standards for all equipment that consumes energy. Six of the largest agencies are required to submit a biannual report detailing plans for energy cost reduction in the facilities it occupies, and the DOA institutes rules promoting energy conservation in the energy conservation code. Minnesota has combined a reduction target with benchmarking. Executive Order 11-2 set a goal of reducing energy use in state facilities by 20%. The order does not set a deadline for reaching this goal, but sets deadlines for establishing benchmarks, goals, and implementation plans. Each agency must maintain its consumption data in the B3 Energy Benchmarking web site.
Competitions: Civic Pride? Bragging Rights? Or, Both?
In the business and sporting worlds, competition can lead to greater team-work, innovation, and changes in behavior. It can also bring about these changes through structured, friendly competitions between communities. In Kansas, such a competition was created among municipalities to see which jurisdiction could save more energy. With a grant from the Kansas Energy Office, the Climate and Energy Project in Lawrence, Kansas, created a competition among 6 cities to reduce their energy usage. With a focus on reducing energy consumption, saving money, and creating local jobs, C&EP convinced community and busi-ness leaders to participate. During the challenge year, collectively, the communities :
• Saved more than 6 million kWh of electricity • Replaced more than 50,000 incandescent bulbs with CFLs• Distributed hundreds of weatherization kits and energy-saving power strips• Installed more than 1,000 programmable thermostats• Held more than 65 community events • Connected with more than 11,000 citizens
This challenge is replicable, as towns in Iowa are now participating in a similar program.
For more information: http://www.climateandenergy.org/CEPProject/TakeCharge/Index.htm

11
STATE GO
VERNMENTS: LEADING
BY EXAMPLE
Reduction of State Energy Consumption, con’t
Performance Contracting: Just like private-sector organizations, government agencies are examining the use of performance contracting to reduce their energy consumption and energy bills. Under performance contracting, a third party conducts the energy assessment and then finances and implements the improvements, and shares with the building owner – in this case, the state agency – the financial savings over the course of the contract. Wisconsin required state agency to consider performance contracting as a means of reducing energy consumption and bills.
Energy Efficiency in New State Buildings: Along with reducing energy consumption and saving taxpayer dollars in existing government buildings, state policymakers often see multiple benefits from requiring that new state buildings be built with energy efficiency in mind. As Table 2 illustrates, a number of Midwestern states have adopted energy ef-ficiency standards or requirements for new government buildings or buildings leased by state agencies. Such policies, not only help save taxpayer dollars, they also help the commercial building industry learn how to construct buildings to these higher efficiency standards.
In addition, to these programs, a number of governmental entities have chosen to participate in the U.S. Department of Energy’s Better Building Challenge. Entities participating in the Challenge promise to (1) conduct an energy efficiency assessment, (2) implement a plan to achieve energy efficiency savings, and (3) report energy savings results. As of June 2012, 10 Midwestern public entities have voluntarily decided to participate in the Challenge:
• City of Chicago, IL • City of Cleveland, OH • City of Columbia, MO • City of Omaha, NE • City of Toledo, OH • Will County, IL • State of Minnesota • Fort Atkinson School District (WI) • Kentucky Community and Technical College System • Michigan State University
These government and public education entities account for 90,760,000 square feet of office space.
Table 2: Examples of New Government Building Energy Efficiency Requirements State Authority New Government Building Requirements
Illinois The Green Buildings Act (July 2009)
Illinois requires that all new state-funded construction or major renovations are required to seek LEED, Green Globes, or equivalent certification
Indiana Executive Order 08-14 Efficiency can be demonstrated through adherence to any of the following standards: a rating of Silver on the USGBC LEED rating system; a two-globe rating on the Green Building Institute Green Globe rating system; an EPA Energy Star building rating, and an equivalent rating under a system accredited under the American National Standards Institute.
Kentucky HB 2 of 2008 All construction or renovation of public buildings for which 50 % or more of the total capital cost is paid by the state must be renovated or designed to meet high-performance building standards. This legislation also requires that all building leases for the state or any of its agencies meet ENERGY STAR high-performance building standards after July 1, 2018. Public buildings must purchase ENERGY STAR qualified products if life-cycle cost analysis determines they are cost-effective.
Minnesota Minn. Stat 16B 325 In 2001, Minnesota required the Departments of Administration and Commerce to develop Sustainable Building Design Guidelines, for new state buildings.
Missouri S.B. 1181 In 2008, the state updated its energy code for state construction and renovations of buildings larger than 5,000 square feet. Under the new policy, the Missouri Department of Natural Resources (DNR) was required to establish energy efficiency standards for state buildings at least as stringent as the 2006 International Energy Conservation Code (IECC) by January 1, 2009. The standards apply equally to both state-leased and state-owned buildings for which the building design process or the lease begins after July 1, 2009.
Ohio In 1995, Ohio passed legislation requiring all state agencies to perform life-cycle cost analysis prior to the construction of new buildings, and energy consumption analyses prior to new leases.
South Dakota SD Codified Laws 5-14-32.
The law applies to all new construction projects and renovations by state agencies, and mandates the use of high-performance building standards in new state construction and renovations. It requires that new or renovated state buildings achieve the U.S. Green Building Council’s LEED Silver rating, a two-globe rating under the Green Building Initiative’s (GBI) Green Globe rating system, or a comparable numeric rating.
Wisconsin Executive Order No. 145 (2006)
The Department of Administration is to set energy efficiency goals for state facilities, office buildings, complexes, and campuses. New state facilities are required to be 30% more efficient than the commercial code.
Energy Efficiency Policies, Programs, and Practices in the Midwest: A Resource Guide for Policymakers12
STAT
E G
OVE
RNM
ENTS
: LEA
DING
BY
EXAM
PLE Recognition Programs
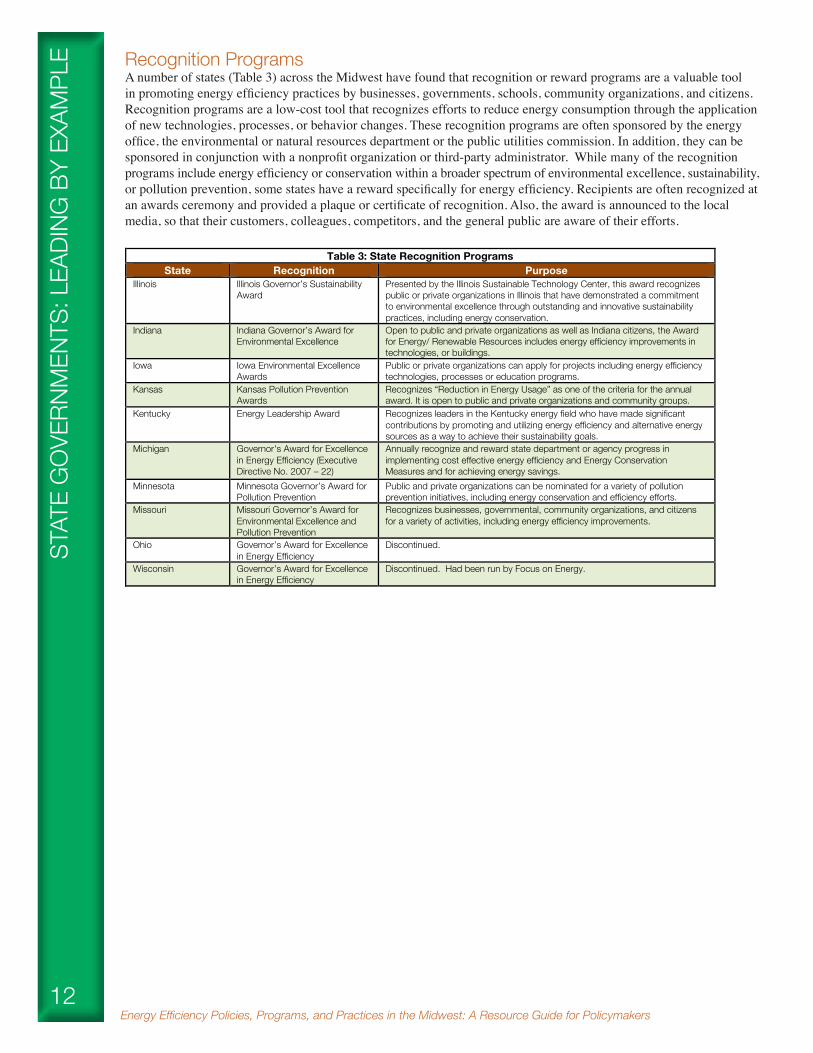
A number of states (Table 3) across the Midwest have found that recognition or reward programs are a valuable tool in promoting energy efficiency practices by businesses, governments, schools, community organizations, and citizens. Recognition programs are a low-cost tool that recognizes efforts to reduce energy consumption through the application of new technologies, processes, or behavior changes. These recognition programs are often sponsored by the energy office, the environmental or natural resources department or the public utilities commission. In addition, they can be sponsored in conjunction with a nonprofit organization or third-party administrator. While many of the recognition programs include energy efficiency or conservation within a broader spectrum of environmental excellence, sustainability, or pollution prevention, some states have a reward specifically for energy efficiency. Recipients are often recognized at an awards ceremony and provided a plaque or certificate of recognition. Also, the award is announced to the local media, so that their customers, colleagues, competitors, and the general public are aware of their efforts.
Table 3: State Recognition Programs State Recognition Purpose
Illinois Illinois Governor’s Sustainability Award
Presented by the Illinois Sustainable Technology Center, this award recognizes public or private organizations in Illinois that have demonstrated a commitment to environmental excellence through outstanding and innovative sustainability practices, including energy conservation.
Indiana Indiana Governor’s Award for Environmental Excellence
Open to public and private organizations as well as Indiana citizens, the Award for Energy/ Renewable Resources includes energy efficiency improvements in technologies, or buildings.
Iowa Iowa Environmental Excellence Awards
Public or private organizations can apply for projects including energy efficiency technologies, processes or education programs.
Kansas Kansas Pollution Prevention Awards
Recognizes “Reduction in Energy Usage” as one of the criteria for the annual award. It is open to public and private organizations and community groups.
Kentucky Energy Leadership Award Recognizes leaders in the Kentucky energy field who have made significant contributions by promoting and utilizing energy efficiency and alternative energy sources as a way to achieve their sustainability goals.
Michigan Governor's Award for Excellence in Energy Efficiency (Executive Directive No. 2007 – 22)
Annually recognize and reward state department or agency progress in implementing cost effective energy efficiency and Energy Conservation Measures and for achieving energy savings.
Minnesota Minnesota Governor’s Award for Pollution Prevention
Public and private organizations can be nominated for a variety of pollution prevention initiatives, including energy conservation and efficiency efforts.
Missouri Missouri Governor’s Award for Environmental Excellence and Pollution Prevention
Recognizes businesses, governmental, community organizations, and citizens for a variety of activities, including energy efficiency improvements.
Ohio Governor’s Award for Excellence in Energy Efficiency
Discontinued.
Wisconsin Governor’s Award for Excellence in Energy Efficiency
Discontinued. Had been run by Focus on Energy.
13
Statewide Energy Efficiency PoliciesIn addition to the efforts of the state facilities themselves, many states have enacted policies that require utilities to conduct integrated resource planning and/or to offer energy efficiency programs to their customers. The scope and breadth of these requirements vary from state-to-state. In addition, some states require both, while others require one or the other, and one requires neither.
Integrated Resource PlanningIn response to volatility in the fuels markets and concerns over generating capacity, policymakers in many states began requiring utilities to undertake Integrated Resource Planning (IRP) in the 1980s. In doing so, utilities were directed to examine both their energy demand and their energy supply, and identify any risks that could prevent them from meeting their customers’ long-term energy needs at reasonable costs. IRP was defined in the Energy Policy Act of 1992 as:
The term `integrated resource planning’ means, in the case of an electric utility, a planning and selection process for new energy resources that evaluates the full range of alternatives, including new generating capacity, power purchases, energy conservation and efficiency, cogeneration and district heating and cooling applications, and renewable energy resources, in order to provide adequate and reliable service to its electric customers at the lowest system cost. The process shall take into account necessary features for system operation, such as diversity, reliability, dispatchability, and other factors of risk; shall take into account the ability to verify energy savings achieved through energy conservation and efficiency and the projected durability of such savings measured over time; and shall treat demand and supply resources on a consistent and integrated basis.
In developing its IRP, a utility looks at a broad spectrum of issues that it will be facing in both the near-term and long-term. Typically, an IRP requires the utility to conduct load forecasting as well as demand-side, supply-side, and integration, and risk analyses. Such items could include
• National and state policies affecting electric generation, transmission and distribution • System demand • System growth (more households or businesses) • Generation resources (base-load, peaking, renewable) • Reliability of its generation, transmission and distribution systems • Energy efficiency policies and programs • Strategies to minimize costs for the customers • The environmental impacts of electricity supply and use • Strategies to enhance energy security • Local economic benefits
For the most part, states across the Midwest require utilities to undertake an integrated resource planning process or similar planning process (Table 4). Among the 13 states in the Midwest, 8 require traditional integrated resource planning, and 4 require a planning process or processes that are non-traditional but which incorporate energy efficiency within the process4. These planning vary in some very significant ways, including who must file, how often the plan must be filed, the planning range, what is to be included, and how detailed the plans are. Integrated resource planning requirements are found in both states with an Energy Efficiency Portfolio Standard (EEPS) and without.
(see next page for Table 4)
STATEWIDE ENERG
Y EFFICIENCY POLICIES

Energy Efficiency Policies, Programs, and Practices in the Midwest: A Resource Guide for Policymakers14
Integrated Resource Planning, con’t
While Illinois utilities are not required to conduct integrated resource planning, they are required to incorporate energy efficiency into their procurement plans. Each Illinois utility procuring power must provide the Illinois Power Agency (IPA) with an annual assessment of cost-effective energy efficiency programs or measures that could be included in the procurement plan, which must include an energy efficiency potential study for the utility’s service territory. Under the Public Utilities Act,7 beginning in 2012, procurement plans are to include an analysis of the impact of building energy codes or appliance standards, as well as an assessment of opportunities to expand energy efficiency programs that have been offered under plans or to implement additional cost-effective energy efficiency programs.
The IPA must include in the prepared procurement plan energy efficiency programs and measures it determines are cost-effective and the associated annual energy savings goals. The Commission will approve the energy efficiency programs and measures included in the procurement plan, including the annual energy savings goal, if they determine it fully captures the potential for all achievable cost-effective energy savings.
Utility Energy Efficiency PoliciesEnergy efficiency policies have been adopted in a majority of the states and in every region of the nation. As the map on page 16 illustrates, Republican and Democratic governors and legislators in 26 states have recognized the impor-tance of energy efficiency and adopted statewide policies to encourage or require utility-focused energy efficiency savings. These policies established the framework for specific spending or energy savings targets for ratepayer-funded energy efficiency programs. In addition, policymakers in other states have adopted policies that encourage efficiency to be incorporated though the utilities’ respective planning processes or simply provided the mechanism for the state’s util-ity regulatory commission to address efficiency programs on a utility-by-utility or case-by-case basis.
STAT
EWID
E EN
ERG
Y EF
FICI
ENCY
PO
LICI
ES
!" # $%&'()#$**+,+&%,)#-./+,+&01#-'.('2301#2%4## -'2,5+,&0#+%#56+48&05#
#
!!
Table 4: State Utility Planning Requirements
State
Authorization Planning Horizon
Frequency
Requirements
I l l inois 220 ILCS 5/16-111.5B 5 years Annually Effectively an IRP. IOUs have to have energy efficiency factored into their procurement plans (which also include forecasts) that are submitted to the Illinois Power Agency. (see discussion below)
Indiana 170 IAC 4-7-1 through 4-7-9
20 years Every 2 years Provides detailed guidelines for Integrated Resource Planning by an Electric Utility. Addresses efficiency improvements.
Iowa Iowa Code 476.6(17) Iowa Code 476.6(16)
20 year 5 years Effectively an IRP. Energy Efficiency Plans, including required forecasts, to be submitted.
Kentucky 807 KAR 5:058 15 years Provides detailed guidelines for the IRP including identification of demand-side management programs.
Michigan MCL 460.6s The commission shall establish standards for an integrated resource plan that shall be filed by an electric utility requesting a certificate of necessity under this section. Addresses efficiency and DSM.
Minnesota Minn Stat. 216B,2422 15 years Every 2 years The resource plan is set of resource options, including conservation, that a utility could use to meet the service needs of its customers over a forecast period.
Missouri Electric (4 CSR 240.22 Gas 4 CSR 240.40
20 years Every 3 years Provides detailed guidelines for Integrated Resource Planning by an Electric Utility. Encourages efficiency measures by utilities.
Nebraska Nebraska Code Section 66-1060
20 years Every 5 years Directs public utilities in Nebraska to practice integrated resource planning and include least cost options when evaluating alternatives for providing energy supply and managing energy demand in Nebraska.
North Dakota Settlement Agreement in Case No. PU-07-776
20 years Every 2 years Under regulatory decisions and settlement agreements, utilities are required to submit resource plans5.
Ohio Ohio PUC Rules 4901:5-5 Effectively an IRP. Long term forecast includes a resource plan, including efficiency and DSM programs.
Wisconsin Act 141. Wisconsin Stat. 196.974 (3) (b) Wis. Stat. § 196.491
4 years 2 years
7 years
PSC undertakes quadrennial planning requirement for energy efficiency and renewables Strategic Energy Assessment ”that evaluates the adequacy and reliability of Wisconsin‘s current and future electrical capacity and supply”
6.
#!!!!!!!!!!!!!!!
15
STATEWIDE ENERG
Y EFFICIENCY POLICIES
Utility Energy Efficiency Policies, con’t
Successful electric and natural gas energy efficiency programs require stable, multi-year funding. In addition, there are significant benefits to be realized for having programs offered to customers of both natural gas and electric utilities as well as across a state rather than on a utility-by-utility basis. This is particularly true if utilities are encouraged or required to work collaboratively and offer similar or complementary portfolios of energy efficiency programs as their neighboring utility or if there is a third-party administrator operating core programs across the state.
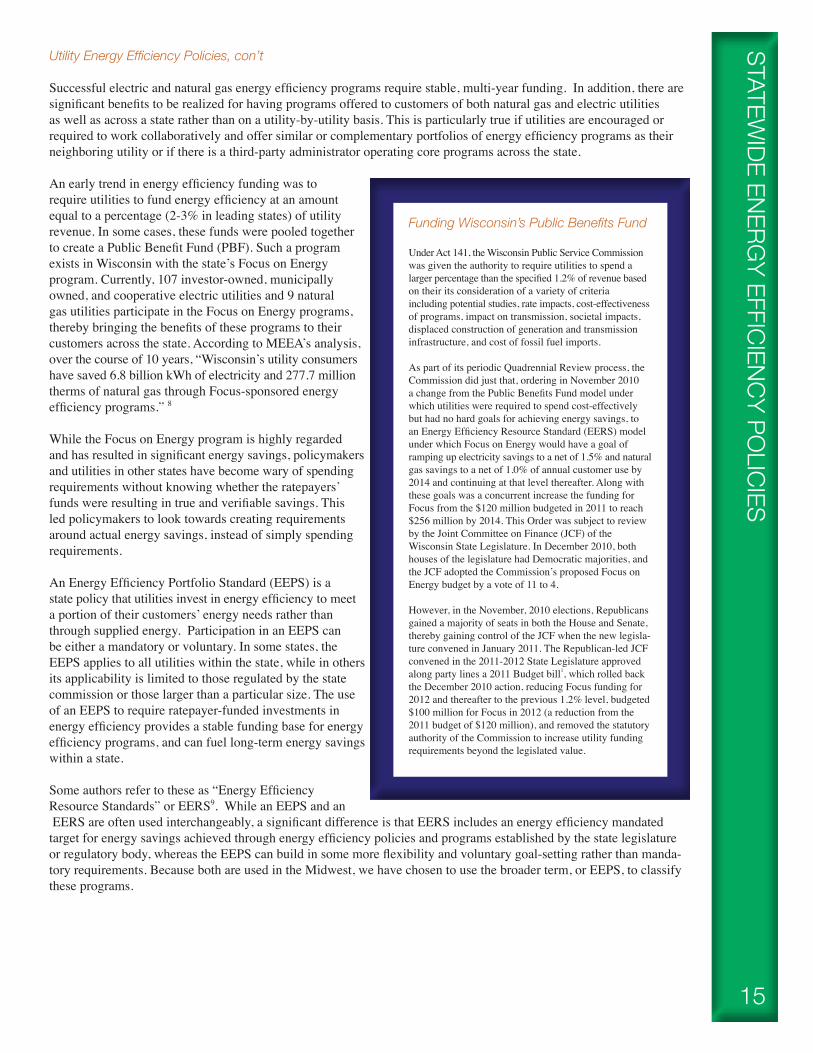
An early trend in energy efficiency funding was to require utilities to fund energy efficiency at an amount equal to a percentage (2-3% in leading states) of utility revenue. In some cases, these funds were pooled together to create a Public Benefit Fund (PBF). Such a program exists in Wisconsin with the state’s Focus on Energy program. Currently, 107 investor-owned, municipally owned, and cooperative electric utilities and 9 natural gas utilities participate in the Focus on Energy programs, thereby bringing the benefits of these programs to their customers across the state. According to MEEA’s analysis, over the course of 10 years, “Wisconsin’s utility consumers have saved 6.8 billion kWh of electricity and 277.7 million therms of natural gas through Focus-sponsored energy efficiency programs.” 8
While the Focus on Energy program is highly regarded and has resulted in significant energy savings, policymakers and utilities in other states have become wary of spending requirements without knowing whether the ratepayers’ funds were resulting in true and verifiable savings. This led policymakers to look towards creating requirements around actual energy savings, instead of simply spending requirements.
An Energy Efficiency Portfolio Standard (EEPS) is a state policy that utilities invest in energy efficiency to meet a portion of their customers’ energy needs rather than through supplied energy. Participation in an EEPS can be either a mandatory or voluntary. In some states, the EEPS applies to all utilities within the state, while in othersits applicability is limited to those regulated by the state commission or those larger than a particular size. The use of an EEPS to require ratepayer-funded investments in energy efficiency provides a stable funding base for energy efficiency programs, and can fuel long-term energy savings within a state. Some authors refer to these as “Energy Efficiency Resource Standards” or EERS9. While an EEPS and an EERS are often used interchangeably, a significant difference is that EERS includes an energy efficiency mandated target for energy savings achieved through energy efficiency policies and programs established by the state legislature or regulatory body, whereas the EEPS can build in some more flexibility and voluntary goal-setting rather than manda-tory requirements. Because both are used in the Midwest, we have chosen to use the broader term, or EEPS, to classify these programs.
Funding Wisconsin’s Public Benefits Fund
Under Act 141, the Wisconsin Public Service Commission was given the authority to require utilities to spend a larger percentage than the specified 1.2% of revenue based on their its consideration of a variety of criteria including potential studies, rate impacts, cost-effectiveness of programs, impact on transmission, societal impacts, displaced construction of generation and transmission infrastructure, and cost of fossil fuel imports.
As part of its periodic Quadrennial Review process, the Commission did just that, ordering in November 2010 a change from the Public Benefits Fund model under which utilities were required to spend cost-effectively but had no hard goals for achieving energy savings, to an Energy Efficiency Resource Standard (EERS) model under which Focus on Energy would have a goal of ramping up electricity savings to a net of 1.5% and natural gas savings to a net of 1.0% of annual customer use by 2014 and continuing at that level thereafter. Along with these goals was a concurrent increase the funding for Focus from the $120 million budgeted in 2011 to reach $256 million by 2014. This Order was subject to review by the Joint Committee on Finance (JCF) of the Wisconsin State Legislature. In December 2010, both houses of the legislature had Democratic majorities, and the JCF adopted the Commission’s proposed Focus on Energy budget by a vote of 11 to 4.
However, in the November, 2010 elections, Republicans gained a majority of seats in both the House and Senate, thereby gaining control of the JCF when the new legisla-ture convened in January 2011. The Republican-led JCF convened in the 2011-2012 State Legislature approved along party lines a 2011 Budget bill1, which rolled back the December 2010 action, reducing Focus funding for 2012 and thereafter to the previous 1.2% level, budgeted $100 million for Focus in 2012 (a reduction from the 2011 budget of $120 million), and removed the statutory authority of the Commission to increase utility funding requirements beyond the legislated value.

Energy Efficiency Policies, Programs, and Practices in the Midwest: A Resource Guide for Policymakers16
Utility Energy Efficiency Policies, con’t
One of the drivers behind the adoption of an EEPS by Midwestern states has been the support of the Midwestern Gov-ernors Association (MGA). In 2009, the MGA issued a report, Midwestern Energy Security and Climate Stewardship Roadmap: Advisory Group Recommendations which called for states to —
Require retail energy providers to make energy efficiency a priority in order to meet a region-wide efficiency standard of 2 percent annual savings for electric utilities and 1.5 percent annual reductions for natural gas utilities. Energy efficiency standards should be applied consistently to investor-owned, cooperative and municipal utilities, while recognizing regulatory and other differences in customers served and service territories, making appropriate adjustment to individual goals.10
Twenty-six states nationwide, including 6 in the Midwest, have adopted some form of an EEPS that require utilities in their state to meet energy savings targets. In Illinois, Indiana, Michigan, Minnesota, and Ohio, the legislatures established targets for electric and/or gas utilities.
Iowa has what some consider to be an EEPS, but unlike other states where the targets are mandated, Iowa’s approach provided some flexibility. Under the state’s statute, rate-regulated utilities are required to submit an assessment of energy usage and potential savings to the Iowa Utilities Board.11 The IUB generally approved the performance goals proposed by the utilities for the period 2009-2013, which in one case varied from the 1.5 percent scenario. As an example, the IUB set Interstate Power & Light’s performance goals at 1.3 percent of electric energy sales and 1.2 percent of gas sales by 2013.
In addition to the requirement for rate-regulated utilities, the Governor signed Senate File 2386 on May 6, 2008, which directed the state’s non-rate regulated utilities to develop energy efficiency plans that include the utility’s “cost effective energy efficiency goal;”12 thereby, extending the efficiency requirements to the state’s cooperative and municipal utilities. In doing so, Iowa allows the cooperative and municipal utilities to file these plans jointly, which is done under their respective statewide associations.
Another approach, which will be addressed later in this report, is the adoption of a requirement that utilities under-take an integrated resource planning process that incorporates “all cost-effective demand-side savings.” In adopting rules under the Missouri Energy Efficiency Investment Act, the Missouri Public Service Commission set forth annual percentage goals for utility energy efficiency savings against which utility savings through energy efficiency would be measured. They are not, however, hard targets that utilities are mandated to meet, but are soft goals to review utility progress and encourage ramping up of program delivery.
STAT
EWID
E EN
ERG
Y EF
FICI
ENCY
PO
LICI
ES

17
STATEWIDE ENERG
Y EFFICIENCY POLICIES
Utility Energy Efficiency Policies, con’t
Across the Midwest, policies requiring and promoting ratepayer-funded energy efficiency programs have seen tremendous growth in the funds spent from less than $200 million in 2001 to an estimated $1.2 billion in 2012, and are expected to continue grow to an estimated $1.79 billion in 2015. As the chart below illustrates, as states adopted energy efficiency resource standards for electric and gas utilities, the spending levels increased. At the same time, however, we have witnessed increased spending for ratepayer-funded efficiency in states without a mandate or target, such as in Missouri.
In comparing statewide ratepayer-funded energy efficiency programs, we considered a variety of factors:
• Who are the participating utilities? • Is participation mandatory or voluntary? • What are the targets? • What is the ramp-up schedule? • Do they encourage a portfolio of energy efficiency programs? • Do they allow for cost recovery? • Is there lost revenue recovery? • Are there incentives for the utilities? • Are there penalties for under-compliance or noncompliance? • Is stakeholder participation encouraged?

Energy Efficiency Policies, Programs, and Practices in the Midwest: A Resource Guide for Policymakers18
STAT
EWID
E EN
ERG
Y EF
FICI
ENCY
PO
LICI
ES
STATEWIDE ENERG
Y EFFICIENCY POLICIES
Utility Energy Efficiency Policies, con’t
As Table 5, below, illustrates, there are a variety of combinations among the 6 Midwestern states – Illinois, Indiana, Iowa, Michigan, Minnesota, and Ohio – that have adopted an EEPS or EEPS-like requirement. Wisconsin requires its utilities to spend 1.2 percent of their revenue on energy efficiency programs through Focus on Energy. In addition, in Missouri, the Missouri Energy Efficiency Investment Act encourages greater investment in energy efficiency by the state’s investor-owned electric utilities through their integrated resource planning processes.
A Best Practices Handbook 19 for Policymakers
Table 5: Statewide Energy Efficiency Policies in the Midwest Illinois Indiana Iowa Michigan Minnesota Missouri Ohio Wisconsin
Created by Legislation Regulation Legislation & Exec. Order
Legislation Legislation Legislation Legislation Regulation & Legislation
Statute or Regulatory
Order
Illinois Power Agency Act, Public Act 095-0481
Indiana Utility Regulatory
Commission Cause No.
42693 (Dec. 9, 2009)
Iowa Code 476.6; Iowa
Administrative Code
Chapters 35 and 36
Clean, Renewable, and Efficient Energy Act (Act 295 of
2008)
Next Generation
Energy Act of 2007 (Minn.
Statutes 2008
§216B.241)
Missouri Energy
Efficiency Investment Act (Section 393.1075,
RSMo Cum. Supp. 2010)
SB 221 of 2008 (Ohio
Revised Code
4928.66)
2005 Wisconsin Act 141
Year passed/ most recent
update
2007/2009 2009 1990/2008 2008 1991/2007 2009 2008 1999/20111
Participation Mandatory Mandatory Mandatory Mandatory Mandatory Voluntary Mandatory Mandatory Utilities Electric &
Gas Electric Electric &
Gas Electric & Gas Electric &
Gas Electric Electric Electric & Gas
Utility Sector IOU IOU and those Co-ops
and Munis under IURC jurisdiction)
IOU, Co-op, Muni
IOU, Co-op, Muni
IOU, Co-op, Muni
IOU IOU IOU, Co-op, Muni
Stakeholder Participation
Stakeholder Advisory Group
Indiana DSM Coordination Committee
Iowa Energy Efficiency
Collaborative
Michigan Energy
Optimization Collaborative
1.5% Energy Efficiency Solutions Project
Intervention in PSC
Proceedings
Utility-specific Stakeholder
Groups
None (Focus on Energy
overseen by PSC)
Required energy savings
Hard targets, set in
legislation
Hard targets, set by order
Hard targets, set on a utility-by-
utility basis
Hard targets, set by
legislation
Hard targets, set by
legislation
Guidelines set by rules
Hard targets, set by
legislation
No energy savings targets;
mandatory spending
levels Target
Electric/Gas Year
2.0%/1.5% 2015/2019
2.0% 2019
IUB targeted a goal of 1.5%, but
actual goals set utility-by-
utility
1.0%/.75% 2012/2012
1.5%/1.5% 2013/2013
2.0% 2019
1.2% of Gross Utility Revenues
Cost recovery Yes Yes Yes Yes Yes yes Yes Yes Lost revenues No revenue
recovery in legislation; Decoupling
approved on a case-by-case basis
Decoupling rejected by order; Lost
revenue recovery on a case-by-case
basis
Decoupling; Allowed on a case-by-case basis for gas
utilities.
Decoupling; Approved on
a case by case basis
Decoupling; Pilots
approved on a case-by-case basis
Lost revenue recovery
allowed by legislation; Mechanism approved
case-by-case
Lost revenue recovery and decoupling;
Approved on a case-by-case basis
Decoupling; Approved on a case-by-case basis
Incentives / Shared Benefits
No Approved on a case-by-case basis
No Yes Yes Mechanism approved on a case-by-case basis
Approved on a case-by-case basis
Approved on a case-by-case basis
Penalties for Non-
compliance
Fine of $100,000/day for failing to
file a plan; Utility will make a
contribution to LIHEAP
program for failing to meet
standard
No clear and immediate
consequences for non-
compliance
Allows the Attorney
General or a member of a
co-op to bring a civil action for
non- compliance
No monetary penalties for
non-compliance; Commission can withhold
approval future
certificate of Need to build new facility
PUCO has authority to
order forfeiture in
cases of non-compliance and under-compliance
Participation — Within the region, the respective states have differences regarding which utilities are subject to the statewide energy efficiency policy. Some states apply the requirements to all sectors of the electric utility industry – investor-‐owned, cooperative, and
1 For a more in-depth analysis of the Focus on Energy programs, see MEEA’s report “Wisconsin’s Energy Efficiency Programs: Continuing to Bring Savings and Create Jobs” at http://mwalliance.org
1 For a more in-depth analysis of the Focus on Energy programs, see MEEA’s report “Wisconsin’s Energy Efficiency Programs: Continuing to Bring Savings and Create Jobs” at http://mwalliance.org
19
STATEWIDE ENERG
Y EFFICIENCY POLICIES
STATEWIDE ENERG
Y EFFICIENCY POLICIES
ParticipationWithin the region, the respective states have differences regarding which utilities are subject to the statewide energy efficiency policy. Some states apply the requirements to all sectors of the electric utility industry – investor-owned, cooperative, and municipal utilities – while others limit it to the investor-owned utilities. Similarly, most of the states apply energy efficiency requirements to both electric and gas utilities, while some do not. What each of the states with either an energy savings target or a spending requirement have in common is that for those utilities subject to the requirement, participation is mandatory.
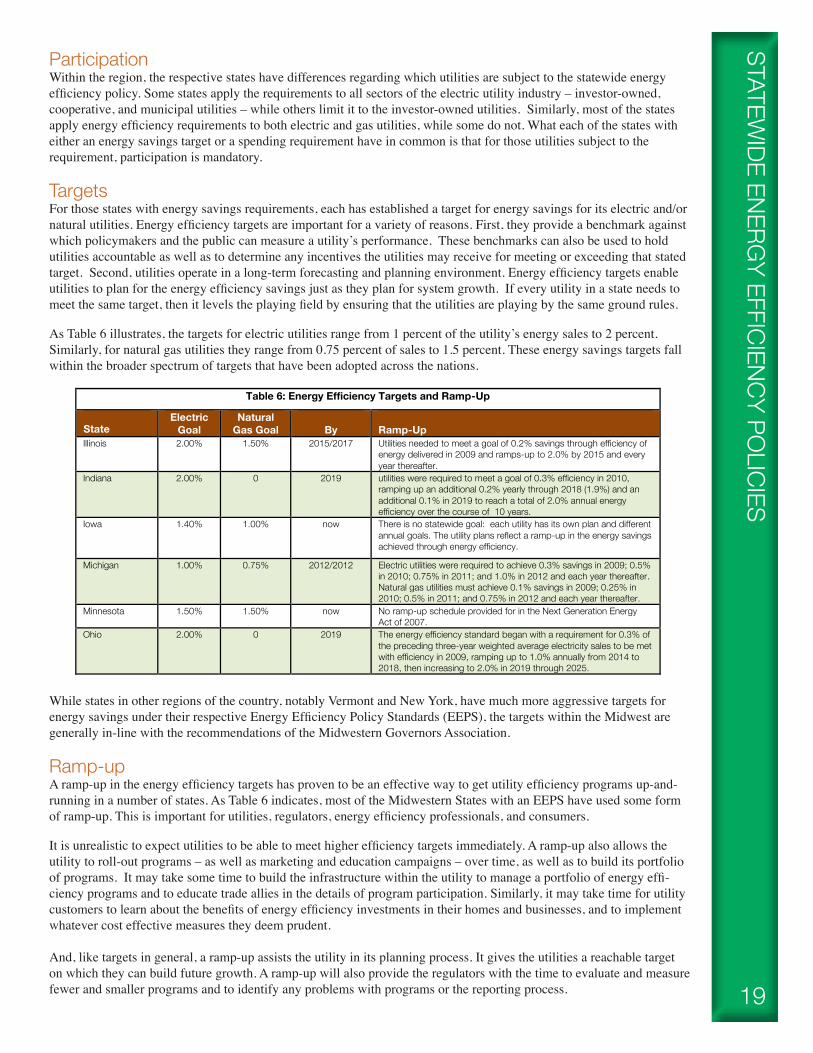
TargetsFor those states with energy savings requirements, each has established a target for energy savings for its electric and/or natural utilities. Energy efficiency targets are important for a variety of reasons. First, they provide a benchmark against which policymakers and the public can measure a utility’s performance. These benchmarks can also be used to hold utilities accountable as well as to determine any incentives the utilities may receive for meeting or exceeding that stated target. Second, utilities operate in a long-term forecasting and planning environment. Energy efficiency targets enable utilities to plan for the energy efficiency savings just as they plan for system growth. If every utility in a state needs to meet the same target, then it levels the playing field by ensuring that the utilities are playing by the same ground rules.
As Table 6 illustrates, the targets for electric utilities range from 1 percent of the utility’s energy sales to 2 percent. Similarly, for natural gas utilities they range from 0.75 percent of sales to 1.5 percent. These energy savings targets fall within the broader spectrum of targets that have been adopted across the nations.
While states in other regions of the country, notably Vermont and New York, have much more aggressive targets for energy savings under their respective Energy Efficiency Policy Standards (EEPS), the targets within the Midwest are generally in-line with the recommendations of the Midwestern Governors Association.
Ramp-upA ramp-up in the energy efficiency targets has proven to be an effective way to get utility efficiency programs up-and-running in a number of states. As Table 6 indicates, most of the Midwestern States with an EEPS have used some form of ramp-up. This is important for utilities, regulators, energy efficiency professionals, and consumers.
It is unrealistic to expect utilities to be able to meet higher efficiency targets immediately. A ramp-up also allows the utility to roll-out programs – as well as marketing and education campaigns – over time, as well as to build its portfolio of programs. It may take some time to build the infrastructure within the utility to manage a portfolio of energy effi-ciency programs and to educate trade allies in the details of program participation. Similarly, it may take time for utility customers to learn about the benefits of energy efficiency investments in their homes and businesses, and to implement whatever cost effective measures they deem prudent.
And, like targets in general, a ramp-up assists the utility in its planning process. It gives the utilities a reachable target on which they can build future growth. A ramp-up will also provide the regulators with the time to evaluate and measure fewer and smaller programs and to identify any problems with programs or the reporting process.
Table 6: Energy Efficiency Targets and Ramp-Up
State
Electric Goal
Natural Gas Goal
By
Ramp-Up
Illinois 2.00% 1.50% 2015/2017 Utilities needed to meet a goal of 0.2% savings through efficiency of energy delivered in 2009 and ramps-up to 2.0% by 2015 and every year thereafter.
Indiana 2.00% 0 2019 utilities were required to meet a goal of 0.3% efficiency in 2010, ramping up an additional 0.2% yearly through 2018 (1.9%) and an additional 0.1% in 2019 to reach a total of 2.0% annual energy efficiency over the course of 10 years.
Iowa 1.40% 1.00% now There is no statewide goal: each utility has its own plan and different annual goals. The utility plans reflect a ramp-up in the energy savings achieved through energy efficiency.
Michigan 1.00% 0.75% 2012/2012 Electric utilities were required to achieve 0.3% savings in 2009; 0.5% in 2010; 0.75% in 2011; and 1.0% in 2012 and each year thereafter. Natural gas utilities must achieve 0.1% savings in 2009; 0.25% in 2010; 0.5% in 2011; and 0.75% in 2012 and each year thereafter.
Minnesota 1.50% 1.50% now No ramp-up schedule provided for in the Next Generation Energy Act of 2007.
Ohio 2.00% 0 2019 The energy efficiency standard began with a requirement for 0.3% of the preceding three-year weighted average electricity sales to be met with efficiency in 2009, ramping up to 1.0% annually from 2014 to 2018, then increasing to 2.0% in 2019 through 2025.
Energy Efficiency Policies, Programs, and Practices in the Midwest: A Resource Guide for Policymakers20
STAT
EWID
E EN
ERG
Y EF
FICI
ENCY
PO
LICI
ES Portfolio of ProgramsUtilities serve a wide variety and numerous sectors of customers. While customers are generally viewed as residential, commercial, and industrial sectors, within each of these groups there are different segments as well. These segments and individual homeowners and businesses will have different needs that the utility can help meet. Successful energy efficiency strategies include a portfolio of programs targeted at each of these segments.
For residential customers, utilities have developed a variety of programs, including home energy audits; whole home energy efficiency retrofit programs; refrigerator and freezer recycling; lighting programs, rebates for high efficiency ap-pliances, furnaces, water heaters, insulation, and windows; HVAC tune-up programs; behavior change/consumer infor-mation programs; pool pump and timer programs; shade tree planting programs; financing programs; and low-income weatherization.
For commercial and industrial customers, many utilities have implemented a “key accounts” program with utility employees who can help these customers better manage their energy usage and implement efficiency strategies. Among the programs available to C&I customers are programs targeting the whole building, the building envelope, lighting, pumps and motors, kitchens and refrigeration, mechanical equipment, and HVAC. In addition, many utilities will work with their C&I customers to develop custom solutions specifically developed for the customer’s business operations. In addition, many utilities provide support to a building operator certification program for operators of commercial buildings in their service territories.
See Appendix 2 for a more complete listing of Industrial programs offered by many utilities in the Midwest.
These are just some of the programs offered by utilities as part of their energy efficiency portfolios. Not every utility can offer or will offer the same set of programs. Utilities will determine which programs can be economically provided and are best suited to their service territories, customers, and business strategies.
Cost RecoveryThe ability for a utility to recoup the costs it incurs in developing, promoting, and delivering programs is critical to the success of energy efficiency programs, regardless of whether utilities are mandated to have such programs or not. Just as utilities are able to recoup the costs incurred for generation, transmission, and distribution infrastructure, they need to be able to recover their costs for energy efficiency and demand-side programs.
State regulatory commissions across the Midwest have recognized the importance of utility cost recovery mechanisms for utility investments in energy efficiency. Policymakers in the Midwestern states (Table 7) have taken different approaches to cost recovery. Some states have adopted automatic adjustment mechanisms while others approach this issue on a case-by-case basis. In addition, states with a cap on the level of utility funding under their EEPS, do not allow recovery above and beyond the spending ceiling. While the approaches may be different, the critical elements are the following:
• Ensuring that costs associated with the utility energy efficiency programs are prudent and reasonable • Inclusion of both capital and non-capital costs • The recovery period should be limited to the life of the program • Annual reconciliation of amounts collected versus actual costs
(see next page for Table 7)
Nebraska is Unique
It is important to note that Nebraska is different from other states in that all of its electric utilities are either public power districts (PPDs) or cooperatives. In addition, they are not regulated by the state commission. As such, they are owned by their consumers, do not have stockholders, and operate on a not-for-profit basis.

21
STATEWIDE ENERG
Y EFFICIENCY POLICIES
Cost Recovery, con’t
Lost Revenue RecoveryOne of the barriers facing utilities when it comes to investing in energy efficiency is the negative effect it has on their revenue streams. Under the traditional regulatory model, utilities can only increase their revenues by selling more of their product: electricity or natural gas. Simply put, sell more product earn more money. Energy efficiency policies ask them to invest in programs that result in decreasing sales (or at a minimum, slower growth). As such, they are not only being asked to sell less of their product, they are being told to invest in programs that will decrease their sales now and into the future. At the same time, for investor-owned utilities, their stockholders want them to increase revenues and profits. This places the utility in an untenable position of having to please both the policymakers and the stockhold-ers, and without a properly created “lost revenue recovery mechanism,” they are unlikely to invest in energy efficiency without being mandated to by legislators or regulators.
A Best Practices Handbook 23 for Policymakers
Table 7: Utility Cost Recovery Mechanisms in the Midwest
State Citation Cost Recovery Mechanism I l l inois 220 ILCS 5/8-
103 (e) A utility providing approved energy efficiency and demand-response measures in the State shall be permitted to recover costs of those measures through an automatic adjustment clause tariff filed with and approved by the Commission. The tariff shall be established outside the context of a general rate case. Each year the Commission shall initiate a review to reconcile any amounts collected with the actual costs and to determine the required adjustment to the annual tariff factor to match annual expenditures.
Indiana 170 IAC 4-8-5 A utility is entitled to recover the reasonable cost of planning and implementing a demand-side management program, in one or more of the following ways, or any combination of them, as determined by the commission: (1) The inclusion of the cost in the utility's base rates during a rate case using a balancing account, where appropriate, to reconcile the utility's recovered expenditures. (2) The periodic recovery of the cost incurred in excess of the cost that is included in the utility's base rates. (3) The inclusion of the capital cost, with accumulated AFUDC, in the utility's rate base during its rate case, amortized over a period set by the commission. (4) The accumulation, with a carrying charge, of the non-capital cost incurred and not otherwise recovered through the utility's base rates or through periodic adjustments in a deferred account to be amortized over a period set by the commission. (5) A cost recovery mechanism proposed by the utility, other parties, or the commission.
Iowa Iowa Code 476.6.16.g
A rate-regulated gas or electric utility may recover, through an automatic adjustment mechanism over a period not to exceed the term of the plan, the costs of an energy efficiency plan approved by the Board. The Board shall periodically conduct a contested case proceeding to evaluate the reasonableness and prudence of the utility's implementation of an approved energy efficiency plan and budget.
Kansas Final Order in 08-GMX-441-GIV
Approved on a case-by-case basis; It is the Commission's policy to consider proposals from utilities for riders to recover costs for energy efficiency programs
Kentucky 278.285 Allows costs of approved programs to be incorporated into a surcharge that appears on the customer bill. The amount of the surcharge is determined based on five elements: program costs, projected lost revenues as a result of the programs, an incentive bonus, capital recovery, and true-up from the previous filing. Only the customer class that benefits from a given program should incur the associated costs of that program.
Michigan PA 295 Sec. 89. (1)
The commission shall allow a provider whose rates are regulated by the commission to recover the actual costs of implementing its approved energy optimization plan. However, costs exceeding the overall funding levels specified in the energy optimization plan are not recoverable unless those costs are reasonable and prudent and meet the utility system resource cost test. Furthermore, costs for load management undertaken pursuant to an energy optimization plan are not recoverable as energy optimization program costs under this section, but may be recovered as described in section 95.
Minnesota Minn. Stat. 216B.16 Subd. 6b
The commission may permit a public utility to file rate schedules providing for annual recovery of the costs of energy conservation improvements. Investments and expenses of a public utility incurred in connection with energy conservation improvements shall be recognized and included by the commission in the determination of just and reasonable rates.
Missouri 393.1075 RSMo. Cum. Supp. 2010
Provides for timely cost recovery for utilities for all reasonable and prudent costs of delivering cost-effective demand-side programs.
Nebraska All electric utilities in Nebraska are either public power districts or electric cooperatives. They are not regulated by the Nebraska Public Service Commission. Rates are set by the individual utility boards, and cost recovery for energy efficiency investments are decided by their respective boards.
North Dakota Costs recovered on a case-by-case basis through rate proceedings.
Ohio OAC 4901:1-39-07
With the filing of its proposed program portfolio plan, the electric utility may submit a request for recovery of an approved rate adjustment mechanism, commencing after approval of the electric utility’s program portfolio plan, of costs due to electric utility peak-demand reduction, demand response, energy efficiency program costs… Any such recovery shall be subject to annual reconciliation after issuance of the commission verification report issued pursuant to this chapter.
South Dakota SDCL 49-34A Commission has approved an Energy Efficiency Cost Recovery Rider on a case-by-case basis.
Wisconsin Wisc. Stat. 196.374
The commission shall ensure in rate-making orders that an energy utility recovers from its ratepayers the amounts the energy utility spends for energy efficiency programs.
Lost Revenue Recovery — One of the barriers facing utilities when it comes to investing in energy efficiency is the negative effect it has on their revenue streams. Under the traditional regulatory model, utilities can only increase their revenues by selling more of their product: electricity or natural gas. Simply put, sell more product earn more money. Energy efficiency policies ask them to invest in programs that result in decreasing sales (or at a minimum, slower growth). As such, they are not only being asked to sell less of their product, they are being told
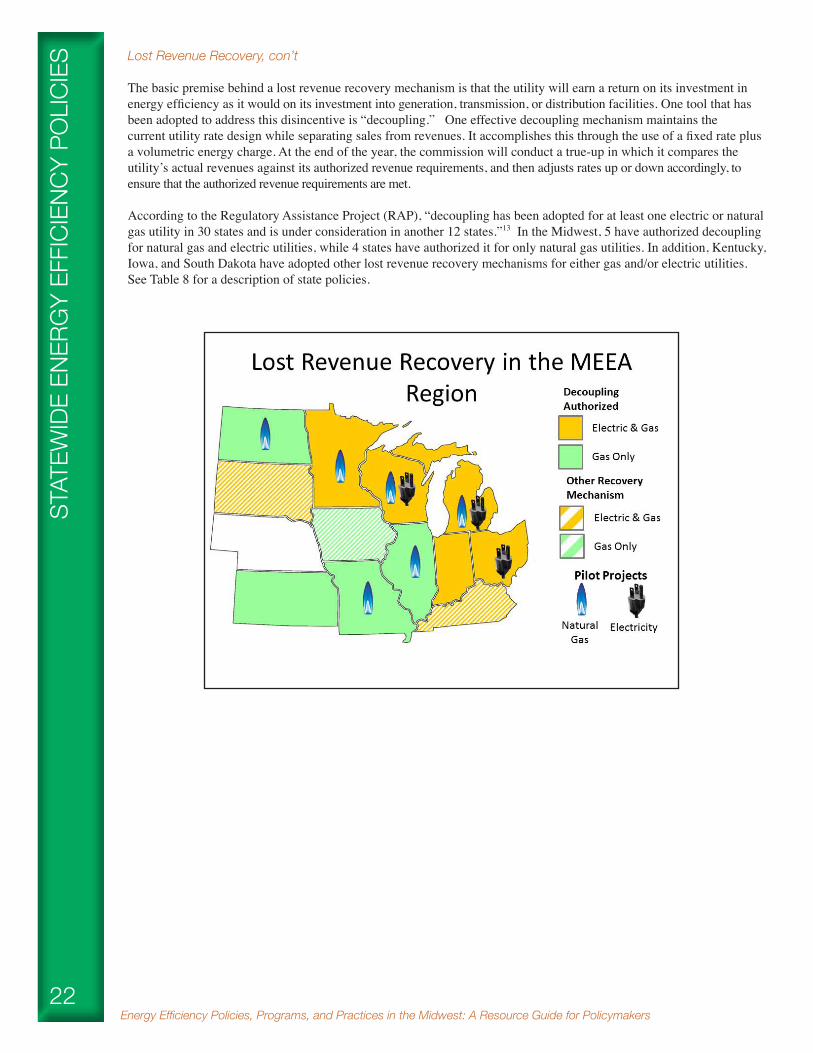
Energy Efficiency Policies, Programs, and Practices in the Midwest: A Resource Guide for Policymakers22
STAT
EWID
E EN
ERG
Y EF
FICI
ENCY
PO
LICI
ES Lost Revenue Recovery, con’t
The basic premise behind a lost revenue recovery mechanism is that the utility will earn a return on its investment in energy efficiency as it would on its investment into generation, transmission, or distribution facilities. One tool that has been adopted to address this disincentive is “decoupling.” One effective decoupling mechanism maintains the current utility rate design while separating sales from revenues. It accomplishes this through the use of a fixed rate plus a volumetric energy charge. At the end of the year, the commission will conduct a true-up in which it compares the utility’s actual revenues against its authorized revenue requirements, and then adjusts rates up or down accordingly, to ensure that the authorized revenue requirements are met.
According to the Regulatory Assistance Project (RAP), “decoupling has been adopted for at least one electric or natural gas utility in 30 states and is under consideration in another 12 states.”13 In the Midwest, 5 have authorized decoupling for natural gas and electric utilities, while 4 states have authorized it for only natural gas utilities. In addition, Kentucky, Iowa, and South Dakota have adopted other lost revenue recovery mechanisms for either gas and/or electric utilities. See Table 8 for a description of state policies.

23
Lost Revenue Recovery, con’t STATEWIDE ENERG
Y EFFICIENCY POLICIES
24 Energy Efficiency Policies, Programs, and Practices in the Midwest
to invest in programs that will decrease their sales now and into the future. At the same time, for investor-‐owned utilities, their stockholders want them to increase revenues and profits. This places the utility in an untenable position of having to please both the policymakers and the
Table 8: Utility Lost Revenue Recovery Mechanisms in the Midwest
State Citation Lost Revenue Recovery Mechanism
I l l inois Dockets 07-241 & 07-242
There are no policies to support decoupling for electric utilities; however, North Shore Gas (Docket 07-241) and People Gas (Docket 07-242) were been approved for revenue-per-customer pilot programs in February of 2008.
Indiana 170 IAC 4-8-6
The commission may allow the utility to recover the utility's lost revenue from the implementation of a demand-side management program sponsored or instituted by the utility. The calculation of lost revenue must account for the impact of free-riders and the changes in the number of DSM program participants between base rate changes and on the revised estimate of a program specific load impact that result from the utility's measurement and evaluation activities. The commission may periodically review the need for continued recovery of the lost revenue as a result of a utility's DSM program.
Iowa NOI-06-1 The Iowa Utilities Board considered decoupling for natural gas utilities and determined that it would consider automatic adjustment mechanisms or other rate design changes on a case by case basis.
Kansas Final Order in 08-GIMX-441-GIV
Handled on a case-by-case basis.
Kentucky 278.285 Allows utilities to include in customer bill surcharge the projected revenues lost as a result of approved, cost-effective energy efficiency programs.
Michigan Public Act 295
Allows natural gas utilities to request a symmetrical revenue decoupling mechanism as long as they are spending at least 0.5% of total revenues on EE programs. The law, however, does not mention electric utilities.
Minnesota Minn. Stat 216B.2412
State statute authorizes decoupling as a means to separate a utility's revenue from changes in energy sales. The purpose of decoupling is to reduce a utility's disincentive to promote energy efficiency. The commission was directed to establish criteria and standards for decoupling. A decoupling proposal for CenterPoint Energy, the state’s largest gas utility, is part of the current rate case that was before the Public Utilities Commission in August 2009.
Missouri 393.1075 RSMo. Cum. Supp. 2010
Provide timely earnings opportunities associated with cost-effective measurable and verifiable efficiency savings. The Missouri PSC has approved decoupling for gas utilities: Atmos Energy and Missouri Gas Energy.
Nebraska All electric utilities in Nebraska are either public power districts or cooperatives. Lost revenue charges, surcharges, or extra returns are not necessary for public power and not-for-profit cooperatives to adopt cost-effective energy efficiency rates and programs.
North Dakota Docket PU-06-525
Decoupling approved in natural gas rate design case for Xcel Energy.
Ohio OAC 4901:1-39-07
Allows recovery of 'appropriate' lost distribution revenues. An electric distribution utility may apply to PUCO for approval of a revenue decoupling mechanism; however gas utilities haven’t been allowed to implement a true decoupling mechanism, instead they’ve been permitted to use straight-fixed-variable rate designs. These decisions are determined on a case-by-case basis for both electric and gas utilities. Duke Energy Ohio recovers lost revenues resulting from its portfolio of energy efficiency programs through the DSM rider. Dayton Power & Light currently has a case pending. AEP Ohio chose not to seek lost revenue recovery in their prior rate case.
South Dakota Docket GE09-001
In 2010 the South Dakota Public Utilities Commission authorized a lost revenue adjustment mechanism for Northwestern Energy for both gas and electric efficiency programs.
Wisconsin Dockets 6680-UR-116 and 6690-UR-119
In December 2008 decoupling was approved for the Wisconsin Public Service Corporation, which was specified as a “Revenue Stabilization Mechanism” and allowed the utility to pursue a four-year pilot program. WPSC has asked the Commission to allow decoupling to go forward beyond the pilot, which ends in 2012.
Utility Incentives— In addition to cost and revenue recovery, the “third leg” of the energy efficiency stool is represented by utility incentives. By creating incentive mechanisms, policymakers are sending a strong economic message to utilities and their stockholders: invest in energy efficiency, and you’ll not only be made whole, you’ll be rewarded. Incentives have been utilized in states with an EEPS as well as those without a mandated target. According to the American Council for an Energy-‐Efficient Economy, performance incentives have been adopted by 36 states for electric utilities and 26 states for natural gas utilities.11 In the Midwest, Indiana, Kansas, Kentucky, Michigan, Minnesota, Missouri, Ohio, South Dakota, and Wisconsin have adopted a performance incentive mechanism for both their electric and gas
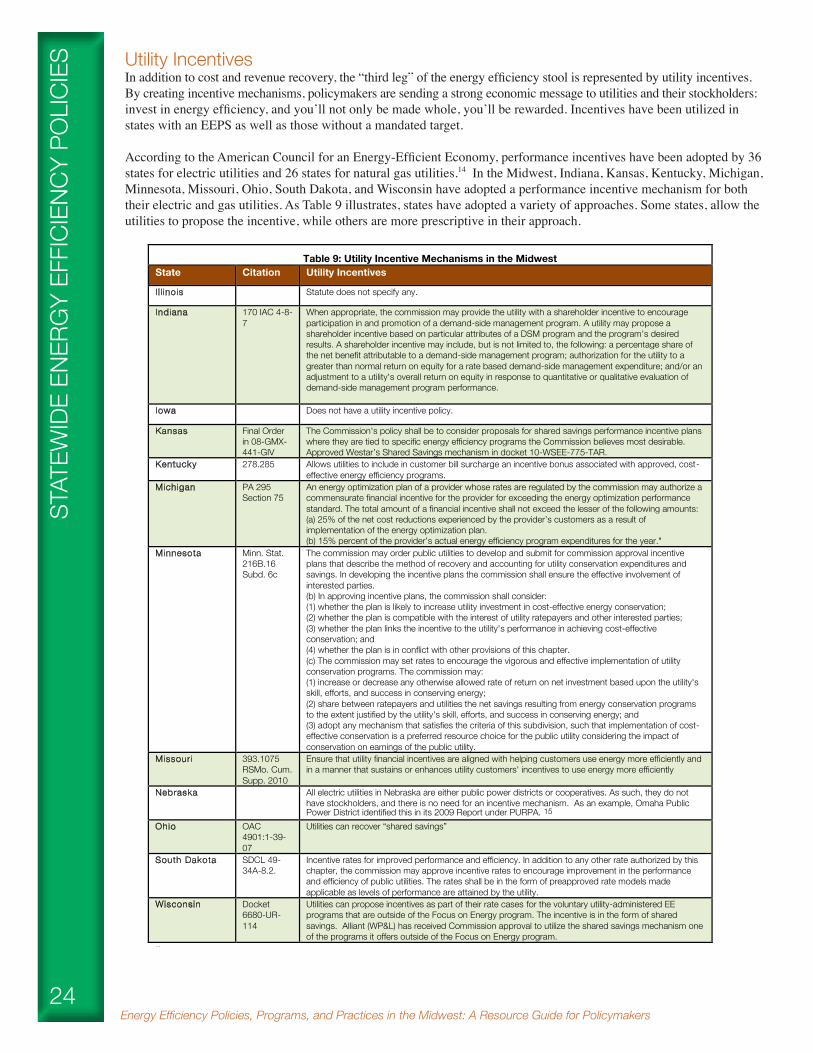
Energy Efficiency Policies, Programs, and Practices in the Midwest: A Resource Guide for Policymakers24
Utility IncentivesIn addition to cost and revenue recovery, the “third leg” of the energy efficiency stool is represented by utility incentives. By creating incentive mechanisms, policymakers are sending a strong economic message to utilities and their stockholders: invest in energy efficiency, and you’ll not only be made whole, you’ll be rewarded. Incentives have been utilized in states with an EEPS as well as those without a mandated target.
According to the American Council for an Energy-Efficient Economy, performance incentives have been adopted by 36 states for electric utilities and 26 states for natural gas utilities.14 In the Midwest, Indiana, Kansas, Kentucky, Michigan, Minnesota, Missouri, Ohio, South Dakota, and Wisconsin have adopted a performance incentive mechanism for both their electric and gas utilities. As Table 9 illustrates, states have adopted a variety of approaches. Some states, allow the utilities to propose the incentive, while others are more prescriptive in their approach.
STAT
EWID
E EN
ERG
Y EF
FICI
ENCY
PO
LICI
ES
!"#$%&"'()*&+*$%",)-./001"" 23"!"#$%"&'()*+,-#."
"
!"#$#"#%&'()&(*+,$%(-(#$$!&".+"%&/(&"+"%&(0+1%(+234"%2(+(1+.#%"5(36(+44.3+70%&'(839%(&"+"%&/(+$$3:("0%(!"#$#"#%&("3(4.343&%("0%(#;7%;"#1%/(:0#$%(3"0%.&(+.%(93.%(4.%&7.#4"#1%(#;("0%#.(+44.3+70'(("
Table 9: Utility Incentive Mechanisms in the Midwest State Citation Utility Incentives
I l l inois Statute does not specify any.
Indiana 170 IAC 4-8-7
When appropriate, the commission may provide the utility with a shareholder incentive to encourage participation in and promotion of a demand-side management program. A utility may propose a shareholder incentive based on particular attributes of a DSM program and the program's desired results. A shareholder incentive may include, but is not limited to, the following: a percentage share of the net benefit attributable to a demand-side management program; authorization for the utility to a greater than normal return on equity for a rate based demand-side management expenditure; and/or an adjustment to a utility's overall return on equity in response to quantitative or qualitative evaluation of demand-side management program performance.
Iowa Does not have a utility incentive policy.
Kansas Final Order in 08-GMX-441-GIV
The Commission's policy shall be to consider proposals for shared savings performance incentive plans where they are tied to specific energy efficiency programs the Commission believes most desirable. Approved Westar’s Shared Savings mechanism in docket 10-WSEE-775-TAR.
Kentucky 278.285 Allows utilities to include in customer bill surcharge an incentive bonus associated with approved, cost-effective energy efficiency programs.
Michigan PA 295 Section 75
An energy optimization plan of a provider whose rates are regulated by the commission may authorize a commensurate financial incentive for the provider for exceeding the energy optimization performance standard. The total amount of a financial incentive shall not exceed the lesser of the following amounts: (a) 25% of the net cost reductions experienced by the provider’s customers as a result of implementation of the energy optimization plan. (b) 15% percent of the provider’s actual energy efficiency program expenditures for the year."
Minnesota Minn. Stat. 216B.16 Subd. 6c
The commission may order public utilities to develop and submit for commission approval incentive plans that describe the method of recovery and accounting for utility conservation expenditures and savings. In developing the incentive plans the commission shall ensure the effective involvement of interested parties. (b) In approving incentive plans, the commission shall consider: (1) whether the plan is likely to increase utility investment in cost-effective energy conservation; (2) whether the plan is compatible with the interest of utility ratepayers and other interested parties; (3) whether the plan links the incentive to the utility's performance in achieving cost-effective conservation; and (4) whether the plan is in conflict with other provisions of this chapter. (c) The commission may set rates to encourage the vigorous and effective implementation of utility conservation programs. The commission may: (1) increase or decrease any otherwise allowed rate of return on net investment based upon the utility's skill, efforts, and success in conserving energy; (2) share between ratepayers and utilities the net savings resulting from energy conservation programs to the extent justified by the utility's skill, efforts, and success in conserving energy; and (3) adopt any mechanism that satisfies the criteria of this subdivision, such that implementation of cost-effective conservation is a preferred resource choice for the public utility considering the impact of conservation on earnings of the public utility.
Missouri 393.1075 RSMo. Cum. Supp. 2010
Ensure that utility financial incentives are aligned with helping customers use energy more efficiently and in a manner that sustains or enhances utility customers' incentives to use energy more efficiently
Nebraska All electric utilities in Nebraska are either public power districts or cooperatives. As such, they do not have stockholders, and there is no need for an incentive mechanism. As an example, Omaha Public Power District identified this in its 2009 Report under PURPA. 15
Ohio OAC 4901:1-39-07
Utilities can recover “shared savings”
South Dakota SDCL 49-34A-8.2.
Incentive rates for improved performance and efficiency. In addition to any other rate authorized by this chapter, the commission may approve incentive rates to encourage improvement in the performance and efficiency of public utilities. The rates shall be in the form of preapproved rate models made applicable as levels of performance are attained by the utility.
Wisconsin
Docket 6680-UR-114
Utilities can propose incentives as part of their rate cases for the voluntary utility-administered EE programs that are outside of the Focus on Energy program. The incentive is in the form of shared savings. Alliant (WP&L) has received Commission approval to utilize the shared savings mechanism one of the programs it offers outside of the Focus on Energy program.
"'$-)4&+$%"5 "<3.("03&%(&"+"%&(:#"0(9+;2+"%2(%;%.=5(%66#7#%;75("+.=%"&(3.(#;7%;"#1%(9%70+;#&9&/(+(>!%&"#3;(#&(36"%;(.+#&%2(:#"0(.%=+.2&("3(+22.%&&#;=(!"#$#"#%&("0+"(6+#$("3(+70#%1%("0%(%;%.=5(%66#7#%;75(&+1#;=&'(<3.("0%(93&"(4+."/(?#2:%&"%.;(&"+"%&(0+1%(,%%;(.%$!7"+;"("3(+234"(&".#7"(4%;+$"#%&(63.(%#"0%.(!;2%.@7394$#+;7%(3.(;3;@7394$#+;7%&'(A0%.%(+!"03.#"5(#&(=.+;"%2(#"(#&(
25
STATEWIDE ENERG
Y EFFICIENCY POLICIES
PenaltiesFor those states with mandated energy efficiency targets or incentive mechanisms, a question is often raised with regards to addressing utilities that fail to achieve the energy efficiency savings. For the most part, Midwestern states have been re-luctant to adopt strict penalties for either under-compliance or non-compliances. Where authority is granted it is generally given to the regulatory commission. It is important to understand the reasons driving under-compliance or non-compliance to determine if it related to program administration or some other reason such as an economic downturn. In Ohio, the PUCO can order forfeiture, in Minnesota utilities can be denied a certificate of need required to build new energy supply if they have not met energy efficiency targets, and Michigan allows the attorney general or a co-op member to bring civil action for non-compliance. Illinois is the lone state with strict, daily fines written into the statute. Illinois also wrote in the law that if the utilities fail to meet their targets, their programs can be taken away.
Stakeholder ParticipationA tool that both utilities and regulators have found beneficial is the development of a stakeholder collaborative. In Strategic Management: A Stakeholder Approach, 16 R. Edward Freeman defined stakeholders as “any group or individual who can affect or is affected by the achievement of the firm’s objectives” (Freeman 1984, p. 25). In doing so, Freeman urged corporations to look beyond their traditional stakeholders of stockholders, customers, suppliers, and employees. Utilities have acknowledged the importance of the broader range of stakeholders for quite some time, and have considered stakeholder input and interests in the construction of new generation and transmission facilities.17 While government agencies have long considered the interest of “the public,” they, too, are more frequently adopting the concepts of Freeman’s stakeholder model. In Reinventing Government 18, Osborne and Gaebler certainly adopted the principles set forth by Freeman, but in a language more suited to governments.
The goal of the stakeholder group is to bring together a cross-section of interested parties around a particular set of issues with the objective of developing consensus for a proposed solution. The group may include utility representatives, regulators, consumer advocates, environmental groups, customers, and consultants. In the Midwest, 10 states have convened stakeholder groups to address energy efficiency. There are differences across the region in the membership and scope of the stakeholder groups. Some were created by legislation, while others are efforts of government agencies. Some states have used the stakeholder group to either examine efficiency policies or to get efficiency efforts progressing in their state and then have discontinued them. Other states have adopted long-term stakeholder approaches under which the stakeholder group meets regularly over a longer or indefinite period of time. Some are convened on a statewide basis, while others are utility-specific.
In general, MEEA believes that a statewide collaborative is more beneficial to all of the participants than utility-specific efforts for a variety of reasons. First, a statewide effort allows for better communication and sharing of information across a broader spectrum of interested parties. Utilities can learn from one another, share common challenges with regulators and other stakeholders, and use the group to identify potential solutions. It is quite likely, that if one utility has identified an issue, that it will affect others as well. Second, it is a more efficient use of the time and resources of government agencies, advocates and others involved in the stakeholder process. With a statewide stakeholder group, they can better focus their resources, rather than having to spread their resources covering multiple utility-specific groups. Third, a statewide process allows for better reporting by ensuring that information is reported consistently across the board. Table 10 attempts to capture the significant structural components and objectives of the stakeholder efforts in the Midwest.
(see next page for Table 10)
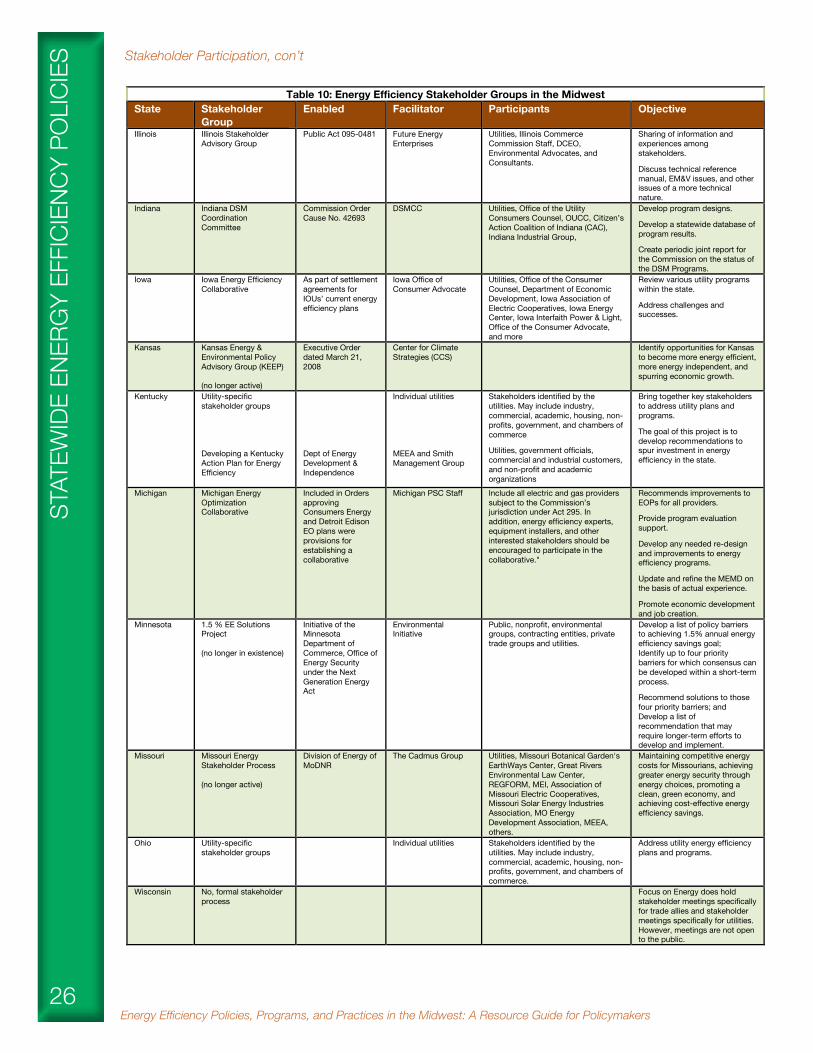
Energy Efficiency Policies, Programs, and Practices in the Midwest: A Resource Guide for Policymakers26
Stakeholder Participation, con’tST
ATEW
IDE
ENER
GY
EFFI
CIEN
CY P
OLI
CIES
Table 10: Energy Efficiency Stakeholder Groups in the Midwest State Stakeholder
Group Enabled Facilitator Participants Objective
Illinois Illinois Stakeholder Advisory Group
Public Act 095-0481 Future Energy Enterprises
Utilities, Illinois Commerce Commission Staff, DCEO, Environmental Advocates, and Consultants.
Sharing of information and experiences among stakeholders. Discuss technical reference manual, EM&V issues, and other issues of a more technical nature.
Indiana Indiana DSM Coordination Committee
Commission Order Cause No. 42693
DSMCC Utilities, Office of the Utility Consumers Counsel, OUCC, Citizen’s Action Coalition of Indiana (CAC), Indiana Industrial Group,
Develop program designs. Develop a statewide database of program results. Create periodic joint report for the Commission on the status of the DSM Programs.
Iowa Iowa Energy Efficiency Collaborative
As part of settlement agreements for IOUs’ current energy efficiency plans
Iowa Office of Consumer Advocate
Utilities, Office of the Consumer Counsel, Department of Economic Development, Iowa Association of Electric Cooperatives, Iowa Energy Center, Iowa Interfaith Power & Light, Office of the Consumer Advocate, and more
Review various utility programs within the state. Address challenges and successes.
Kansas
Kansas Energy & Environmental Policy Advisory Group (KEEP) (no longer active)
Executive Order dated March 21, 2008
Center for Climate Strategies (CCS)
Identify opportunities for Kansas to become more energy efficient, more energy independent, and spurring economic growth.
Kentucky Utility-specific stakeholder groups Developing a Kentucky Action Plan for Energy Efficiency
Dept of Energy Development & Independence
Individual utilities MEEA and Smith Management Group
Stakeholders identified by the utilities. May include industry, commercial, academic, housing, non-profits, government, and chambers of commerce Utilities, government officials, commercial and industrial customers, and non-profit and academic organizations
Bring together key stakeholders to address utility plans and programs. The goal of this project is to develop recommendations to spur investment in energy efficiency in the state.
Michigan Michigan Energy Optimization Collaborative
Included in Orders approving Consumers Energy and Detroit Edison EO plans were provisions for establishing a collaborative
Michigan PSC Staff Include all electric and gas providers subject to the Commission’s jurisdiction under Act 295. In addition, energy efficiency experts, equipment installers, and other interested stakeholders should be encouraged to participate in the collaborative."
Recommends improvements to EOPs for all providers. Provide program evaluation support. Develop any needed re-design and improvements to energy efficiency programs. Update and refine the MEMD on the basis of actual experience. Promote economic development and job creation.
Minnesota
1.5 % EE Solutions Project (no longer in existence)
Initiative of the Minnesota Department of Commerce, Office of Energy Security under the Next Generation Energy Act
Environmental Initiative
Public, nonprofit, environmental groups, contracting entities, private trade groups and utilities.
Develop a list of policy barriers to achieving 1.5% annual energy efficiency savings goal; Identify up to four priority barriers for which consensus can be developed within a short-term process. Recommend solutions to those four priority barriers; and Develop a list of recommendation that may require longer-term efforts to develop and implement.
Missouri Missouri Energy Stakeholder Process (no longer active)
Division of Energy of MoDNR
The Cadmus Group Utilities, Missouri Botanical Garden's EarthWays Center, Great Rivers Environmental Law Center, REGFORM, MEI, Association of Missouri Electric Cooperatives, Missouri Solar Energy Industries Association, MO Energy Development Association, MEEA, others.
Maintaining competitive energy costs for Missourians, achieving greater energy security through energy choices, promoting a clean, green economy, and achieving cost-effective energy efficiency savings.
Ohio Utility-specific stakeholder groups
Individual utilities Stakeholders identified by the utilities. May include industry, commercial, academic, housing, non-profits, government, and chambers of commerce.
Address utility energy efficiency plans and programs.
Wisconsin No, formal stakeholder process
Focus on Energy does hold stakeholder meetings specifically for trade allies and stakeholder meetings specifically for utilities. However, meetings are not open to the public.

27
STATEWIDE ENERG
Y EFFICIENCY POLICIES
Stakeholder Participation, con’t
Regardless of the structure or objective of the stakeholder group, there are several important elements that should exist:
• Broad group of knowledgeable stakeholders representing a variety of interests • Open to the public and any interested individual can attend • Clearly defined objectives • Independent facilitator • Regularly scheduled meetings with agenda • Open communication and sharing of information • Reporting mechanism
A well run stakeholder process will overcome differences among the parties, while moving efficiency forward with soundly developed programs, adequate reporting, and solid practices for evaluation, measurement, and verification.
Third Party AdministratorWhile most states allow their utilities to manage their own efficiency programs, some states have opted to use a Third Party Administrator (TPA) to run core energy efficiency programs across the state. Like utility-operated energy efficiency programs, the TPA’s programs are funded by the ratepayers. A TPA provides a portfolio of energy efficiency programs across the state, thereby creating a greater level of consistency and uniformity for all residents. The TPA can be used as a tool to overcome the utilities’ reluctance to offer energy efficiency programs to their customers. In addition, the TPA can play a critical role for smaller utilities, primarily cooperatives and municipal utilities that may not have the expertise or personnel to run energy efficiency programs economically.
While Vermont, New York and Wisconsin each have a TPA which is operational and has been successful in delivering energy efficiency programs across their respective states, Indiana’s TPA in still in the startup phase. The TPA typically manages a portfolio of programs which are marked to customers across the state. The types of programs operated by the TPA include —
Measurement and Evaluation of Energy SavingsAs public policy shifted from simply spending ratepayer funds on energy efficiency programs to establishing targets for energy savings, the accurate measurement, evaluation and verification of these savings has taken on a more important role. Policymakers and utilities want to ensure that (1) the utilities are actually meeting the energy efficiency targets, (2) that ratepayer funds are being judiciously spent, and (3) that the energy efficiency programs are cost effective. Simply stated, the Lawrence Berkeley National Laboratory (LBNL) has defined Evaluation as “the performance of studies and activities aimed at determining the effects of an energy efficiency program or portfolio.”19 In the same report, LBNL defined Measurement and Verification as “Data collection, monitoring, and analysis associated with the calculation of gross energy and demand savings from individual sites or projects.” 20 When properly done, EM&V provides policymakers and utilities with the necessary tools to ensure that energy savings are achieved in a cost-effective manner.
Consistent measurement and reporting is a logical and necessary part of any energy efficiency program or portfolio. Policymakers need effective evaluation, measurement and verification (EM&V) for both transparency and credibility purposes. Evaluation is important for a variety of reasons:
• Allows policymakers to ensure that ratepayer funds are being spent prudently • Helps highlight that energy efficiency is a resource that can be counted on now and in the future • Demonstrates the ability to rely on and plan energy efficiency as part of the utility’s broader resources • Enables policymakers and utilities to show consistency as well as create a common denominator across utilities and states
Residential Programs Home Performance with Energy Star Residential Lighting Program Home Energy Audit Program Appliance Recycling Multifamily Programs HVAC programs Low Income Weatherization Program Educational Program
Commercial & Industrial Programs Prescriptive incentives for common technologies such as T-8 or T-5 lighting High efficiency motor and pumps HVAC equipment Agricultural programs Commercial Refrigeration programs Programs aimed at specific market segments (restaurants, big box stores, etc)
Energy Efficiency Policies, Programs, and Practices in the Midwest: A Resource Guide for Policymakers28
STAT
EWID
E EN
ERG
Y EF
FICI
ENCY
PO
LICI
ES Measurement and Evaluation of Energy Savings, con’t
Because policymakers need to ensure that the EM&V is unbiased and accurate, the analysis is nearly always conducted by an independent consultant, and the results are submitted to the appropriate regulatory body. In general, the expense of conducting the EM&V analysis is incorporated into the program costs, and is therefore borne by the ratepayer. Typically, the cost of performing a thorough EM&V analysis is between 3-5% of the program costs.
One of the current problems facing regulators and utilities is that different methodologies are used by the independent consultants to conduct the EM&V analysis. This makes it difficult to compare programs from utility-to-utility or on a regional basis. It has also made the regional transmission system operators reluctant to allow efficiency to be bid into the market, because of uncertainty related to the reliability of the energy savings.
In the Northeast and Mid-Atlantic, policymakers, utilities, consultants and others are realizing benefits of addressing EM&V on a regional basis. By doing so, they are achieving a greater level of consistency across the region, thereby making it possible to bid energy efficiency into the forward capacity markets operated by the independent system operators. The Northeast Energy Efficiency Partnerships (NEEP) convened a regional EM&V Forum, bringing together interested stakeholders “to support the development and use of consistent protocols to evaluate, measure, verify, and report the savings, costs, and emission impacts of energy efficiency and other demand-side resources.” 21 The success of NEEP’s EM&V Forum is demonstrated by the Regional Transmission Organizations (NY ISO and ISO New England) allowing energy efficiency to be bid into the market.
Building on the efforts in the Northeast, the U.S. Department of Energy has launched the Uniform Methods Project to “establish easy-to-follow protocols based on commonly accepted engineering and statistical methods for determining gross savings for a core set of commonly deployed energy efficiency measures.” 22 In addition, DOE is also addressing EM&V protocols through the State and Local Energy Efficiency Action Network’s (SEE Action) Evaluation, Measurement, and Verification Working Group. The Working Group is addressing the credibility of the data, the timing of results, and the costs of the analysis. Both of these initiatives have representatives from the Midwest. For those state policymakers who are unable to actively participate in either the Uniform Methods Project or the SEE Action initiatives, it is important that at a minimum they follow the developments of these organizations and discuss the potential implications within their jurisdiction.
Cost Effectiveness TestsIn evaluating energy efficiency programs and portfolios, regulator and utilities want to ensure that the activities are cost-effective. In doing so, they compare the relative performance of an energy efficiency investment to the cost of energy produced and delivered in the absence of such an investment. There are five tests used in evaluating the cost-effectiveness of energy efficiency programs originated in California’s 1983 manual, Standard Practice for Cost-Benefit Analysis of Conservation and Load Management Programs. The tests introduced in that manual, with some updates, are still used today for determining cost-effectiveness of energy efficiency at the measure, project, program, and portfolio level. 23 The total resource cost test (TRC) is the most commonly used benefit-cost test for determining whether a program is worth pursuing, though the requirement for that test to quantify non-energy benefits has caused some to suggest 24 that the program administrator cost test (PACT) would be more appropriate for this purpose. Table 11 provides the benefits, costs, strengths, and weaknesses of each test, and Table 12 identifies that cost effectiveness tests that are utilized in the Midwest.
(see next page for Table 11)
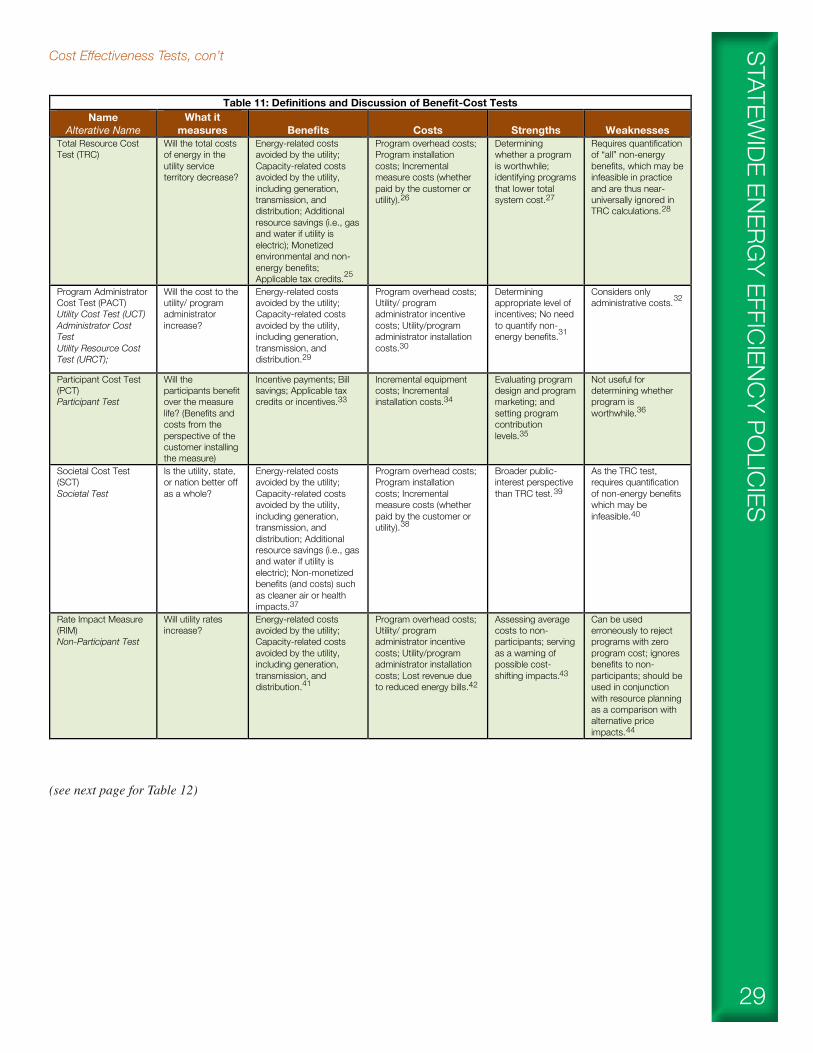
29
STATEWIDE ENERG
Y EFFICIENCY POLICIES
Cost Effectiveness Tests, con’t
(see next page for Table 12)
!"#$%&"'()*&+*$%",)-./001"" 22"!"#$%"&'()*+,-#."
"
Table 11: Definitions and Discussion of Benefit-Cost Tests Name
Alterative Name What it
measures Benefits Costs Strengths Weaknesses Total Resource Cost Test (TRC)
Will the total costs of energy in the utility service territory decrease?
Energy-related costs avoided by the utility; Capacity-related costs avoided by the utility, including generation, transmission, and distribution; Additional resource savings (i.e., gas and water if utility is electric); Monetized environmental and non-energy benefits; Applicable tax credits.25
Program overhead costs; Program installation costs; Incremental measure costs (whether paid by the customer or utility). 26
Determining whether a program is worthwhile; identifying programs that lower total system cost.27
Requires quantification of “all” non-energy benefits, which may be infeasible in practice and are thus near-universally ignored in TRC calculations. 28
Program Administrator Cost Test (PACT) Utility Cost Test (UCT) Administrator Cost Test Utility Resource Cost Test (URCT);
Will the cost to the utility/ program administrator increase?
Energy-related costs avoided by the utility; Capacity-related costs avoided by the utility, including generation, transmission, and distribution.29
Program overhead costs; Utility/ program administrator incentive costs; Utility/program administrator installation costs.30
Determining appropriate level of incentives; No need to quantify non-energy benefits.31
Considers only administrative costs. 32
Participant Cost Test (PCT) Participant Test
Will the participants benefit over the measure life? (Benefits and costs from the perspective of the customer installing the measure)
Incentive payments; Bill savings; Applicable tax credits or incentives.33
Incremental equipment costs; Incremental installation costs.34
Evaluating program design and program marketing; and setting program contribution levels.35
Not useful for determining whether program is worthwhile.36
Societal Cost Test (SCT) Societal Test
Is the utility, state, or nation better off as a whole?
Energy-related costs avoided by the utility; Capacity-related costs avoided by the utility, including generation, transmission, and distribution; Additional resource savings (i.e., gas and water if utility is electric); Non-monetized benefits (and costs) such as cleaner air or health impacts.37
Program overhead costs; Program installation costs; Incremental measure costs (whether paid by the customer or utility). 38
Broader public-interest perspective than TRC test. 39
As the TRC test, requires quantification of non-energy benefits which may be infeasible. 40
Rate Impact Measure (RIM) Non-Participant Test
Will utility rates increase?
Energy-related costs avoided by the utility; Capacity-related costs avoided by the utility, including generation, transmission, and distribution.41
Program overhead costs; Utility/ program administrator incentive costs; Utility/program administrator installation costs; Lost revenue due to reduced energy bills.42
Assessing average costs to non-participants; serving as a warning of possible cost-shifting impacts. 43
Can be used erroneously to reject programs with zero program cost; ignores benefits to non-participants; should be used in conjunction with resource planning as a comparison with alternative price impacts. 44
!!!!!!!!!!!!!
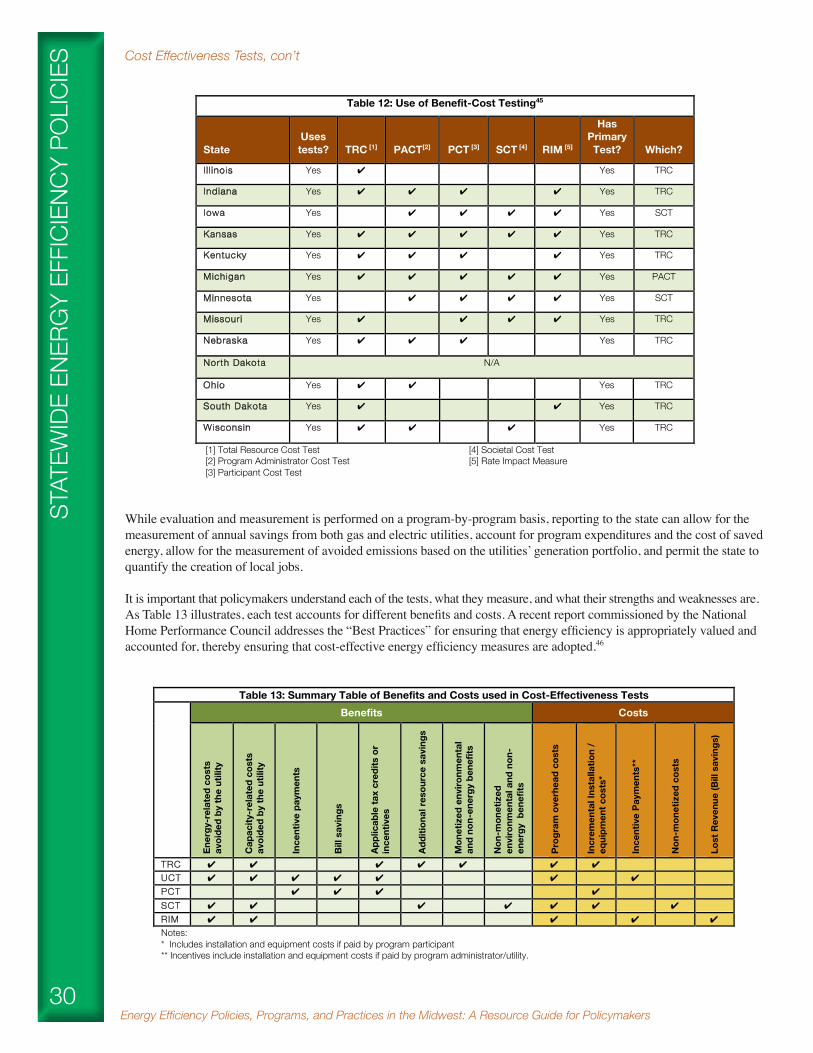
Energy Efficiency Policies, Programs, and Practices in the Midwest: A Resource Guide for Policymakers30
STAT
EWID
E EN
ERG
Y EF
FICI
ENCY
PO
LICI
ES Cost Effectiveness Tests, con’t
While evaluation and measurement is performed on a program-by-program basis, reporting to the state can allow for the measurement of annual savings from both gas and electric utilities, account for program expenditures and the cost of saved energy, allow for the measurement of avoided emissions based on the utilities’ generation portfolio, and permit the state to quantify the creation of local jobs.
It is important that policymakers understand each of the tests, what they measure, and what their strengths and weaknesses are. As Table 13 illustrates, each test accounts for different benefits and costs. A recent report commissioned by the National Home Performance Council addresses the “Best Practices” for ensuring that energy efficiency is appropriately valued and accounted for, thereby ensuring that cost-effective energy efficiency measures are adopted.46
!"#$%&"'()*&+*$%",)-./001"" 22"!"#$%"&'()*+,-#."
"
Table 12: Use of Benefit-Cost Testing45
State
Uses tests?
TRC [1]
PACT[2]
PCT [3]
SCT [4]
RIM [5]
Has Primary Test?
Which?
I l l inois Yes Yes TRC
Indiana Yes Yes TRC
Iowa Yes Yes SCT
Kansas Yes Yes TRC
Kentucky Yes Yes TRC
Michigan Yes Yes PACT
Minnesota Yes Yes SCT
Missouri Yes Yes TRC
Nebraska Yes Yes TRC
North Dakota N/A
Ohio Yes Yes TRC
South Dakota Yes Yes TRC
Wisconsin Yes Yes TRC
[1] Total Resource Cost Test [2] Program Administrator Cost Test [3] Participant Cost Test
[4] Societal Cost Test [5] Rate Impact Measure
!!!!!!!!!!!!!!!!!!!!!!!!!!!
A Best Practices Handbook 35 for Policymakers
Table 13: Summary Table of Benefits and Costs used in Cost-Effectiveness Tests
Benefits Costs
Ene
rgy-
rela
ted
cost
s
avo
ided
by
the
utili
ty
Cap
acity
-rel
ated
cos
ts
avo
ided
by
the
utili
ty
Ince
ntiv
e pa
ymen
ts
Bill
sav
ings
App
licab
le ta
x cr
edits
or
in
cent
ives
Add
ition
al re
sour
ce s
avin
gs
Mon
etiz
ed e
nviro
nmen
tal
a
nd n
on-e
nerg
y be
nefit
s
Non
-mon
etiz
ed
env
ironm
enta
l and
non
- e
nerg
y b
enef
its
Pro
gram
ove
rhea
d co
sts
Incr
emen
tal I
nsta
llatio
n /
e
quip
men
t cos
ts*
Ince
ntiv
e Pa
ymen
ts**
Non
-mon
etiz
ed c
osts
Los
t Rev
enue
(Bill
sav
ings
)
TRC ✔ ✔ ✔ ✔ ✔ ✔ ✔
UCT ✔ ✔ ✔ ✔ ✔ ✔ ✔
PCT ✔ ✔ ✔ ✔
SCT ✔ ✔ ✔ ✔ ✔ ✔ ✔
RIM ✔ ✔ ✔ ✔ ✔
Notes: * Includes installation and equipment costs if paid by program participant ** Incentives include installation and equipment costs if paid by program administrator/utility.
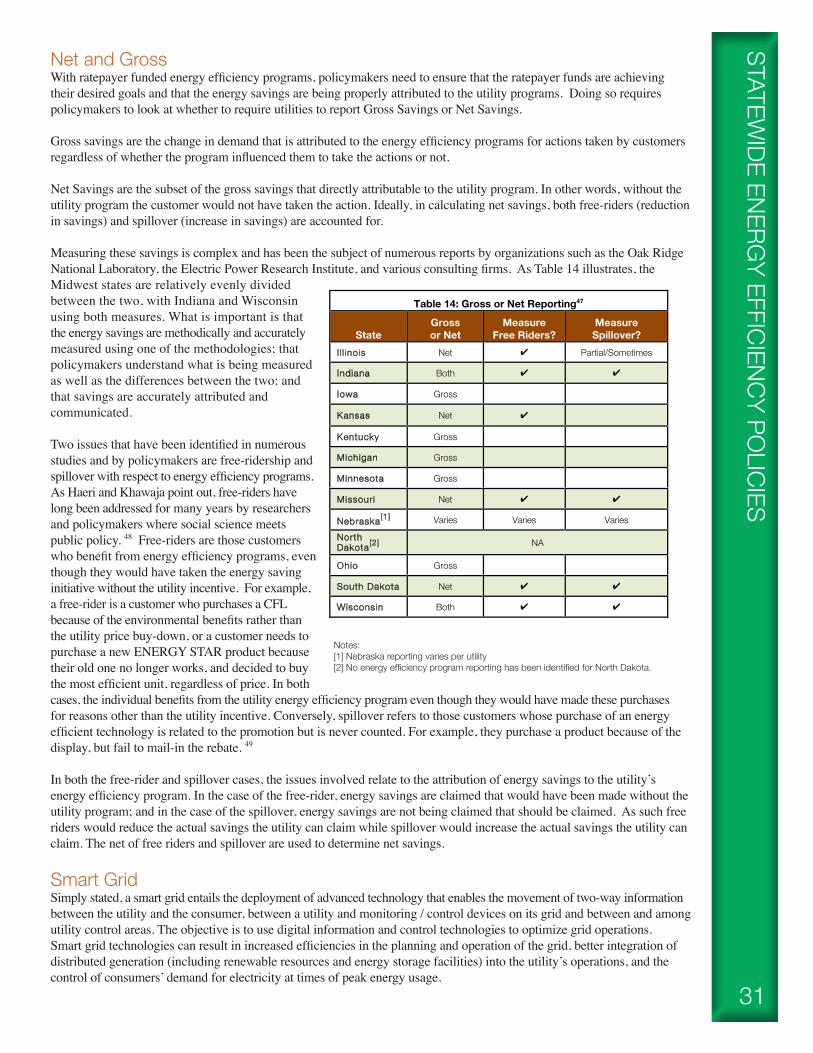
31
Net and GrossWith ratepayer funded energy efficiency programs, policymakers need to ensure that the ratepayer funds are achieving their desired goals and that the energy savings are being properly attributed to the utility programs. Doing so requires policymakers to look at whether to require utilities to report Gross Savings or Net Savings.
Gross savings are the change in demand that is attributed to the energy efficiency programs for actions taken by customers regardless of whether the program influenced them to take the actions or not.
Net Savings are the subset of the gross savings that directly attributable to the utility program. In other words, without the utility program the customer would not have taken the action. Ideally, in calculating net savings, both free-riders (reduction in savings) and spillover (increase in savings) are accounted for.
Measuring these savings is complex and has been the subject of numerous reports by organizations such as the Oak Ridge National Laboratory, the Electric Power Research Institute, and various consulting firms. As Table 14 illustrates, the Midwest states are relatively evenly divided between the two, with Indiana and Wisconsin using both measures. What is important is thatthe energy savings are methodically and accurately measured using one of the methodologies; that policymakers understand what is being measured as well as the differences between the two; and that savings are accurately attributed and communicated.
Two issues that have been identified in numerous studies and by policymakers are free-ridership and spillover with respect to energy efficiency programs. As Haeri and Khawaja point out, free-riders have long been addressed for many years by researchers and policymakers where social science meets public policy. 48 Free-riders are those customers who benefit from energy efficiency programs, even though they would have taken the energy saving initiative without the utility incentive. For example, a free-rider is a customer who purchases a CFL because of the environmental benefits rather than the utility price buy-down, or a customer needs to purchase a new ENERGY STAR product because their old one no longer works, and decided to buy the most efficient unit, regardless of price. In both cases, the individual benefits from the utility energy efficiency program even though they would have made these purchases for reasons other than the utility incentive. Conversely, spillover refers to those customers whose purchase of an energy efficient technology is related to the promotion but is never counted. For example, they purchase a product because of the display, but fail to mail-in the rebate. 49
In both the free-rider and spillover cases, the issues involved relate to the attribution of energy savings to the utility’s energy efficiency program. In the case of the free-rider, energy savings are claimed that would have been made without the utility program; and in the case of the spillover, energy savings are not being claimed that should be claimed. As such free riders would reduce the actual savings the utility can claim while spillover would increase the actual savings the utility can claim. The net of free riders and spillover are used to determine net savings.
Smart GridSimply stated, a smart grid entails the deployment of advanced technology that enables the movement of two-way information between the utility and the consumer, between a utility and monitoring / control devices on its grid and between and among utility control areas. The objective is to use digital information and control technologies to optimize grid operations. Smart grid technologies can result in increased efficiencies in the planning and operation of the grid, better integration of distributed generation (including renewable resources and energy storage facilities) into the utility’s operations, and the control of consumers’ demand for electricity at times of peak energy usage.
STATEWIDE ENERG
Y EFFICIENCY POLICIES
!" # $%&'()#$**+,+&%,)#-./+,+&01#-'.('2301#2%4## -'2,5+,&0#+%#56+48&05#
#
!!!#############################################
Table 14: Gross or Net Reporting47
State Gross or Net
Measure Free Riders?
Measure Spillover?
I l l inois Net Partial/Sometimes
Indiana Both
Iowa Gross
Kansas Net
Kentucky Gross
Michigan Gross
Minnesota Gross
Missouri Net
Nebraska[1] Varies Varies Varies
North Dakota[2] NA
Ohio Gross
South Dakota Net
Wisconsin Both
Notes:[1] Nebraska reporting varies per utility[2] No energy efficiency program reporting has been identified for North Dakota.
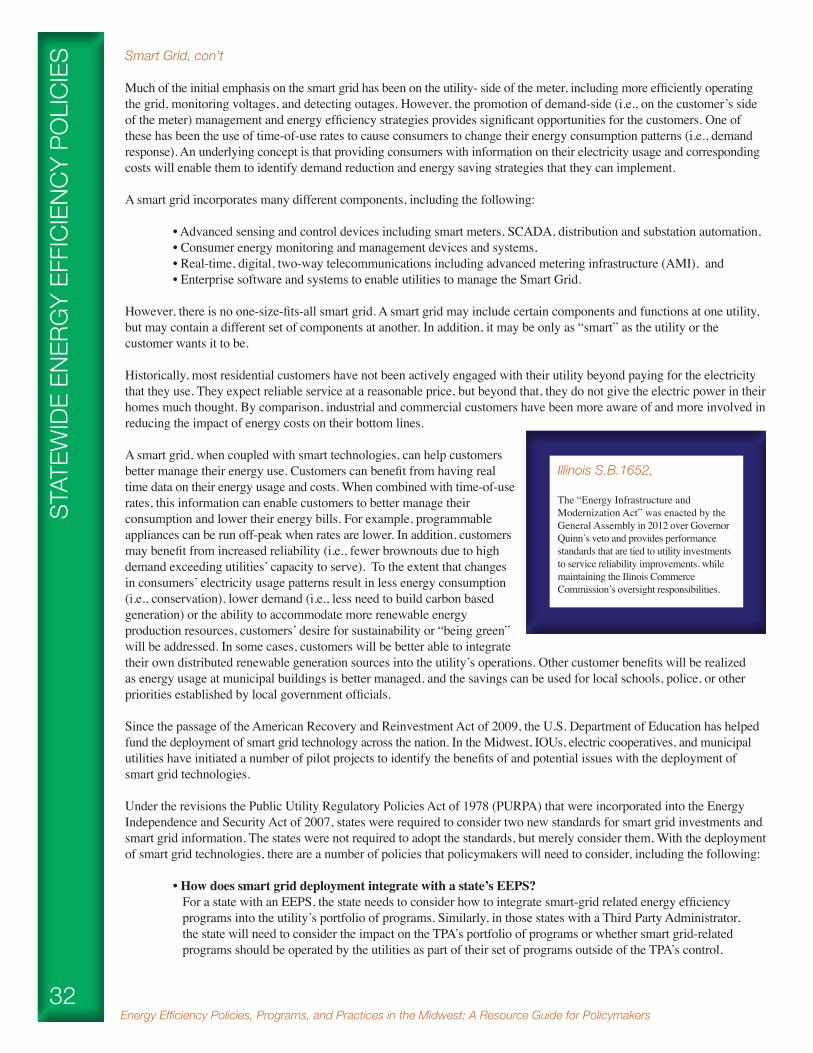
Energy Efficiency Policies, Programs, and Practices in the Midwest: A Resource Guide for Policymakers32
STAT
EWID
E EN
ERG
Y EF
FICI
ENCY
PO
LICI
ES Smart Grid, con’t
Much of the initial emphasis on the smart grid has been on the utility- side of the meter, including more efficiently operating the grid, monitoring voltages, and detecting outages. However, the promotion of demand-side (i.e., on the customer’s side of the meter) management and energy efficiency strategies provides significant opportunities for the customers. One of these has been the use of time-of-use rates to cause consumers to change their energy consumption patterns (i.e., demand response). An underlying concept is that providing consumers with information on their electricity usage and corresponding costs will enable them to identify demand reduction and energy saving strategies that they can implement.
A smart grid incorporates many different components, including the following: • Advanced sensing and control devices including smart meters, SCADA, distribution and substation automation, • Consumer energy monitoring and management devices and systems, • Real-time, digital, two-way telecommunications including advanced metering infrastructure (AMI), and • Enterprise software and systems to enable utilities to manage the Smart Grid.
However, there is no one-size-fits-all smart grid. A smart grid may include certain components and functions at one utility, but may contain a different set of components at another. In addition, it may be only as “smart” as the utility or the customer wants it to be.
Historically, most residential customers have not been actively engaged with their utility beyond paying for the electricity that they use. They expect reliable service at a reasonable price, but beyond that, they do not give the electric power in their homes much thought. By comparison, industrial and commercial customers have been more aware of and more involved in reducing the impact of energy costs on their bottom lines.
A smart grid, when coupled with smart technologies, can help customers better manage their energy use. Customers can benefit from having real time data on their energy usage and costs. When combined with time-of-use rates, this information can enable customers to better manage their consumption and lower their energy bills. For example, programmable appliances can be run off-peak when rates are lower. In addition, customers may benefit from increased reliability (i.e., fewer brownouts due to high demand exceeding utilities’ capacity to serve). To the extent that changes in consumers’ electricity usage patterns result in less energy consumption (i.e., conservation), lower demand (i.e., less need to build carbon based generation) or the ability to accommodate more renewable energy production resources, customers’ desire for sustainability or “being green” will be addressed. In some cases, customers will be better able to integrate their own distributed renewable generation sources into the utility’s operations. Other customer benefits will be realized as energy usage at municipal buildings is better managed, and the savings can be used for local schools, police, or other priorities established by local government officials.
Since the passage of the American Recovery and Reinvestment Act of 2009, the U.S. Department of Education has helped fund the deployment of smart grid technology across the nation. In the Midwest, IOUs, electric cooperatives, and municipal utilities have initiated a number of pilot projects to identify the benefits of and potential issues with the deployment of smart grid technologies.
Under the revisions the Public Utility Regulatory Policies Act of 1978 (PURPA) that were incorporated into the Energy Independence and Security Act of 2007, states were required to consider two new standards for smart grid investments and smart grid information. The states were not required to adopt the standards, but merely consider them. With the deployment of smart grid technologies, there are a number of policies that policymakers will need to consider, including the following:
• How does smart grid deployment integrate with a state’s EEPS? For a state with an EEPS, the state needs to consider how to integrate smart-grid related energy efficiency programs into the utility’s portfolio of programs. Similarly, in those states with a Third Party Administrator, the state will need to consider the impact on the TPA’s portfolio of programs or whether smart grid-related programs should be operated by the utilities as part of their set of programs outside of the TPA’s control.
Illinois S.B.1652,
The “Energy Infrastructure and Modernization Act” was enacted by the General Assembly in 2012 over Governor Quinn’s veto and provides performance standards that are tied to utility investments to service reliability improvements, while maintaining the Ilinois Commerce Commission’s oversight responsibilities.

33
STATEWIDE ENERG
Y EFFICIENCY POLICIES
Smart Grid, con’t
• How are smart grid cost recovered? As with other investments in energy efficiency programs, the state commissions or rate setting body will need to add how smart grid costs are recovered.
• What information will the commission need to approve smart grid deployment and recovery of the associated costs? In making its determination of whether to approve a smart grid project, the commission will need to identify what information it needs to conduct a thorough benefit-cost analysis.
• Will the state adopt dynamic pricing (or time-of-use rates)? Dynamic pricing will offer opportunities to incentivize customers to change their habits, not necessarily by saving energy but by changing when they use that energy. With the deployment of home energy management technologies, smart appliances, and automobile charging technologies, customers can be encouraged to use electricity at off-peak times, thereby helping to shave the utility’s peak demand. A number of states and utilities have already adopted dynamic pricing including Illinois, Indiana, Michigan, Ohio, and Wisconsin.
• How will the state and utilities handle the transition to a smart grid? As utilities and states move further toward the deployment of smart grid technologies, it will be necessary to learn from the pilots and determine if there are special issues that need to be handled through the transition.
• How will customers be educated about the benefits of the smart grid? Customers have a lot of questions about what a smart grid is. Knowing that they will be paying for this investment through their rates, they want to know what it is and how they will benefit. The commission should work with the utilities, consumer advocates, and other stakeholders to develop a coordinated education plan and resource center for consumers to access.
• How will customers be engaged to take full advantage of the smart grid? Beyond simply educating customers, they will need to be engaged to take full advantage of smart grid technologies and the potential energy savings technologies and strategies available to them. The commission should work with utilities, consumer advocates, and other stakeholders to develop engagement strategies.
• What do customers need to take full advantage of the smart grid? Residential, commercial, or industrial customers will need access to reliable and meaningful information upon which they can make decisions. The information should be easily and readily available electronically in a web- based format that makes sense for customers.
• How do home energy management systems and smart appliances fit into the EEPS programs? A smart grid will allow customers to take advantage of price signals sent by the utility to curtail their energy usage during times of peak usage. As part of this program, customers will be able to utilize home energy management systems and smart appliances that will respond to these signals. Utilities and regulators will need to identify if there are any programs or policies that can be implemented to encourage customers to invest in these technologies.
• How will customer data be handled? Customers are uncomfortable that their information – from credit information to energy usage – will become publicly available. They are concerned that “big brother” will be watching their energy consumption. Com missions should examine their policies regarding the sharing of customer data with third party vendors. At the same time, commissions will want to ensure that customers have access to their own information and that building owners have access to the aggregated data from their tenants.
• What are the reporting requirements? Commissions will need to determine what reporting information will be required, the format it should be submitted in, and the frequency of the reports.
Across the Midwest there have been a number of smart grid pilot projects, many of which could bring about significant benefits in terms of energy efficiency. According to the Smart Grid Information Clearinghouse, there are smart grid activities taking place in 12 of the 13 Midwestern states. Table 15 identifies the smart grid projects in each of the states. Most of the states have been home to pilot projects by IOUs, electric cooperatives, and municipal utilities.
(see next page for Table 15)
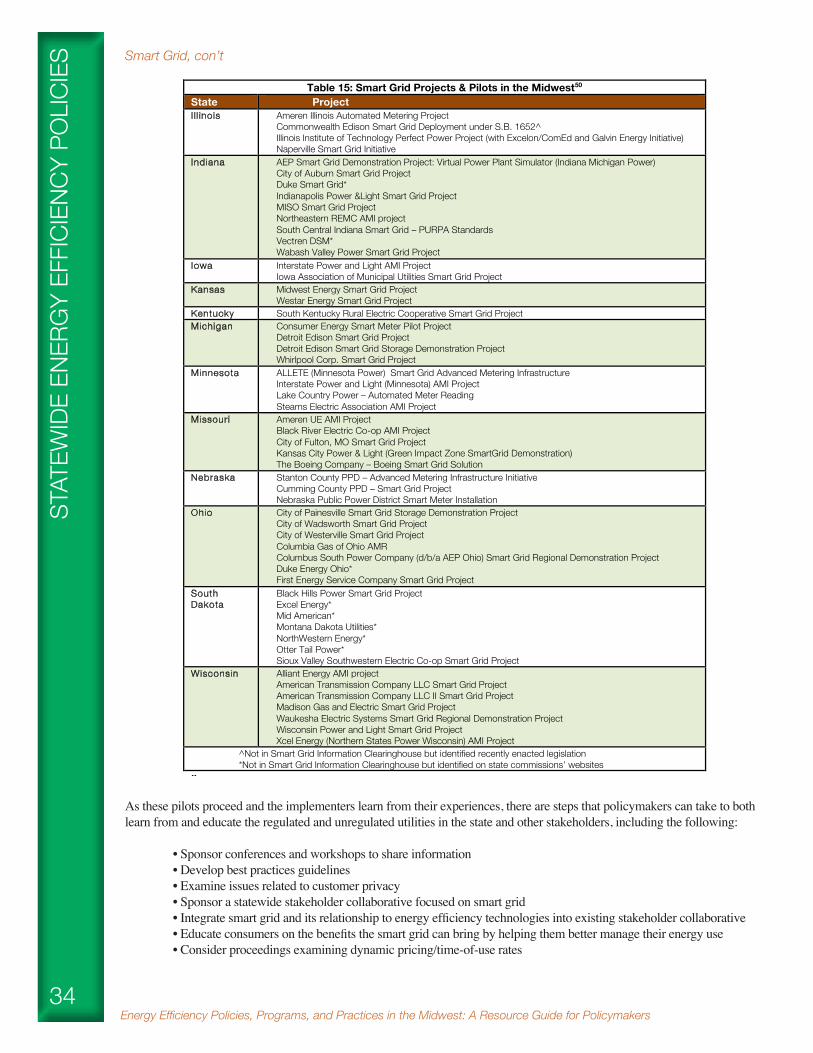
Energy Efficiency Policies, Programs, and Practices in the Midwest: A Resource Guide for Policymakers34
Smart Grid, con’t
As these pilots proceed and the implementers learn from their experiences, there are steps that policymakers can take to both learn from and educate the regulated and unregulated utilities in the state and other stakeholders, including the following:
• Sponsor conferences and workshops to share information • Develop best practices guidelines • Examine issues related to customer privacy • Sponsor a statewide stakeholder collaborative focused on smart grid • Integrate smart grid and its relationship to energy efficiency technologies into existing stakeholder collaborative • Educate consumers on the benefits the smart grid can bring by helping them better manage their energy use • Consider proceedings examining dynamic pricing/time-of-use rates
STAT
EWID
E EN
ERG
Y EF
FICI
ENCY
PO
LICI
ES
!"#$%&"'()*&+*$%",)-./001"" 23"!"#$%"&'()*+,-#."
"
!Table 15: Smart Grid Projects & Pilots in the Midwest50
State Project I l l inois Ameren Illinois Automated Metering Project
Commonwealth Edison Smart Grid Deployment under S.B. 1652^ Illinois Institute of Technology Perfect Power Project (with Excelon/ComEd and Galvin Energy Initiative) Naperville Smart Grid Initiative
Indiana AEP Smart Grid Demonstration Project: Virtual Power Plant Simulator (Indiana Michigan Power) City of Auburn Smart Grid Project Duke Smart Grid* Indianapolis Power &Light Smart Grid Project MISO Smart Grid Project Northeastern REMC AMI project South Central Indiana Smart Grid – PURPA Standards Vectren DSM* Wabash Valley Power Smart Grid Project
Iowa Interstate Power and Light AMI Project Iowa Association of Municipal Utilities Smart Grid Project
Kansas Midwest Energy Smart Grid Project Westar Energy Smart Grid Project
Kentucky South Kentucky Rural Electric Cooperative Smart Grid Project Michigan Consumer Energy Smart Meter Pilot Project
Detroit Edison Smart Grid Project Detroit Edison Smart Grid Storage Demonstration Project Whirlpool Corp. Smart Grid Project
Minnesota ALLETE (Minnesota Power) Smart Grid Advanced Metering Infrastructure Interstate Power and Light (Minnesota) AMI Project Lake Country Power – Automated Meter Reading Stearns Electric Association AMI Project
Missouri Ameren UE AMI Project Black River Electric Co-op AMI Project City of Fulton, MO Smart Grid Project Kansas City Power & Light (Green Impact Zone SmartGrid Demonstration) The Boeing Company – Boeing Smart Grid Solution
Nebraska Stanton County PPD – Advanced Metering Infrastructure Initiative Cumming County PPD – Smart Grid Project Nebraska Public Power District Smart Meter Installation
Ohio City of Painesville Smart Grid Storage Demonstration Project City of Wadsworth Smart Grid Project City of Westerville Smart Grid Project Columbia Gas of Ohio AMR Columbus South Power Company (d/b/a AEP Ohio) Smart Grid Regional Demonstration Project Duke Energy Ohio* First Energy Service Company Smart Grid Project
South Dakota
Black Hills Power Smart Grid Project Excel Energy* Mid American* Montana Dakota Utilities* NorthWestern Energy* Otter Tail Power* Sioux Valley Southwestern Electric Co-op Smart Grid Project
Wisconsin Alliant Energy AMI project American Transmission Company LLC Smart Grid Project American Transmission Company LLC II Smart Grid Project Madison Gas and Electric Smart Grid Project Waukesha Electric Systems Smart Grid Regional Demonstration Project Wisconsin Power and Light Smart Grid Project Xcel Energy (Northern States Power Wisconsin) AMI Project
^Not in Smart Grid Information Clearinghouse but identified recently enacted legislation *Not in Smart Grid Information Clearinghouse but identified on state commissions’ websites
""""""""
35
Efficiency, Customer Choice and Muncipal AggregationHistorically, electric and natural gas utilities were viewed as natural monopolies that needed to be regulated by the state. Simply put, the regulatory compact stated that for a reasonable return on its investment, the utility was obligated to serve every customer within its service territory. The 1990s witnessed the move towards customer choice in the electric utility industry. In the Midwest, Illinois, Michigan, and Ohio made the move towards customer choice, with Illinois and Ohio also allowing for municipal aggregation.
In general, the incumbent utility which delivers the electricity or natural gas is still responsible for providing energy efficiency services to all the customers in its service territory. In Ohio, the Northeast Ohio Public Energy Council, the ag-gregator on behalf of 134 communities, recently released a Request for Proposal indicating its intention to move into the demand-side energy market. In Illinois, the Citizens Utility Board (CUB) has urged residents of communities considering aggregation to “find out what energy efficiency measures, if any, your community plans to include in its contract with an alternative supplier.” 51 CUB notes that energy providers have not yet offered dynamic pricing or time-of-use rates.
STATEWIDE ENERG
Y EFFICIENCY POLICIES
Energy Efficiency Policies, Programs, and Practices in the Midwest: A Resource Guide for Policymakers36
RESI
DENT
IAL
AND
COM
MER
CIAL
EFF
ICIE
NCY Residential and Commercial Efficiency
Home Performance ProgramsHome Performance with ENERGY STAR® (HPwES) is a national program run by the U.S. DOE and sponsored locally by state agencies, utilities, and non-governmental organizations across the country. HPwES connects homeowners with qualified contractors and energy auditors who assess each home’s ‘performance’ and recommend renovations resulting in energy savings and improved home comfort.
Home Performance with ENERGY STAR eliminates the guess-workthat often accompanies home improvement by taking a systems-based building science approach. The first step is a comprehensive home energy assessment which specifies how to address comfort issues and save energy. Next qualified, vetted contractors perform the improvements, which often include sealing up drafts and ductwork, installing wall and attic insulation, and tuning up or replacing heating and cooling equipment. After the upgrade, there is a ‘test-out’ to ensure the upgrade produced the intended results. Furthermore, a quality assurance program works behind the scenes helping contractors hone their craft and improve customer satisfaction while giving homeowners confidence that the home improvements have been completed properly.
There are Home Performance programs operating in 8 Midwestern states: Illinois, Iowa, Kentucky, Michigan, Minnesota, Missouri, Ohio, and Wisconsin. Some utilities offer home performance programs that are not ENERGY STAR programs. In addition, some utilities may offer energy audits and rebates without taking the “whole home” approach. As Table 16 illustrates, there is variation from implementer to implementer regarding the cost to the consumer and the monetary benefits that are available.
(see next page for Table 16)
Milwaukee’s Me2
The City of Milwaukee is positioning itself to be the sustainability leader of the Midwest. Led by the Milwaukee Green Team, the city has adopted policies and implemented programs that seek to align economic and environmental interests. As part of this effort, the city has taken an aggressive approach to promoting and supporting energy efficiency improve-ments. An executive order was signed committing the city government to reducing its energy consumption by 15% by 2012.
The City adopted energy performance measures for all departments, used performance contracting to upgrade city buildings and street lighting for energy efficiency, piloted LEED certification for city buildings, and identified energy saving opportunities for the City Hall complex. In addition, the city sought to build the green economy by developing financing programs for city residents and businesses wishing to make energy efficiency improvements, including incentives for energy savings, financing options for residents and businesses, and an innovative Clean Energy Financing program to help property owners pass on project capital costs to tenants through the use of a Municipal Special Charge. For more information, see SmartEnergyPays.com.
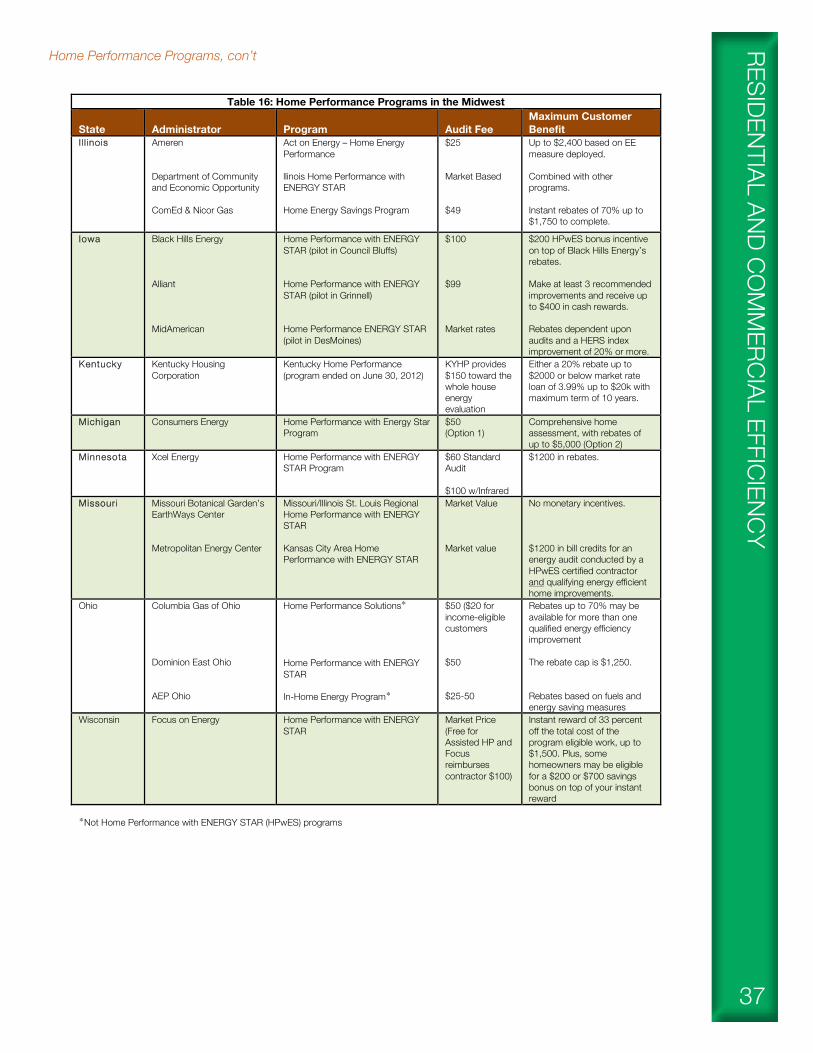
37
Home Performance Programs, con’t RESIDENTIAL AND COM
MERCIAL EFFICIENCY
44 Energy Efficiency Policies, Programs, and Practices in the Midwest
Table 16: Home Performance Programs in the Midwest
State
Administrator
Program
Audit Fee
Maximum Customer Benefit
I l l inois Ameren Department of Community and Economic Opportunity ComEd & Nicor Gas
Act on Energy – Home Energy Performance llinois Home Performance with ENERGY STAR Home Energy Savings Program
$25 Market Based $49
Up to $2,400 based on EE measure deployed. Combined with other programs. Instant rebates of 70% up to $1,750 to complete.
Iowa Black Hills Energy Alliant MidAmerican
Home Performance with ENERGY STAR (pilot in Council Bluffs) Home Performance with ENERGY STAR (pilot in Grinnell) Home Performance ENERGY STAR (pilot in DesMoines)
$100 $99 Market rates
$200 HPwES bonus incentive on top of Black Hills Energy’s rebates. Make at least 3 recommended improvements and receive up to $400 in cash rewards. Rebates dependent upon audits and a HERS index improvement of 20% or more.
Kentucky Kentucky Housing Corporation
Kentucky Home Performance (program ended on June 30, 2012)
KYHP provides $150 toward the whole house energy evaluation
Either a 20% rebate up to $2000 or below market rate loan of 3.99% up to $20k with maximum term of 10 years.
Michigan Consumers Energy Home Performance with Energy Star Program
$50 (Option 1)
Comprehensive home assessment, with rebates of up to $5,000 (Option 2)
Minnesota Xcel Energy Home Performance with ENERGY STAR Program
$60 Standard Audit $100 w/Infrared
$1200 in rebates.
Missouri Missouri Botanical Garden’s EarthWays Center Metropolitan Energy Center
Missouri/Illinois St. Louis Regional Home Performance with ENERGY STAR Kansas City Area Home Performance with ENERGY STAR
Market Value Market value
No monetary incentives. $1200 in bill credits for an energy audit conducted by a HPwES certified contractor and qualifying energy efficient home improvements.
Ohio Columbia Gas of Ohio Dominion East Ohio AEP Ohio
Home Performance Solutions✻ Home Performance with ENERGY STAR In-Home Energy Program✻
$50 ($20 for income-eligible customers $50 $25-50
Rebates up to 70% may be available for more than one qualified energy efficiency improvement The rebate cap is $1,250. Rebates based on fuels and energy saving measures
Wisconsin Focus on Energy Home Performance with ENERGY STAR
Market Price (Free for Assisted HP and Focus reimburses contractor $100)
Instant reward of 33 percent off the total cost of the program eligible work, up to $1,500. Plus, some homeowners may be eligible for a $200 or $700 savings bonus on top of your instant reward
✻Not Home Performance with ENERGY STAR (HPwES) programs
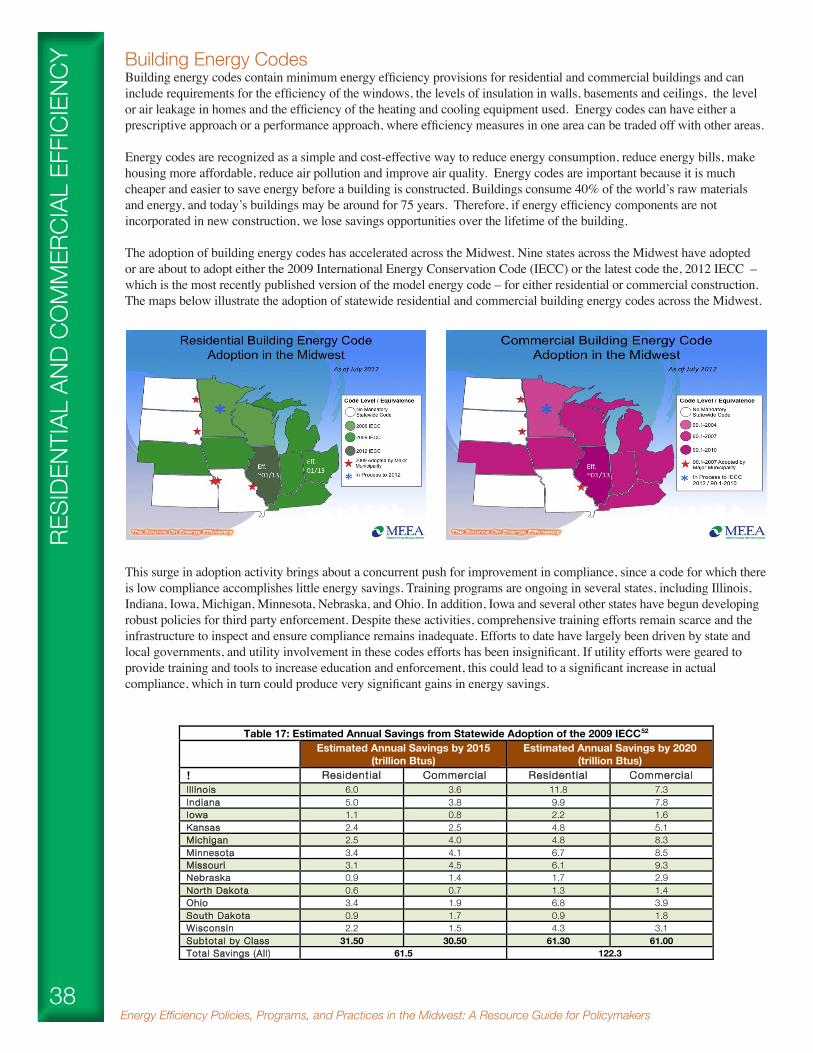
Energy Efficiency Policies, Programs, and Practices in the Midwest: A Resource Guide for Policymakers38
RESI
DENT
IAL
AND
COM
MER
CIAL
EFF
ICIE
NCY Building Energy Codes
Building energy codes contain minimum energy efficiency provisions for residential and commercial buildings and can include requirements for the efficiency of the windows, the levels of insulation in walls, basements and ceilings, the level or air leakage in homes and the efficiency of the heating and cooling equipment used. Energy codes can have either a prescriptive approach or a performance approach, where efficiency measures in one area can be traded off with other areas.
Energy codes are recognized as a simple and cost-effective way to reduce energy consumption, reduce energy bills, make housing more affordable, reduce air pollution and improve air quality. Energy codes are important because it is much cheaper and easier to save energy before a building is constructed. Buildings consume 40% of the world’s raw materials and energy, and today’s buildings may be around for 75 years. Therefore, if energy efficiency components are not incorporated in new construction, we lose savings opportunities over the lifetime of the building.
The adoption of building energy codes has accelerated across the Midwest. Nine states across the Midwest have adopted or are about to adopt either the 2009 International Energy Conservation Code (IECC) or the latest code the, 2012 IECC – which is the most recently published version of the model energy code – for either residential or commercial construction. The maps below illustrate the adoption of statewide residential and commercial building energy codes across the Midwest.
This surge in adoption activity brings about a concurrent push for improvement in compliance, since a code for which there is low compliance accomplishes little energy savings. Training programs are ongoing in several states, including Illinois, Indiana, Iowa, Michigan, Minnesota, Nebraska, and Ohio. In addition, Iowa and several other states have begun developing robust policies for third party enforcement. Despite these activities, comprehensive training efforts remain scarce and the infrastructure to inspect and ensure compliance remains inadequate. Efforts to date have largely been driven by state and local governments, and utility involvement in these codes efforts has been insignificant. If utility efforts were geared to provide training and tools to increase education and enforcement, this could lead to a significant increase in actual compliance, which in turn could produce very significant gains in energy savings.
!"#$%&"'()*&+*$%",)-./001"" 23"!"#$%"&'()*+,-#."
"
!!
Table 17: Estimated Annual Savings from Statewide Adoption of the 2009 IECC52 Estimated Annual Savings by 2015
(trillion Btus) Estimated Annual Savings by 2020
(trillion Btus) ! Residential Commercial Residential Commercial I l l inois 6.0 3.6 11.8 7.3 Indiana 5.0 3.8 9.9 7.8 Iowa 1.1 0.8 2.2 1.6 Kansas 2.4 2.5 4.8 5.1 Michigan 2.5 4.0 4.8 8.3 Minnesota 3.4 4.1 6.7 8.5 Missouri 3.1 4.5 6.1 9.3 Nebraska 0.9 1.4 1.7 2.9 North Dakota 0.6 0.7 1.3 1.4 Ohio 3.4 1.9 6.8 3.9 South Dakota 0.9 1.7 0.9 1.8 Wisconsin 2.2 1.5 4.3 3.1 Subtotal by Class 31.50 30.50 61.30 61.00 Total Savings (Al l ) 61.5 122.3
!!!!!!!!!!!!!!!!!!!!!!!!!!!!!!!!!!

39
Building Energy Codes, con’t
The potential energy savings from the adoption of the 2009 International Energy Conservation Code (IECC) for residential dwellings and the ASHRAE 90.1-2007 standard (or equivalent 2009 IECC) for non-residential structures across the Midwest (Table 17) totals 61.5 trillion Btus per year by 2015 (assuming a 100% compliance rate); a figure that doubles by 2020 reflecting the rapid accumulation of savings once codes are in place. The 2015 savings are equivalent to the energy use of over 500,000 Midwest households 53. As these numbers clearly indicate, there are tremendous energy savings attainable through the adoption of building energy codes. In addressing building codes, policymakers need to examine three distinct areas: adoption, compliance, and measurement. In addition, stakeholders need to be involved throughout the process. Each has its own set of issues, and yet each is related and informs the other. Following are some best practices for each of the three areas:
1. Adoption 2. Compliance 3. Measurement
Adoption –Automatic adoption of the latest code – The most straightforward approach to ensure that the latest building energy code is adopted is for the state egislature to enact legislation requiring its automatic adoption. In the Midwest, only Illinois has such a provision on the books. Wisconsin has a requirement that the latest code be considered.
Statewide adoption – Statewide adoption of the latest code provides for consistency across the state, thereby avoiding a patchwork of different codes in different jurisdictions. This helps ensure that contractors, inspectors, and others involved in the building process are following the same code regardless of the local jurisdiction. In home-rule states, where statewide adoption is not practical, MEEA urges the largest political subdivisions (cities and counties) to adopt the latest code and encourages the smaller jurisdictions nearby to follow their lead. It is important, as much as possible, to adopt for the suite of codes published by the ICC. Many of the codes, such as the Residential and Mechanical code, contain requirements that are interrelated with those in the energy code.
State-Specific Amendments – For states that do not automatically adopt the latest energy code, it is critical that their amendments do not water-down or weaken the stringency of the code. When all is said and done, the energy performance of a building built under a modified code, should be equivalent to that of built under the national building energy code. The only difference should be: how they got there.
Stretch Codes – In adopting an energy code, policymakers should ensure that it incorporates an appendix with more stringent standards. These are often called “stretch codes.”
Compliance – Any law, ordinance or regulation that requires some form of enforcement is relatively useless without the tools and resources need to enforce it. A building code without an enforcement mechanism is simply a list of recommendations. But just like safety codes, energy codes need to be enforced. However, in these economic times, local governments lack the financial and other resources necessary to enforce building energy codes. To address these hurdles, policymakers should look at funding mechanisms and other means of accessing the human capital needed to enforce energy codes.
Despite a significant amount of resources devoted to the issue from code officials, practitioners and code advocates, compliance with the energy code remains low. The few studies on the subject indicate that, on average, compliance rates range between 16% to 70%.
RESIDENTIAL AND COM
MERCIAL EFFICIENCY

Energy Efficiency Policies, Programs, and Practices in the Midwest: A Resource Guide for Policymakers40
RESI
DENT
IAL
AND
COM
MER
CIAL
EFF
ICIE
NCY Building Energy Codes, con’t
Many reasons exist for this situation:
• Local building departments and state code offices are chronically underfunded; • The energy code changes much more rapidly (especially lately) than other codes making it difficult for both practitioners and officials to keep up with the latest requirements; and, • Building officials rightly focus on quality of life and safety first.
Even in states with a strong enforcement infrastructure such as California, non-compliance rates vary from 28% to 100% for specific items (within a certain amount of error) (Khawajah 2007). Table 18 summarizes some recent studies (over the past 10 years) of energy code compliance rates.2
Fee Structure – As with building safety inspections, a fee structure needs to be established for plan review and inspecting. While the fee needs to be high enough to cover the expenses, it can’t be so high as to discourage construction. The fee needs to create a dedicated funding stream for building energy codes to ensure that it is not used to cover other governmental expenses.
Third Party Inspection – Many local governments lack the resources to adequately enforce the safety codes, let alone the energy codes. One approach to address this resource issue is for local governments to rely on independent, third-party inspectors who have specialized knowledge of the energy code. These individuals contract with either the building department or the permit applicant. Regardless of whom they contract with, they are empowered with the authority to review plans for compliance with the energy code as well as with the enforcement and inspection authority relating to the building energy code during the construction. In developing a Third-Party Inspection program, the local government must ensure that –
• Inspectors are overseen or been approved by the government agency or Registered Design Professional. • The Inspector or inspection firm has no financial interest in the project being inspected. • That inspection reports are reviewed and approved by the appropriate government agency. • The inspector has the appropriate certifications that are the result of having passed the necessary examinations.
Utility Building Code Programs – Utilities have the potential to be useful partners in improving compliance rates. Through work in new construction programs for both commercial and residential buildings, many utilities have expertise in the construction of energy efficient buildings and are familiar with code compliance. From this experience, utilities can become partners in developing and providing the necessary training, education and tools that would drive an improvement in compliance. Utilities, however, should not be involved in the actual inspection and determination of compliance for a given building. That work should always be left to state or local building inspectors or designated third party inspectors.
Utilities can provide assistance to local enforcement of building codes by —
• Sponsoring training programs for local building officials and builders • Conducting a “gap analysis” for the state inspection infrastructure that identifies other obstacles and hurdles that hinder the ability of building departments to achieve full compliance • Providing performance test rebates for diagnostic testing for air infiltration and duct leakage • Creating statewide utility groups addressing compliance with building energy codes • Maintaining a catalog of “Special Plan Examiners and Inspectors” who are trained in the energy code as a supplement to code officials, and who could then reduce the burden on code officials with respect to the energy code • Measuring energy savings attributable to utility programs
!" # $%&'()#$**+,+&%,)#-./+,+&01#-'.('2301#2%4## -'2,5+,&0#+%#56+48&05#
#
!
!
!
!
!
!
!
!
!
!
!
!
!
!
!
!
!
!
!
!
!
!
!
!
Table 18: Code Compliance Rates Achieved by Selected States State Code Residential
Compliance Rate Source
Maine No statewide code at the time
16% PUC and Maine Housing (2008)54
Massachusetts 1998 MA Residential Code
46.4% for Envelope
20% for Duct Sealing
XEnergy (2001)55
Vermont 2005 Vermont Residential Building
Energy Code
70% NMR et.al. (2009)56
2 Please note that the methodology across the studies vary widely. Currently, efforts are being made by the Department of Energy to standardize code compliance evaluation. More information is coming on compliance rates in the Midwest. Currently, PNNL is running compliance evaluation pilot studies in three Midwest states: Illinois, Iowa, and Wisconsin.

41
Building Energy Codes, con’t
Given the opportunity of new code adoption in the Midwest and the increased efficiency funding (and savings targets) of Midwestern utilities, the time is ripe for the exploration of how utilities can support increased code compliance and implementation of stretch codes.
What the Midwest must do is gather the proper stakeholders together (state and local code officials, state energy officials, utilities, regulators, evaluators, etc.) and begin to discuss how utilities can get involved and how to attribute savings to their involvement. Utilities need to be assured that if they use ratepayer funds to support codes work that they will be allowed to claim savings and also be evaluated fairly and properly. Once such an arrangement is created in the codes program it should be applicable across the entire state and could be a model for other states in developing their own codes programs. Consequently, to make this type of policy work it will require working out of a number of technical and policy related issues that include the following:
• Specifying the appropriate role for utilities • Fully describing the methodology for determining, attributing and allocating energy savings • Developing the appropriate methodology to determine cost effectiveness • Understanding the state specific process involved in setting up this type of program • Ensuring that all stakeholders understand and support the program • Integrating the program into the utilities’ portfolio of energy efficiency programs and ensuring they receive credit towards the requirements under the states’ respective Energy Efficiency Resource Standard
For more information regarding utility assistance on building energy codes, see MEEA’s report, Utility Programs and Building Energy Codes.
Measurement — As with other energy efficiency programs, measurement of energy use is a critical component to ensure that the energy savings promised through energy codes are actually achieved. In some cases, the building may actually achieve greater energy savings than anticipated, while in other cases the savings may not be a great. The question is how to identify what energy savings are actually achieved.
Implement a “Commissioning” Requirement – When a new building is constructed or older buildings are retrofitted using energy efficient practices, it is assumed that they will save energy as compared to the same building not built to the standard. The goal of commissioning is to ensure that the building meets or exceeds the energy savings that are anticipated. Commissioning is a systematic quality assurance process. This requirement typically focuses on commercial construction.
One approach to ensure that the energy savings are accurately measured is to require a building commissioning within the building code. By doing so, the home or building owner will know that their investment in an energy efficient design was properly implemented and will be able to account for their energy savings, while policymakers are ensuring that the energy savings are accurately measured.
Stakeholder Involvement —There are a number of groups that need to be involved in the code process, including code officials, architects, contractors, homebuilders, advocates, and others interested in and knowledgeable of building energy codes. This stakeholder group, or technical advisory committee, should meet regularly and on an ongoing basis to address implementation of the current code as well as changes that are coming about with future revisions.
RESIDENTIAL AND COM
MERCIAL EFFICIENCY
Touchstone Energy Homes
Touchstone Energy Cooperatives is the nationwide branding alliance of more than 700 rural electric systems. As part of its energy efficiency programs, Touchstone Energy created the “Touchstone Energy Home” which creates standards for a new home to be recognized by the owner’s investment in energy efficiency upgrades, Unlike the Energy Star home program which relies on a point system, to qualify for the Touchstone Energy Home designation, a home must meet or exceed all the requirements and not simply reach a specified point score. The requirements will differ by geographic zone, and there is flexibility for individual cooperatives to set higher standards and to offer rebates or other incentives.
In the Midwest, the cooperatives in Iowa, Indiana, and Kentucky supported building contractors in receiving the necessary training and have seen Touchstone Energy homes built in their service territories. For more information, see www.touchstoneenergy.coop.
Energy Efficiency Policies, Programs, and Practices in the Midwest: A Resource Guide for Policymakers42
Benchmarking Across the nation, policymakers at the state and local levels are recognizing the importance of benchmarking energy per-formance of commercial buildings. Benchmarking provides buildings owners and operators with a baseline for measuring improvements, identifies buildings performing poorly in comparison to others, and can create a competitive environment among building owners to encourage greater energy efficiency performance. Cities and states have taken actions requiring property owners – or the government, itself – to benchmark building energy consumption. For example, San Francisco requires all “owners of nonresidential buildings…to obtain energy audits, as well as to annually measure and disclose performance.” 57 Philadelphia enacted a city ordinance in June 2012, requiring the benchmarking and reporting of energy and water usage data for commercial buildings with more than 50,000 square feet of indoor floor space or 50,000 square feet of indoor floor space that is committed to commercial use (see Appendix 1). 58
Some states and municipalities have undertaken efforts to benchmark the governmental buildings, including office buildings, fire and police stations, school buildings, libraries, recreation centers to provide the government with a better understanding of its energy usage and what improvements could be made in its energy management. For example, Nevada requires building owned by the state or in which state agencies are tenants to track energy usage. 59
Access to Tenant Energy ConsumptionOne of the obstacles facing building owners and managers of commercial and multifamily buildings is the lack to aggregate data on energy consumption by their tenants. This hinders the building owner’s ability to manage energy efficiently as well as to comply with benchmarking and disclosure requirements that have been set by local jurisdictions.
When electricity to tenants is individually metered, the usage data belongs to the tenants, and utilities are reluctant to provide it, even in aggregate form, to the building owner. In some cases, utilities will provide this data when the tenants have granted their permission. However, in a large office and apartment building with many tenants, this may not be practical. In an attempt to overcome this barrier, some building owners are getting permission included within their leases, but, this does not adequately resolve the issue in either near-term or long-term.
Recognizing that access to this information is a state issue, the National Association of Regulatory Utility Commissioners passed a resolution in 2011 acknowledging “the need for commercial building owners to access whole building energy consumption data to support energy-efficient building operations” and encouraged state public utility commissions to take “all reasonable measures to facilitate convenient, electronic access to utility energy usage data for building owners, including aggregated building data that does not reveal customer-specific data to protect.” 60
Some states have taken action either legislatively or through regulation to address this issue. In California, AB 1103 (2007) required utilities to maintain energy use data in a format compatible for uploading into Portfolio Manager. While this information is used to support benchmarking initiatives in California, it is also helping building owners and managers better manage the energy consumption in their buildings. The Washington State legislature passed SB 5854 (2009) states that —Upon receiving written authorization or secure electronic authorization of a nonresidential building owner or operator, a qualifying utility shall upload the energy consumption data for the accounts specified by the owner or operator for a building to the United States environmental protection agency’s energy star portfolio manager in a form that does not disclose personally identifying information.
Commonwealth Edison is a nationwide leader in ensuring that building owners have access to the aggregate data of their tenants. In its February 6, 2008, Order on ComEd’s Energy Efficiency and Demand Response programs (Docket 07-0540), the Illinois Commerce Commission approved ComEd’s plan to provide building data to commercial customers who participate in its Business Solutions programs. In addition, the Commission urged ComEd to work with the Building Owners and Managers Association International (BOMA) and “encourage[d] ComEd to provide whatever information it has to BOMA members, and to consider developing methodologies that will aid BOMA and other large commercial consumers with regard to their electric usage decisions.´
Commercial building owners and managers can enroll in ComEd’s Energy Usage Data Systems program by providing some basic information regarding the building(s) that they wish to sign up for the program. They are also required to enroll in the U.S. Environmental Protection Agency’s Energy Star Portfolio Manager. Once the enrollment is complete, data flows from ComEd’s system to EPA’s Portfolio Manager in a seamless and confidential manner. Data regarding specific tenants or even floors are kept confidential to ensure customer privacy.
RESI
DENT
IAL
AND
COM
MER
CIAL
EFF
ICIE
NCY

43
Access to Tenant Energy Consumption, con’t
With this data in hand, building owners and managers can benchmark their buildings and better manage the energy con-sumption. In addition, nongovernmental entities can use this data to take advantage of rebates and other incentives offered by ComEd to improve the performance of their buildings. In the four years since this the Energy Usage Data Systems program was launched more than 3000 buildings – office buildings, shopping centers, data centers, schools, hospitals, and government entities – are gaining access to their energy data on a regular basis.
Disclosing Estimated Energy Costs Up FrontRelated approach adopted by some states and communities is to require the disclosure of estimated energy costs before either the sale of a property or the signing of a lease. For leases, landlords are required to provide estimated energy costs to potential tenants before the signing of the lease. Such a requirement canbe made for either residential or commercial leases. This information allows prospective tenants to consider energy costs as part of their budgeting and decision-making process. At the same time, with this information publicly available, it encourages the landlord/building owner to take steps to make the rental property more energy efficient. The State of Maine had such a requirement since 2006. 61 The Maine statute required the state Public Utilities Commission to file a report on the effectiveness of the statute in disseminating the information to tenants. In the Midwest and on the local level, Ann Arbor, Mich. has required landlords to disclose information for more than 25 years.
Similarly, around the nation, communities have adopted ordinances requiring that energy usage be disclosed prior to the sale of an existing or new home, and that estimated energy consumption be disclosed for new homes. In some instances, municipalities are requiring energy audits be performed. For example, Austin, Texas requires a homeowner who is selling a home that is 10 years old or older disclose the results of a required energy audit to potential homebuyers during the “option period” during which a homebuyer can cancel the contract. Similar to the ordinances adopted for rental properties, requirements such as Austin’s allows the homebuyer to compare the total monthly costs of multiple houses. It also allows sellers of energy efficient houses to potentially ask more of their houses because of the investments that they’ve made to improve the house’s performance.
Environmental Health and Indoor Air QualityAs homes and other buildings are made more efficient, the building envelope is made tighter which can lead to other issues which policymakers, builders, and owners may need to consider. A tight building means that it traps unwanted gases and fumes inside the structure. At the same time, fresh air from outdoor sources does not naturally seep into the structure. To address this issue, some communities and utilities require air quality testing to be done as part of their energy efficiency home improvement or new home construction programs. Such testing can entail testing from radon as well as gases that are “off gassed” from common household products like paints, carpeting, and countertops as well as from mechanical equipment such as furnaces and water heaters. In order to take full advantage of the financial incentives, the owner may need to address any issues that are found in the in air quality testing that is done once the structure is sealed.
RESIDENTIAL AND COM
MERCIAL EFFICIENCY
Greening the MLS
The Multiple Listing Service, or MLS, allows prospective home-buyers or renters to search for a house, townhouse, condominium, or apartment that meets the needs of their family. Efforts are being made across the nation to provide green features and certifications within the MLS listing. For example, informa-tion regarding the residence is Energy Star Certified, has achieved LEED for Home standards, its HERS rating, Energy Star appliances, energy efficient windows, low-e windows, and other green features would be searchable within the MLS database.
In the Midwest, the MLS databases for Chicago, IL; Des Moines, IA; Elkhart County, IN; and Traverse City, MI include green features. See Appendix 3 for a sample MLS form with green fields from The Multiple Listing Service of Elkart County, Inc.
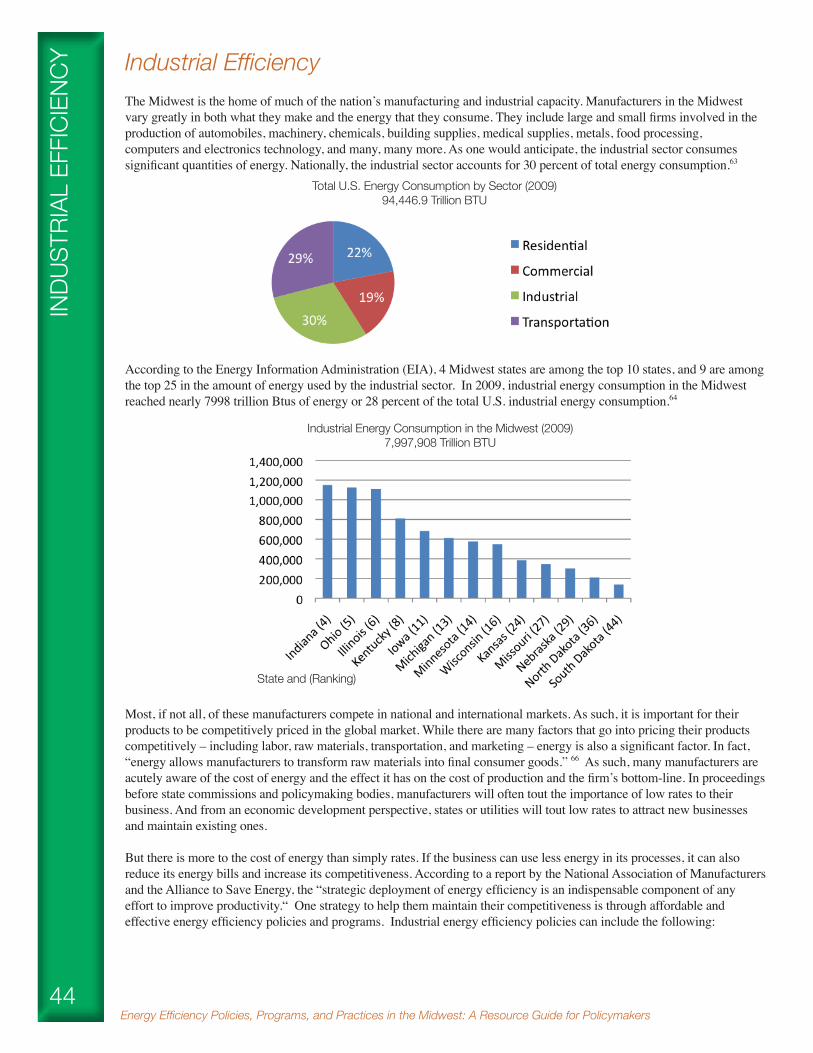
Energy Efficiency Policies, Programs, and Practices in the Midwest: A Resource Guide for Policymakers44
INDU
STRI
AL E
FFIC
IENC
Y Industrial EfficiencyThe Midwest is the home of much of the nation’s manufacturing and industrial capacity. Manufacturers in the Midwest vary greatly in both what they make and the energy that they consume. They include large and small firms involved in the production of automobiles, machinery, chemicals, building supplies, medical supplies, metals, food processing, computers and electronics technology, and many, many more. As one would anticipate, the industrial sector consumes significant quantities of energy. Nationally, the industrial sector accounts for 30 percent of total energy consumption.63
According to the Energy Information Administration (EIA), 4 Midwest states are among the top 10 states, and 9 are among the top 25 in the amount of energy used by the industrial sector. In 2009, industrial energy consumption in the Midwest reached nearly 7998 trillion Btus of energy or 28 percent of the total U.S. industrial energy consumption.64
Most, if not all, of these manufacturers compete in national and international markets. As such, it is important for their products to be competitively priced in the global market. While there are many factors that go into pricing their products competitively – including labor, raw materials, transportation, and marketing – energy is also a significant factor. In fact, “energy allows manufacturers to transform raw materials into final consumer goods.” 66 As such, many manufacturers are acutely aware of the cost of energy and the effect it has on the cost of production and the firm’s bottom-line. In proceedings before state commissions and policymaking bodies, manufacturers will often tout the importance of low rates to their business. And from an economic development perspective, states or utilities will tout low rates to attract new businesses and maintain existing ones.
But there is more to the cost of energy than simply rates. If the business can use less energy in its processes, it can also reduce its energy bills and increase its competitiveness. According to a report by the National Association of Manufacturers and the Alliance to Save Energy, the “strategic deployment of energy efficiency is an indispensable component of any effort to improve productivity.“ One strategy to help them maintain their competitiveness is through affordable and effective energy efficiency policies and programs. Industrial energy efficiency policies can include the following:
Total U.S. Energy Consumption by Sector (2009)94,446.9 Trillion BTU
Industrial Energy Consumption in the Midwest (2009)7,997,908 Trillion BTU
State and (Ranking)

45
Industrial Efficiency, con’t
• Promoting a Robust Portfolio of Utility Energy Efficiency Programs • Combined Heat and Power (CHP) • Tax incentives • Financing • Industrial Opt-Out/Self-Direct Policies
Under state energy efficiency policies, utilities are permitted to recover the costs of their energy efficiency programs from their customers. This is referred to the Cost Recovery Mechanism (CRM) and often appears as a line-item on the customers’ bills and is based on customer usage. This allows the customer to know how much is being collected and aggregated with funds from other customers for system-wide energy efficiency efforts. Because industrial usage is large, the CRM charge on their monthly bill can also be high, and unless the customer takes advantage of utility programs, they may not see direct benefits on their bill through reduced energy consumption.
Industrial Self Direct and Opt-Out Policies –Under the Opt-Out policies, industrial and large energy users are permitted to “opt-out” of paying all or a portion of the CRM with the understanding or requirement that they are pursuing energy efficiency improvements on their own. Similarly, under Self-Direct policies, a large energy customer is given the authority to direct how it will spend all or a portion of its cost-recovery charge. While these programs vary greatly from state to state, according to ACEEE, there are four underlying principles to these policies 67:
• Eligibility is clearly defined • “Relief” from utility CRM fees is granted • Policies and Programs are administered by entities other than the large energy user (generally the utility, state commission, or state energy office) • For the relief offered, energy savings are expected.
In response to pleas by the industrials community, as of 2011, 24 states have adopted either Opt-Out or Self-Direct policies for industrial and other large energy consuming customers. 68 This is up from 15 states in 2009. As the map illustrates and Table 19 shows in more depth, seven Midwestern states have adopted some form of Opt-Out or Self Direct policy.
INDUSTRIAL EFFICIENCY

Energy Efficiency Policies, Programs, and Practices in the Midwest: A Resource Guide for Policymakers46
Industrial Efficiency, con’tIN
DUST
RIAL
EFF
ICIE
NCY
!" # $%&'()#$**+,+&%,)#-./+,+&01#-'.('2301#2%4## -'2,5+,&0#+%#56+48&05#
#
!Table 19: Midwest Industrial Opt-Out or Self-Direct Policies
State
Statute
Utility
Opt-Out or Self-Direct
Spend or Energy Savings Goal
Threshold
I l l inois Public Act 96- 0033 (2007)
Gas Self-Direct Aggregate of 4 million therms in service territory or 8 million therms in the state.
Kentucky KRS 278.285 Electric and Gas
Opt Out The commission shall allow individual industrial customers with energy intensive processes to implement cost-effective energy efficiency measures in lieu of measures approved as part of the utility's demand-side management programs if the alternative measures by these customers are not subsidized by other customer classes.
Michigan 460.1093 Self-directed energy optimization plan.
Gas and Electric
Self-Direct Energy savings In 2011, 2012, or 2013 – 1 MW/site or 5 MW aggregate. In 2014 or any year thereafter, 1 MW aggregate.
Minnesota 2011 Minn. Stat. 216B.241 Energy Conservation Improvement
Gas and Electric
Self Direct Not identified Peak electrical demand of not less than 20,000 kilowatts or 500 million cubic feet of natural gas annually
Missouri Missouri Energy Efficiency Investment Act
Electric Opt-Out (1) Demand of at least 5000kW for the past 12 months; (2) Interstate Pipeline Pumping Station; or (3) 2500 kW of demand for past 12 months AND “comprehensive” demand or energy efficiency program in place saving equivalent of utility programs.
Ohio S.B. 221 (127th General Assembly)
Electric Both Spend; AEP does not set energy savings goals for its industrial self-direct program69
More than 700,000 kilowatt hours per year or is part of a national account involving multiple facilities in one or more states.
Wisconsin 2005 Wisconsin Act 141
Electric and Gas
Self Direct Spend Energy demand of at least 1,000 kilowatts of electricity per month or of at least 10,000 decatherms of natural gas per month and that, in a month, is billed at least $60,000 for electric service, natural gas service, or both, for all of the facilities of the customer within the energy utility’s service territory.
#######################

47
INDUSTRIAL EFFICIENCYIndustrial Efficiency, con’t
The Indiana Utility Regulatory Commission In its March 21, 2012 order (Cause No. 43955), specifically states that “the Commission believes that during the initial stages of the creation of a statewide DSM program, any opt-out or self-directed options could interfere with the TPA’s ability to fully implement the Core Programs, which includes commercial and industrial programs, throughout the State. Accordingly, the request for the adoption of self-directed programs is denied at this time.” The Commission goes on to state that it is “not permanently foreclosing consideration of cooperative self-directed programs proposed by a utility and its large commercial and industrial customers, supported by sufficient evidence and designed to be consistent with the Commissions goals and objectives in the Phase II Order.” 70
In some cases, these large industrial firms understand the importance of energy to their processes and effectively manage their energy consumption and costs through the use of efficient technologies and processes. In other cases, this may not be the case. To ensure that all customers are making progress toward using energy more efficiently, it is important that policy-makers develop policies for opt-out and self-direct programs just as they have for utility ratepayer funded energy efficiency programs. These policies should address the following:
• Energy Savings • Evaluation, Measurement and Verification • Funding Collection and Expenditure • Attribution of Energy Savings
Energy Savings — Just as utility energy efficiency policies have shifted from measuring funds expended to energy saved, so too should industrial energy efficiency policies set goals for energy savings in order for the large energy customer to take advantage of the opt-out or self-direct policies. The funds they use in lieu of the paying the CRM fees or to have the ability to self-direct its expenditure should be used to meet the same energy savings targets as the utility-operated programs.
Funding Collection and Expenditure — One of the issues that industrial customers raise with respect to the CRM is the cost of utility-sponsored energy efficiency programs. They see this line-item on their bill as driving up their costs and going to support other customers, some of whom may be competitors. As such, they are asking policymakers for the authority to determine for themselves how these funds will be spent. In this instance, policymakers have a responsibility to other customers and the utilities to ensure that these customers are, in fact, making the investments in energy efficiency technologies and processes that they claim to be making.
To address this issue, policymakers should have independent accounts created for these customers that clearly show how much they have contributed and against which energy efficiency investments and improvements can be charged. It is important that these customers be given a specified amount of time, possibly several years, in which to spend these funds. If the customer failed to spend these funds, then the money becomes available for utility- directed industrial energy efficiency improvements. Conversely, if they “overspend” in early years, they should be able to recoup that expense over time.
Finally, should an industrial customer fail to either adequately spend the amount over the specified time or fail to achieve energy savings from their investments, the commission or regulatory body should be authorized to levy a financial penalty as well as direct the industrial customer to participate in the utility-offered programs.
Evaluation, Measurement and Verification — Policymakers and utilities have recognized the importance of evaluating, measuring, and verifying energy savings resulting from utility or statewide energy efficiency programs. They have required independent third-party analysis to ensure that the ratepayer dollars were spent wisely AND achieved the promised energy savings. Those industrial customers who elect to Opt-Out or Self-Direct should have their energy efficiency programs held to the same standard as the utilities are held, including the following:
• A firm baseline should be established based on historical energy usage. • Measurement and Verification of the energy savings should be required of the customer. • Programs that are implemented before the Opt-Out or Self-Direct decision was made should not be counted towards the overall energy savings. • The tests used should be the same as those required of the utility, and tests should be transparent and relevant. • The same economic measures should be utilized to determine cost-effectiveness as are used for the utility. • Reporting of the energy savings should be filed with the commission or appropriate regulatory agency.
Energy Efficiency Policies, Programs, and Practices in the Midwest: A Resource Guide for Policymakers48
INDU
STRI
AL E
FFIC
IENC
Y Industrial Efficiency - Evaluation, Measurement and Verification, con’t
Attribution — in implementing its opt-out or self-direct policies, policymakers need to ensure that the utility is not penalized for large energy-consuming customers that choose take advantage of the state’s opt-out or self- direct policies. There are two approaches to this. The first is to give the utility credit for the energy savings achieved by its industrial customers through their self-direct programs. The second is for the baselines established for these customers to be subtracted from the utilities’ baselines and therefore not count in identifying the utilities’ energy savings goals.
A Robust Portfolio of Utility Programs for Industrial CustomersIndustrial energy efficiency offers great potential for energy savings throughout the Midwest. As policymakers and utilities establish and build the program offerings in their states and service territories, they cannot afford to overlook this potential. If a utility is expected to meet a target for energy savings under an EEPS, then it will need to achieve some savings from its industrial customers just as it will need to realize savings from its residential and commercial customers. To do so, policymakers should ensure that utilities develop a robust portfolio of prescriptive and custom programs targeted at industrial customers.
Prescriptive programs provide businesses fixed financial incentives or rebates for implementing energy-efficient improve-ments or technologies that reduce energy consumption. For example, there may be a set incentive for changing out lighting or upgrading an HVAC system to more efficient technology. Prescriptive programs often provide incentives for lighting, HVAC (controls, replacements, and tune-ups), compressed air systems, motors, refrigeration, food service equipment, steam trap repair and replacements, water heaters, and insulation.
In addition to the prescriptive incentive programs, utilities offer a variety of other energy efficiency programs targeted at their industrial customers. These include energy audits, custom incentives, retro-commissioning, new construction, and load response programs.
Energy Audits provide an opportunity for the utility to help its business customers identify energy savings opportunities. These can range from on-line, do-it-yourself audits to a more in-depth walk thru of the industrial facility by both utility and customer representatives identifying potential energy savings from the building envelop to technologies on the manufacturing floor to process improvements. The costs of these audits will often depend on if the business customer implements any of the recommendations found in the audit report.
Custom Programs provide businesses with incentives for installing high efficiency equipment or technologies that are not among the prescriptive technologies or for implementing process improvements that reduce overall energy consumption and peak demand. There is often a required return on investment (ROI) for these programs, usually ranging from 1 to 10 years and rebate amounts are usually dependent on the amount of real or expected energy savings. This ensures that these are cost effective projects that would not be implemented without utility rebate funds.
Strategic Energy Management (SEM) allows the customer identify and adopt a strategic long-term energy management approach that focuses on long-term energy savings goals rather than short-term savings. By adopting an SEM approach, the business customer examines its entire energy usage and adopts “best practices” for its operations. For the SEM approach to be successful, it should include appropriate goal setting as well as tracking and reporting for energy savings. In addition to generating long-term energy savings, SEM can result in a better understanding by the business customer of its energy consumption, a stronger relationship between the utility and its customers, long term energy and cost savings, as well as increased property values.
Retro-Commissioning allows the utility to provide in-depth energy usage analysis of a business customer’s systems, and identifies energy saving opportunities. It often entails monitoring energy use for up to 18 months using specialized soft-ware. Often times, the utility provides incentives for installing the needed software as well as for energy savings credited to the retro-commissioning program.
New Construction Programs incentivize building owners to construct new buildings with energy efficiency in mind. These programs can allow building owners to take advantage of prescriptive incentives offered by the utility (lighting and HVAC). These rebates are often available “pre-steel in the ground” so that they are actually influencing the design of the building instead of simply offering custom or prescriptive rebates.
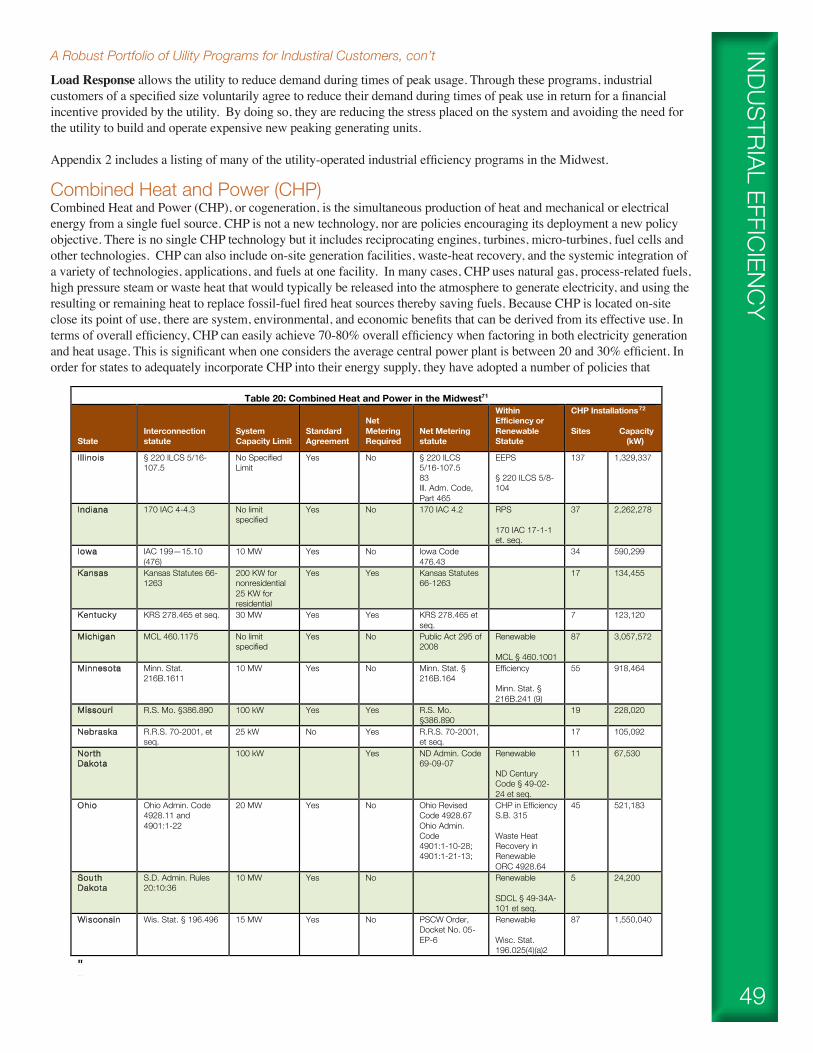
49
INDUSTRIAL EFFICIENCYA Robust Portfolio of Uility Programs for Industiral Customers, con’t
Load Response allows the utility to reduce demand during times of peak usage. Through these programs, industrial customers of a specified size voluntarily agree to reduce their demand during times of peak use in return for a financial incentive provided by the utility. By doing so, they are reducing the stress placed on the system and avoiding the need for the utility to build and operate expensive new peaking generating units.
Appendix 2 includes a listing of many of the utility-operated industrial efficiency programs in the Midwest.
Combined Heat and Power (CHP)Combined Heat and Power (CHP), or cogeneration, is the simultaneous production of heat and mechanical or electrical energy from a single fuel source. CHP is not a new technology, nor are policies encouraging its deployment a new policy objective. There is no single CHP technology but it includes reciprocating engines, turbines, micro-turbines, fuel cells and other technologies. CHP can also include on-site generation facilities, waste-heat recovery, and the systemic integration of a variety of technologies, applications, and fuels at one facility. In many cases, CHP uses natural gas, process-related fuels, high pressure steam or waste heat that would typically be released into the atmosphere to generate electricity, and using the resulting or remaining heat to replace fossil-fuel fired heat sources thereby saving fuels. Because CHP is located on-site close its point of use, there are system, environmental, and economic benefits that can be derived from its effective use. In terms of overall efficiency, CHP can easily achieve 70-80% overall efficiency when factoring in both electricity generation and heat usage. This is significant when one considers the average central power plant is between 20 and 30% efficient. In order for states to adequately incorporate CHP into their energy supply, they have adopted a number of policies that
!! " #$%&'("#))*+*%$+(",-.*+*%/0",&-'&12/0"1$3"" ,&1+4*+%/"*$"45%"6*37%/4"
"
!!!!!!
Table 20: Combined Heat and Power in the Midwest71 State
Interconnection statute
System Capacity Limit
Standard Agreement
Net Metering Required
Net Metering statute
Within Efficiency or Renewable Statute
CHP Installations Sites Capacity (kW)
I l l inois § 220 ILCS 5/16-107.5
No Specified Limit
Yes No § 220 ILCS 5/16-107.5 83 Ill. Adm. Code, Part 465
EEPS § 220 ILCS 5/8-104
137 1,329,337
Indiana 170 IAC 4-4.3 No limit specified
Yes No 170 IAC 4.2
RPS 170 IAC 17-1-1 et. seq.
37 2,262,278
Iowa IAC 199—15.10 (476)
10 MW Yes No Iowa Code 476.43
34 590,299
Kansas Kansas Statutes 66-1263
200 KW for nonresidential 25 KW for residential
Yes Yes Kansas Statutes 66-1263
17 134,455
Kentucky KRS 278.465 et seq. 30 MW Yes Yes KRS 278.465 et seq.
7 123,120
Michigan MCL 460.1175 No limit specified
Yes No Public Act 295 of 2008
Renewable MCL § 460.1001
87 3,057,572
Minnesota Minn. Stat. 216B.1611
10 MW Yes No Minn. Stat. § 216B.164
Efficiency Minn. Stat. § 216B.241 (9)
55 918,464
Missouri R.S. Mo. §386.890 100 kW Yes Yes R.S. Mo. §386.890
19 228,020
Nebraska R.R.S. 70-2001, et seq.
25 kW No Yes R.R.S. 70-2001, et seq.
17 105,092
North Dakota
100 kW Yes ND Admin. Code 69-09-07
Renewable ND Century Code § 49-02-24 et seq.
11 67,530
Ohio Ohio Admin. Code 4928.11 and 4901:1-22
20 MW Yes No Ohio Revised Code 4928.67 Ohio Admin. Code 4901:1-10-28; 4901:1-21-13;
CHP in Efficiency S.B. 315 Waste Heat Recovery in Renewable ORC 4928.64
45 521,183
South Dakota
S.D. Admin. Rules 20:10:36
10 MW Yes No Renewable SDCL § 49-34A-101 et seq.
5 24,200
Wisconsin Wis. Stat. § 196.496 15 MW Yes No PSCW Order, Docket No. 05-EP-6
Renewable Wisc. Stat. 196.025(4)(a)2
87 1,550,040
"""""""
72
Energy Efficiency Policies, Programs, and Practices in the Midwest: A Resource Guide for Policymakers50
Combined Heat and Power (CHP), con’t
address a variety of issues, including interconnection policies, incentives, back-up rates, net metering. Within the energy industry and across policymaking bodies, there is no clear consensus on whether CHP is an energy efficiency resource or a renewable energy technology. In the Midwest, some policymakers have included CHP within the energy efficiency category; others treat it within their renewable energy portfolio; and some categorize it by itself. Table 20 indicates, the states differ with respect to items as the capacity limit, the need for a standard agreement, or a net metering requirement.
Because CHP is traditionally developed, owned and operated by the customer, the investment traditionally comes from the industrial site, or an energy service company. Utilities see little, if any, benefit in its deployment as CHP reduces the utility’s electric load (though may increase gas consumption), reducing the utility’s overall revenue. Utilities are concerned about the potential risk to the electric grid and system reliability, if the generator fails to operate and the utility is called on to supply the industrial site with power. For this reason, the utility still needs to plan for and build back-up generating capacity should the facility go off-line. There are many important CHP related policies that need to be addressed to encourage its further development:
Interconnection standards – Is there a minimum size or different requirements based on size of the industrial CHP installation? Standard Contract – Should the state and/or the utility develop a standard contract for CHP interconnections? Feed-In Tariff – How much will the utility have to pay the customer for electricity it purchases from the CHP facility? Standby Rates – How much can the utility charge the industrial customer for ensuring back-up generation is available on little or no notice? Credit to Standards – Does CHP count towards a utility’s requirements under an Energy Efficiency Resource Standard, Renewable Portfolio Standard, or neither? Financial Incentives – Is the state going to provide financial incentives through the form of tax credits or exemptions, low-interest loans, or grants toward the deployment of CHP?
Demand ResponseWhen the demand for electricity is greater than the available supply (whether on a local or regional level), stress is placed on the entire system from the power plant through the transmission grid and the distribution system. A number of factors can contribute to this situation – often referred to as peak demand events – including extreme weather conditions (exces-sively hot or cold days), generating facilities being off-line, fallen power lines and natural disasters. To alleviate this stress, policymakers and utilities have developed demand response programs. According to the Federal Energy Regulatory Commission, Demand Response is defined as the ability of customers to respond to either a reliability trigger or a price trigger from their utility system operator, load-serving entity, regional transmission organization/ independent system operator (RTO/ISO), or other demand response provider by lowering their power consumption.73
In developing demand response policies, regulators and utilities are incentivizing customers into using less electricity at times of high energy use, thereby reducing peak energy usage and freeing up both generation and grid capacity. In doing so, they are hoping to avoid major blackouts across large sections of the grid. According to the FERC’s A National Assessment of Demand Response Potential, under the most aggressive scenario, the nation could see a “14 percent reduction in peak demand for 2019 compared to a scenario with no demand response programs.” Within most of the states in the Midwest (Table 21), there are demand response programs currently operating or being piloted. 74
There are a number of benefits to demand response programs, including the following:
• It is a relatively inexpensive “low hanging fruit” that can be captured within a utility’s resource plan. • It is considerably less expensive than purchasing expensive power on the spot market or building peaking units that will be used very infrequently. • It helps avoid blackouts or brownouts. • There are no carbon dioxide implications for the utility, which is not true for natural gas peaking units. • The Independent System Operators are actively seeking greater demand response to help them manage system reliability. • f they’re involved in its development and educated about it, customers generally like it. • “Aggregators of Retail Customer” (ARCs) are the new entrants into the energy arena and will work with customers to aggregate the demand response and bid it into the wholesale market.
Although demand response policies are often applicable to residential, commercial, and industrial customers, the magnitude of the potential for energy shifting for industrial customers is significant. As such, in some instances demand
INDU
STRI
AL E
FFIC
IENC
Y

51
Demand Response, con’t
response programs tie into the state’s or utilities’ industrial energy efficiency programs. Because industrial customers are significant consumers of energy, often during times of peak energy demand, by shifting their load, they have the ability of shaving the peak considerably. By comparison, it would take a lot of refrigerator or air conditioner controls (or both) to equal the amount of one industrial customer.
Since the Midwest has significant industrial and agricultural energy customers, it is important that state policymakers examine their demand response policies to ensure that—
• Customers are involved in the development of demand response programs and educated about their benefits • Policies are coordinated with regional independent system operators to ensure maximum effectiveness • Customers are properly compensated for voluntarily reducing their consumption during times of peak demand • Consider the benefits of and any concerns with third-party aggregators of retail customers (ARCs) for demand response and how to properly involve and grow this group of energy businesses. • Effective measurement and verification of demand response is undertaken
INDUSTRIAL EFFICIENCY
!" # $%&'()#$**+,+&%,)#-./+,+&01#-'.('2301#2%4## -'2,5+,&0#+%#56+48&05#
#
Table 21: Demand Response Policies in the Midwest State Authority Summary I l l inois Energy Infrastructure
Modernization Act Requires electric utilities "file an energy efficiency and demand-response plan with the Commission to meet the energy efficiency and demand-response standards for 2011 through 2013."
Indiana Order in Cause No. 43566 (July 28,2010)
The Indiana Utility Regulatory Commission’s Demand Response Order “required all jurisdictional electric utilities to file tariffs or riders authorizing the participation of retail customers, through their utility provider, in the applicable regional transmission organization's ("RTO") demand response programs.”75
Iowa Iowa Code Section 476.17
Adopted in 1981, authorized the Iowa Utilities Board to require utilities to create peak load energy conservation measures, which have come to include demand response.
Kansas Final Order in GMX-441-GIV (Nov 14, 2008)
In its order, the Kansas Corporation Commission stated its belief that demand response programs can shave demand peaks thereby mitigating the need for expensive new power generation.
Kentucky Within its tariff, Kentucky Utilities has a “Experimental Load Reduction Incentive” that Michigan Public Act 295 of 2008 The Clean, Renewable, and Efficient Energy Act, passed in 2008, addressed demand response as part
of load management to address strategies or technologies to decrease or shift peak energy demand. Minnesota Docket No: E-999/CI-
09-1449 (Feb 8, 2011)
Minnesota PUC found that the ability of utilities to expand their demand response programs through contracts with third-parties may be beneficial.
Missouri Mo. Rev. Statutes 393.1075.
Under the Missouri Energy Efficiency Investment Act, demand response is included within the definition of demand-side program.
Nebraska 2011 Nebraska State Energy Plan76
Calls for increasing opportunities for DSM and energy efficiency, including strategies focused on having consumers manage their peak time energy consumption. Identified irrigation as a DSM opportunity.
Ohio Ohio Revised Code 4928.64
Includes within the definition of “alternative energy resource” energy resources that a mercantile customer commits for integration into the electric distribution utility’s demand-response, energy efficiency, or peak demand reduction programs as provided under division (A)(2)(c) of section 4928.66 of the Revised Code, including, but not limited to, any of the following: (a) A resource that has the effect of improving the relationship between real and reactive power; (b) A resource that makes efficient use of waste heat or other thermal capabilities owned or controlled by a mercantile customer; (c) Storage technology that allows a mercantile customer more flexibility to modify its demand or load and usage characteristics; (d) Electric generation equipment owned or controlled by a mercantile customer that uses an advanced energy resource or renewable energy.
South Dakota SD Admin Rules 20:10:38:06
Provides for the measurement and verification of demand response measures.
Wisconsin Demand Response programs have been operated by Wisconsin’s major utilities for many years.
!!!!!!!!!!!!!!!!!!!!!

Energy Efficiency Policies, Programs, and Practices in the Midwest: A Resource Guide for Policymakers52
FINA
NCIN
G FinancingOne barrier to energy efficiency confronting all classes of customers – residential, commercial, industrial, governmental, and agricultural – is the availability of financing. Investments in energy efficiency require the end-user to spend money up front on energy efficiency improvements (insulation, lighting, more efficient motors or appliances, etc) with the promise that the consumer will use less electricity and/or natural gas, and thereby spend less on their electric and gas bills. But, these investments can be expensive, and the end-user may not have the cash readily available to make such an investment. Traditional lending programs with high interest rates may make the investment uneconomic. Additionally, the amount individual projects save hinges at least partially on occupant behavior. This has hindered the ability to aggregate loans to sell on the secondary market, in the manner mortgages are bundled, and mitigated the interest of large private capital investment. This has hindered the private capital market which has been either unable or unwilling to make significant headway in financing energy efficiency improvements on a large scale. To overcome these barriers, policymakers, utilities, economic development organizations, and others have developed a number of financing tools, including Property Assessed Clean Energy initiatives, On-Bill Financing, low interest loans, and state revolving funds.
Property Assessed Clean Energy (PACE) FinancingOne approach that has been authorized by states allows local governments to finance investments in energy efficiency and renewable energy made by property owners within their jurisdiction. The program is called Property Assessed Clean Energy financing. Under this program, the local government creates a land-secured taxing district for the purposes of energy efficiency and renewable energy improvements. Local homeowners and commercial building owners voluntary de-cide to participate and make improvements to their property. They go through the local government to receive financing for the improvements, which is then repaid through an assessment on the property owner’s property taxes for up to 20 years.
Currently, authorizing legislation or other authority for PACE financing has been enacted in 28 states plus the District of Columbia, including 6 in the Midwest – Illinois, Michigan, Minnesota, Missouri, Ohio, and Wisconsin (Table 22, next page).
There has been much discussion regarding PACE programs for homeowners and the actions of the Federal Housing Financing Agency (FHFA), which has effectively shut down residential PACE programs for the time being. The FHFA supervises, regulates and oversees Fannie Mae, Freddie Mac and the Federal Home Loan Banks (FHLBs). In doing so, FHFA seeks to ensure their safety and soundness as well as supports a stable mortgage market. On July 6, 2010, the FHFA released a “Statement on Certain Energy Retrofit Loan Programs” in which it expressed concern regarding PACE financing in that “such loans acquire a priority lien status over existing mortgages,” and in doing so “post unusual and difficult risk management challenges for lenders, services and mortgage securities investors.” The agency went on to
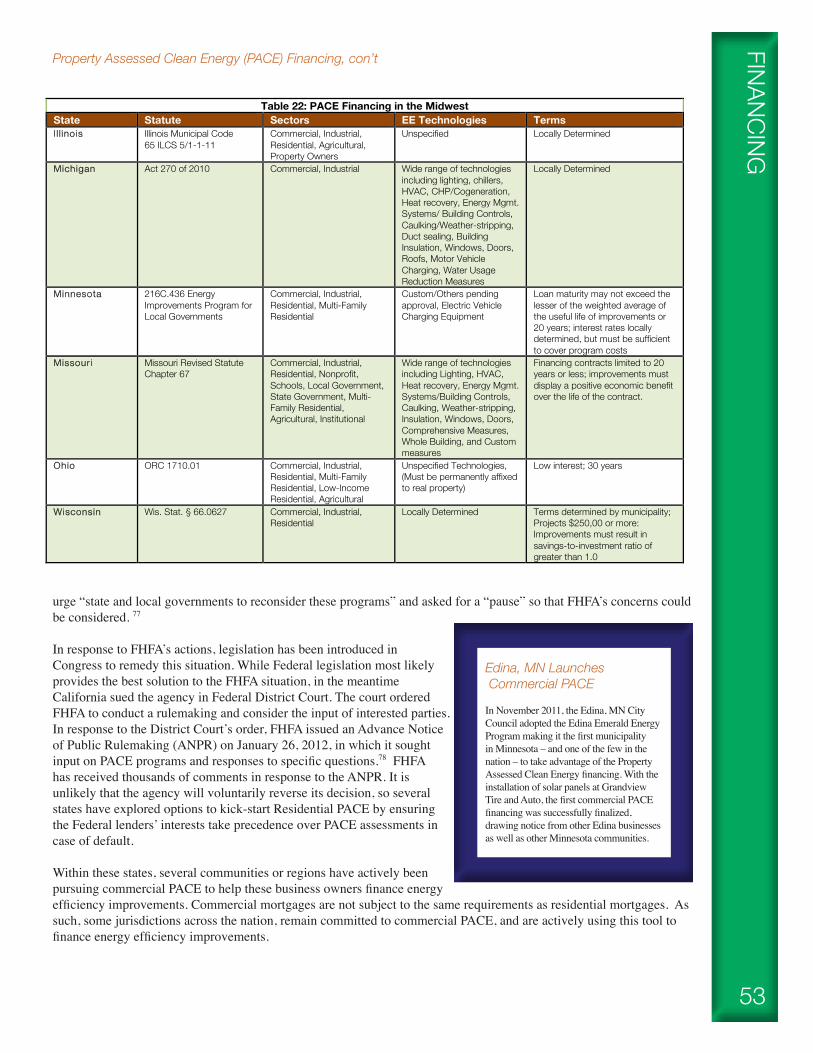
53
FINANCINGProperty Assessed Clean Energy (PACE) Financing, con’t
urge “state and local governments to reconsider these programs” and asked for a “pause” so that FHFA’s concerns could be considered. 77
In response to FHFA’s actions, legislation has been introduced in Congress to remedy this situation. While Federal legislation most likely provides the best solution to the FHFA situation, in the meantime California sued the agency in Federal District Court. The court ordered FHFA to conduct a rulemaking and consider the input of interested parties.In response to the District Court’s order, FHFA issued an Advance Notice of Public Rulemaking (ANPR) on January 26, 2012, in which it sought input on PACE programs and responses to specific questions.78 FHFA has received thousands of comments in response to the ANPR. It is unlikely that the agency will voluntarily reverse its decision, so several states have explored options to kick-start Residential PACE by ensuring the Federal lenders’ interests take precedence over PACE assessments in case of default.
Within these states, several communities or regions have actively been pursuing commercial PACE to help these business owners finance energy efficiency improvements. Commercial mortgages are not subject to the same requirements as residential mortgages. As such, some jurisdictions across the nation, remain committed to commercial PACE, and are actively using this tool to finance energy efficiency improvements. A Best Practices Handbook 71 for Policymakers
Table 22: PACE Financing in the Midwest State Statute Sectors EE Technologies Terms I l l inois Illinois Municipal Code
65 ILCS 5/1-1-11
Commercial, Industrial, Residential, Agricultural, Property Owners
Unspecified Locally Determined
Michigan Act 270 of 2010 Commercial, Industrial Wide range of technologies including lighting, chillers, HVAC, CHP/Cogeneration, Heat recovery, Energy Mgmt. Systems/ Building Controls, Caulking/Weather-stripping, Duct sealing, Building Insulation, Windows, Doors, Roofs, Motor Vehicle Charging, Water Usage Reduction Measures
Locally Determined
Minnesota 216C.436 Energy Improvements Program for Local Governments
Commercial, Industrial, Residential, Multi-Family Residential
Custom/Others pending approval, Electric Vehicle Charging Equipment
Loan maturity may not exceed the lesser of the weighted average of the useful life of improvements or 20 years; interest rates locally determined, but must be sufficient to cover program costs
Missouri Missouri Revised Statute Chapter 67
Commercial, Industrial, Residential, Nonprofit, Schools, Local Government, State Government, Multi-Family Residential, Agricultural, Institutional
Wide range of technologies including Lighting, HVAC, Heat recovery, Energy Mgmt. Systems/Building Controls, Caulking, Weather-stripping, Insulation, Windows, Doors, Comprehensive Measures, Whole Building, and Custom measures
Financing contracts limited to 20 years or less; improvements must display a positive economic benefit over the life of the contract.
Ohio ORC 1710.01 Commercial, Industrial, Residential, Multi-Family Residential, Low-Income Residential, Agricultural
Unspecified Technologies, (Must be permanently affixed to real property)
Low interest; 30 years
Wisconsin Wis. Stat. § 66.0627 Commercial, Industrial, Residential
Locally Determined Terms determined by municipality; Projects $250,00 or more: Improvements must result in savings-to-investment ratio of greater than 1.0
Edina, MN Launches Commercial PACE
In November 2011, the Edina, MN City Council adopted the Edina Emerald Energy Program making it the first municipality in Minnesota – and one of the few in the nation – to take advantage of the Property Assessed Clean Energy financing. With the installation of solar panels at Grandview Tire and Auto, the first commercial PACE financing was successfully finalized, drawing notice from other Edina businesses as well as other Minnesota communities.

Energy Efficiency Policies, Programs, and Practices in the Midwest: A Resource Guide for Policymakers54
On-Bill FinancingAnother financing tool utilized by some utilities is to allow customers to finance energy efficiency improvements and to repay the cost of the improvements plus interest through an on-bill financing program. With such a financing mechanism, the monthly amount to repay the loan is added on to the utility bill over the life of the loan. In several programs, the repayment schedule is set such that the monthly savings exceeds the monthly amount repaid on the loan, thereby allowing the customer to realize financial savings immediately. Depending on the utility, these programs are available for both residential and commercial customers. There are a number of potential customer benefits of such a program:
• Provides customers with an easy path to financing EE improvements • Encourages private investment in energy efficient technologies • Low or no up-front costs • Low interest rates • Easy repayment plans • Ability to take utility bill payment history into account rather than simply a credit score • Can work with rebate and other incentive programs • Can supplement government funding (if it’s available) • Can be utilized by residential, commercial and industrial customers
Utilities may have concerns regarding (1) exposing their shareholders to financial risks posed by defaults, (2) going beyond their core business function by becoming loan underwriters, or (3) the expense of upgrading their billing systems to handle on-bill financing.79 Each of these concerns can be properly managed to provide utilities the assurances that they desire. For example, policymakers can create a loan-loss reserve fund using public benefit funds to make the utility whole in the case of defaults. Third party entities can get the utility out of the business of underwriting the loans, and simply use the utility billing and collections process to handle the monetary transactions. Such an approach is being utilized by Energy Pioneer Solutions (EPS) in Nebraska. EPS, which is currently working with 14 utilities in the state, conducts the assess-ment, performs the energy efficiency improvements, and provides the financing for energy efficiency improvements. With the customer’s consent, EPS gains access to usage data from the utility at the beginning of the process and then the loan and interest are repaid as a line-item on the customer’s monthly energy bill. And, because they have access to the usage data, EPS is able to quantify the energy savings from the energy efficiency investment. Finally, EPS has structured these loans such that they are transferrable to the next property owner, should the current owner sell the property before the loan is fully repaid.
There are two different types of on-bill financing: conventional loans and tariff-based financing. With the conventional consumer loan, the debt is assigned to the customer and repayment is made via the utility with a line-item on the customer’s monthly utility bill. With a tariff-based loan, the debt is actually assigned to the meter which provides several significant benefits:
• Transferability from one owner or tenant to the next • The repayment obligation may not appear as debt on the customer’s credit reports • Longer repayment terms of up to 15 to 20 years • Encourages energy efficiency improvements to rental properties 80
According to the ACEEE, there are currently 20 states in which a utility is offering some form of on-bill financing for energy efficiency improvements.81 The capital needed to develop an on-bill financing program typically comes from (1) third party financial institutions, (2) utility funding, or (3) a state public benefits fund.82 In some cases on-bill financing is being advanced by the utility, in other cases by a local government and/or nonprofit organization, and in yet a third by state legislation requiring utilities to offer on-bill financing programs. In both Kentucky and Indiana, on-bill financing is being pursued by local economic development and redevelopment organizations in conjunction with thelocal utility.
Another concern that consumer advocates have raised is the potential that customers will have their utility services disconnected for failing to pay their utility bill that incorporates both the energy services and the loan repayment. However, these programs are generally structured such that the customer will receive an immediate savings on their utility bill even while paying back the loan. This is done by ensuring that the monthly energy savings are greater than the monthly payment on the loan. As such, the utility has reduced the risk of defaulting on the loan because the overall monthly payment will be less than it was before the investments in energy efficiency. This is the approach taken in Kentucky by the Mountain Association for Community Economic Development’s on-bill program, in which they ensure that the loan is repaid through a portion of the savings that the customer achieves.
FINA
NCIN
G
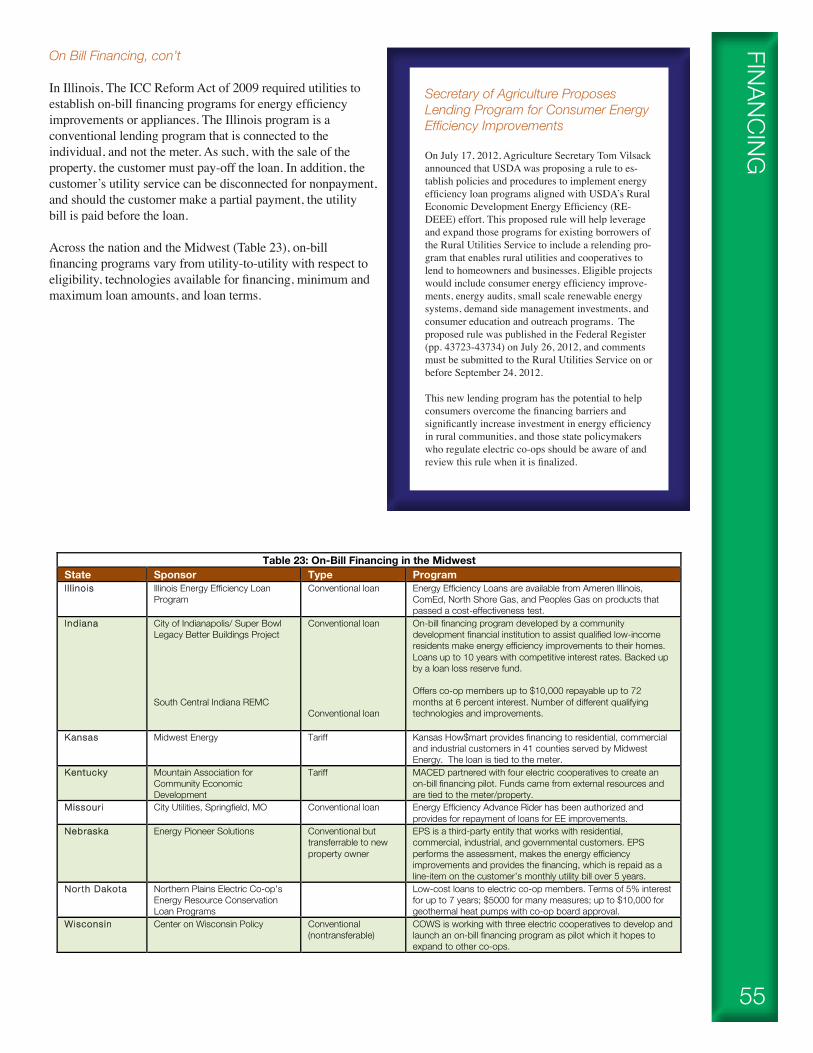
55
On Bill Financing, con’t
In Illinois, The ICC Reform Act of 2009 required utilities to establish on-bill financing programs for energy efficiency improvements or appliances. The Illinois program is a conventional lending program that is connected to the individual, and not the meter. As such, with the sale of the property, the customer must pay-off the loan. In addition, thecustomer’s utility service can be disconnected for nonpayment,and should the customer make a partial payment, the utilitybill is paid before the loan.
Across the nation and the Midwest (Table 23), on-bill financing programs vary from utility-to-utility with respect toeligibility, technologies available for financing, minimum and maximum loan amounts, and loan terms.
FINANCINGSecretary of Agriculture Proposes Lending Program for Consumer Energy Efficiency Improvements
On July 17, 2012, Agriculture Secretary Tom Vilsack announced that USDA was proposing a rule to es-tablish policies and procedures to implement energy efficiency loan programs aligned with USDA’s Rural Economic Development Energy Efficiency (RE-DEEE) effort. This proposed rule will help leverage and expand those programs for existing borrowers of the Rural Utilities Service to include a relending pro-gram that enables rural utilities and cooperatives to lend to homeowners and businesses. Eligible projects would include consumer energy efficiency improve-ments, energy audits, small scale renewable energy systems, demand side management investments, and consumer education and outreach programs. The proposed rule was published in the Federal Register (pp. 43723-43734) on July 26, 2012, and comments must be submitted to the Rural Utilities Service on or before September 24, 2012.
This new lending program has the potential to help consumers overcome the financing barriers and significantly increase investment in energy efficiency in rural communities, and those state policymakers who regulate electric co-ops should be aware of and review this rule when it is finalized.
A Best Practices Handbook 75 for Policymakers
Table 23: On-Bill Financing in the Midwest State Sponsor Type Program I l l inois Illinois Energy Efficiency Loan
Program
Conventional loan Energy Efficiency Loans are available from Ameren Illinois, ComEd, North Shore Gas, and Peoples Gas on products that passed a cost-effectiveness test.
Indiana City of Indianapolis/ Super Bowl Legacy Better Buildings Project South Central Indiana REMC
Conventional loan Conventional loan
On-bill financing program developed by a community development financial institution to assist qualified low-income residents make energy efficiency improvements to their homes. Loans up to 10 years with competitive interest rates. Backed up by a loan loss reserve fund. Offers co-op members up to $10,000 repayable up to 72 months at 6 percent interest. Number of different qualifying technologies and improvements.
Kansas Midwest Energy Tariff Kansas How$mart provides financing to residential, commercial and industrial customers in 41 counties served by Midwest Energy. The loan is tied to the meter.
Kentucky Mountain Association for Community Economic Development
Tariff MACED partnered with four electric cooperatives to create an on-bill financing pilot. Funds came from external resources and are tied to the meter/property.
Missouri City Utilities, Springfield, MO Conventional loan Energy Efficiency Advance Rider has been authorized and provides for repayment of loans for EE improvements.
Nebraska Energy Pioneer Solutions Conventional but transferrable to new property owner
EPS is a third-party entity that works with residential, commercial, industrial, and governmental customers. EPS performs the assessment, makes the energy efficiency improvements and provides the financing, which is repaid as a line-item on the customer’s monthly utility bill over 5 years.
North Dakota Northern Plains Electric Co-op’s Energy Resource Conservation Loan Programs
Low-cost loans to electric co-op members. Terms of 5% interest for up to 7 years; $5000 for many measures; up to $10,000 for geothermal heat pumps with co-op board approval.
Wisconsin Center on Wisconsin Policy Conventional (nontransferable)
COWS is working with three electric cooperatives to develop and launch an on-bill financing program as pilot which it hopes to expand to other co-ops.

Energy Efficiency Policies, Programs, and Practices in the Midwest: A Resource Guide for Policymakers56
Other Energy Efficiency Financing ToolsIn addition to PACE and on-bill financing, a number of states, utilities, and lenders across the Midwest are working to help provide customers access to the needed capital to make investments in energy efficiency. These financing tools include state and local lending programs, point-of-sale financing, and unsecured personal financing. Point-of-sale loans are similar to a credit card or line-of-credit, where the local merchant arranges for financing through a large financial institution. Not unlike financing of appliances through a “big box” retailer. In this instance, the utility is simply the intermediary connecting its customer to the lender.
Loan Loss Reserve FundOne of the most effective credit enhancements is the creation of a loan loss reserve (LLR) which lowers the risk of the financial institution while simultaneously levering up the program’s capital. This allows programs to take a ‘portfolio approach’ to credit structuring. Loss reserves can be as low as 2%, but are more typically around 10%. This money is set aside to cover certain losses. For example, a 10% LLR on a $20 million portfolio would cover up to $2 million of the financial institution’s losses due to default. Sometimes, there is also a first loss percentage that determines how much f the first losses the reserves will cover. This is typically 80%-90%. A properly structured 10% loss reserve fund, for example, can support 10 timesmore funds than a comparable rebate. With $1,000, a program can provide a one-time $1,000 rebate or can establish a loss reserve fund that supports a $10,000 revolving loan fund that can be recapitalized through interest payments and loaned again and again. Instead of supporting one retrofit, that $1,000 can be used to support many. Iowa’s fund helps ensure that private sector lenders will make loans for energy efficiency to industrial, agricultural, and commercial businesses.
A related mechanism is a debt service fund (DSF), where capital is put aside to cover interest payments in the event of late payments or defaults by program participants. Some states, Iowa for example, have taken the step of helping to secure private capital for energy efficiency improvements through the creation of a loan loss fund.
Revolving Loan FundsSeveral states have created Revolving Loan Funds (RLFs) that allow programs to lend to participants from a single fund that is re-seeded with principal and interest payments from participants to lend to future participants. RLFs can be structured in such a way that interest payments are sufficient to cover administrative overhead and default rates so that there is a consistent pool of funds to draw from long term.
New York State has a revolving loan fund that could serve as a potential model of replication elsewhere. NYSERDA administers a $51,260,000 RLF for residential, multifamily, and small commercial energy efficiency upgrades. A portion of the original capital came from a US Department of Energy Better Buildings grant that had previously been earmarked for PACE financing, but had been re-appropriated to a RLF with the seeming demise of residential PACE.
Loans of up to $13,000 for single family homes are originated through NYSERDA’s two-tier underwriting standards. The first tier is for homeowners that meet the Fannie Mae loan standards. This means a credit score of 640 or higher and a debt to income ratio of less than 50%. Tier two offers loans to people that would not meet the tier one credit requirements but may still be good borrowers. Tier two applicants must be current on their utility bills for two consecutive months during each of the last two years, have no utility or mortgage payments 60 days late in the last two years, be current on mortgage payments for the last year and have a debt to income ratio of less than 55%. NYSERDA offers 5, 10, and 15 year loan terms as low as 3.49% (with a ½% interest rate reduction for automatic payments). After the QECB bond volume cap is exhausted the expected rate of the loans will be 5.99%. The lender closes on a loan and then sells the loan to NYSERDA to hold. Servicing of the loans is then separate. Originally, NYSERDA used one loan originator but has recently opened it up to multiple lenders. In addition to these unsecured loans, NYSERDA will also be offering PowerSaver secured loans for more expensive retrofits.
FINA
NCIN
GMichigan Saves
Michigan Saves is nonprofit organization dedicated to making energy improvements easy and affordable. Created with an initial $6.5 million grant from the Michigan Public Service Commission, Michigan Saves has created a statewide network of contractors and credit unions to provide consistent offerings and financing across the state. Initially targeted at residential customers, the Michigan Saves programs have recently expanded to the commercial sector. The program is driven by local contractors, who coordinate their efforts with utilities by knowing what rebates or incentives are available as well as helping the customer line-up needed financing with one of the participating credit unions. In addition, Michigan Saves manages a loan loss reserve fund, to be accessed in the rare case of a default.
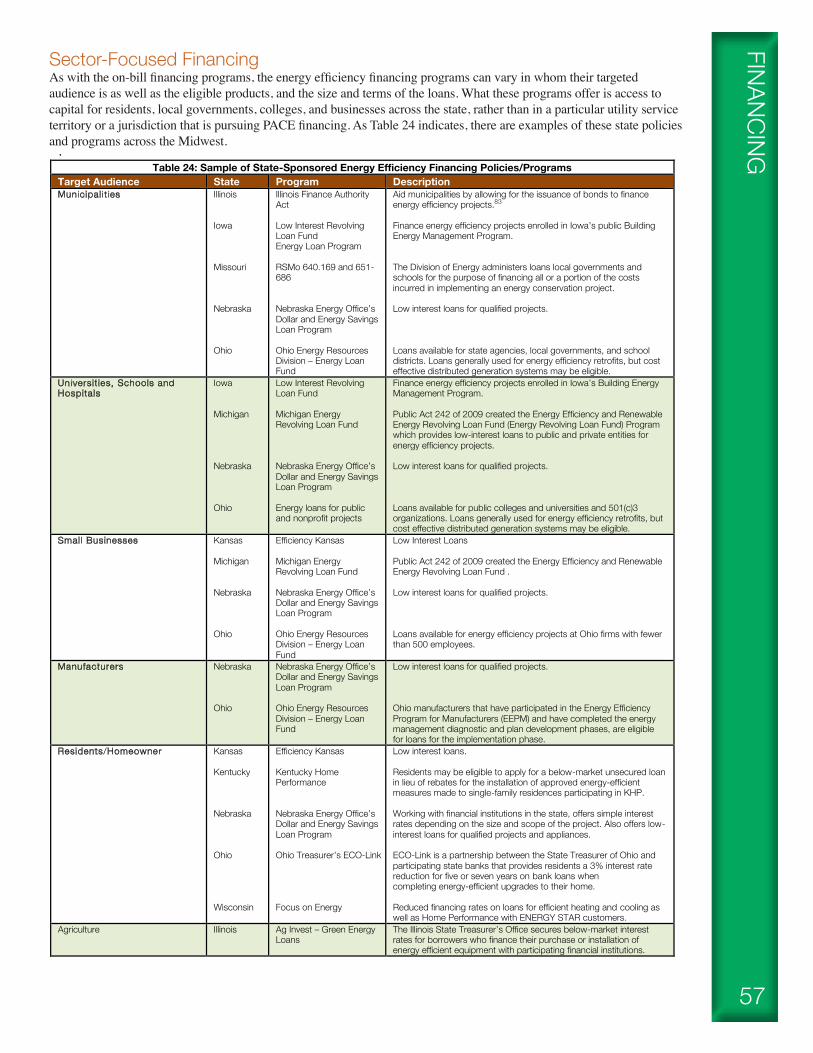
57
Sector-Focused FinancingAs with the on-bill financing programs, the energy efficiency financing programs can vary in whom their targeted audience is as well as the eligible products, and the size and terms of the loans. What these programs offer is access to capital for residents, local governments, colleges, and businesses across the state, rather than in a particular utility service territory or a jurisdiction that is pursuing PACE financing. As Table 24 indicates, there are examples of these state policies and programs across the Midwest.
FINANCING
!" # $%&'()#$**+,+&%,)#-./+,+&01#-'.('2301#2%4## -'2,5+,&0#+%#56+48&05#
#
!!!
Table 24: Sample of State-Sponsored Energy Efficiency Financing Policies/Programs Target Audience State Program Description Municipal i t ies Illinois
Iowa Missouri Nebraska Ohio
Illinois Finance Authority Act Low Interest Revolving Loan Fund Energy Loan Program RSMo 640.169 and 651-686 Nebraska Energy Office’s Dollar and Energy Savings Loan Program Ohio Energy Resources Division – Energy Loan Fund
Aid municipalities by allowing for the issuance of bonds to finance energy efficiency projects.83 Finance energy efficiency projects enrolled in Iowa’s public Building Energy Management Program. The Division of Energy administers loans local governments and schools for the purpose of financing all or a portion of the costs incurred in implementing an energy conservation project. Low interest loans for qualified projects. Loans available for state agencies, local governments, and school districts. Loans generally used for energy efficiency retrofits, but cost effective distributed generation systems may be eligible.
Universit ies, Schools and Hospitals
Iowa Michigan Nebraska Ohio
Low Interest Revolving Loan Fund Michigan Energy Revolving Loan Fund Nebraska Energy Office’s Dollar and Energy Savings Loan Program Energy loans for public and nonprofit projects
Finance energy efficiency projects enrolled in Iowa’s Building Energy Management Program. Public Act 242 of 2009 created the Energy Efficiency and Renewable Energy Revolving Loan Fund (Energy Revolving Loan Fund) Program which provides low-interest loans to public and private entities for energy efficiency projects. Low interest loans for qualified projects. Loans available for public colleges and universities and 501(c)3 organizations. Loans generally used for energy efficiency retrofits, but cost effective distributed generation systems may be eligible.
Small Businesses Kansas Michigan Nebraska Ohio
Efficiency Kansas Michigan Energy Revolving Loan Fund Nebraska Energy Office’s Dollar and Energy Savings Loan Program Ohio Energy Resources Division – Energy Loan Fund
Low Interest Loans Public Act 242 of 2009 created the Energy Efficiency and Renewable Energy Revolving Loan Fund . Low interest loans for qualified projects. Loans available for energy efficiency projects at Ohio firms with fewer than 500 employees.
Manufacturers Nebraska Ohio
Nebraska Energy Office’s Dollar and Energy Savings Loan Program Ohio Energy Resources Division – Energy Loan Fund
Low interest loans for qualified projects. Ohio manufacturers that have participated in the Energy Efficiency Program for Manufacturers (EEPM) and have completed the energy management diagnostic and plan development phases, are eligible for loans for the implementation phase.
Residents/Homeowner Kansas Kentucky Nebraska Ohio Wisconsin
Efficiency Kansas Kentucky Home Performance Nebraska Energy Office’s Dollar and Energy Savings Loan Program Ohio Treasurer’s ECO-Link Focus on Energy
Low interest loans. Residents may be eligible to apply for a below-market unsecured loan in lieu of rebates for the installation of approved energy-efficient measures made to single-family residences participating in KHP. Working with financial institutions in the state, offers simple interest rates depending on the size and scope of the project. Also offers low-interest loans for qualified projects and appliances. ECO-Link is a partnership between the State Treasurer of Ohio and participating state banks that provides residents a 3% interest rate reduction for five or seven years on bank loans when completing energy-efficient upgrades to their home. Reduced financing rates on loans for efficient heating and cooling as well as Home Performance with ENERGY STAR customers.
Agriculture Illinois Ag Invest – Green Energy Loans
The Illinois State Treasurer’s Office secures below-market interest rates for borrowers who finance their purchase or installation of energy efficient equipment with participating financial institutions.
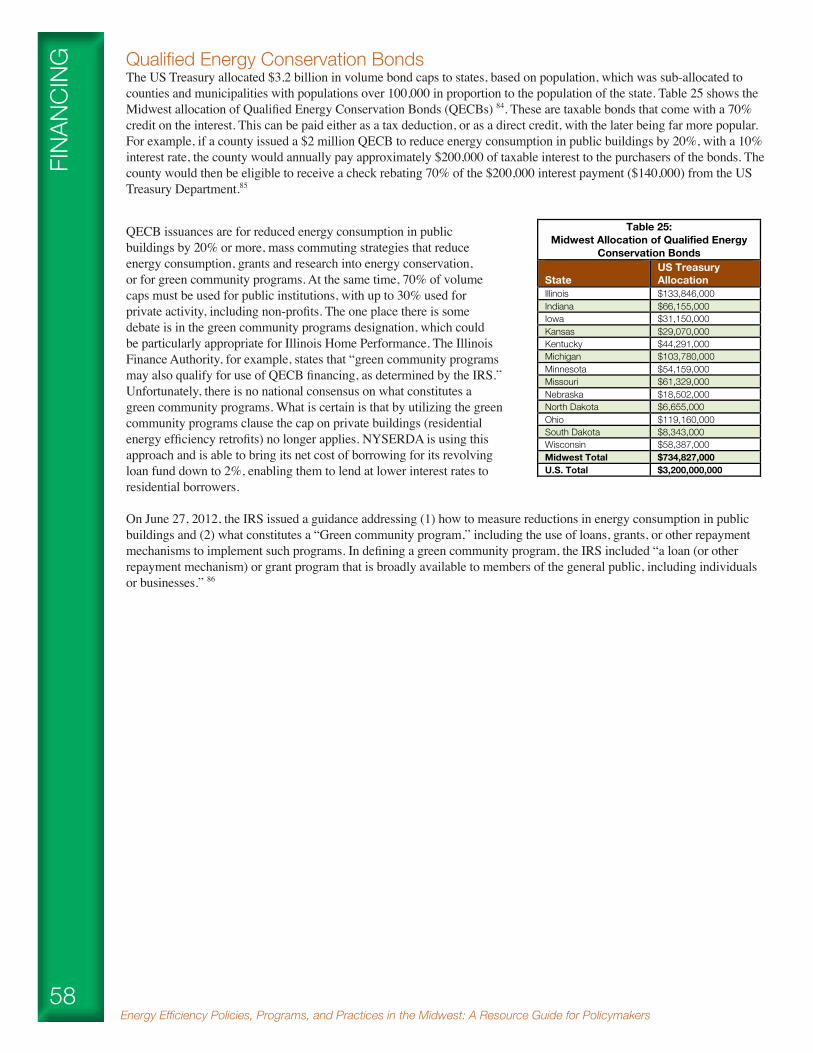
Energy Efficiency Policies, Programs, and Practices in the Midwest: A Resource Guide for Policymakers58
FINA
NCIN
G Qualified Energy Conservation BondsThe US Treasury allocated $3.2 billion in volume bond caps to states, based on population, which was sub-allocated to counties and municipalities with populations over 100,000 in proportion to the population of the state. Table 25 shows the Midwest allocation of Qualified Energy Conservation Bonds (QECBs) 84. These are taxable bonds that come with a 70% credit on the interest. This can be paid either as a tax deduction, or as a direct credit, with the later being far more popular. For example, if a county issued a $2 million QECB to reduce energy consumption in public buildings by 20%, with a 10% interest rate, the county would annually pay approximately $200,000 of taxable interest to the purchasers of the bonds. The county would then be eligible to receive a check rebating 70% of the $200,000 interest payment ($140,000) from the US Treasury Department.85
QECB issuances are for reduced energy consumption in public buildings by 20% or more, mass commuting strategies that reduce energy consumption, grants and research into energy conservation, or for green community programs. At the same time, 70% of volume caps must be used for public institutions, with up to 30% used for private activity, including non-profits. The one place there is some debate is in the green community programs designation, which could be particularly appropriate for Illinois Home Performance. The Illinois Finance Authority, for example, states that “green community programs may also qualify for use of QECB financing, as determined by the IRS.” Unfortunately, there is no national consensus on what constitutes a green community programs. What is certain is that by utilizing the green community programs clause the cap on private buildings (residential energy efficiency retrofits) no longer applies. NYSERDA is using this approach and is able to bring its net cost of borrowing for its revolving loan fund down to 2%, enabling them to lend at lower interest rates to residential borrowers.
On June 27, 2012, the IRS issued a guidance addressing (1) how to measure reductions in energy consumption in public buildings and (2) what constitutes a “Green community program,” including the use of loans, grants, or other repayment mechanisms to implement such programs. In defining a green community program, the IRS included “a loan (or other repayment mechanism) or grant program that is broadly available to members of the general public, including individuals or businesses.” 86
80 Energy Efficiency Policies, Programs, and Practices in the Midwest
Table 25: Midwest Allocation of Qualified Energy
Conservation Bonds State
US Treasury Allocation
Illinois $133,846,000 Indiana $66,155,000 Iowa $31,150,000 Kansas $29,070,000 Kentucky $44,291,000 Michigan $103,780,000 Minnesota $54,159,000 Missouri $61,329,000 Nebraska $18,502,000 North Dakota $6,655,000 Ohio $119,160,000 South Dakota $8,343,000 Wisconsin $58,387,000 Midwest Total $734,827,000 U.S. Total $3,200,000,000

59
ConclusionAs is apparent, the Midwest has made great strides in adopting policies and launching programs that promote energy efficiency by state and local governments, as well as electric and natural gas utilities and their residential, commercial, and industrial customers. These policies, programs and practices have saved energy and money while creating local jobs.
This resource guide is intended to be the first step when reviewing new energy efficiency policies and programs. We hope this resource is beneficial and serves, in some small way, to assist Midwestern states to achieve more energy savings through efficiency.
CONCLUSIO
N

Energy Efficiency Policies, Programs, and Practices in the Midwest: A Resource Guide for Policymakers60
APPE
NDIX
Appendix 1
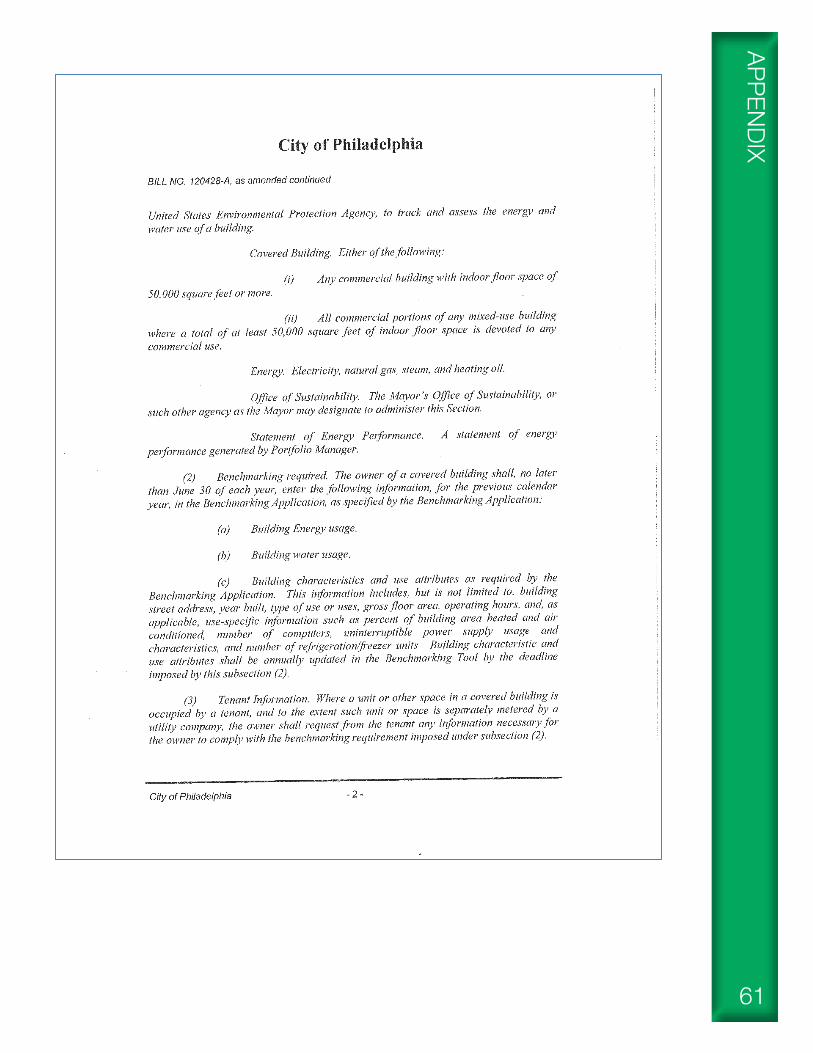
61
APPENDIX
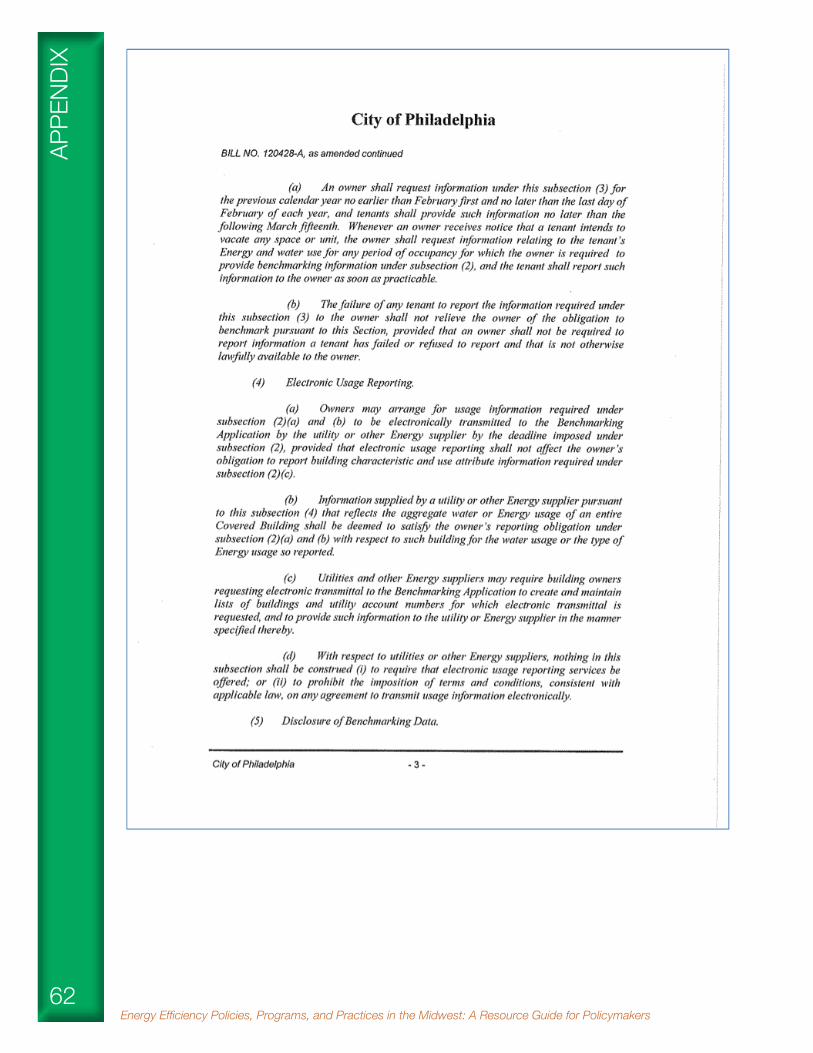
Energy Efficiency Policies, Programs, and Practices in the Midwest: A Resource Guide for Policymakers62
APPE
NDIX
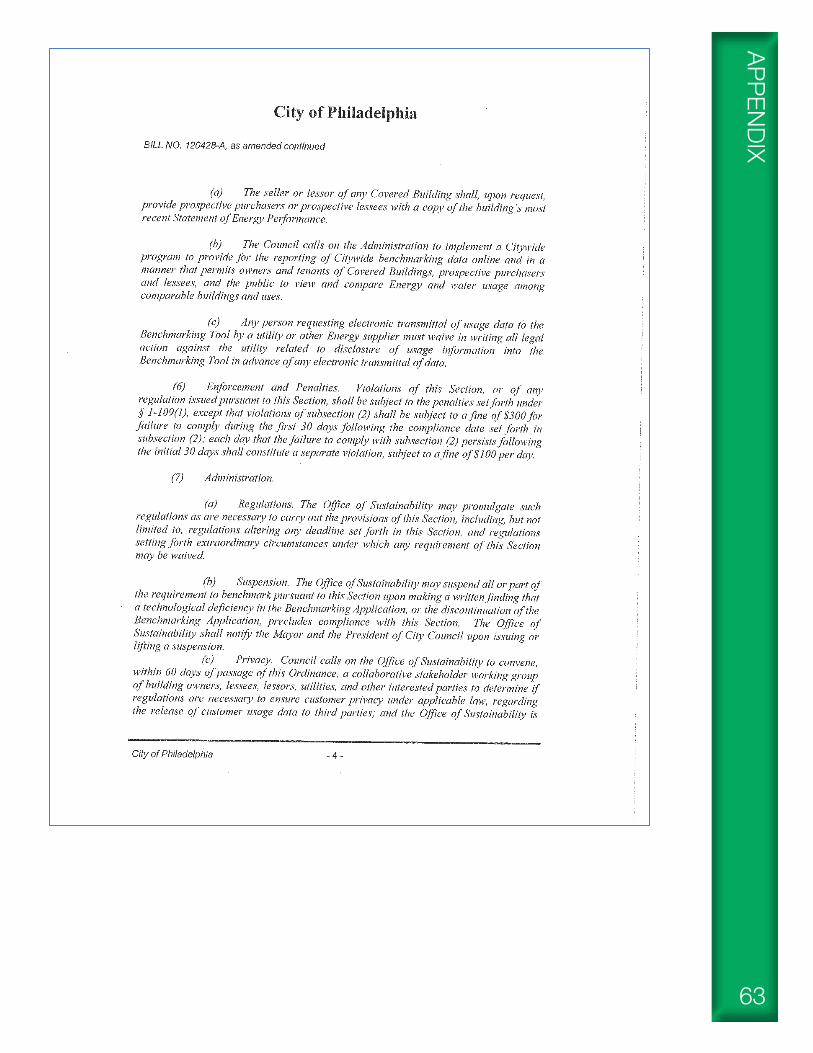
63
APPENDIX

Energy Efficiency Policies, Programs, and Practices in the Midwest: A Resource Guide for Policymakers64
APPE
NDIX
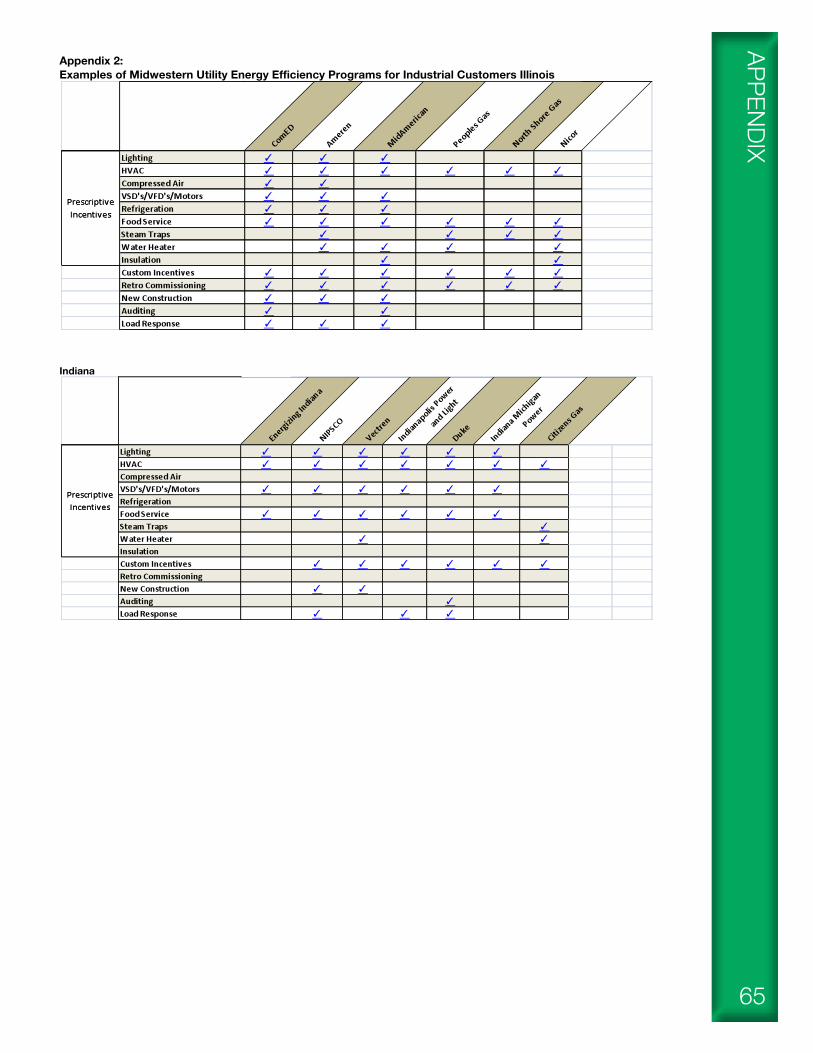
65
APPENDIX
Appendix 2: Examples of Midwestern Utility Energy Efficiency Programs for Industrial Customers Illinois
Indiana
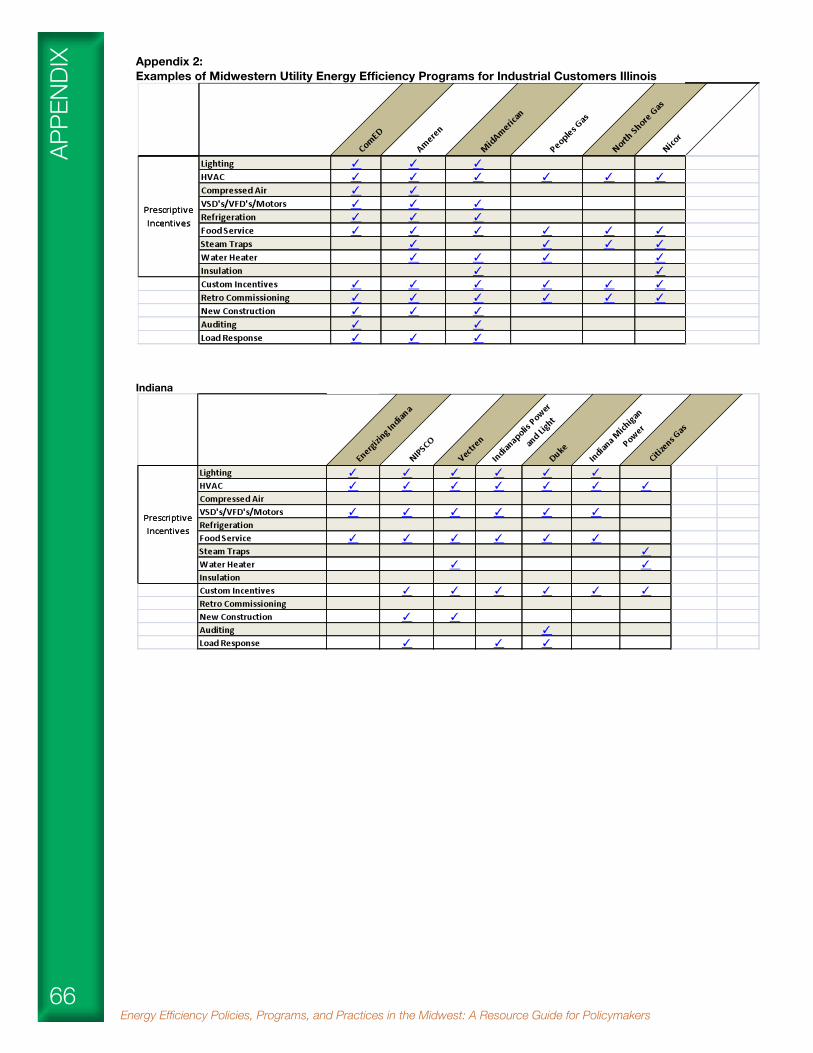
Energy Efficiency Policies, Programs, and Practices in the Midwest: A Resource Guide for Policymakers66
APPE
NDIX
Appendix 2: Examples of Midwestern Utility Energy Efficiency Programs for Industrial Customers Illinois
Indiana

67
APPENDIX
Iowa
Kentucky

Energy Efficiency Policies, Programs, and Practices in the Midwest: A Resource Guide for Policymakers68
APPE
NDIX
Michigan
Minnesota
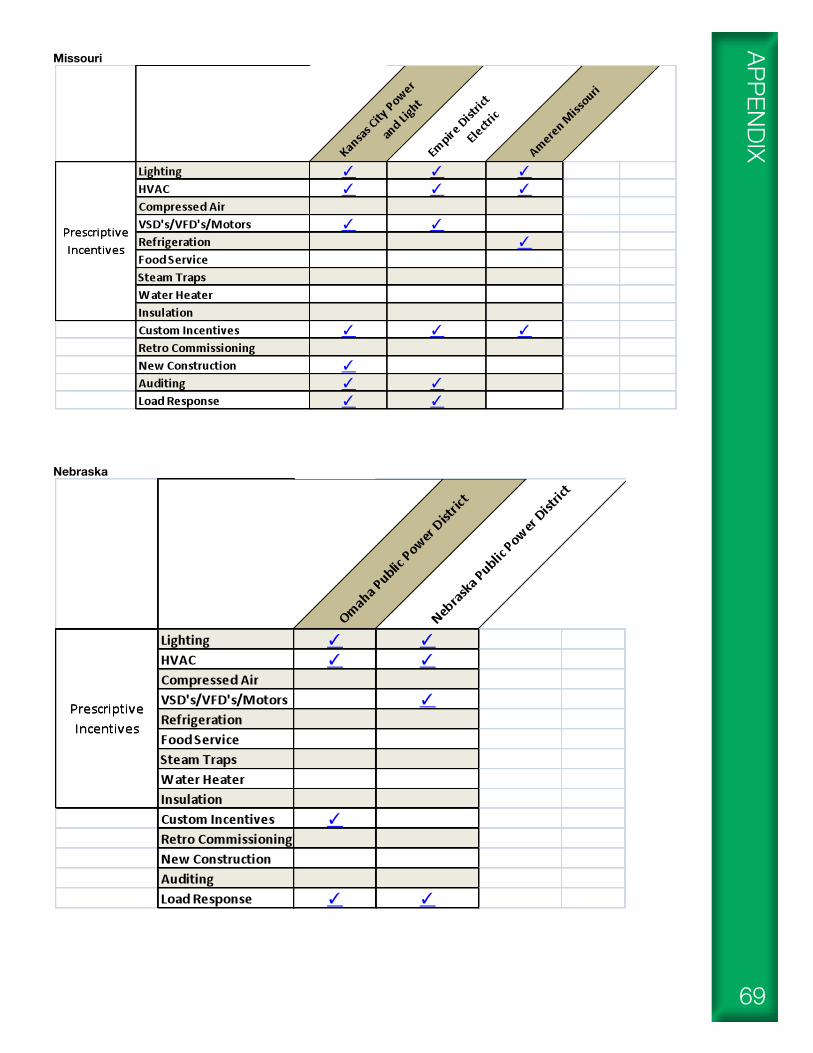
69
APPENDIX
Missouri
Nebraska
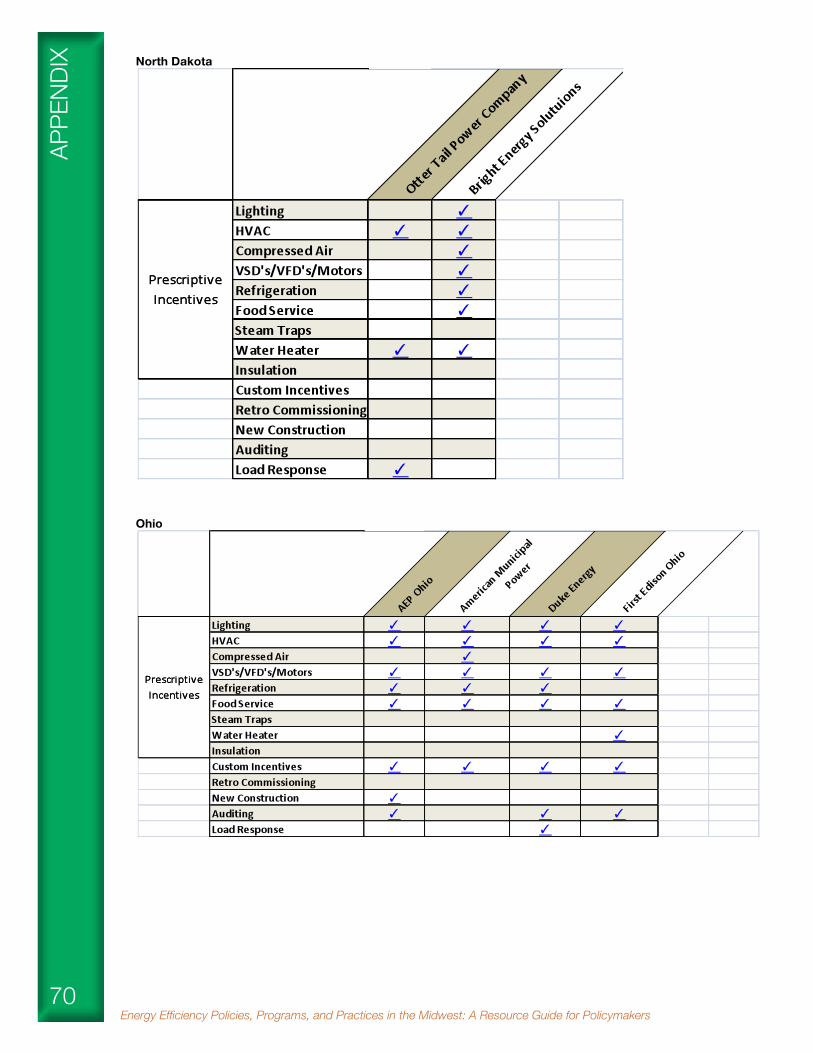
Energy Efficiency Policies, Programs, and Practices in the Midwest: A Resource Guide for Policymakers70
APPE
NDIX
North Dakota
Ohio
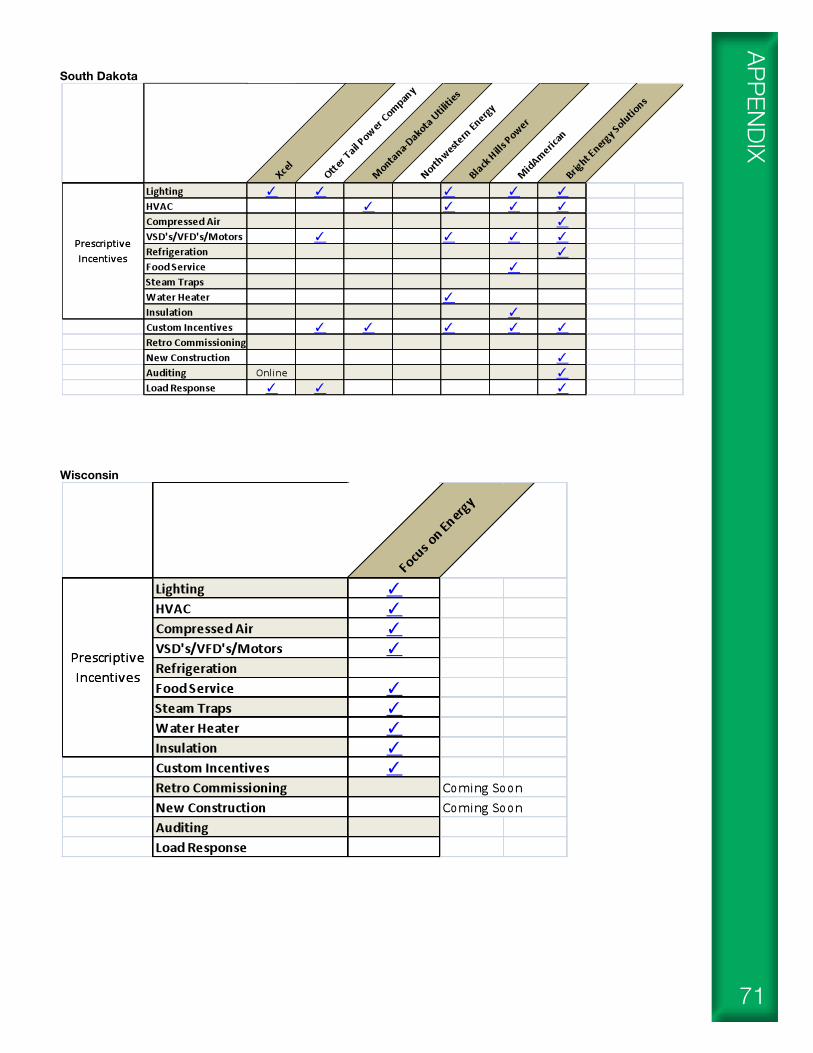
71
APPENDIX
South Dakota
Wisconsin
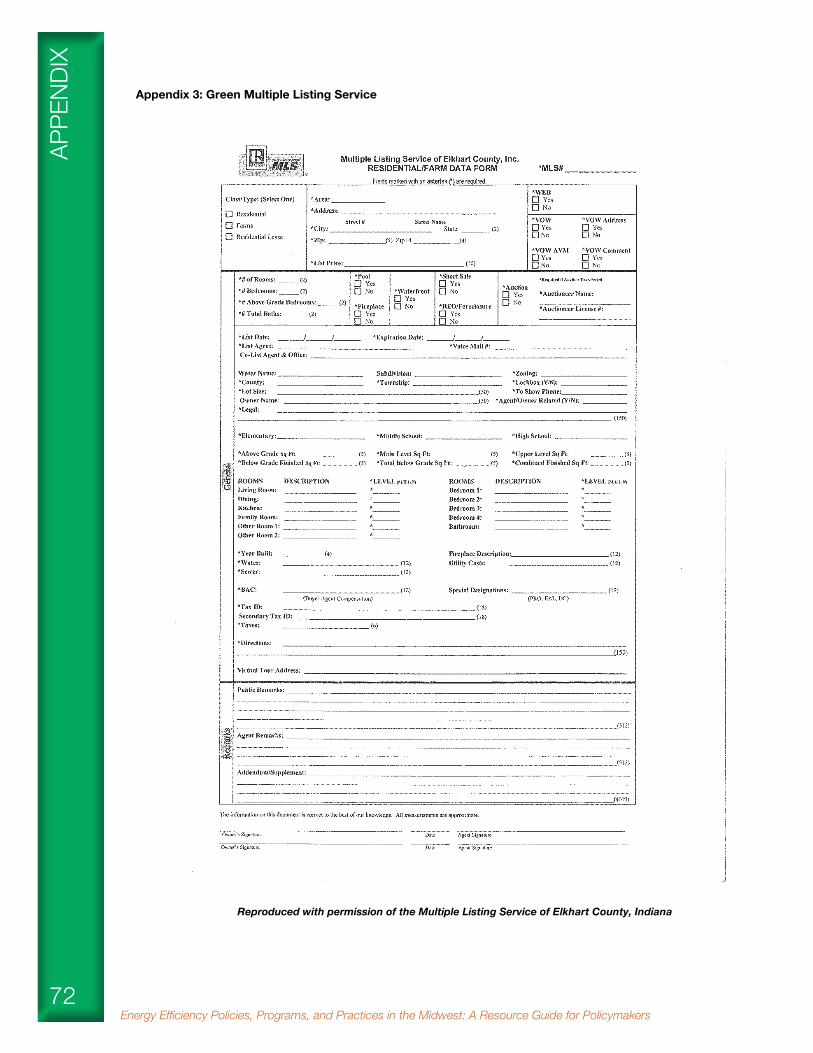
Energy Efficiency Policies, Programs, and Practices in the Midwest: A Resource Guide for Policymakers72
APPE
NDIX
Appendix 3: Green Multiple Listing Service
Reproduced with permission of the Multiple Listing Service of Elkhart County, Indiana

73
APPENDIX
Reproduced with permission of the Multiple Listing Service of Elkhart County, Indiana

Energy Efficiency Policies, Programs, and Practices in the Midwest: A Resource Guide for Policymakers74
EndnotesEN
DNO
TES
90 Energy Efficiency Policies, Programs, and Practices in the Midwest
Endnotes
1 Thompson, T., Benz, J., Broz, J., Kozey, M., Agiesta, J., and Junius, D. 2012. Energy Issues: How the Public Understands and Act. Chicago, IL: The Associated Press-NORC Center for Public Affairs Research. 2 US Department of Energy, http://www4.eere.energy.gov/challenge/home 3 Energy Policy Act of 1992 (Pub. Law 102-486) Section 201. 4 Regulatory Assistance Project. 2011. U.S. States with Integrated Resource Planning or Similar Planning Process (Effective December 2009) http://www.raponline.org/search/document-library/?keyword=integrated+resource+planning&submit=Submit&publish_date_preset=&publish_date_start=&publish_date_end=&document_type_id=&sort=publish_date&order=desc 5 Synapse Energy Economics, “A Brief Survey of State Integrated Resource Planning Rules and Requirements” April 28, 2011. http://www.cleanskies.org/wp-content/uploads/2011/05/ACSF_IRP-Survey_Final_2011-04-28.pdf 6 Wisconsin Public Service Commission, Final Strategic Energy Assessment: Energy 2016 http://psc.wi.gov/apps35/ERF_view/viewdoc.aspx?docid=145514 7 220 ILCS 5/16-111.5B 8 MEEA, Wisconsin’s Energy Efficiency Programs: Continuing to Bring Savings and Create Jobs (October 2011) http://mwalliance.org/sites/default/files/uploads/MEEA_2011_Wisconsins-Energy-Efficiency-Programs-Continuing-to-Bring-Savings-and-Create-Jobs-FULL.pdf 9Sciortino, M; M. Neubauer; S. Vaidyanathan; A. Chittum; S. Hayes; S. Nowak; and M. Molina. 2011. The 2011 State Energy Efficiency Scorecard. Washington, DC: American Council for an Energy-Efficient Economy (October 2011) 10 Midwestern Governors Association, Midwestern Energy Security and Climate Stewardship Roadmap: Advisory Group Recommendations (2009), p. iii. http://www.midwesterngovernors.org/Publications/Roadmap.pdf 11 Iowa Code 476.6.16 (b) 12 SF 2386 (2008) http://coolice.legis.state.ia.us/Cool-ICE/default.asp?category=billinfo&service=billbook&GA=82&hbill=SF2386 13 Regulatory Assistance Project, Revenue Regulation and Decoupling: A Guide to Theory and Application (2011) http://www.raponline.org/document/download/id/902 14 American Council for an Energy-Efficient Economy, The 2011 State Energy Efficiency Scorecard http://www.aceee.org/sites/default/files/publications/researchreports/e115.pdf 15 Omaha Public Power District, Draft Report : Consideration of Rate Design Modifications to Promote Energy Efficiency Investments. http://www.oppd.com/prodconsump10g/groups/system/documents/webcontent/22_005383.pdf 16 Freeman, R.E. 1984. Strategic Management: A Stakeholder Approach. Harper Collins. 17 Cullather, K.K. 1997. Electric Cooperatives, Their Stakeholders and Their Environment. Proceedings of the 22nd Annual Conference of the National Association of Environmental Professionals, May 19-23, 1997. Orlando, Florida. 18 Osborne, D. and Gaebler, T. 1992. Reinventing Government: How the Entrepreneurial Spirit is Transforming the Public Sector. Basic Books. 19 Schiller, S.R.; Goldman, C.A.; and Galawish, E. 2011. National Energy Efficiency Evaluation, Measurement and Verification (EM&V) Standard: Scoping Study of Issues and Implementation Requirements. Lawrence Berkeley National Laboratory, p. 6. 20 Schiller, S.R.; Goldman, C.A.; and Galawish, E. 2011, p. 6. 21 Northeast Energy Efficiency Partnerships. http://neep.org/emv-forum/about-emv-forum 22 U.S. Department of Energy. http://www1.eere.energy.gov/deployment/m/ump_about.html 23 [NAPEE] National Action Plan for Energy Efficiency. (2008). Understanding Cost-Effectiveness of Energy Efficiency Programs: Best Practices, Technical Methods, and Emerging Issues for Policy-Makers. Energy and Environmental Economics, Inc. and Regulatory Assistance Project. Accessed at http://www.epa.gov/cleanenergy/documents/suca/cost-effectiveness.pdf 24 Neme, C. & Kushler, M. (2010). “Is it Time to Ditch the TRC? Examining Concerns with Current Practice in Benefit-Cost Analysis.” In Proceedings of the 2010 ACEEE Summer Study on Energy Efficiency in Buildings. Washington, DC: American Council for an Energy-Efficient Economy. Accessed at http://www.aceee.org/files/proceedings/2010/start.htm. 25 NAPEE. (2008). 26 NAPEE. (2008). 27 Shirley, W. (2008). Benefit Cost Tests for Energy Efficiency. Presented at Kansas Corporation Commission Workshop on Energy Efficiency, March 25, 2008. Montpelier, VT: Regulatory Assistance Project. Accessed at www.raponline.org/docs/RAP_Shirley_EEBenefitCostTests_2008_03_25.pdf. 28 Neme & Kushler. (2010). 29 NAPEE. (2008). 30 NAPEE. (2008). 31 Shirley. (2008). 32 Shirley. (2008). 33 NAPEE. (2008). 34 NAPEE. (2008). 35 Shirley. (2008). 36 Shirley. (2008). 37 NAPEE. (2008). 38 NAPEE. (2008). 39 Shirley. (2008). 40 Neme & Kushler. (2010). 41 NAPEE. (2008). 42 NAPEE. (2008). 43 Shirley. (2008). 44 Shirley. (2008).
75
EndnotesENDNO
TES
A Best Practices Handbook 91 for Policymakers
45 Kushler, Nowak, Witte. (2012) 46 Woolf, T., Malone, E., Takahashi, K., and Steinhurst, W. (2012). Best Practices in Energy Efficiency Program Screening: How to Ensure the Value of Energy Efficiency is Properly Accounted For. Washington, DC: National Home Performance Council. http://www.nhpci.org/images/NHPC_Synapse-EE-Screening_final.pdf 47 Kushler, M., Nowak, S., & Witte, P. (2012). A National Survey of State Policies and Practices for the Evaluation of Ratepayer-Funded Energy Efficiency Programs (No. U122). Washington, DC: American Council for an Energy-Efficient Economy. Retrieved from http://aceee.org/research-report/u122. 48 Haeri, H. and M.S. Khawaja. (2012). “The Trouble with Freeriders: the debate about freeridership in energy efficiency isn’t wrong, but it is wrongheaded.” Public Utilities Fortnightly. March 2012. Pp. 34-42. 49 Weaver, T., and Farnsworth, G. (2010) Attribution Issues: The Net Versus Gross Savings Debate. Focus Report (EDRP-F-38), May 30, 2010. 50 Smart Grid Information Clearinghouse http://www.sgiclearinghouse.org 51 Citizens Utility Board http://www.citizensutilityboard.org/cubsGuideToMunicipalElectricityAggreation.html 52 See data from 2005 Residential Energy Consumption Survey (RECS): http://www.eia.gov/emeu/recs/recs2005/c&e/detailed_tables2005c&e.html 53 See data from 2005 Residential Energy Consumption Survey (RECS): http://www.eia.gov/emeu/recs/recs2005/c&e/detailed_tables2005c&e.html 54 Maine Public Utilities Commission. 2008. Report on LD 1655 Building Energy Codes. Augusta, ME: Maine Public Utilities Commission. 55 XENERGY, 2001. Impact Analysis of the MA 1998 Residential Code Revisions. Prepared for the Massachusetts Board of Building Regulation and Standards. Portland, Ore. http://www.energycodes.gov/publications/research/documents/codes/Massachusetts_rpt.pdf 56 NPR Group. 2009. Residential Building Energy Standards Compliance Analysis. Somerville, MA: NMR Group, Inc. 57 San Francisco Existing Commercial Buildings Energy Performance Ordinance 58 City of Philadelphia, Bill No. 120428-A. 59 Nevada Senate Bill 258 of 2009 (as enrolled) 60 National Association of Regulatory Utility Commissioners, Resolution on Access to Whole-Building Energy Data and Automated Benchmarking (Adopted July 20, 2011) http://www.naruc.org/Resolutions/Resolution%20on%20Access%20to%20Whole-Building%20Energy%20Data%20and%20automated%20Benchmarking.pdf 61 Public Law 2005, Chapter 534 (14 M.R.S.A. §6030-C, and 35-A M.R.S.A. §10006) 62 Austin, Texas Energy Conservation Audit and Disclosure (ECAD) Ordinance 63 Energy Information Administration, State Energy Data http://www.eia.gov/state/ 64 Energy Information Administration, State Energy Data http://www.eia.gov/state/seds/hf.jsp?incfile=sep_sum/plain_html/sum_btu_ind.html 65 National Association of Manufacturers and The Alliance to Save Energy (NAM/ASE). 2005. Efficiency and Innovation in U.S. Manufacturing Energy Use. http://patapsco.nist.gov/mep/documents/pdf/about-mep/reports-studies/energy-nam.pdf 66 NAM/ASE. 2005. p. 1. 67 Chittum, A. 2011. Follow the Leaders: Improving Large Customer Self-Direct Programs. Washington, DC: American Council for an Energy-Efficient Economy. http://www.aceee.org/research-report/ie112 68 Chittum. 2011. 69 Chittum. 2011. 70 Indiana Utility Regulatory Commission. Cause No. 43955. Order March 21, 2012, pp. 41-42. 71 Most of the information came from U.S. DOE’s Database of State Incentives for Renewables & Efficiency (DSIRE) www.dsireusa.org 72 Combined Heat and Power Installation Database (U.S. Department of Energy and ICF International) http://www.eea-inc.com/chpdata/ 73 Federal Energy Regulatory Commission Staff. 2010. National Action Plan for Demand Response, p. 3. http://www.ferc.gov/legal/staff-reports/06-17-10-demand-response.pdf 74 Federal Energy Regulatory Commission. 2009. Staff Report, A National Assessment of Demand Response Potential, p. xii. http://www.smartgrid.gov/sites/default/files/pdfs/ferc_06-09_demand_response.pdf 75 IURC, Order in Cause No. 44080, June 6, 2012. 76 2011 Nebraska State Energy Plan http://www.neo.ne.gov/Energyplan2011.pdf 77 FHFA Statement on Certain Energy Retrofit Loan Programs, July 6, 2010 http://ase.org/sites/default/files/nodes/2200/FHFA_PACE.pdf 78 77 Fed. Reg. 3958 (January 26, 2012) 79 NGA Center for Best Practices. 2011 80 Sleeping Lion Associates. 2012. On-bill Financing (OBF) – Discussion Paper Prepared for High Meadows Fund. http://www.highmeadowsfund.org/storage/research-and-learning-documents/energy-related-documents/01-15-12%20OBF%20FINAL%20report.pdf 81 Bell, CJ, S. Nadel, and S. Hayes. 2011. On-Bill Financing for Energy Efficiency Improvements: A review of current program challenges, opportunities and best practices. Washington, D.C.: American Council for an Energy-Efficient Economy. 82 NGA Center for Best Practices. 2011. State Clean Energy: Financing Guidebook. http://www.nga.org/files/live/sites/NGA/files/pdf/1101CLEANENERGYFINANCING.PDF 83 Public Act 96-0817 84 Internal Revenue Service, Notice 2009-29, Qualified Energy Conservation Bonds for 2009. http://www.irs.gov/pub/irs-drop/n-09-29.pdf 85 http://www.il-fa.com/products/communities/qecb.html 86 Internal Revenue Service, Notice 2012-44, “Qualified Energy Conservation Bonds.” June 27, 2012.

ABO
UT
ENERGY EFFICIENCY POLICIES, PROGRAMS, AND PRACTICES IN THE MIDWEST:A RESOURCE GUIDE FOR POLICYMAKERS
© Copyright 2012Midwest Energy Efficiency Alliance20 North Wacker Drive, Suite 1301
Chicago, Illinois 60606www.mwalliance.org
Funded in part by