Embed Size (px)
Citation preview

Energy Efficiency as a Critical Resource for Sustainable Development
Mark D. LevineLawrence Berkeley Lab
WORKSHOP ON INTERNATIONAL SCIENTIFIC AND TECHNOLOGICAL CO-OPERATION FOR SUSTAINABLE
DEVELOPMENTSouth Africa 21-22 November 2005

Outline of Presentation
• Energy Efficiency and Sustainable Development• Five Programs that could make a huge difference to Africa’s urban sector, where commercial energy is largely used
— Demand-Side Management and Market Transformation (for energy efficient technology)— Energy Efficiency Standards & Labels for Appliances— Building Energy Performance Standards— Promoting Energy Efficiency in the Public Sector— Voluntary Agreements for Industrial Energy Efficiency

Importance of Energy Efficiency
Promoting energy efficiency investment could be one of the most critical policies in advancing sustainable development in the developing world.
The reason: energy supply is one of the most capital intensive of industries. Urbanization and industrial development push hard on energy supply, which demands huge amounts of capital, which then starves infrastructure (health, highways, education) of needed investment.
Energy efficiency especially for urbanizing areas is a way out of this bind: it pays for itself and has low capital requirements. This can change the macroeconomic balance of the economy.
The key example is China which has the longest sustained period of high economic activity in the world. Between 1980 and 2000, China quadrupled GDP while increasing energy demand by a factor of two – by explicit policy design.

I. Utility Demand-Side Management andMarket Transformation for Energy Efficiency
Demand-Side Management for energy efficiency is a program to bring existing products into the market much more rapidly than would otherwise have happened
• Generally involves a utility incentive program to induce consumer investment• Utilities have invested >$1.5B/yr over past decade
(Declined in late 1990’s and increased more recently)• USEPA/DOE Energy Star have been highly supportive of utility DSM
Market Transformation for energy efficiency is a program undertaken to establish energy efficient products in the competitive market place
• Many examples highly successful programs:
Programs have been highly cost-effective in most instances and have resulted in substantial electricity savings

Residential Examples
• Lighting – torchieres, compact fluorescent bulbs and fixtures, design
• Appliances – clothes washers, refrigerators (including bulk procurement)
• Consumer electronics (low power standby)• Windows• HVAC and distribution systems (ducts)• New construction – codes, labels, ratings• Manufactured housing• Residential contractor program (CA)
Note: Energy Star (DOE/EPA Program) lends substantial credibility to many of the above

Commercial and Industrial Examples
• Lighting – products and design practices• HVAC – chillers and unitary systems• Operations and maintenance (O&M)• Schools – modular classrooms, daylighting• Motors – products, testing, repair, ag
pumping• Compressed air • Industrial – paper mills, chip industry, etc• Food service industry and supermarkets
Note: one way of providing these services often used is the Energy Service Company (ESCo) industry
II. Standards & Labels
$137$81Purchase Price
Model BModel BModel AModel A
How People Choose
$698$698$1145$1145Total Price
$561$561$1064$1064Energy Cost
$137$81Purchase Price
Model BModel BModel AModel A
The Real Choice
Why we need standards and labels

Standards & Labels Viewed as Investment in Power Production
0
1
2
3
4
5
6
7
GasCombined
Cycle
Clean Coal CombustionTurbine
Geothermal Wind Standards &Labels
Ann
ualiz
ed C
ost i
n 19
99 (
cent
s pe
r KW
h)
Cost of Electricity from various new sources:

Appliance Standards ImproveEfficiency Dramatically
Average Energy Consum ption for New Refrigerators (kiloW att-hours/year)
0
200
400
600
800
1000
1200
1400
1600
1800
2000
1960 1965 1970 1975 1980 1985 1990 1995 2000 2005Year
kWh/
a
1972, first oil priceshocks (1726 kW h/a)
Average 1980 model had 19.6 cu.ft.of capacity, used 1278 kW h/a andused CFC-blown foam insulation.
1990 Standard (976 kW h/a)
1993 Standard (686 kW h/a)
2001 Standard (476 kW h/a)
By 2001, a typical model has 20cu.ft. of capacity, features morethrough-the-door services like iceand water, uses about 63% lessenergy (476 kW h/a) than the1980 models and uses ozone-friendly foam insulation.
Average 1961 model hadapproximately 12 cu.ft. ofcapacity, used 1015 kW h/a andused fiberglass insulation.
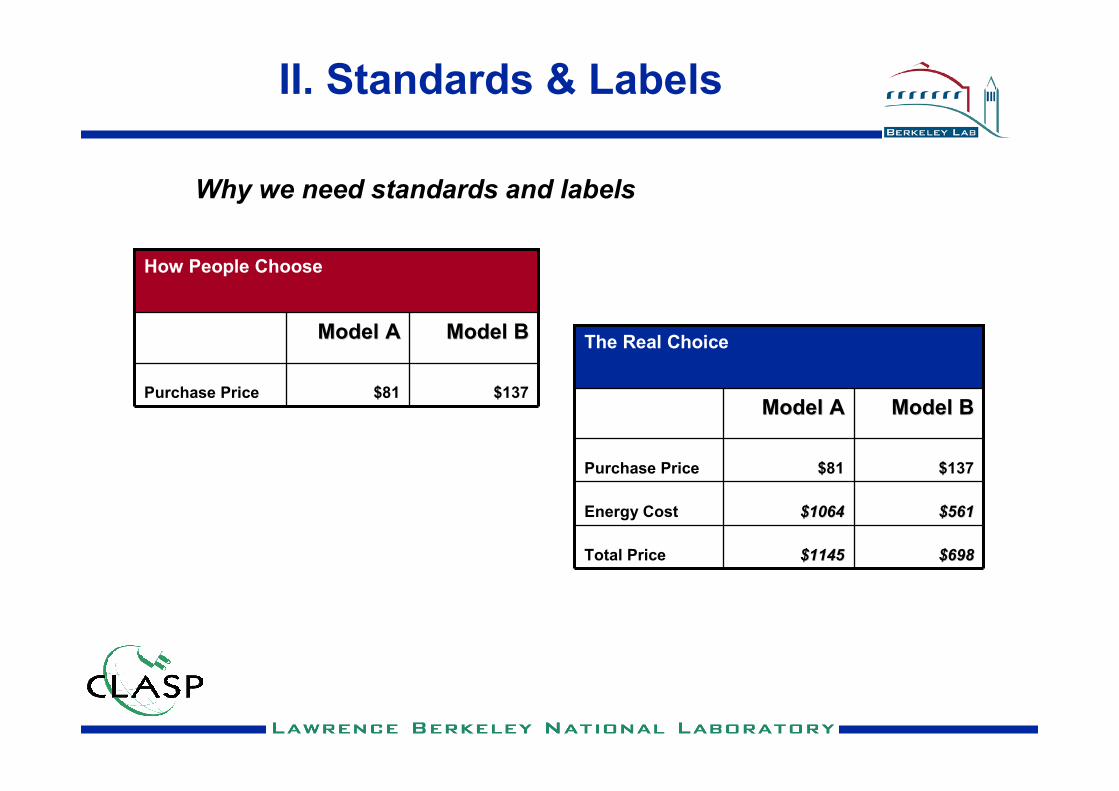
Energy Labels Inform Consumers

Existing Standards & Labels Are Benefiting the U.S. Economy
• Federal spending = $2 per household Efficiency investments stimulated = $900 per household Energy bill savings = $2400 per household
• Primary energy savings = 8 to 9% of 2020 residential energy use
• Peak power savings = 20% of 2001-2020 total growth
• Cumulative net dollar savings = $150 billion
Lifetime Benefits from 1987-2001 Standards for 9 Residential Products
VoluntaryVoluntary
AgreementsAgreements
III. Energy Performance Standards for Buildings
• In U.S. and in most urban areas, buildings account for ~40% of total energy use• Efficiency Is easy to build Into new construction• Despite the benefits of energy efficiency, market failures prevent the introduction of the best technologies and designs in all countries. • Strong policies are necessary to overcome these barriers.• These policies can be strikingly successful,• Energy efficiency codes and standards are the foundation for successful energy policy interventions.• In the U.S., the first building energy standards in the 1970s were designed to eliminate highly inefficient design practices• Advanced building standards and guidelines encourage designers to use state-of-the-art methods and equipment• Good building codes reduce unnecessary energy use by requiring efficient lighting, improved building envelopes, energy-saving windows and window design, optimized ventilation systems, improved control systems
Inefficient Buildings
• Combine excessive illumination levels, often producing glare and discomfort with low efficiency equipment and bad design thus— Interior zones experience cooling loads all 12
months of the year and—The interior zones’ demand for cooling and
ventilation often differs radically from the perimeter zones’ needs
—The perimeter is poorly insulated, if at all, and has large areas of clear single pane glass, creating peak cooling loads much larger than those for interior zones
—Thus, HVAC systems require cooling the whole building to meet the maximum load in one zone and then reheating the remaining portions of the building
Moderate Efficiency Buildings
• More realistic lighting levels and moderate efficiency equipment
• Variable air volume systems that reduce cooling to a zone before adding heat
• Variable speed drives for fans and other types of equipment
• Envelopes with insulation levels that reduce life cycle costs and eliminate much solar heat gain through

Weaknesses of Intermediate Level Codes and Standards
• Ventilation requirements often are in conflict with the cooling requirements, leading to unnecessary cooling
• Variable air volume devices often don’t work as originally intended, compromising comfort, air quality, and energy efficiency
• Occupants have little control over temperature, ventilation or lights

Highly Efficient Buildings
• Much lower average lighting energy use reduces imbalance between heating and cooling requirements of perimeter zones relative to interior zones
• Good levels of insulation, thermal mass where appropriate and good solar control further limit the imbalance of heating and cooling needs between zones

Highly Efficient Buildings - II
• Separate ventilation systems from heating and cooling systems, to improve humidity control and to assure adequate volumes of fresh air when it is needed—This allows cooling air volumes to vary to all
the way down to zero as necessary, or alternatives to air-based heating and cooling distribution systems
• Better controls allowing individuals to change ventilation levels, lighting levels, and temperature levels to better suit their needs
• All of these features allow reductions in the size of heating and cooling systems, and the ability to stage systems so that part-load efficiencies are high
Infrastructure to Support the Performance-based Method
• A performance standard is essentially a test protocol that applies to building designs, thus—It must be specified so thoroughly that two
different engineers will get the same results for the same building design
—This requires automated software that minimizes the need for designer input (and thus minimize the potential for error)
• Relationship between standards and other policies—Incentive programs have worked well in
offering financial incentives based on percent savings beyond code
IV. Promoting Energy Efficiency in the Public Sector
• Government is often country’s largest energy user• Promotion of Energy Efficiency in the Public
- lowers the cost of government operations- sets example for other consumers- “Pulls” the market for products and services
• In the U.S., the federal program is called the Federal Energy Management Program (FEMP)• LBNL is involved in many country activities, providing technical support and training
Brazil: public buildings; street lighting; water use Colombia: outdoor lightingDominican Republic: CFLs; adjust thermostats; clean light fixtures; computer power management; awareness campaignEcuador: Executive Decree: 15% reduction in public buildingsGhana: demonstration projects; training on simple housekeeping measuresRussia: audits performed; 20% reduction target setSouth Africa and China: modeling a program on U.S. FEMP

Why Energy Efficiency In the Government Sector?
• Government is often country’s largest energy user• Reducing government energy use:
—Lowers the cost of government operations—Sets example for other consumers—“Pulls” the market for products and services
• Response from suppliers: government buying-power can lead the market
—Slows energy demand growth• more capital and electricity system capacity available for
economic growth—Reduces pollution and greenhouse gas emissions

Potential National Savings – United States
• Federal, state and local government expenditures (in facilities alone):—US $16 billion/year on energy
bills (20% federal)—US $60 billion/year for energy-
using products—10-15% of energy spending in
total economy
• Efficient products usually save 20%-50%
• Potential national savings:—Federal government: US $200-250 million/year—State + local governments: US $1.2 billion/year—Reduces greenhouse gas emissions by over 4
MMTC/year

Programs and Policies
• Performance/savings targets• Purchasing energy-efficient products• Information and training• Standards and specs (for buildings
and/or equipment)• Energy audits• Alternative Financing
—Loans, revolving funds, performance contracts (inc. shared savings), utility incentives, budget reforms, etc.
• Demonstrations

VoluntaryVoluntary
AgreementsAgreements
V. Voluntary Agreements for Industrial Energy Efficiency
• Definition: Agreement between an industrial entity and government that establishes a mutually agreed upon target for energy-savings over a long-term period given specified supporting policies. Key characteristics:— signed, negotiated agreement with specific targets— long-term outlook (typically 5-10 years)— government supporting policies assist enterprises in
reaching targets— implementation plan for reaching the targets— annual monitoring of progress toward the targets
• Philosophy: Command-and-control approach is out-dated; voluntary agreement — promotes innovative approaches — establishes a positive working relationship between
government and industry

VoluntaryVoluntary
AgreementsAgreements
Voluntary Agreements: Key Elements
• Assessment of energy-efficiency potential— Benchmarking and energy-saving tool (BEST)
developed by LBNL• Establishment of supporting policies and
programs— Examples include financial assistance,
targeted tax reductions, self-monitoring, streamlined regulation, preference for contracts, government and public recognition
• Target-setting— Long-term targets that are ambitious, yet realistic— More than business-as-usual
• Voluntary Agreement contract• Implementation plan• Annual monitoring and evaluation

Results of VAs in The Netherlands: 1990-2000
75
80
85
90
95
100
1989
1990
1991
1992
1993
1994
1995
1996
1997
1998
1999
2000%
cha
nge
in e
nerg
y ef
ficie
ncy
from
bas
e ye
arachievementtarget

Conclusion
Effective implementation of 5 programs can reduce growth in energy use in buildings and industry a great deal (typically 2-5% per year, based on U.S. experience)
— Market Transformation (for energy efficient technology)— Energy Efficiency Standards & Labels for
Appliances— Building Energy Performance Standards— Promoting Energy Efficiency in the Public Sector— Voluntary Agreements for Industrial Energy
Efficiency
•Such programs can have very large and favorable impacts on developing countries. Their importance is not adequately recognized. As urban areas in Africa grow, it is of very great benefit to the countries to have such programs in place.