Embed Size (px)
Citation preview

ENERGY ECONOMICS

This page intentionally left blank

ENERGY ECONOMICS
Understanding Energy Securityin China
BY
YI-MING WEIQIAO-MEI LIANGGANG WUHUA LIAOCenter for Energy and Environmental PolicyResearch (CEEP), Beijing Institute of Technology (BIT),Beijing, China
United Kingdom � North America � Japan � India � Malaysia � China

Emerald Publishing LimitedHoward House, Wagon Lane, Bingley BD16 1WA, UK
First edition 2019
Copyright r 2019 Emerald Publishing Limited
Reprints and permissions serviceContact: [email protected]
No part of this book may be reproduced, stored in a retrieval system, transmitted inany form or by any means electronic, mechanical, photocopying, recording orotherwise without either the prior written permission of the publisher or a licencepermitting restricted copying issued in the UK by The Copyright Licensing Agencyand in the USA by The Copyright Clearance Center. Any opinions expressed in thechapters are those of the authors. Whilst Emerald makes every effort to ensure thequality and accuracy of its content, Emerald makes no representation implied orotherwise, as to the chapters’ suitability and application and disclaims any warranties,express or implied, to their use.
British Library Cataloguing in Publication DataA catalogue record for this book is available from the British Library
ISBN: 978-1-83867-294-2 (Print)ISBN: 978-1-83867-293-5 (Online)ISBN: 978-1-83867-295-9 (Epub)
Certificate Number 1985ISO 14001
ISOQAR certified Management System,awarded to Emerald for adherence to Environmental standard ISO 14001:2004.

Contents
List of Figures xvii
List of Tables xxv
About the Authors xxix
Preface xxxi
Chapter 1 Review of World Energy Situation andChina’s Energy Security 1
1.1. Review of World Energy Development 11.1.1. Global Fossil Energy Reserves Are Abundant but
Unevenly Distributed 11.1.2. Global Primary Energy Consumption
Hits a Record High 51.1.3. Global Renewable Energy Production and
Consumption Grow Steadily 71.1.4. Turmoil in the Middle East and North Africa and
European Debt Crisis Cause Drastic Fluctuation toInternational Crude Oil Price 10
1.2. New Trends in World Energy Development 111.2.1. Future World Energy Demand Will Continue
to Increase 111.2.2. Global Financial Crisis Provides New
Opportunities for the Development of Cleanand Renewable Energy 12
1.2.3. Fukushima Nuclear Accident Changes theWorld Nuclear Energy Development Plan 13
1.2.4. Shale Gas Overturns the Global NaturalGas Structure 16
1.2.5. World Energy Consumption StructurePresents a Clean and Low-carbon Trend 18
1.2.6. Primary Energy Consumption Structure Variesin Different Countries 21

1.3. Global Energy Trade Characteristics Analysis 221.3.1. Characteristics of Global Oil Trade 221.3.2. Characteristics of World Natural Gas Trade 241.3.3. Characteristics of World Coal Trade 26
1.4. Energy Consumption Characteristics and EnergySecurity in China 271.4.1. Energy Consumption Characteristics in China 271.4.2. Energy Security History in China 341.4.3. Current Situation of Energy Security in China 37
1.5. Interpretation and Understanding of Energy Security 391.5.1. Definition of Energy Security 391.5.2. Connotation and Evolution of Energy Security 40
1.6. Summary 43
Chapter 2 World Energy Geopolitics Development andChina’s Energy Diplomacy 45
2.1. Evolution of World Energy Geopolitical Relation 452.1.1. Britain and America’s Conquest in the Middle East 452.1.2. Confrontation between IEA and OPEC 50
2.2. New Pattern of Energy Geopolitics in the World 532.2.1. America Seeking for Oil Hegemony 532.2.2. Russia Skilled in Playing the “Energy Card” 542.2.3. EU and Japan in Contradiction 552.2.4. Rising Emerging Countries 552.2.5. OPEC Suffering Impact 56
2.3. Geopolitical Pattern of Five Major Oil-producing Regions 572.3.1. Geopolitical Pattern of Russia in Central Asia 572.3.2. Geopolitical Pattern of the Middle East 592.3.3. Geopolitical Pattern in Africa 622.3.4. Geopolitical Pattern in Latin America 642.3.5. Geopolitical Pattern of Asia-Pacific 65
2.4. Transition of China’s Energy Role 672.4.1. Transition from Oil-poor Country to Oil-exporting
Country 672.4.2. Transition from Oil-exporting Country to
Oil-importing Country 692.5. China’s Energy Diplomacy 69
2.5.1. China’s Energy Diplomacy in Russia inCentral Asia 70
2.5.2. China’s Energy Diplomacy in the Middle East 72
vi Contents

2.5.3. China’s Energy Diplomacy in Africa 732.5.4. China’s Energy Diplomacy in Latin America 742.5.5. China’s Energy Diplomacy in Asia-Pacific 75
2.6. Summary 77
Chapter 3 Oil Price and Energy Security 793.1. The World’s Oil Price System and Its Evolution 79
3.1.1. Formation of the World’s Oil Price System 793.1.2. Evolution of the Oil Price System 80
3.2. Analysis on International Oil Price FluctuationCharacteristics and Influence 843.2.1. Oil Price Fluctuation Characteristics 843.2.2. Main Influencing Factors of Oil Price Fluctuation 903.2.3. Impact of Oil Price Fluctuation on the
Economy and Finance 993.3. Development of Oil Finance and Its Risk Analysis 113
3.3.1. Significance of the Development of Oil Finance 1133.3.2. The Risks Involved in the Development
of Oil Finance 1163.3.3. Oil Future Market Speculation and
Price Fluctuation 1173.4. Oil Prices and China’s Energy Security 120
3.4.1. Oil Pricing Mechanism and China’sEnergy Security 120
3.4.2. Contradictions between Energy Securityand Food Security Caused by Oil Prices 122
3.4.3. Future Oil Price Trend and China’sEnergy Security 127
3.4.4. Oil Price and China’s Strategic PetroleumReserve (SPR) 131
3.5. Summary 142
Chapter 4 Assessment of Energy Import and TransportationRisk of China 143
4.1. Analysis on Transportation Risk of the MainEnergy Trade Channel of China 1434.1.1. Main Transportation Channel for the Energy
Trade of China 1434.1.2. Analysis of the Main Risk Faced by Marine
Transportation of Oil 1484.1.3. China’s Strategy to Reduce the Risk of Energy
Trade Transportation 151
Contents vii

4.2. Comparative Analysis on Comprehensive Risk ofChina’s Oil Import 1544.2.1. Differences between Crude Oil and Refined Oil
Trades in China 1544.2.2. Risk Assessment Model of the Investment
Portfolio of Oil Import 1574.2.3. Comparison between Specific Risk of Crude
Oil and Refined Oil Imports in China 1594.2.4. Comparison of the System Risk of Oil
Imports in China 1634.2.5. Main Conclusions 167
4.3. Comparative Analysis of Sino-US Crude Oil Import Risks 1684.3.1. Sino-US Crude Oil Import Status and External
Dependence 1684.3.2. Differences between Sino-US Crude Oil
Import Sources and Diversification 1694.3.3. Differences in the Strategy of Sino-US
Crude Oil Imports 1734.3.4. Comparison of Sino-US Crude Oil
Import Strategies 1794.3.5. Main Conclusions 179
4.4. Analysis of China’s Coal Trade and Transportation Risk 1814.4.1. History and Current Situation of China’s
Coal Trade 1814.4.2. Analysis of Coal Trade and
Transportation Risk 1824.5. Analysis of China’s Natural Gas Trade and
Transportation Risk 1854.5.1. Analysis of the Current Situation of Natural
Gas Supply and Demand in China 1854.5.2. China’s Natural Gas Trade and
Transportation Risks 1864.6. Summary 190
Chapter 5 Research on China’s Energy Reserve Strategy 1935.1. Status and Characteristics of Global Energy Reserves 193
5.1.1. History and Status of Global Energy Reserves 1935.1.2. Characteristics and Strategies of Strategic
Oil Reserves in the United States 1955.2. Best Supplement Time and Supplement Strategies of
China’s Strategic Oil Reserves 2005.2.1. Planning on Strategic Oil Reserve of China 200
viii Contents

5.2.2. Planning Model for Uncertain Dynamic ofStrategic Oil Reserves in China 201
5.2.3. The Optimal Supplement Time and Strategyof China’s Strategic Oil Reserves 205
5.3. Optimal Release Strategy of China’s Strategic OilReserves under Unexpected Incidents 2105.3.1. Dynamic Planning Model of Strategic Oil
Reserve Strategy 2105.3.2. Impact of Different Emergencies on International
Oil Prices 2165.3.3. Optimal Strategy of Strategic Oil Reserves in
China under Different Emergencies 2185.3.4. Impact of Supplement and Release of China’s
Strategic Oil Reserves on International Oil Prices 2215.3.5. Strategy on Refined Oil Reserve of China 222
5.4. Strategy on Natural Gas Reserve of China 2265.4.1. Natural Gas Reserve Patterns and
Characteristics of the World’sTypical Countries 226
5.4.2. Status and Strategy of Natural Gas Reserves inChina 228
5.5. Strategy on Coal Reserves of China 2305.5.1. Status of China’s Coal Reserves 2305.5.2. Recommendations on Coal Reserve Strategy 232
5.6. Summary 233
Chapter 6 Key Provincial Sectors for Energy Conservationin China 235
6.1. Introduction 2356.2. Data Descriptions 2386.3. Key Province for Energy Conservation in Agriculture
Sector (S1) 2406.4. Key (i,j) for Energy Conservation in Industrial Sectors
(S2�S40) 2406.5. Energy Consumption in Construction Industry (S41) 2456.6. Key (i,j) for Energy Conservation in the Tertiary
Industry (S42�S63) 2466.7. Rural and Urban Residential Energy Consumption
(S64 and S65) 2466.8. Conclusion 249
Contents ix

Chapter 7 Effects of Clean and Renewable Energy on NationalEnergy Security 253
7.1. Substitution Effect of World Clean and RenewableEnergy on Fossil Fuels 2537.1.1. Growth Rates of Clean and Renewable Energy 2537.1.2. The Proportion of Clean and Renewable Energy
Will Continue to Increase in the Future 2577.2. Substitution Effect of China’s Clean and Renewable
Energy on Fossil Fuels 2587.2.1. China’s Clean and Renewable Energy Is Growing
Rapidly 2587.2.2. China Is Rich in Water Resources 2607.2.3. China’s Nuclear Power Is Expected to Account
for 4�5% of the Total Installed Capacity ofElectricity in 2020 261
7.2.4. China’s Wind Power Is Developing Rapidly 2627.2.5. China Has Broad Solar Energy
Utilization Prospects 2637.2.6. Status and Potential of Biomass
Energy Development 2647.3. International Comparison of Clean and Renewable
Energy Development Policies 2667.3.1. Target Guidance 2667.3.2. Policy Incentives 2667.3.3. Industry Support 2687.3.4. Financial Support 269
7.4. Summary 270
Chapter 8 Energy Poverty and Energy Use Security 2718.1. Relationship between Energy Poverty and Energy
Use Security 2718.1.1. Energy Poverty and International
Status Thereof 2718.1.2. China’s Current Situation of Energy Poverty 273
8.2. Research on Major Influencing Factors of Energy Poverty 2808.2.1. Influencing Factors 2808.2.2. Method Introduction 2868.2.3. Model Results and Analysis 287
8.3. Regional Energy Poverty Assessment in China 2918.3.1. Energy Development Index in
Developing Countries 291
x Contents

8.3.2. Energy Poverty Index of Provinces in China 2928.3.3. Main Conclusions 296
8.4. Summary 297
Chapter 9 Energy Supply Crisis and Economic Security Research 2999.1. Analysis on the History and Impacts of World
Energy Crisis 2999.1.1. Historical Review of the World Energy Crisis 3009.1.2. Analysis on the Impact of Oil Crisis on Global
Macro-economy 3019.2. Analysis of Energy Supply Shortage Events in China 306
9.2.1. Typical Events of Energy Supply Shortage inChina in Recent Years 306
9.2.2. Analysis on the Influencing Factors ofChina’s Energy Supply Shortage 308
9.3. Research of Social Economic Effects of OilSupply Shortage 3109.3.1. Scenario Setting of Crude Oil Supply Shortage 3109.3.2. Impact of Crude Oil Supply Shortage on
China’s Social Economy 3119.4. Research on the Social Economic Effects of the Increase
in International Crude Oil Price 3179.4.1. Scenario Setting of the Increase in International
Crude Oil Price 3189.4.2. Impact of Increase in International Crude Oil
Price on China’s Social Economy 3189.5. Analysis on the Emergency Plan of the Refined
Oil Supply Shortage 3259.5.1. Refined Oil Supply System in China 3269.5.2. Model Setting 3309.5.3. Comparison among the Effects of Different
Emergency Plans for Dealing with Refined OilSupply Shortage 331
9.6. Summary 335
Chapter 10 Energy Consumption and Public Health in China 33910.1. Overview of Impact on Environment and Public Health
of Energy Consumption 33910.1.1. Overview of Impact on Environment of Energy
Consumption 33910.1.2. Overview of Research on Public Health Effect
Caused by Environmental Pollution 341
Contents xi

10.1.3. Overview of Public Health Effect Caused byRegional Pollution and Industrial Emission 342
10.2. Economic Assessment of Urban Air Pollution andPublic Health Effect 343
10.2.1. Research Background 34310.2.2. Evaluation Method and Data Resource of
Environmental Health Effect 34410.2.3. Environmental Health Effect and Its Economic
Loss of Urban Air Pollutant 34510.2.4. Scenario Analysis 352
10.3. Economic Evaluation of Public Health Effect due to SectorPollutant Emission 352
10.3.1. Evaluation Method and Data Resource of Impacton Public Health by Sector Pollutant Emission 354
10.3.2. Health Effects and Economic Loss Evaluationof Sector Emission 363
10.3.3. Economic Loss Evaluation of Sectors’ MarginalHealth Impact 367
10.3.4. Economic Loss Evaluation of Energy MarginalHealth Impact 369
10.3.5. Scenario Analysis 36910.4. Main Conclusions and Suggestions 371
Chapter 11 Comprehensive Evaluation of NationalEnergy Security 377
11.1. Comparison of Energy Security Policies ofTypical Countries 377
11.1.1. Increase the Energy Technology Investmentand Try Every Possible Way to Realize theEnergy Technology Break Out 379
11.1.2. Implementing Diversification Strategy forEnergy Import Trading and DispersingEnergy Import Risk 381
11.1.3. Energy-importing Countries made Great Effortsto Develop Strategic Reserves and ImproveEnergy Emergency Ability 383
11.1.4. Optimizing Energy Consumption Structureand Encouraging Development of ClearRenewable Resource 384
11.1.5. Paying Attention to Energy Geopolitics andDeveloping Diversified Diplomacy andCooperation of Energy 387
xii Contents

11.1.6. Establishing Efficient Energy Security ManagementInstitution and Making Energy Emergency Lawsand Regulations 388
11.2. Comprehensive Evaluation Index System and Methodfor Energy Security 390
11.2.1. Comprehensive Evaluation Index System ofEnergy Security 390
11.2.2. Comprehensive Evaluation Mode ofEnergy Security 392
11.3. Comparison of Energy Supply Security inTypical Countries 392
11.3.1. The Energy Supply Security Index of TypicalDeveloped Countries Generally Presented aFluctuant Rising Trend 396
11.3.2. Energy Supply Security Index of TypicalDeveloping Countries Presented DecliningTrend Generally 400
11.3.3. After the 2008 Global Financial Crisis, MostCountries’ Energy Supply Security IndexRose Dramatically 403
11.3.4. Main Conclusions 40411.4. Overall Evaluation of China’s Energy Security
against the Background of Climate Change 40411.4.1. Impacts of Climate Change on China’s Energy
Security Policy 40511.4.2. Data Sources and Pretreatment 40611.4.3. China’s Energy Supply Security Index Increased
First and Then Decreased 40711.4.4. China’s Energy Use Security Index Rose in
Fluctuations 41011.4.5. Climate Protection and China’s Energy Security 41211.4.6. Main Conclusions 413
11.5. Summary 414
Chapter 12 Challenges and Outlook of China’s Energy Security 41512.1. Challenges of China’s Energy Security 415
12.1.1. Challenge of Rapid Energy Consumption Growth 41512.1.2. Challenge of Diversified Factors Threatening
Energy Security 41612.1.3. Challenge of Transformation from Single Security
to Multiple Security 41712.1.4. Challenge Brought by Global Climate Change 418
Contents xiii

12.1.5. Challenge to Control and Protect Environment 41812.1.6. Challenge to Control Total Energy Consumption 419
12.2. Outlook of China’s Energy Supply and Demand 42112.2.1. Growth Rate of Energy Demand Falls Back
Gradually but with Many Uncertainties in theFall-back Degree 421
12.2.2. Proportion of Coal Consumption DecreasesGradually, but Those of Natural Gas andRenewable Energy Consumption Increase 422
12.2.3. Output Growth of Crude Oil and Coal SlowDown Gradually and Clean Low-carbon EnergyFlourishes Rapidly on the Whole 422
12.2.4. As Important Places of Energy ProductionRelocate Toward the Western China, Large-scaleand Long-distance Energy Allocation andTransportation Will Cause New Problems ofSecurity and Management 423
12.2.5. Implementing Total Quantity Control PoliciesSuffers from Predicament and CompletingObjectives Depend on Policy Priority 424
12.3. Outlook of China’s Energy Security 42512.3.1. Energy Import Keeps Growing and Dependence
on Foreign Energy Intensifies Continuously 42512.3.2. Diversify Energy Transport Corridors and
Declining Transportation Risk 42512.3.3. The Energy Reserve System will be Relative
Completed with a Vast Scale of NationalEnergy Reserves 426
12.3.4. Further Deepening Reform of Energy Marketingand Gradually Optimized Price System 427
12.3.5. Although the Population under Energy PovertyDecreases Rapidly, China Still Has a LongWay to Go to Thoroughly EliminateEnergy Poverty 428
12.4. Countermeasures and Suggestions for SafeguardingEnergy Security of China 430
12.4.1. Optimize Storage and Transportation �Marketing � Cooperation System and ConstructNational Energy Security Framework 430
12.4.2. Optimize Industrial Structure and RealizeLow-carbon Development Path 430
xiv Contents

12.4.3. Realize Diversification of Energy Import andReduce Risk of Import Transportation 431
12.4.4. Realize Industrialization of Renewable Energy byFinancial Tax Means 431
12.4.5. Strengthen Planning and Macro-control and MeetDemand for Energy Investment 431
12.4.6. Establish the Energy Security Early-warningSystem and Protect Energy Supply Security 432
References 433
Index 447
Contents xv

This page intentionally left blank

List of Figures
Chapter 1
Figure 1.1. Proved Recoverable Coal Reserves in Different Regions(2010). . . . . . . . . . . . . . . . . . . . . . . . . . . . 2
Figure 1.2. Global Proved Oil Reserves (1980�2010). . . . . . . . . . 3Figure 1.3. Proved Crude Oil Reserves in Different Regions. . . . . . . 3Figure 1.4. World’s Top 10 Countries of Oil Reserves and Annual
Growth Rate (2010). . . . . . . . . . . . . . . . . . . . . 4Figure 1.5. Global Proved Natural Gas Reserves (1980�2010). . . . . 4Figure 1.6. Proved Natural Gas Reserves in Different Regions. . . . . 5Figure 1.7. Proportions of World’s Top 10 Countries of Natural Gas
Reserves (2010). . . . . . . . . . . . . . . . . . . . . . . 5Figure 1.8. Global Primary Energy Consumption and Growth Rate
(2000�2010). . . . . . . . . . . . . . . . . . . . . . . . . 6Figure 1.9. Global GDP Growth Rate and Energy Consumption
Growth Rate (1980�2010).. . . . . . . . . . . . . . . . . 7Figure 1.10. Changes in Proportions of Energy Consumption in OECD
and Non-OECD Member Countries. . . . . . . . . . . . . 8Figure 1.11. Global Renewable Energy Installed Capacity or
Throughput (1996�2010). . . . . . . . . . . . . . . . . . 8Figure 1.12. Proportions of the World’s Major Biofuel-producing
Countries (2010). . . . . . . . . . . . . . . . . . . . . . . 9Figure 1.13. Global Renewable Energy Consumption and Growth
(1990�2010). . . . . . . . . . . . . . . . . . . . . . . . . 10Figure 1.14. WTI Crude Oil Future Price Trend (2010�2011). . . . . . 11Figure 1.15. Global Energy Demand Forecast (IEA, 2011). . . . . . . . 12Figure 1.16. Global New Investment for Renewable Energy
(2004�2011). . . . . . . . . . . . . . . . . . . . . . . . . 12Figure 1.17. Global New Investment for Renewable Energy
(2004�2010). . . . . . . . . . . . . . . . . . . . . . . . . 13Figure 1.18. Proportions of Nuclear Power in Primary Energy in the
World’s Major Countries (2010). . . . . . . . . . . . . . . 15Figure 1.19. Global Nuclear Power Generation and Proportion in Total
Power Generation. . . . . . . . . . . . . . . . . . . . . . 15
Figure 1.20. Natural Gas Prices in the World’s Major Markets(1996�2010). . . . . . . . . . . . . . . . . . . . . . . . . 17
Figure 1.21. World Primary Energy Consumption Structure. . . . . . . 19Figure 1.22. World Energy Consumption Structure Evolution Trend
(1970�2030). . . . . . . . . . . . . . . . . . . . . . . . . 19Figure 1.23. Global Energy Consumption Structure (2035). . . . . . . . 21Figure 1.24. Primary Energy Consumption Structure in Major Countries
(2010). . . . . . . . . . . . . . . . . . . . . . . . . . . . 22Figure 1.25. China’s Primary Energy Consumption Change
(1953�2010). . . . . . . . . . . . . . . . . . . . . . . . . 27Figure 1.26. China’s Primary Energy Consumption Structure Change
(1953∼2010). . . . . . . . . . . . . . . . . . . . . . . . . 29Figure 1.27. Energy Flow Map of China (2010). . . . . . . . . . . . . 31Figure 1.28. Casualty Number of Mine Security Accidents and Mortality
per Million Tons of Coal in China (1949∼2009). . . . . . . 37Figure 1.29. Sulfur Dioxide Emissions in Main Countries Worldwide
(1990∼2008). . . . . . . . . . . . . . . . . . . . . . . . . 37Figure 1.30. Carbon Dioxide Emissions in Main Countries Worldwide
(1900∼2007). . . . . . . . . . . . . . . . . . . . . . . . . 38
Chapter 2
Figure 2.1. China’s Oil Production, Consumption, and Net ImportVolume (1965�2010). . . . . . . . . . . . . . . . . . . . 68
Figure 2.2. Proportions of China’s Overseas Investment Projects in AllRegions (2010).. . . . . . . . . . . . . . . . . . . . . . . 70
Figure 2.3. Overseas Upstream Oil and Gas Assets Rights and InterestsOutput of Chinese Enterprises (10,000 tons). . . . . . . . . 71
Chapter 3
Figure 3.1. Nominal and Actual Crude Oil Price (1861�2010). . . . . 85Figure 3.2. Spare Capacity of OPEC (US Energy Information
Administration). . . . . . . . . . . . . . . . . . . . . . . 89Figure 3.3. Contract Price of WTI Futures (January 2, 2008�August,
2011). . . . . . . . . . . . . . . . . . . . . . . . . . . . 90Figure 3.4. Responses of Brent Oil Prices to Structural One Standard
Deviation Shocks. . . . . . . . . . . . . . . . . . . . . . 95Figure 3.5. Contributions of OPEC’s Political Risk Shocks to the Oil
Price Fluctuations (%). . . . . . . . . . . . . . . . . . . . 96Figure 3.6. Brent Oil Prices’ Responses to Political Risk Shocks in
Different Countries. . . . . . . . . . . . . . . . . . . . . 97
xviii List of Figures

Figure 3.7. Brent Oil Prices’ Responses to Structural One StandardDeviation Shocks. . . . . . . . . . . . . . . . . . . . . . 98
Figure 3.8. Total Consumption Quantity of Various Oils in MainIndustries (2002�2009). . . . . . . . . . . . . . . . . . . 101
Figure 3.9. Impulse Response of Profit in Each Industry to Oil Price. . 105Figure 3.10. Impulse Response of Industry Investment to Oil Price. . . . 105Figure 3.11. Impulse Response of Ex-factory Price Index of Industrial
Products to Oil Price.. . . . . . . . . . . . . . . . . . . . 106Figure 3.12. Impulse Response Analysis of Road Transport Industry
Shock. . . . . . . . . . . . . . . . . . . . . . . . . . . . 107Figure 3.13. Oil Prices and Global Economy Recession.. . . . . . . . . 109Figure 3.14. Net Oil Export Revenues of OPEC. . . . . . . . . . . . . 114Figure 3.15. Biodiesel Production Trend. . . . . . . . . . . . . . . . . 125Figure 3.16. Raw Materials for Producing Bio-fuels in the United States
(2008). (a) Raw Materials for Producing Ethanol. (b) RawMaterials for Producing Biodiesel. . . . . . . . . . . . . . 125
Figure 3.17. Raw Materials for Producing Bio-fuels in the EU-25 (2008).(a) Raw Materials for Producing Ethanol. (b) RawMaterials for Producing Biodiesel. . . . . . . . . . . . . . 126
Figure 3.18. Flow Diagram of the SD-SPRC Release System. . . . . . . 132Figure 3.19. Values of International Oil Price and China’s Oil
Production under Three Different Scenarios.(a) International Oil Price (USD/barrell). (b) China’s OilProduction (10,000 Tons). . . . . . . . . . . . . . . . . . 137
Figure 3.20. Effects of SPR Release in the Highest and Lowest MarketThreshold. . . . . . . . . . . . . . . . . . . . . . . . . . 138
Figure 3.21. Effects of SPR Release in the Highest and Lowest MarketThreshold. . . . . . . . . . . . . . . . . . . . . . . . . . 140
Figure 3.22. Effects of SPR Release in the Highest and Lowest MarketThreshold. . . . . . . . . . . . . . . . . . . . . . . . . . 141
Chapter 4
Figure 4.1. Number of Global Pirate Attacks (2000�2010). . . . . . . 150Figure 4.2. Changes in Imports and Exports Volume of Crude Oil and
Refined Oil in China (1993�2010). . . . . . . . . . . . . . 155Figure 4.3. Average Monthly Imports of Crude Oil and Average
Monthly Price of Brent in China (1996�2010). . . . . . . . 156Figure 4.4. Relationship between Import Risk and Yield of
Crude Oil and Refined Oil under Different CorrelationCoefficients. . . . . . . . . . . . . . . . . . . . . . . . . 159
List of Figures xix

Figure 4.5. Diversification Index of Crude Oil and Refined Oil Importsin China (1994�2009). . . . . . . . . . . . . . . . . . . . 159
Figure 4.6. Price Variance of China’s Crude Oil and Refined OilImports (1995�2009). . . . . . . . . . . . . . . . . . . . 163
Figure 4.7. Yield of China’s Crude Oil and Refined Oil Imports during1995�2009. . . . . . . . . . . . . . . . . . . . . . . . . 164
Figure 4.8. Investment Portfolio Risk of China’s Oil Imports(1995�2009). . . . . . . . . . . . . . . . . . . . . . . . . 165
Figure 4.9. Distribution of Global Piracy Attacks (2005�2010). . . . . 166Figure 4.10. Sino-US Crude Oil Imports and External Dependence
(1996�2010). . . . . . . . . . . . . . . . . . . . . . . . . 169Figure 4.11. Diversification Index of Sino-US Crude Oil Imports
(1996�2009). . . . . . . . . . . . . . . . . . . . . . . . . 172Figure 4.12. Monthly Crude Oil Imports of Sino-US and Monthly
Average Price of Brent Spot (1996�2010). . . . . . . . . . 173Figure 4.13. Proceeds and Yields of US Crude Oil Import Strategy
Relative to China’s Actual Import Strategy. . . . . . . . . 180Figure 4.14. China’s Coal Import and Export Situation (2000�2010). . . 180Figure 4.15. China’s Coal Imports (2010). . . . . . . . . . . . . . . . . 182Figure 4.16. China’s Natural Gas Consumption and Its Proportion in
Energy Consumption (2001�2010). . . . . . . . . . . . . 185Figure 4.17. Production, Consumption, and External Dependence of
China’s Natural Gas (2006�2010). . . . . . . . . . . . . . 186
Chapter 5
Figure 5.1. Changes in Strategic Oil Reserves and International CrudeOil Price of the United States. . . . . . . . . . . . . . . . 197
Figure 5.2. Optimal Supplement Time and Strategy of Strategic OilReserves during 2011�2020, When the Probability of HighOil Prices Is Low. . . . . . . . . . . . . . . . . . . . . . 207
Figure 5.3. Optimal Supplement Time and Strategy of Strategic OilReserves during 2011�2020, When the Probability of HighOil Prices Is High. . . . . . . . . . . . . . . . . . . . . . 209
Figure 5.4. Monthly Average Price of International Brent Crude Oil(2010�2020). . . . . . . . . . . . . . . . . . . . . . . . . 214
Figure 5.5. Impact of Sudden Natural Disasters on International OilPrices. . . . . . . . . . . . . . . . . . . . . . . . . . . . 216
Figure 5.6. Impact of the Economic Crisis on International Oil Prices. . 217Figure 5.7. Impact of Local Armed Conflict on International
Oil Prices. . . . . . . . . . . . . . . . . . . . . . . . . . 218
xx List of Figures

Figure 5.8. Optimal Strategy of Strategic Oil Reserves in China underNatural Disaster Scenarios. . . . . . . . . . . . . . . . . 219
Figure 5.9. Optimal Strategy of Strategic Oil Reserves in China underEconomic Crisis. . . . . . . . . . . . . . . . . . . . . . . 220
Figure 5.10. Optimal Strategy of Strategic Oil Reserves in China underLocal Armed Conflict. . . . . . . . . . . . . . . . . . . . 221
Chapter 6
Figure 6.1. China’s Provincial Assignment of Energy IntensityReduction in 2011�2015. . . . . . . . . . . . . . . . . . 236
Figure 6.2. China’s Provincial GDP Per Capital, Energy Intensity, andEnergy Consumption. . . . . . . . . . . . . . . . . . . . 237
Figure 6.3. Province Name and Their Codes. . . . . . . . . . . . . . 238Figure 6.4. Key Provinces for Energy Conservation in China. (a) Diesel
and (b) Electricity. . . . . . . . . . . . . . . . . . . . . . 240Figure 6.5. Industrial Energy Consumption by Province in 2008 in
China. . . . . . . . . . . . . . . . . . . . . . . . . . . . 241Figure 6.6. China’s Urban Residential Oil Consumption and Income
Per Capita. . . . . . . . . . . . . . . . . . . . . . . . . . 249Figure 6.7. Air-condition Ownerships Per 100 Households across
China’s Provinces in 2010. . . . . . . . . . . . . . . . . . 250
Chapter 7
Figure 7.1. World Primary Energy Supply Structure in 2009.. . . . . . 254Figure 7.2. Global Renewable Energy Supply Structure in 2009. . . . . 254Figure 7.3. Average Annual Growth Rate of Various Energy Supplies
from 1990 to 2009. . . . . . . . . . . . . . . . . . . . . . 255Figure 7.4. Consumption of World Renewable Energy in Different
Regions in 2009. . . . . . . . . . . . . . . . . . . . . . . 255Figure 7.5. World Electricity Consumption Structure in 2009. . . . . . 256Figure 7.6. Proportion of China’s Hydropower and Nuclear Power in
Primary Energy Consumption. . . . . . . . . . . . . . . . 260Figure 7.7. China’s Hydropower Generation during 2005�2010.. . . . 261Figure 7.8. Distribution Map of China’s Total Wind Power Installed
Capacity in 2010. . . . . . . . . . . . . . . . . . . . . . . . 263Figure 7.9. China Solar PV Installation Capacity. . . . . . . . . . . . 264
List of Figures xxi

Chapter 8
Figure 8.1. Regional Distribution of Global Population under EnergyPoverty (2009). . . . . . . . . . . . . . . . . . . . . . . . 272
Figure 8.2. Scale Drawing of Major Rural Household Cooking Energyin Different Provinces/Municipalities (2010). . . . . . . . . 274
Figure 8.3. Distribution of Educational Background of Populationunder Energy Poverty in Chinese Rural Regions (2010). . . 275
Figure 8.4. Changes in Fuel Wood Consumption of Chinese RuralHouseholds and Per Capita Net Income (1998�2007). . . . 277
Figure 8.5. Changing Relationship between Per Capita Fuel WoodConsumption of Rural Residents in Provinces/Municipalities and Per Capita Income of Rural Residents(1998 and 2007). . . . . . . . . . . . . . . . . . . . . . . 278
Figure 8.6. Changes in Actual Living Consumption of Fuel Wood ofRural Families in Various Regions (1998�2007).. . . . . . 281
Figure 8.7. Changes in Total Consumption of Straw of Rural Familiesin Various Regions (1998�2007).. . . . . . . . . . . . . . 282
Figure 8.8. Bubble Chart of Total Per Capita Consumption of FuelWood and Straw and Per Capita Net Income of Householdsin Rural Regions of Various Provinces/Municipalities(2007). . . . . . . . . . . . . . . . . . . . . . . . . . . . 283
Figure 8.9. Forest Coverage of Different Chinese Provinces/Municipalities(2010). . . . . . . . . . . . . . . . . . . . . . . . . . . . . 286
Figure 8.10. Comprehensive Assessment of Energy Poverty Index inChinese Provinces/Municipalities (2010). . . . . . . . . . . 295
Figure 8.11. Regional Distribution of Energy Poverty Index in China(2010). . . . . . . . . . . . . . . . . . . . . . . . . . . . 296
Chapter 9
Figure 9.1. Contrast of Previous Global Oil Supply Shortage. . . . . . 301Figure 9.2. Linkage between Fluctuation in Oil Price and Global
Economic Growth (1970�2017). . . . . . . . . . . . . . . 302Figure 9.3. Oil Crisis and Major Oil-consuming Countries’ Economic
Growth (1970�2017). . . . . . . . . . . . . . . . . . . . 303Figure 9.4. Energy Crises and Economic Growth of Big Power Groups
(1970�2017). . . . . . . . . . . . . . . . . . . . . . . . . 303Figure 9.5. Oil Crisis and Economic Growth in Major Oil-exporting
Countries (1970�2017). . . . . . . . . . . . . . . . . . . 304Figure 9.6. Oil Crisis and Global Inflation (1970�2017). . . . . . . . . 305
xxii List of Figures

Figure 9.7. Social Inflation Rates in Major Oil Consuming Countries(1970�2017). . . . . . . . . . . . . . . . . . . . . . . . . 305
Figure 9.8. Impact of Oil Crisis on the US Employment(1970�2017). . . . . . . . . . . . . . . . . . . . . . . . . 306
Figure 9.9. Impact of Three Crude Oil Supply Shortage Scenarios onSectors’ Employment. . . . . . . . . . . . . . . . . . . . 315
Figure 9.10. Changes in Sectors’ Profits in the Three Scenarios of CrudeOil Supply Shortage. . . . . . . . . . . . . . . . . . . . . 316
Figure 9.11. Changes in Sectors’ Export in the Three Crude Oil SupplyShortage Scenarios. . . . . . . . . . . . . . . . . . . . . 317
Figure 9.12. Changes in Sectors’ Product Market Price underGovernment Regulation. . . . . . . . . . . . . . . . . . . 320
Figure 9.13. Changes in Sectors’ Product Market Price withoutGovernment Regulation. . . . . . . . . . . . . . . . . . . 321
Figure 9.14. Changes in Sectors’ Employment under GovernmentRegulation.. . . . . . . . . . . . . . . . . . . . . . . . . 321
Figure 9.15. Changes in Sectors’ Employment without GovernmentRegulation.. . . . . . . . . . . . . . . . . . . . . . . . . . 321
Figure 9.16. Changes in Sectors’ Profits under GovernmentRegulation.. . . . . . . . . . . . . . . . . . . . . . . . . 322
Figure 9.17. Changes in Sectors’ Profits without GovernmentRegulation.. . . . . . . . . . . . . . . . . . . . . . . . . 323
Figure 9.18. Feedback Model of the Causal Relationship betweenRefined oil Retail and Supply. . . . . . . . . . . . . . . . 327
Figure 9.19. Flow Model of Refined oil Retail Supply Stock. . . . . . . 328Figure 9.20. Scenario Simulation Results. . . . . . . . . . . . . . . . . 334
Chapter 10
Figure 10.1. Proportions of Health Effect Economic Loss Caused byAir Pollutants in Major Cities (2007). . . . . . . . . . . . 351
Figure 10.2. Proportions of Health Economic Loss of Major Cities inTheir Own Municipal Districts GDPs (2007). . . . . . . . 351
Figure 10.3. Evaluation Framework of City Dwellers’ EnvironmentHealth Economic Loss Based on Intake Fraction. . . . . . 356
Figure 10.4. Health Economic Loss Proportion Caused by Each Sector’sEmission (2007). . . . . . . . . . . . . . . . . . . . . . . 368
Figure 10.5. Ten Sectors with the Biggest Total Marginal Damage(2007). . . . . . . . . . . . . . . . . . . . . . . . . . . . 368
List of Figures xxiii

Chapter 11
Figure 11.1. Evaluation Index System of Energy Security.. . . . . . . . 391Figure 11.2. Change of Energy Supply Security Index of Representative
Developed Countries. . . . . . . . . . . . . . . . . . . . 395Figure 11.3. Change in Energy Supply Security Index of America
(2000�2010). . . . . . . . . . . . . . . . . . . . . . . . . 397Figure 11.4. Change of Energy Supply Security Index of Germany
(2000�2010). . . . . . . . . . . . . . . . . . . . . . . . . 398Figure 11.5. Change in Energy Supply Security Index of Japan
(2000�2010). . . . . . . . . . . . . . . . . . . . . . . . . 399Figure 11.6. Change of Energy Supply Security Index of
Representativeness Developing Countries. . . . . . . . . . 400Figure 11.7. Change in Energy Supply Security Index of China
(2000�2010). . . . . . . . . . . . . . . . . . . . . . . . . 402Figure 11.8. Changes in India’s Energy Supply Security Indexes
(2000�2010). . . . . . . . . . . . . . . . . . . . . . . . . 403Figure 11.9. China’s s Energy Supply Security Index and Energy
Consumption Volume (1996�2001). . . . . . . . . . . . . 409Figure 11.10. China’s Energy Consumption Security Index
(1996�2009). . . . . . . . . . . . . . . . . . . . . . . . . 411Figure 11.11. China’s Energy Security Composite Index (1996�2009). . . 413
xxiv List of Figures

List of Tables
Chapter 1
Table 1.1. Global Renewable Energy Development (2008�2010). . . . 9Table 1.2. Renewable Energy Consumption Proportions and
Development Targets in Some Countries. . . . . . . . . . 14Table 1.3. Major Oil Exporting Countries or Regions and Trade
Shares. . . . . . . . . . . . . . . . . . . . . . . . . . . . 23Table 1.4. Major Oil-importing Countries or Regions and Trade
Shares. . . . . . . . . . . . . . . . . . . . . . . . . . . . 24Table 1.5. China’s Crude Oil Importing Sources and Shares within
2008�2010 (%). . . . . . . . . . . . . . . . . . . . . . . 24Table 1.6. Chronology of Major Events of Energy Security in China. . 35
Chapter 3
Table 3.1. Specifications of the Eight sub-components of the PoliticalRisk Index.. . . . . . . . . . . . . . . . . . . . . . . . . 94
Table 3.2. Estimated Results of the Dummy Variables in the VectorAuto-regression Models. . . . . . . . . . . . . . . . . . . 96
Table 3.3. Estimated Results of SVAR Model. . . . . . . . . . . . . 104Table 3.4. Comprehensive Ranking of 10 Largest Oil Companies in the
World (in 2008, According to the ComprehensiveCalculation of Six Indexes). . . . . . . . . . . . . . . . . 123
Table 3.5. Ranking of 10 Largest Oil Companies in the World for FourIndexes including Total Income (2008).. . . . . . . . . . . 124
Table 3.6. Definition of Variables. . . . . . . . . . . . . . . . . . . 133Table 3.7. The Size of SPR which Effects the Stabilizing Oil Price Is
Best in Baseline Scenario. . . . . . . . . . . . . . . . . . 139Table 3.8. The Size of the SPR that Effects the Stabilizing Oil Price Is
Best in the Low International Oil Price Scenario.. . . . . . 140Table 3.9. The Size of the SPR that Stabilizes Oil Price Is Best in the
High International Oil Price Scenario. . . . . . . . . . . . 142
Chapter 4
Table 4.1. Main Routes of China’s Oil and Gas Imports. . . . . . . . 145Table 4.2. Comparison of Main Sources of Crude Oil Imports in China
in 2000 and 2011. . . . . . . . . . . . . . . . . . . . . . 149

Table 4.3. Comparison on the Share of Main Sources and Regions ofCrude Oil Imports between China and the United States in2010. . . . . . . . . . . . . . . . . . . . . . . . . . . . . 170
Table 4.4. Comparison on Monthly Imports of Crude Oil and Changesin International Oil Prices in China and the United States(Unit: Millions of Tons). . . . . . . . . . . . . . . . . . . 176
Table 4.5. Coal Export and Reserve-production Ratio in Australia(2006�2010). . . . . . . . . . . . . . . . . . . . . . . . . 184
Table 4.6. Coal Export and Reserve-production Ratio in Indonesia(2006�2010). . . . . . . . . . . . . . . . . . . . . . . . . 184
Chapter 5
Table 5.1. Release of US Strategic Oil Reserves. . . . . . . . . . . . 196Table 5.2. Definition and Description of Variables in the Model. . . . 204Table 5.3. The Optimal Supplement Time and Strategy of Strategic Oil
Reserves during 2011�2020 When the Probability of HighOil Prices Is Low. . . . . . . . . . . . . . . . . . . . . . 206
Table 5.4. Optimal Supplement Time and Strategy of Strategic OilReserves during 2011�2020 When the Probability of HighOil Prices Is High. . . . . . . . . . . . . . . . . . . . . . 208
Table 5.5. Variable Description of the Dynamic Planning Model. . . . 212Table 5.6. Setting for Main Parameter in the Dynamic Planning Model. 213Table 5.7. Features of Different Emergencies. . . . . . . . . . . . . . 215Table 5.8 Impact of Different Emergencies on International Oil Prices. 217Table 5.9. Impact of Supplement and Release of China’s Strategic Oil
Reserves on International Oil Prices. . . . . . . . . . . . . 223Table 5.10. Differences in Different Natural Gas Reserve Patterns.. . . 228
Chapter 6
Table 6.1. The Key and Most-key Province × Sector for EnergyConservation in China’s Industrial and Construction Sectors. 243
Table 6.2. The Key Province × Sector for Energy Conservation inChina’s Tertiary Industry. . . . . . . . . . . . . . . . . . 247
Table 6.3. Energy Consumption in Residential and Some TertiaryIndustries in 2008 in Beijing. . . . . . . . . . . . . . . . . 248
Table A1. Sector � Full Names and Their Codes.. . . . . . . . . . . 251
Chapter 7
Table 7.1. China’s Renewable Energy Resources. . . . . . . . . . . . 259Table 7.2. China’s Wind Power Installed Capacity from 2003 to 2010. 262
xxvi List of Tables

Table 7.3. Renewable Energy Development Goals in MajorCountries. . . . . . . . . . . . . . . . . . . . . . . . . . 267
Chapter 8
Table 8.1. Proportion and Ranking of Disease Deaths Caused byRespiratory Diseases in Chinese Rural Residents(2000�2009). . . . . . . . . . . . . . . . . . . . . . . . . 276
Table 8.2. Analysis of Influencing Factors of Energy Poverty in RuralHouseholds. . . . . . . . . . . . . . . . . . . . . . . . . 288
Table 8.3. Coefficients of Impacts on Traditional Biomass EnergyConsumption of Per Capita Net Income of RuralHouseholds in Provinces/Municipalities. . . . . . . . . . . 290
Table 8.4. Maximum and Minimum of Energy Poverty in 2010 inChina (2010).. . . . . . . . . . . . . . . . . . . . . . . . 294
Chapter 9
Table 9.1. World Crude Oil Supply Shortage Scenario. . . . . . . . . 311Table 9.2. Changes in Macro-variables in the Three Crude Oil Supply
Shortage Scenarios (%). . . . . . . . . . . . . . . . . . . 311Table 9.3. Changes of Three Savings against Different Scenarios (%). . 312Table 9.4. Impact on Macro-economy Indexes of Rising Oil Price under
Government Control (%). . . . . . . . . . . . . . . . . . 318Table 9.5. Impact on Macro-economy Indexes of Rising Oil Price
When There Is No Government Regulation (%). . . . . . . 319Table 9.6. Changes in Sectors’ Export under Government
Regulation (%). . . . . . . . . . . . . . . . . . . . . . . 324Table 9.7. Changes in Sectors’ Export without Government
Regulation (%). . . . . . . . . . . . . . . . . . . . . . . 325Table 9.8. System Variable Interpretation. . . . . . . . . . . . . . . 329Table 9.9. Parameter Setting in the Model. . . . . . . . . . . . . . . 331Table 9.10. Scenario Settings. . . . . . . . . . . . . . . . . . . . . . 332Table 9.11. Index Setting. . . . . . . . . . . . . . . . . . . . . . . . 333Table 9.12. Indexes in All Scenarios. . . . . . . . . . . . . . . . . . . 335
Chapter 10
Table 10.1. Valuations of Dose�response Relationship and HealthEffect. . . . . . . . . . . . . . . . . . . . . . . . . . . . 346
Table 10.2. Air Pollutant Concentration and Population Data in 113Key Environmental Monitoring Cities in China (2007). . . 347
List of Tables xxvii

Table 10.3. Health Effect and Economic Loss Caused by Air Pollution(2007). . . . . . . . . . . . . . . . . . . . . . . . . . . . 349
Table 10.4. Health Effect of Air Pollution and Valuation Lower andUpper Limits of Economic Loss. . . . . . . . . . . . . . . 353
Table 10.5. Health Effect and Economic Loss in the Scenario ofValuation Lower Limit (2007). . . . . . . . . . . . . . . . 354
Table 10.6. Health Effect and Economic Loss in the Scenario ofValuation Upper Limit (2007). . . . . . . . . . . . . . . . 355
Table 10.7. Corrected Intake Fractions of Primary and SecondaryPollutant. . . . . . . . . . . . . . . . . . . . . . . . . . 358
Table 10.8. SO2 and TSP Emissions, Sector Output, and EnergyConsumption Data of 24 Sectors in China. . . . . . . . . . 359
Table 10.9. Health Effect and Economic Loss Caused by All Sectors’ AirPollutant Emission (2007). . . . . . . . . . . . . . . . . . 364
Table 10.10. PM10 and SO2 Corresponding to Each Sector and TotalMarginal Damage (2007). . . . . . . . . . . . . . . . . . 365
Table 10.11. Marginal Damage of Energy. . . . . . . . . . . . . . . . 370Table 10.12. The Scenario of Valuation Lower Limit, the Health Effect,
and Economic Loss Caused by All Sectors’ Air PollutantEmission in 2007. . . . . . . . . . . . . . . . . . . . . . 372
Table 10.13. The Scenario of Valuation Upper Limit, Health Effect, andEconomic Loss of Air Pollutants Emitted by All Sectors in2007. . . . . . . . . . . . . . . . . . . . . . . . . . . . . 373
Table 10.14. Sector Sensitivity Analysis Result. . . . . . . . . . . . . . 374
Chapter 11
Table 11.1. Calculation Method and Description of Energy SecurityEvaluation Index. . . . . . . . . . . . . . . . . . . . . . 393
Table 11.2. Evaluation Index of Energy Security and Its Description. . 395Table 11.3. Data of Various Evaluation Indexes of China’s Energy
Supply Security (1996�2009). . . . . . . . . . . . . . . . 407Table 11.4. Various Evaluation Index Data of China’s Energy Use
Safety (1996�2009). . . . . . . . . . . . . . . . . . . . . 408
xxviii List of Tables

About the Authors
Yi-Ming Wei is Distinguished Professor of Energy and EnvironmentalEconomics at the Beijing Institute of Technology (BIT). He is the FoundingDirector of the Center for Energy and Environmental Policy Research at BIT.His recent research and teaching focuses on energy policy and energy economics,CO2 emission and climate policy, and energy and climate policy modeling. Hehas performed over 40 research projects for various Chinese governmental agen-cies including National Development and Reform Commission (NDRC),Ministry of Science and Technology (MOST), National Energy Administration(NEA), National Natural Science Foundation of China (NSFC), China NationalPetroleum Corporation (CNPC), STATE GRID Corporation of China (SGCC),and Chinese Academy of Sciences (CAS), and international organizations such asthe World Bank and The Seventh Framework of European Commission (EU-FP7).He has published 20 books and over 300 papers in peer-reviewed journalsincluding Nature-Climate Change, Nature-Energy, Climatic Change, EnergyEconomics, and Ecological Economics.
Qiao-Mei Liang is Professor in the School of Management and Economics atthe Beijing Institute of Technology. She received her PhD degree inManagement Science and Engineering from Chinese Academy of Sciences in2007. She was awarded by the Excellent Young Scientist Foundation ofNational Natural Science Foundation of China (NSFC) in 2014. She was alsoselected for the “Program for New Century Excellent Talents in University” bythe Ministry of Education, and the program of “Beijing-funded Plan forTalents”. Her main research interest is energy economic complex system model-ing and energy and environmental policy. She has undertaken more than 20 pro-jects which are supported by NSFC, European Union FP7, and so on. She haspublished more than 40 academic papers and seven books in collaboration withothers. She has received academic honors including Nomination Award ofNational Excellent Doctorate Dissertation of China and the Award of BeijingExcellent Doctorate Dissertation.
Gang Wu is Director of the Division of Business Administration in the Departmentof Management Sciences of the National Natural Science Foundation of China(NSFC). His research focuses on energy security and environmental policy. He haspublished five books and over 40 papers, and he has more than 20 papers publishedin international journals such as Energy Economics, Energy Policy, and AppliedEnergy. Professor Wu was awarded the 14th Young Scientist Award prize by theChina Association for Science and Technology (2015). He was a Visiting Scholarin the School of Engineering and Applied Sciences at Harvard University fromSeptember 2010 to September 2011.

Hua Liao is Professor and Deputy Director of the Center for Energy andEnvironmental Policy Research (CEEP) at Beijing Institute of Technology(BIT), China. He was awarded the Changjiang Young Scholar by the Ministryof Education of China. He is Vice President of the Chinese Society of EnergyEconomics and Management. He has been the Principal Investigator of over 10energy economics and climate policy research projects granted by the NationalNatural Science Foundation of China (NSFC) and other ministries of China.He has published over 70 articles in peer-reviewed journals and is one of the co-authors of China Energy Report (various volumes) and Energy Economics:Understanding and Interpreting Energy Poverty in China. He has served severaljournals as Editorial Member or Guest Editor.
xxx About the Authors

Preface
Since the Industrial Revolution, fossil energy such as coal and oil has graduallyreplaced fuel wood as the main body of energy consumption. With the restraintsin natural endowment and distribution of fossil energy resources, the interna-tional energy trade has emerged and expanded rapidly. The issue on how toensure sustainable and stable energy supply in the complex international energytrade has aroused general concern among energy-importing countries. As thefirst world oil crisis caused by the oil embargo movement launched by Arabcountries in 1973 led to huge economic losses of industrialized countries such asin European and American countries, the global economic growth ratedecreased from 6.8% in 1973 to 2.8% in 1974. In order to cope with the oil sup-ply shortage, the Organisation for Economic Co-operation and Development(OECD) established the International Energy Agency (IEA) in 1974 and initiallydefined the concept of energy security as the uninterrupted availability of energysources at affordable prices, which means that the energy supply shortageamount shall not exceed 7% of energy imports in the last year, and there shall beno continuous and unaffordable high oil prices.
Based on the long-term attention to and research on the energy security issue,we consider that the national energy security can be divided into two levels,energy economic security and energy eco-environmental security, among whicheconomic security refers to traditional energy supply security, and eco-environmental security refers to energy use security. In this book, energy securityis defined as reliable, affordable, and uninterruptible energy supply that can meetthe demands of national economic development and ensure the production and useof energy never destroys the sustainable development of ecological environment. Infact, the national energy security is just like a roof consisting of several tiles, andeach tile represents an influencing factor of energy security, such as geopolitics,energy transport, energy prices, energy reserves, armed conflicts, sabotage,strikes, technologies, accidents, natural disasters, and pollutant emission ofenergy consumption. Just like any defective tile may affect or cause rain leakageof a house to some extent, any factor may affect the national energy security.
Since the beginning of the industrialized development stage, energy, similar tocapital and labor, has become a production factor with significant influence on thenational economy. In particular, in the current period with high oil prices, theenergy crisis has become one of the important blasting fuses for evolution and devel-opment of the economic crisis. Therefore, energy security has been an importantpart of national security, arousing general concern among all countries in the world.
In recent years, the international energy market has been turbulent fre-quently. In 2008, the global financial crisis caused by the US subprime mortgagecrisis led to collapse in international crude oil prices, sharp decrease in invest-ment, and reduction in energy demands. However, the international oil prices

returned to the high level of USD 80/bbl rapidly when many international forecas-ters and investment banks reduced their future energy expectations in succession.The price fluctuation like a “roller coaster” had strong impact on the energy sup-ply security of all energy-importing countries. With the outbreak of “JasmineRevolution” in North African countries from the end of 2010 to the beginningof 2011 hitting the international energy market again when the countries hadn’tgone out of the shadows of global financial crisis and European debt crisis, thecrude oil prices rapidly broke through USD 100/bbl and 110/bbl in succession.The turbulent political situation in North African oil-exporting countries such asSultan and Libya caused huge fluctuation to the oil investment, production, andtrade. As the Gaddafi government was overthrown in August 2011, the storm of“Jasmine Revolution” blew over temporarily, and the international oil marketwent smoothly by a rare chance. *However, good times didn’t last long. As theIran nuclear crisis broke out again, with the further worsening of relationshipbetween US and Iran, Iran claimed the use of force to block the Strait ofHormuz in case of any conflict between the United States and Iran. As theUnited States and Europe jointly carried out economic sanctions to Iran at thebeginning of 2012, Iran responded intensely and threatened to interrupt the oilsupply to all European countries. Meanwhile, the three main Asian oil-importing countries including China, Japan, and India successively reduced theiroil import volumes from Iran under international pressure. In this case, theinternational oil market has been trapped in turbulence again, and the geopoli-tics of international energy has been increasingly complex and changeable.
As the largest energy-consuming country and the second largest oil-importingcountry in the word, China has faced with the net import of all fossil energysince 2009. With the increasing external dependence of energy year by year aswell as frequent occurrence of “oil shortage,” “coal shortage,” and “electricityshortage,” the energy security issue has been increasingly serious. What is thelevel of energy security in China? How to improve the national energy supplysecurity and reduce the energy trade risks? All of these hot issues have attractedthe common attention of decision-makers and researchers.
This book carries out systematic research starting with the history of worldenergy geopolitics and domestic energy security, focusing on hot issues such as thecomplexity of the international energy market, domestic energy import trade risks,domestic strategic energy reserve strategies, impact of energy crisis on the domesticeconomy, problems of domestic energy poverty, effects on the environment andhealth by energy consumption, potential analysis on key energy-saving industries,development potential of renewable energy, energy security early-warning and con-tingency plan, international comparison of energy security, etc. in order thatnational relevant decision-making departments provide decision-making referenceand information support. The main issues discussed in this book include the follows:
• World energy supply and demand and evolution of China’s energy security
The distribution of world energy consumption and supply is significantlyimbalanced. On the one hand, with the turbulent political situation in Middle
xxxii Preface

East and North Africa, the world energy production and trade patterns havebeen changing; on the other hand, under the impact of global financial crisisand European debt crisis, the world energy consumption pattern has alsobeen changing quietly, and energy consumption in emerging countries such asChina and India has expanded rapidly. All of these factors lead to a trend ofincreasingly diversified world energy trade. Meanwhile, the global climatechange is attracting more and more attention. As various countries have takenactions and measures to mitigate the global climate change in succession, theworld energy consumption structure is transforming into one focusing onclean and renewable energy. Based on the systematic analysis of the world’senergy supply and demand situation, this chapter comprehensively elaboratesthe history of and current challenges for domestic energy security.
• World energy geopolitics and China’s energy diplomacyThe development history of energy, especially the development history of
oil, is actually a history of local wars. In the history, wars caused by scram-bling for oil resources broke out one after another, leading to the intricateand complex world energy geopolitical relations. China has gradually trans-formed from an energy-importing country to an energy-exporting countrysince the founding of the People’s Republic of China (PRC), but has becomean energy net-importing country again in recent years. The energy diplomacypolicies of China have also constantly varied with its role in energy trade.Starting with the development history of the world energy geopolitics, thischapter discusses on the role and influence of energy diplomacy in nationalenergy security.
• Oil price and China’s energy securitySince the financial crisis broke out in 2008, the international oil price has
experienced steep rise and fall like a roller coaster due to the linkage betweenoil market and financial market, causing great impact on the energy securityof oil-importing countries. In addition, the soaring oil price since 2002 has sig-nificantly stimulated the biofuel development in America and Europe, causingcontradictory dispute between oil security and food security. This chapter car-ries out quantitative research on the complexity of oil market, impact of oilprice fluctuation on the energy supply and demand and the economy, financialoil development risks, future trend of international oil price, China’s energysecurity, etc.
• China’s energy trade and transportation risk researchIn particular, the significant imbalanced distribution of world energy
resources, the highly concentrated and monopolistic international energytrade, and the long-distance energy transportation bring unpredictable risksto energy trade. At present, China’s energy trade is mainly based on the oilimport trade, which is frequently accompanied with unreasonable phenomenasuch as “buying when price rises and not buying when price drops” and“price-volume increase.” Based on the systematic analysis of main transporta-tion corridors for China’s energy import, this chapter carries out quantitativeresearch on the composite risk of China’s oil import, risk comparison of crudeoil trade between China and America, characteristics and transportation risk
Preface xxxiii
analysis of China’s coal trade, and characteristics and transportation riskanalysis of China’s natural gas trade, so as to provide decision-making sup-port for the reduction of energy trade and transportation risks in China.
• Research on China’s energy reserve strategiesTo ensure national energy supply security, China is accelerating the con-
struction of the national strategic oil reserves and emergency coal reserves. Inthe face of intensive fluctuations of the international crude oil price, how canwe minimize the total security cost through timely establishment and dynamicsupplement of strategic reserves? In case of oil supply shortage in the future,how can we release the national strategic oil reserves to defuse the crisis?Which are the reserve strategies that should be taken to China’s energyreserves according to different storage characteristics of oil, coal, and naturalgas? For the problems above, this chapter sets up the optimization model andcarries out quantitative research on China’s energy reserve strategies.
• Research on key energy-saving regions and industries on the premise of ensur-ing energy security
Significant energy saving is important to slow down the growth rate ofenergy imports and ensure national energy security. The energy-saving andemission-reduction work in different regions shall be adjusted according tothe local conditions due to the extremely imbalanced regional economic devel-opment and energy consumption in China as well as the relatively large differ-ence of marginal energy-saving costs in different economic regions. Thischapter carries out quantitative research on the issues including the keyenergy-saving departments in the regions, the degree of inter-provincial differ-ence of energy intensity among the departments, the key energy-savingregions of the departments, and the differences of energy-saving in residents’lives between rural and urban regions and among different regions, with thehope to provide decision-making information support for energy-saving andemission-reduction work of the 12th Five-year Plan.
• Role of clean and renewable energy in the national energy securityWith the rapidly decreasing reserve-production ratio of the global fossil
energy as well as the increasingly serious negative effects of the use of fossilenergy on the environment, energy security, especially fossil energy supplysecurity, has become a great challenge for world economic development atpresent. Striving to develop clean and renewable energy and reducing thedependence on fossil fuels have become important ways for developed coun-tries to improve their national energy security. This chapter carries out sys-tematic analysis focusing on the utilization of clean and renewable energy,clean and renewable energy policies of major countries in the world, thepotential of clean and renewable energy resources in China, and its influenceon China’s energy supply security.
• Energy poverty and energy use securityEnergy poverty is one of the three major challenges for energy develop-
ment all over the world. The extensive existence of energy poverty restrictssustainable development in all countries in the world, especially the develop-ing countries, hinders the establishment of the social justice systems, increases
xxxiv Preface

the social environment pressure, threatens the health of residents, and further,influences the secure atmosphere of energy consumption. Energy poverty andenergy use security are in a close relation of mutual restriction and mutualeffect, so the energy poverty alleviation work will ultimately benefit theimprovement of energy use security. China is one of the countries with con-centrated population under energy poverty, but the composition of the popu-lation under energy poverty has certain specificity compared with othercountries. This chapter carries out a systematic analysis on the influencing fac-tors of energy poverty, the relation between energy poverty and public health,and the relation between energy poverty and energy use security, as well as quan-titative research on the current situation of regional energy poverty in China.
• Research on the impact of energy crisis on China’s macro-economyAn energy crisis is always the blasting fuse of an economic crisis. The three
energy crises since the 1970s have caused significant impacts on the world’seconomic growth, social inflation, employment, etc. As the world’s biggestenergy consumer and second largest oil importer, China relies more and moreon foreign energy. In case of any energy crisis in the future, we cannot imag-ine how great the impact on China’s economy will be. Based on a comprehen-sive analysis on the impact of historical energy crises on macro-economy, thischapter carries out quantitative research on the impact of oil supply shortage andoil price rise on China’s macro-economy by the China Energy & EnvironmentalPolicy Analysis (CEEPA) system.
• Energy consumption and public health in ChinaAs the deterioration of urban air quality seriously threatens the health of
urban residents, the urban air pollution in China has become an importantinfluencing factor of national energy use security. Urban pollution in most cit-ies of China is mostly as a result of coal burning, with pollutants mainlyoccurring from fossil energy consumption. Starting with the issue on howenergy consumption influences the environment and public health, this chap-ter carries out quantitative research on the evaluation on health effect in theenvironment with urban atmospheric pollution, the economic evaluation onurban atmospheric pollution and public health effect, the evaluation on healtheffect in the environment with pollutant emissions from major energy con-sumption departments, and the influence of pollutant emissions from majorenergy consumption departments on public health as well as the economicevaluation.
• Research on the comprehensive comparison of energy security in typicalcountries
Energy-importing countries are different in the energy consumption struc-ture, energy import resources, energy reserve modes, and relevant energy poli-cies depending on their different natural endowment, geographic locations,and geopolitics of energy resources. In order to ensure energy security,America and other developed countries have established the InternationalEnergy Agency, on the one hand, and successively prepared and introduced aseries of policies and measures for ensuring the energy security, on the otherhand. For both supply security and use security, this chapter establishes a set
Preface xxxv

of energy security evaluation index systems and carries out quantitativeresearch on the changing trend of energy security in China, America,Germany, Japan, and India in recent years, so as to provide decision-makingsupport for ensuring China’s energy security.
• Outlook of China’s energy security in 2020In the future, what will be the changing trend of China’s energy supply and
demand? How will energy trade and transportation risks change? How willenergy reserves develop? Can energy poverty be controlled or solved? For theproblems above, based on the quantitative researches in previous chapters,this chapter carries out forecasting analysis on China’s energy security in 2020and puts forward policy recommendations on China’s energy security policies.
To further be committed to scientific research, personnel training, and inter-national exchange of energy and environmental policies, in 2006, I cooperatedwith professors such as Yong-Fa Xu and Ke-Yu Liu of CNPC Economic andTechnology Research Institute to found the Center for Energy andEnvironmental Policy Research1 and served as the first Director of the center. In2009, invited by Academician Hai-Yan Hu, President of Beijing Institute ofTechnology (BIT), and Professor Da-Cheng Guo, Secretary of the PartyCommittee, I together with the core members of my team joined BIT and estab-lished the Center for Energy and Environmental Policy Research, BIT (CEEP-BIT), subordinate to the School of Management and Economics, BIT, with theapproval of the President’s Office Will.
For this book, Yi-Ming Wei and Gang Wu were responsible for the overalldesign, planning, organization, and compilation; Gang Wu, Hua Liao,Jian-Ling Jiao, Qiao-Mei Liang, Lan-Cui Liu, Lu-Tao Zhao, Shi-Wei Yu,Zhong-Yuan Ren, Bin Fang, Kang Li, Liang-Qiong Xiong, Wei-Dong Zhao,Zhi-Shuang Zhu, Ke Wang, Bing Wang, Tao Wang, Qian Wang, and Yun-FeiYao completed the contents of relevant chapters in this book. Zhao-Hua Wang,Ju-Liang Jin, Zhi-Yong Han, Jiu-Tian Zhang, Xiao-Wei Ma, Bao-Jun Tang,Yue-Jun Zhang, and Rui-Guang Yang participated in the discussion and proof-reading of partial chapters in this book. This book is the manifestation of thecollective wisdom of the Center for Energy and Environmental Policy Research.
During the research and preparation of this book, we gained support fromthe projects such as the major project of National Natural Science Foundationof China (70733005), International Cooperation Program (71020107026), andNational Natural Science Funds (70701032 and 71173207). We successivelygained encouragement, guidance, support, and selfless assistance from expertsand leaders, including Academician Shu-Peng Chen , Academician Su-Ping Peng,Academician Chong-Qing Guo, Jing-Yuan Yu, Jian-Kun He, Wei-Xuan Xu,Ji-Fa Gu, Jian-Guo Song, Yan-He Ma, Jing Huang, Hong Sun, Shan-Tong Li,
1Under the co-construction of the Institute of Policy and Management, ChineseAcademy of Sciences, and CNPC Economic and Technology Research Institute.
xxxvi Preface

Xiao-Tian Chen, Yi-Jun Li, Shou-Yang Wang, Zi-You Gao, Wei Zhang,Hai-Jun Huang, Ji-Zhong Zhou, Ji-Kun Huang, Lie-Xun Yang, Zuo-Yi Liu,Ruo-Yun Li, Zheng-Xiang Ge, Zhao-Liang Fang, Yan-De Dai, Yong-Fa Xu,Ke-Yu Liu, Ri-Sheng Guo, Si-Zhen Peng, Xiao-Feng Fu, Jing-Ming Li,Xu-Yan Tu, Lei Ji, Chen Cai, Zhi-Jie Li, Hong Chi, and Jian-Min Zhang, aswell as various forms of support and assistance from foreign colleagues whowere once invited to visit the Center for Energy and Environmental PolicyResearch for academic exchange, including Tol R. S. J., Hofman B., MartinotE., Drennen T., Jacoby H., Parsons J., MacGill I., Edenhofer O., Burnard K.,Nielsen C., Nguyen F., Okada N., Ang B., Yan J., Tatano H., Murty T., andErdmann G. Academician Zhong-Li Ding, Vice President of the ChineseAcademy of Sciences, gave encouragement and support for the publishing ofthis book. On this occasion, I would like to extend my sincere thanks and greatrespect to the above-mentioned leaders and experts.
I would like to take this opportunity to express my special thanks toSecretary of the Party Committee, Professor Chang-Lu Zhao, BIT President,Academician Jun Zhang, and other leaders as well as all colleagues of functionaldepartments and the School of Management and Economics of BIT, for theirsupport and assistance for my research work and that of our team. Without theirsupport and assistance, it would be difficult for us at the Center for Energy andEnvironmental Policy Research to complete the research work and publish ofthis book within such a short time.
Thank to all authors mentioned in the citation of this book!Inevitably, there might be some defects, deficiencies, and even mistakes in
this book due to our limited knowledge. Please don’t hesitate to criticize andcorrect us!
Preface xxxvii

This page intentionally left blank

Chapter 1
Review of World Energy Situation andChina’s Energy Security
The global climate protection, financial crisis, European debt crisis, “JasmineRevolution” in North Africa, and Iranian nuclear crisis in the Middle East havegiven rise to quiet but profound changes in the world’s energy trade and con-sumption patterns. With the emergence of energy trade in China, India, andother developing countries, as well as the decreasing energy consumption in theUnited States and some developed countries of Europe, the world’s energy con-sumption structure is shifting to clean and renewable energy resources. In thiscontext, how will the evolution of world energy supply�demand pattern impactChina’s energy security? What are the challenges against China’s energy secu-rity? How to interpret energy security in the new situation? This chapter willaddress these issues from such aspects as:
• What are the new trends in world energy development?• What are the changes in world energy trade?• How does the world energy consumption structure evolve?• What are the challenges against China’s energy consumption and energy
security?• How to interpret the energy security in the new situation?
1.1. Review of World Energy Development
1.1.1. Global Fossil Energy Reserves Are Abundant but UnevenlyDistributed
• Coal remains to be the world’s most widely distributed fossil fuel with thelargest reserves. The BP (2011a) statistics indicate global proved coal reservesof 860.938 billion tons by the end of 2010, about 4.6 times the crude oilreserves (188.788 billion tons). The world coal reserve-production ratio was118 years in 2010, and coal was still the energy source with the largestreserve-production ratio among all the fossil fuels. According to the EnergyResource Survey data of World Energy Council (WEC), the coal resources inEurope and Eurasia, North America, and the Asia-Pacific region accountedfor more than 95% of the world’s coal resources. The recoverable proved coalreserves in Europe and Eurasia were 304.6 billion tons, accounting for 35.4%of the total reserves. The proved recoverable coal reserves in Asia-Pacific

region were 265.843 billion tons, accounting for 28.5% of the total reserves.The proved recoverable coal reserves in North America were 245.09 billiontons, accounting for 28.5% of the total reserves. The total proved recoverablecoal reserves in Africa and the Middle East were 328.95 billion tons, account-ing for 3.8% of the total reserves. And the proved recoverable coal reserves inCentral and South America were 125.08 billion tons, accounting for only1.5% of the total reserves. The distribution of global proved recoverable coalreserves is shown in Figure 1.1.
From the country point of view, the coal reserves of the United States were237.3 billion tons, accounting for 27.6% of the total reserves and ranking firstaround the world, with a reserve-production ratio of 241 years. The coalreserves of Russia were 157.01 billion tons, accounting for 18.2% and rankingsecond in the world, with a reserve-production ratio of 495 years. China fol-lowed the United States and Russia to rank third in the world, with provedrecoverable coal reserves of 114.5 billion tons, accounting for 13.3% of thetotal reserves, and a reserve-production ratio of 35 years. The low reserve-production ratio of China was, on the one hand, due to its coal yield of 2.85billion tons in 2010, which was larger than other countries; on the other hand,the low recovery rate of China’s coal mining resulted in serious waste ofresources.
• From the perspective of reserve-production ratio, the global oil reverses areabundant. The BP (2011a) statistics indicate that the global proved oilreserves had been increased to 1,383.2 billion barrels at the end of 2010 from667.5 billion at the end of 1980, at an average annual growth rate of 2.5%.The global proved oil reserves from 1980 to 2010 are shown in Figure 1.2. Asof 2010, the reserve-production ratio was 46.2 years.
28.5%
1.5%
35.4%
3.8%
30.9%
North America
Central and South America
Europe and Eurasia
Middle East and Africa
Asia-Pacific region
Figure 1.1. Proved Recoverable Coal Reserves in Different Regions (2010).
2 Energy Economics: Understanding Energy Security in China

The world’s crude oil resources were regionally characteristic and unevenly dis-tributed. According to BP (2011a) data, the percentages of proved crude oilreserves in different regions in 1990, 2000, and 2010 are shown in Figure 1.3.
It is observed from Figure 1.3 that crude oil was widely distributed in theworld, which scattered in more than 50 countries of North America, Centraland South America, Europe and Eurasia, Middle East, Africa, and the Asia-Pacific region. The oil reserves of the top 10 countries accounted for 81.5% ofthe global total reserves in 2010, among which Saudi Arabia, as the countrywith the largest oil reserves, took up 19.1% of the total. Central and SouthAmerica surpassed Eurasia to become the world’s second largest oil-producingregion, with proved oil reserves of 239.4 billion barrels. This is mainly due to thesignificant increase of Venezuela’s proved oil reserves, of which the 76.8 billionbarrels of proved crude oil reserves accounted for 6.9% of the total reserves in2000. The reserves surged to 211.2 billion barrels in 2010, accounting for 15.3%of the total. In the same year (2010), the proved crude oil reserves of Europeand Eurasia ranked third in the world and accounted for 10.1% of the totalreserves. Africa followed Eurasia to account for 9.5% of the total reserves, whileNorth America and the Asia-Pacific region had lower proved oil reservesaccounting for 5.4% and 3.3%, respectively, only.
The world’s top 10 countries showed different paces in the growth of provedoil reserves. The proved reserves of Venezuela, as the fastest-growing country in
Glo
bal P
rove
d O
il R
eser
ves
(uni
t: 1
billi
on b
arre
ls)
Figure 1.2. Global Proved Oil Reserves (1980�2010).
Figure 1.3. Proved Crude Oil Reserves in Different Regions.
Review of World Energy Situation and China’s Energy Security 3

the world, increased by 174.8% in 2000�2010, followed by 59.2% ofKazakhstan and 37.7% of Iran (BP, 2011a), as shown in Figure 1.4.
• The proved natural gas reserves grew with stability. As shown in Figure 1.5,the global proved natural gas reserves grew at an average annual growth rateof 2.7% from the 80.97 trillion m3 in 1980 to 187.14 trillion m3 at the end of2010 (BP, 2011a), demonstrating a stable growth of proved natural gasreserves in the past 30 years. As of the end of 2010, the global natural gasreserve-production ratio was 58.6 years.
The world’s natural gas was unevenly distributed, mainly in the Middle East,Europe, and Eurasia. According to the BP (2011a) statistics, the natural gasreserves of Middle East accounted for 30.2% of the world’s total reserves,although it was not as absolutely dominant as oil reserves in the world; theproved natural gas reserves of Europe and Eurasia were 63.1 trillion m3,accounting for about 33.7% of the total; and thus, the natural gas reserves of the
Figure 1.4. World’s Top 10 Countries of Oil Reserves and Annual GrowthRate (2010).
Glo
bal P
rove
d N
atur
al G
as R
eser
ves
(uni
t: tr
illio
n m
3 )
Figure 1.5. Global Proved Natural Gas Reserves (1980�2010).
4 Energy Economics: Understanding Energy Security in China
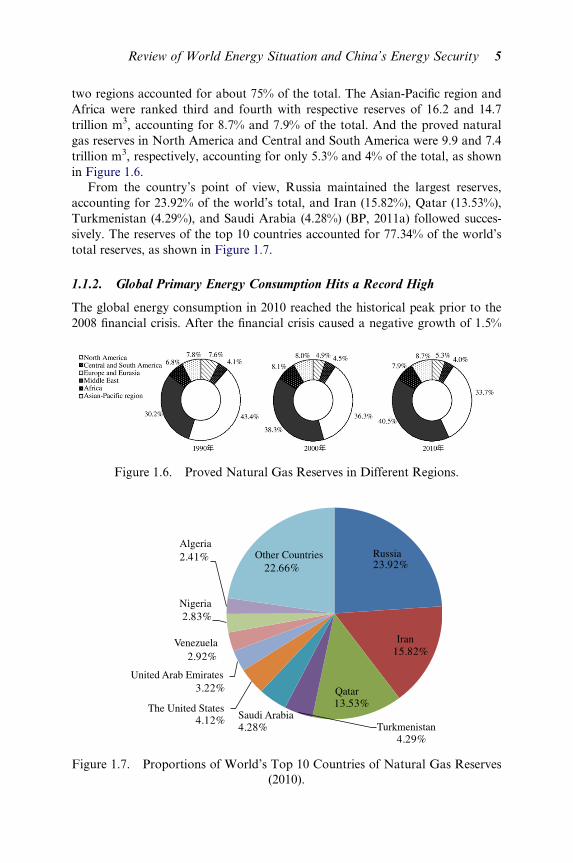
two regions accounted for about 75% of the total. The Asian-Pacific region andAfrica were ranked third and fourth with respective reserves of 16.2 and 14.7trillion m3, accounting for 8.7% and 7.9% of the total. And the proved naturalgas reserves in North America and Central and South America were 9.9 and 7.4trillion m3, respectively, accounting for only 5.3% and 4% of the total, as shownin Figure 1.6.
From the country’s point of view, Russia maintained the largest reserves,accounting for 23.92% of the world’s total, and Iran (15.82%), Qatar (13.53%),Turkmenistan (4.29%), and Saudi Arabia (4.28%) (BP, 2011a) followed succes-sively. The reserves of the top 10 countries accounted for 77.34% of the world’stotal reserves, as shown in Figure 1.7.
1.1.2. Global Primary Energy Consumption Hits a Record High
The global energy consumption in 2010 reached the historical peak prior to the2008 financial crisis. After the financial crisis caused a negative growth of 1.5%
Figure 1.6. Proved Natural Gas Reserves in Different Regions.
23.92%
15.82%
13.53%
4.29%4.28%
4.12%
3.22%
2.92%
2.83%
2.41%22.66%
AlgeriaOther Countries Russia
Nigeria
Venezuela
United Arab Emirates
The United States
Qatar
Iran
TurkmenistanSaudi Arabia
Figure 1.7. Proportions of World’s Top 10 Countries of Natural Gas Reserves(2010).
Review of World Energy Situation and China’s Energy Security 5

to the global primary energy consumption in 2009, the world economy usheredin a periodical recovery in 2010, with a global primary energy consumptiongrowth of 5.6% over 2009, as the fastest-growing year as of 1973 (see Figure 1.8)(BP, 2011a). The demands for all energy types were in robust growth, adding upto 12 billion tons of standard oil, which went beyond the peak reached before2008 economic recession, that is the 11.5 billion tons of standard oil in 2007.
In 2010, China’s energy consumption occupied the first place in the world,while that of the United States resumed growing. According to BP (2011a) sta-tistics, China’s primary energy consumption reached up to 2.432 billion tons ofoil equivalent in 2010, accounting for 20.3% of the global total consumptionand ranking first in the world. The proportions of other countries across theAsia-Pacific region (17.8%) and the Middle East (5.8%) in the global primaryenergy consumption also increased significantly. The primary energy consump-tion of the United States reached the oil equivalent of 2.286 billion tons in 2010,accounting for 19.0% of the global total and ranking second in the world. Forthe perspective of regional consumption proportion, North America, Europe,the former Soviet Union, Latin America, and Africa were 23.1%, 16.4%, 8.3%,5.1%, and 3.1%, respectively. With regard to the growth rate, the primary energyconsumption of China increased by 11.2% in 2010, compared with the 3.7%growth of the United States, as the first resumption of growth since 2008.
The global energy consumption growth was strongly consistent with the eco-nomic growth speed. As an important production and living resource, the globalenergy consumption is closely related to the economic growth, which increasesand declines with the economy. According to the global gross domestic product(GDP) growth data of World Bank and global energy consumption growth dataof BP (2011a), the global economic growth rate was higher than the energy con-sumption growth rate in most cases, as shown in Figure 1.9. Based on our calcu-lations, every 1% growth of global economy drove about 0.7% of energydemand growth.
0
20
40
60
80
100
120
140
2000 2001 2002 2003 2004 2005 2006 2007 2008 2009 2010
–2
–1
0
1
2
3
4
5
6
Energy Consumption Growth Rate
Year
Grow
th Rate (%
)E
nerg
y C
onsu
mpt
ion
(100
m
illio
n to
ns o
f st
anda
rd o
il)
Figure 1.8. Global Primary Energy Consumption and Growth Rate(2000�2010).
6 Energy Economics: Understanding Energy Security in China

Both the countries of Organization for Economic Co-operation and Develop-ment (OECD) and non-OECD member countries had an energy consumptiongrowth rate above the historical average. According to BP (2011a) statistics, theenergy demand of OECD member countries increased by 3.5%, as the largestincrease rate since 1984, while that of non-OECD member countries increasedby 7.5%, 63% higher than that in 2000. The global oil consumption increased by2.7 million barrels every day in 2010 following a decline in two consecutive years,and the record of 87.4 million barrels per day was set with an increase rate of 3.1%.Wherein, the oil consumption of OECD member countries ushered in the firstincrease since 2005, at an increase rate of 0.9%, that is, an increase of 480 thousandbarrels per day. The oil consumption of non-OECD member countries sets a newrecord to an increase of 2.2 million barrels per day at an increase rate of 5.5%. Theprimary energy consumption of non-OECD member countries accounted for morethan half of the total, which increased from the 42.1% in 2000 to 50.9% in 2008and surpassed OECD member countries for the first time, with a proportion of53.6% of the world’s total in 2010, as shown in Figure 1.10. This is mainly becauseof the following reasons: (1) with the completion of industrialization and urbaniza-tion in most OECD member countries as well as the transfer of energy-intensiveindustries from developed countries to developing countries, the industrial struc-ture has gradually shifted to low energy consumption; (2) some developing coun-tries, including China, India, Brazil, and Russia, showed up high economic growthrate and rapid energy consumption growth in recent years, while the OECD mem-ber countries presented low economic growth rate and slow energy consumptiongrowth; and (3) developed countries attach great importance to energy saving andenergy efficiency improvement.
1.1.3. Global Renewable Energy Production andConsumption Grow Steadily
In the context of dealing with climate change worldwide, reducing or mitigatingfossil energy consumption while energetically developing renewable energy have
–2
–1
0
1
2
3
4
5
6
1980 1985 1990 1995 2000 2005 2010
GDP Energy Consumption Growth Rate
Year
Gro
wth
Rat
e (%
)
Figure 1.9. Global GDP Growth Rate and Energy Consumption Growth Rate(1980�2010).
Review of World Energy Situation and China’s Energy Security 7

been the concerns of all countries, which has resulted in a substantial increase ofglobal renewable energy power generation and biofuel in recent years.According to the statistics of Renewable Energy Policy Network for the 21stCentury (REN21), the global installed wind energy capacity, installed solar PVcapacity, and bioethanol and biodiesel throughput increased steadily, as shownin Figure 1.11.
The world’s major renewable energies ushered in substantial increase in thetotal investment, installed capacity, and throughput within 2008�2010 (REN21,2011), as shown in Table 1.1.
According to the statistics of BP (2011a) annual report, the global biofuelthroughput increased by 13.8% to about 240,000 barrels per day in 2010, becom-ing the one with largest throughput growth among the world’s liquid fuels. In2010, the United States and Brazil turned out to be the major biofuel-producingcountries in the world, accounting for 69.1% of the total, as shown in Figure 1.12.Nevertheless, other countries showed up rapid growth in 2010, for example, Indiaincreased by 84.5%, Argentina by 60.0%, and Australia by 41.8%.
42.1%
57.9%
2000 2008 2010
50.9%49.1% 46.4%
53.6%
OECD Non-OECD
Figure 1.10. Changes in Proportions of Energy Consumption in OECD andNon-OECD Member Countries.
0
50
100
150
200
250
1996 1998 2000 2002 2004 2006 2008 20100102030405060708090100
Inst
alle
d C
apac
ity (
GW
)
BiodieselBioethanolSolar PVWind Power
Throughput (m
illion liters)
Figure 1.11. Global Renewable Energy Installed Capacity or Throughput(1996�2010).
8 Energy Economics: Understanding Energy Security in China