Embed Size (px)
Citation preview
Green Econometrics
Energy Analysis
Green Econometrics –Wanasa Holdings Company LLC
2
Green Econometrics
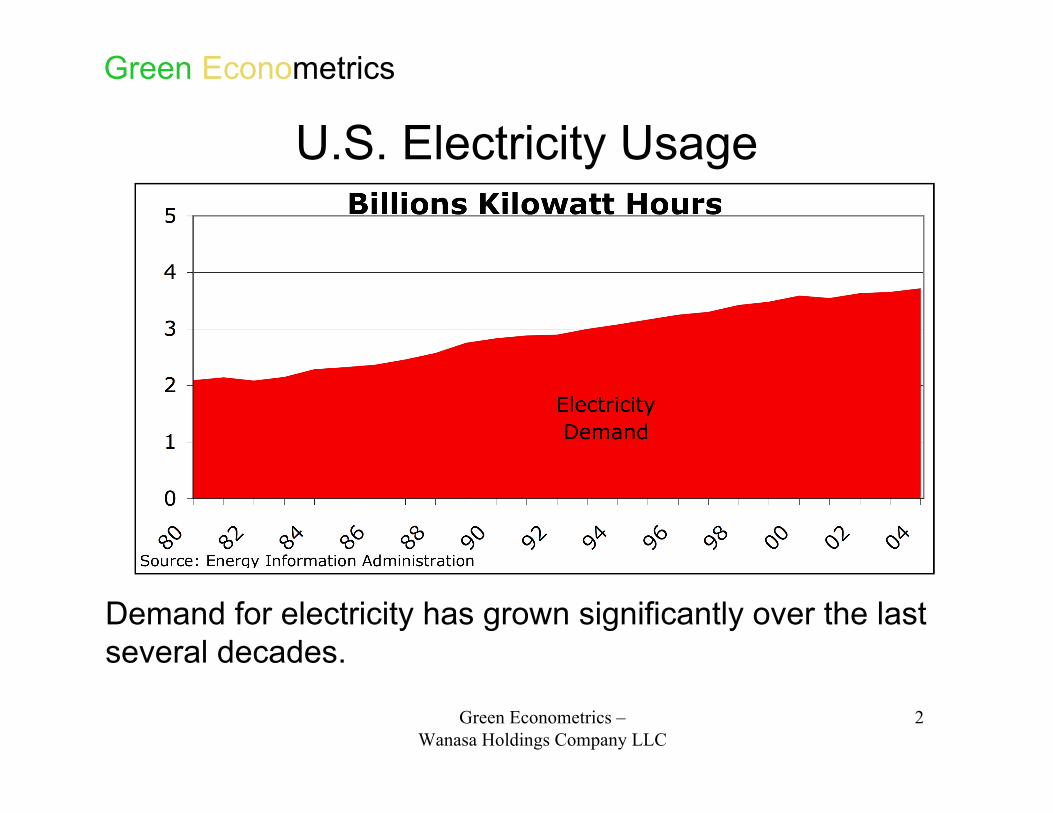
U.S. Electricity Usage
Demand for electricity has grown significantly over the lastseveral decades.
Green Econometrics –Wanasa Holdings Company LLC
3
Green Econometrics
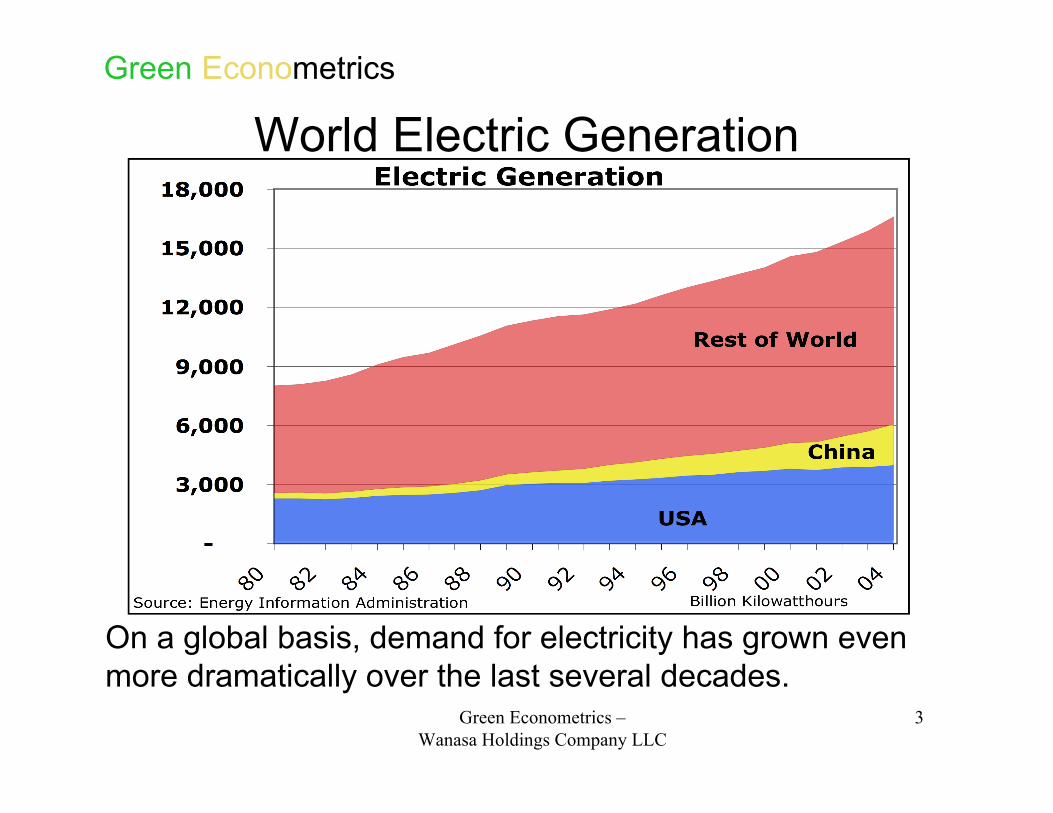
World Electric Generation
On a global basis, demand for electricity has grown evenmore dramatically over the last several decades.
Green Econometrics –Wanasa Holdings Company LLC
4
Green Econometrics
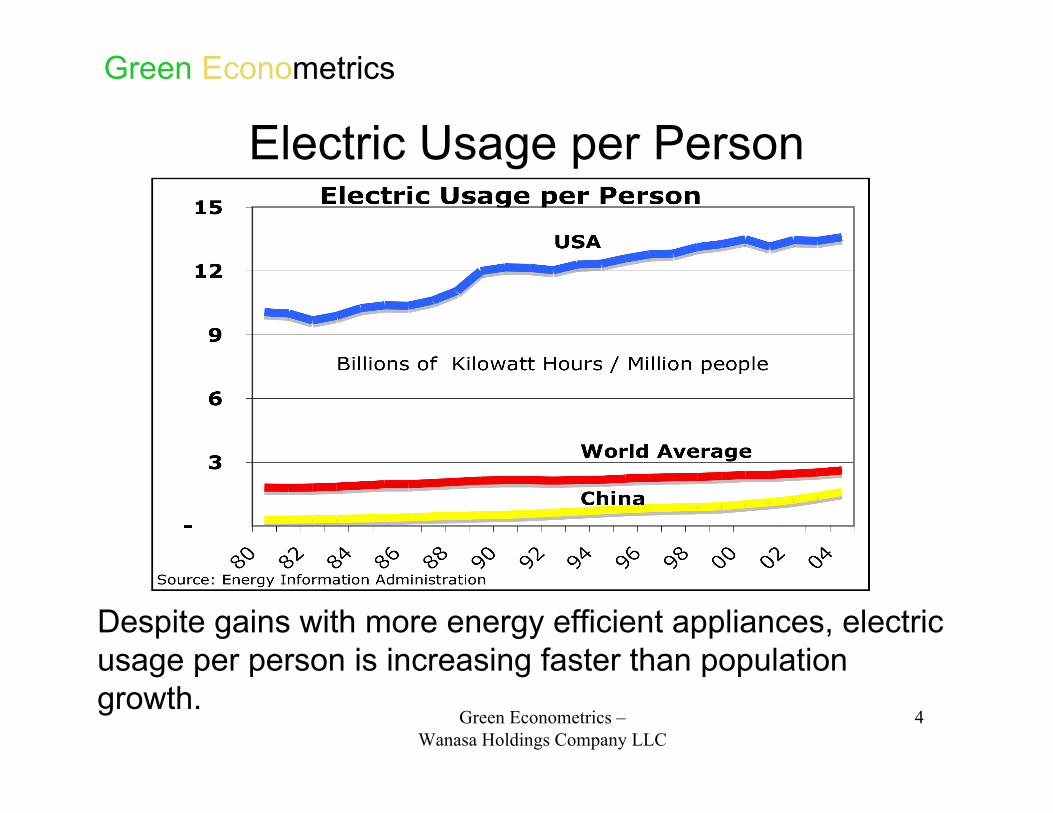
Electric Usage per Person
Despite gains with more energy efficient appliances, electricusage per person is increasing faster than populationgrowth.
Green Econometrics –Wanasa Holdings Company LLC
5
Green Econometrics
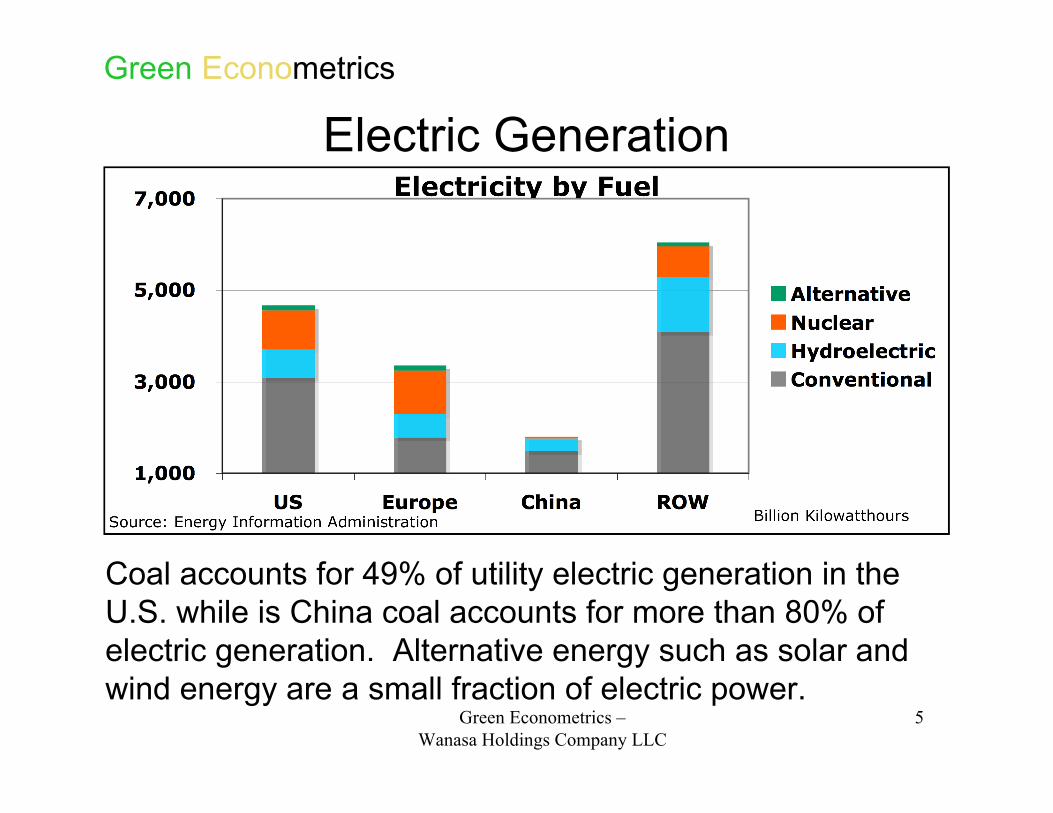
Electric Generation
Coal accounts for 49% of utility electric generation in theU.S. while is China coal accounts for more than 80% ofelectric generation. Alternative energy such as solar andwind energy are a small fraction of electric power.
Green Econometrics –Wanasa Holdings Company LLC
6
Green Econometrics
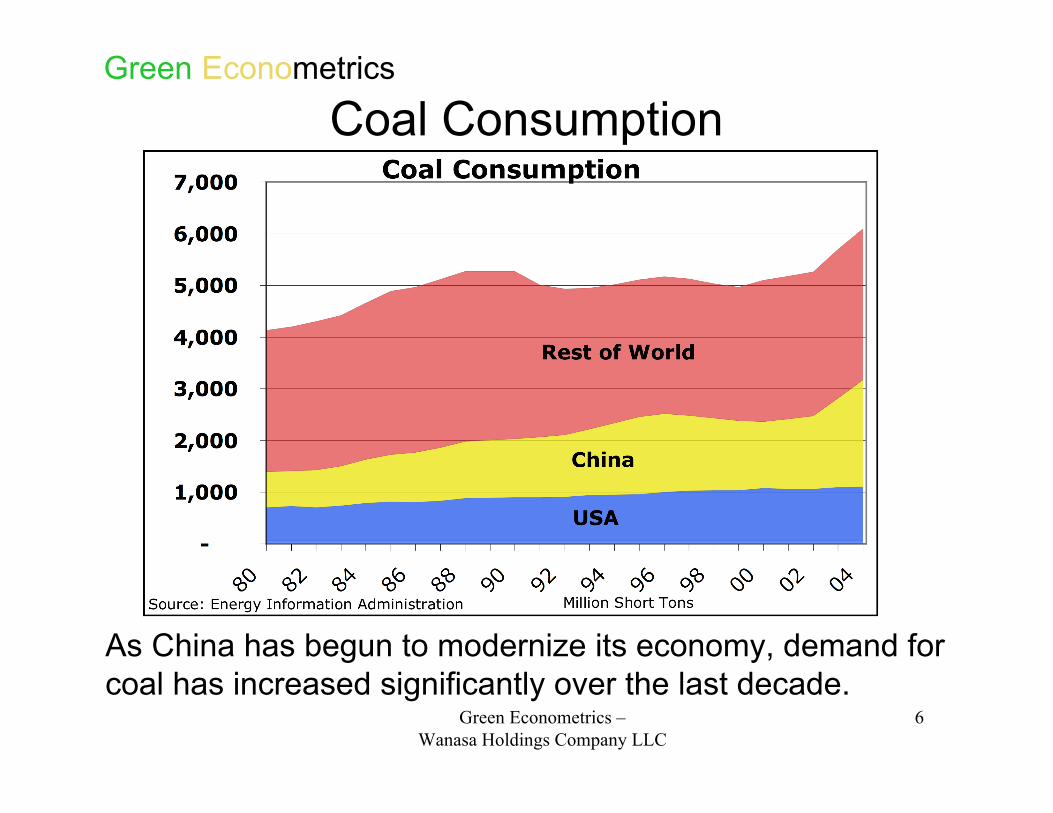
Coal Consumption
As China has begun to modernize its economy, demand forcoal has increased significantly over the last decade.
Green Econometrics –Wanasa Holdings Company LLC
7
Green Econometrics
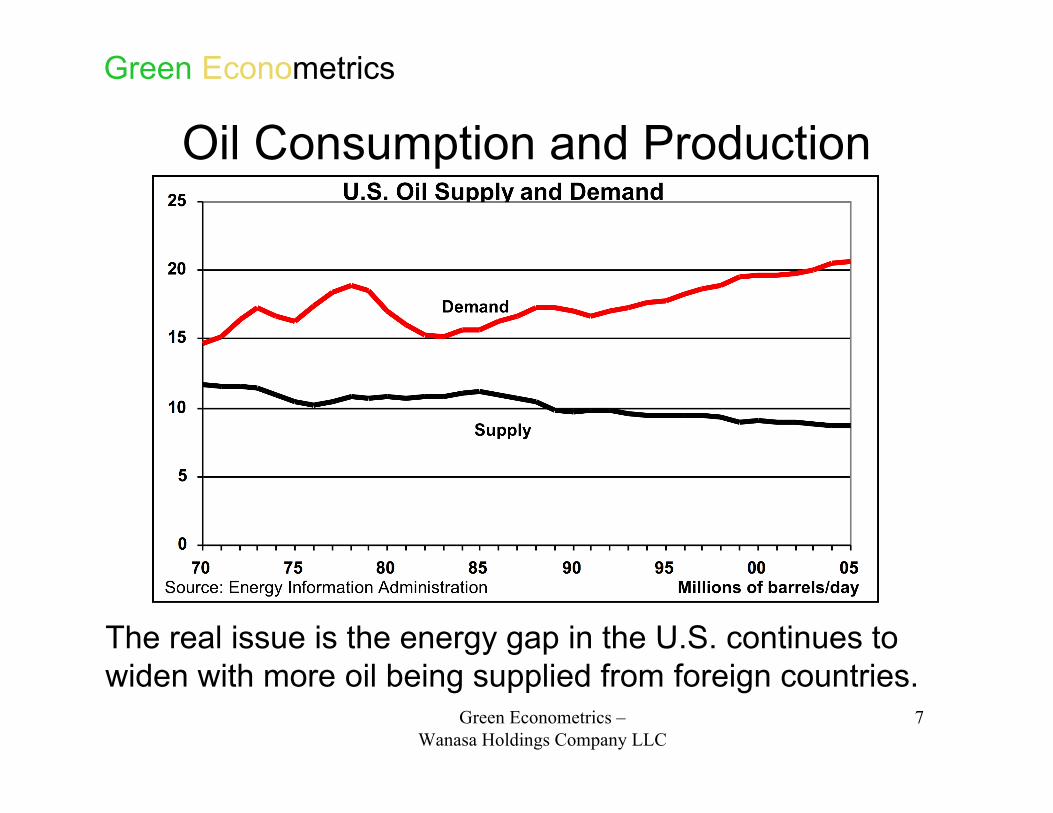
Oil Consumption and Production
The real issue is the energy gap in the U.S. continues towiden with more oil being supplied from foreign countries.
Green Econometrics –Wanasa Holdings Company LLC
8
Green Econometrics
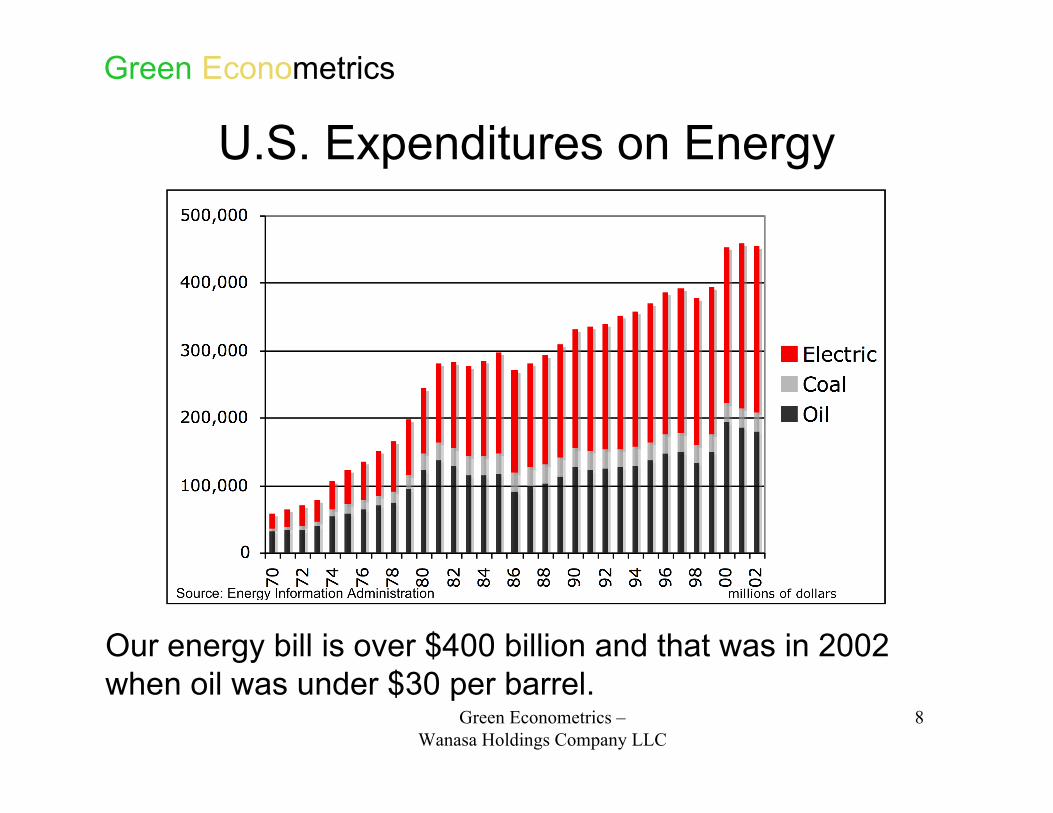
U.S. Expenditures on Energy
Our energy bill is over $400 billion and that was in 2002when oil was under $30 per barrel.
Green Econometrics –Wanasa Holdings Company LLC
9
Green Econometrics
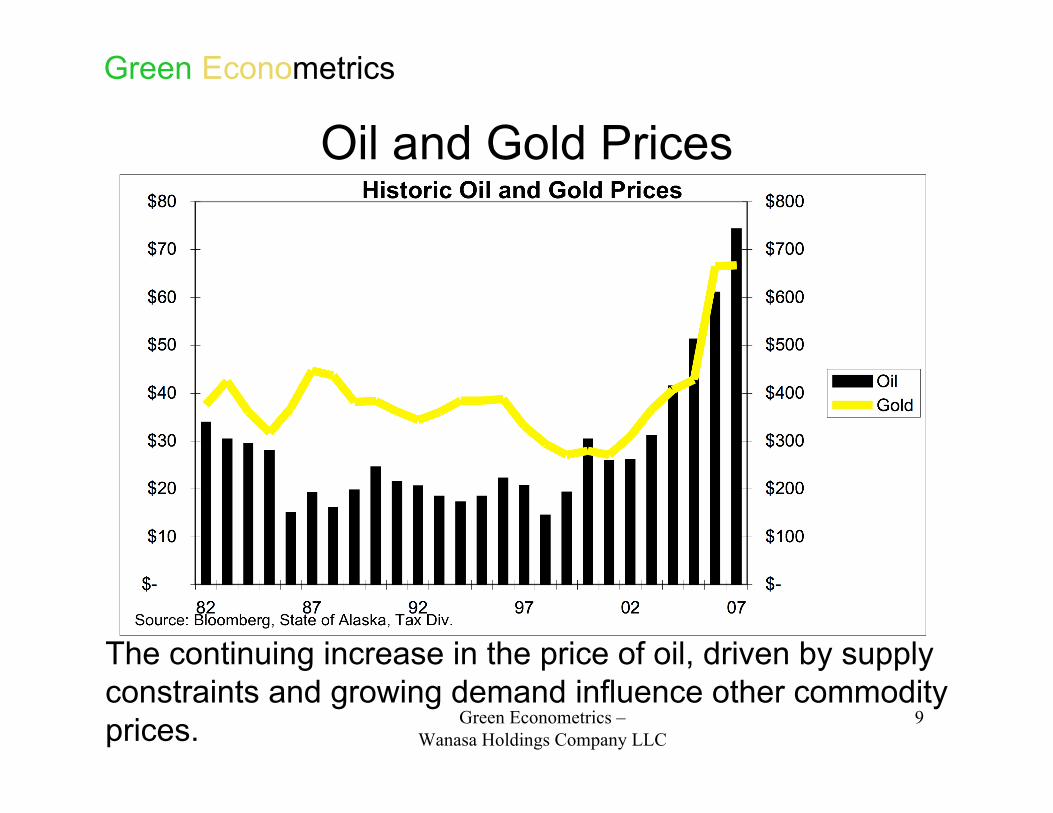
Oil and Gold Prices
The continuing increase in the price of oil, driven by supplyconstraints and growing demand influence other commodityprices.
Green Econometrics –Wanasa Holdings Company LLC
10
Green Econometrics
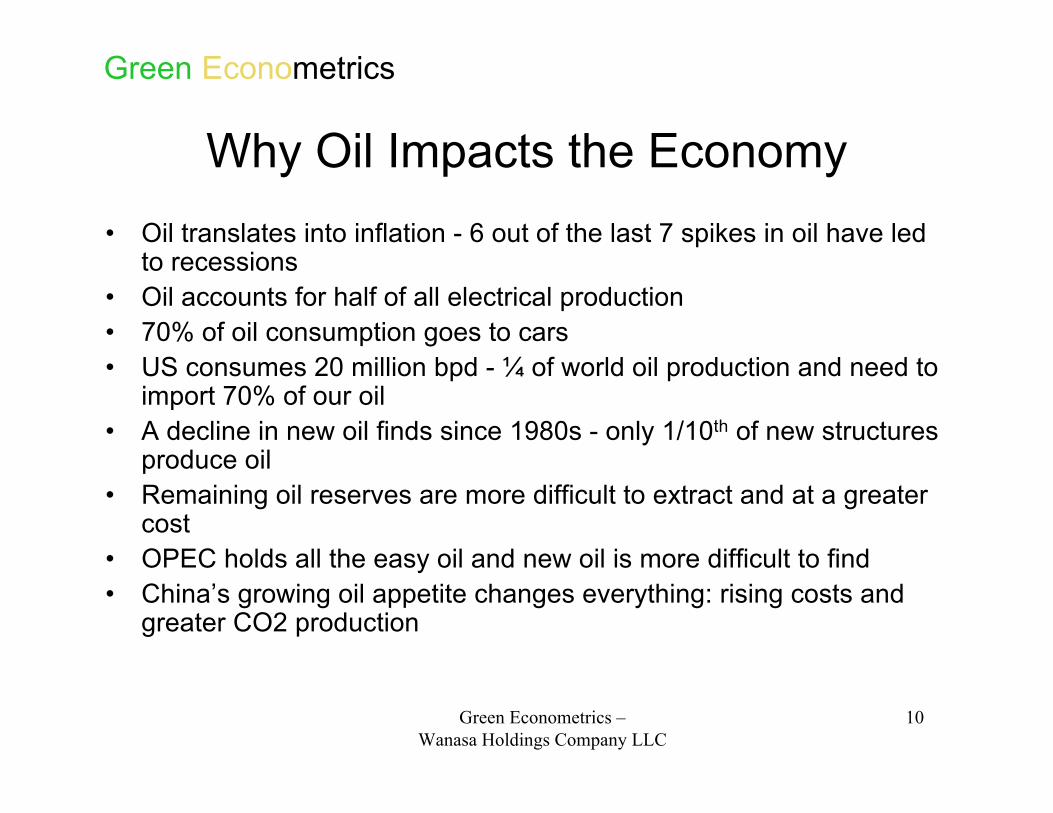
Why Oil Impacts the Economy• Oil translates into inflation - 6 out of the last 7 spikes in oil have led
to recessions• Oil accounts for half of all electrical production• 70% of oil consumption goes to cars• US consumes 20 million bpd - ¼ of world oil production and need to
import 70% of our oil• A decline in new oil finds since 1980s - only 1/10th of new structures
produce oil• Remaining oil reserves are more difficult to extract and at a greater
cost• OPEC holds all the easy oil and new oil is more difficult to find• China’s growing oil appetite changes everything: rising costs and
greater CO2 production
Green Econometrics –Wanasa Holdings Company LLC
11
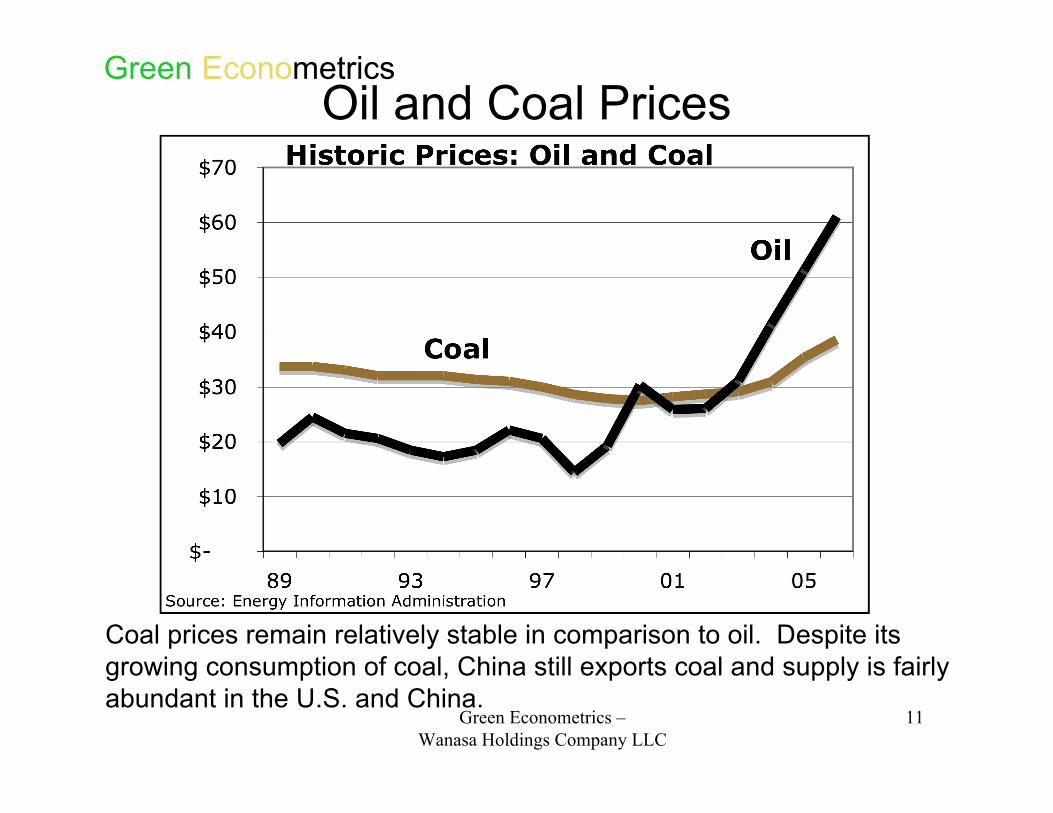
Green EconometricsOil and Coal Prices
Coal prices remain relatively stable in comparison to oil. Despite itsgrowing consumption of coal, China still exports coal and supply is fairlyabundant in the U.S. and China.
Green Econometrics –Wanasa Holdings Company LLC
12
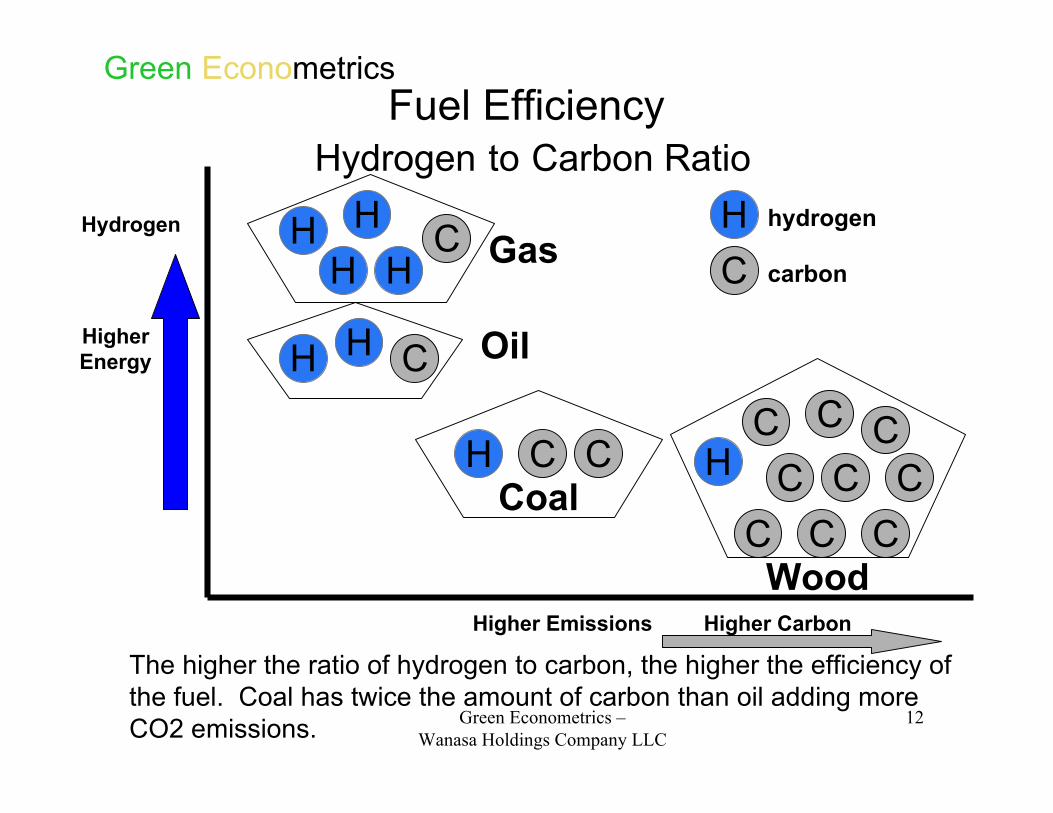
Green EconometricsFuel Efficiency
Hydrogen to Carbon RatioHydrogen
Higher CarbonHigher Emissions
HigherEnergy
CC
CC
H
C
CC
C
HHH
H
H H
C
C
C
C
Gas
H H C
hydrogen
Coal
Oil
Wood
carbonC
The higher the ratio of hydrogen to carbon, the higher the efficiency ofthe fuel. Coal has twice the amount of carbon than oil adding moreCO2 emissions.
Green Econometrics –Wanasa Holdings Company LLC
13
Green Econometrics
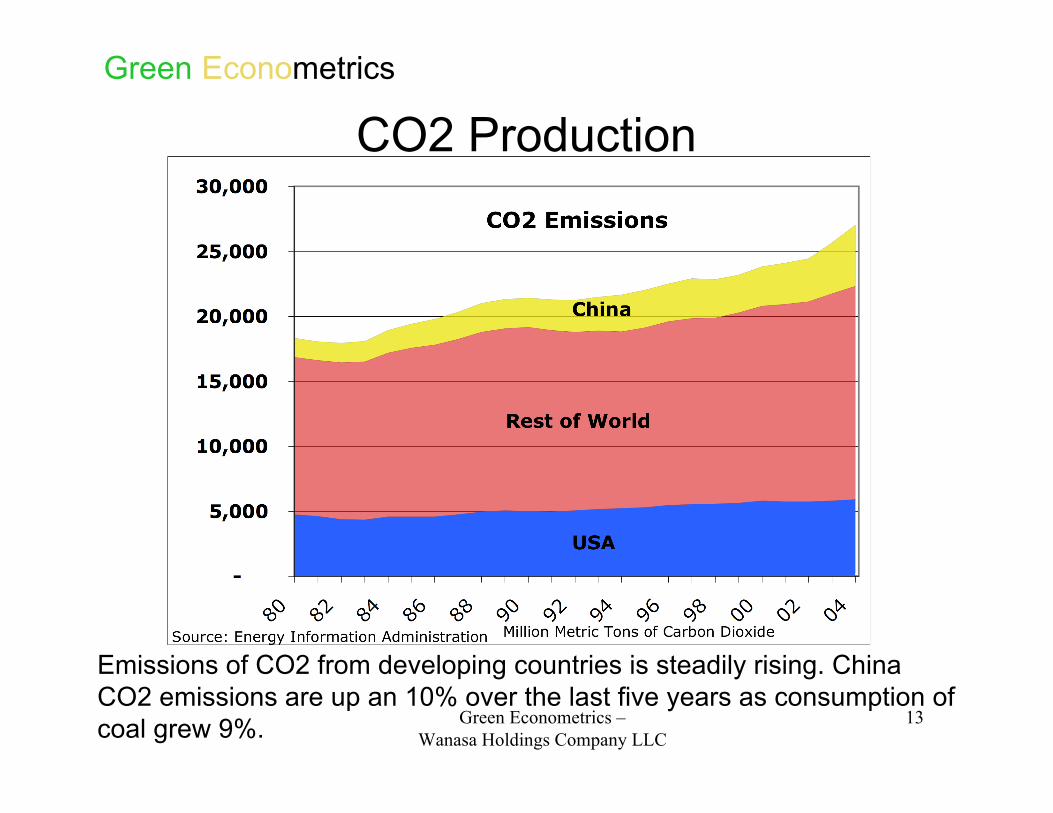
CO2 Production
Emissions of CO2 from developing countries is steadily rising. ChinaCO2 emissions are up an 10% over the last five years as consumption ofcoal grew 9%.
Green Econometrics –Wanasa Holdings Company LLC
14
Green Econometrics
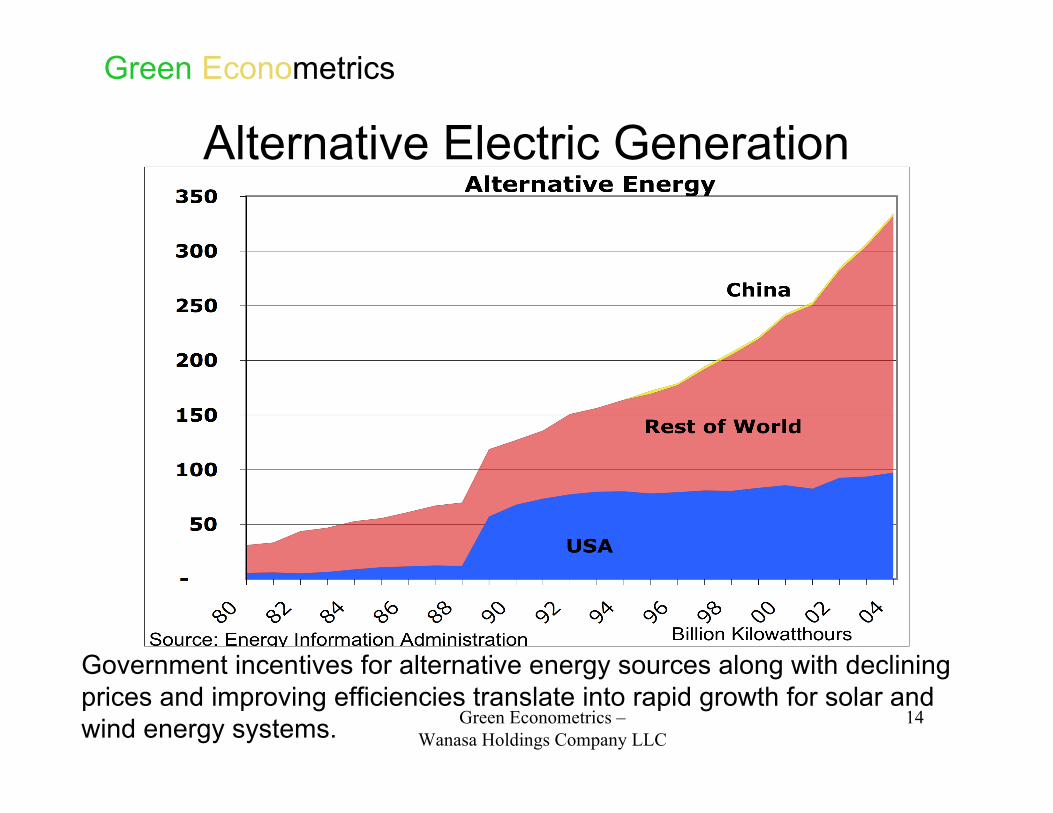
Alternative Electric Generation
Government incentives for alternative energy sources along with decliningprices and improving efficiencies translate into rapid growth for solar andwind energy systems.
Green Econometrics –Wanasa Holdings Company LLC
15
Green Econometrics
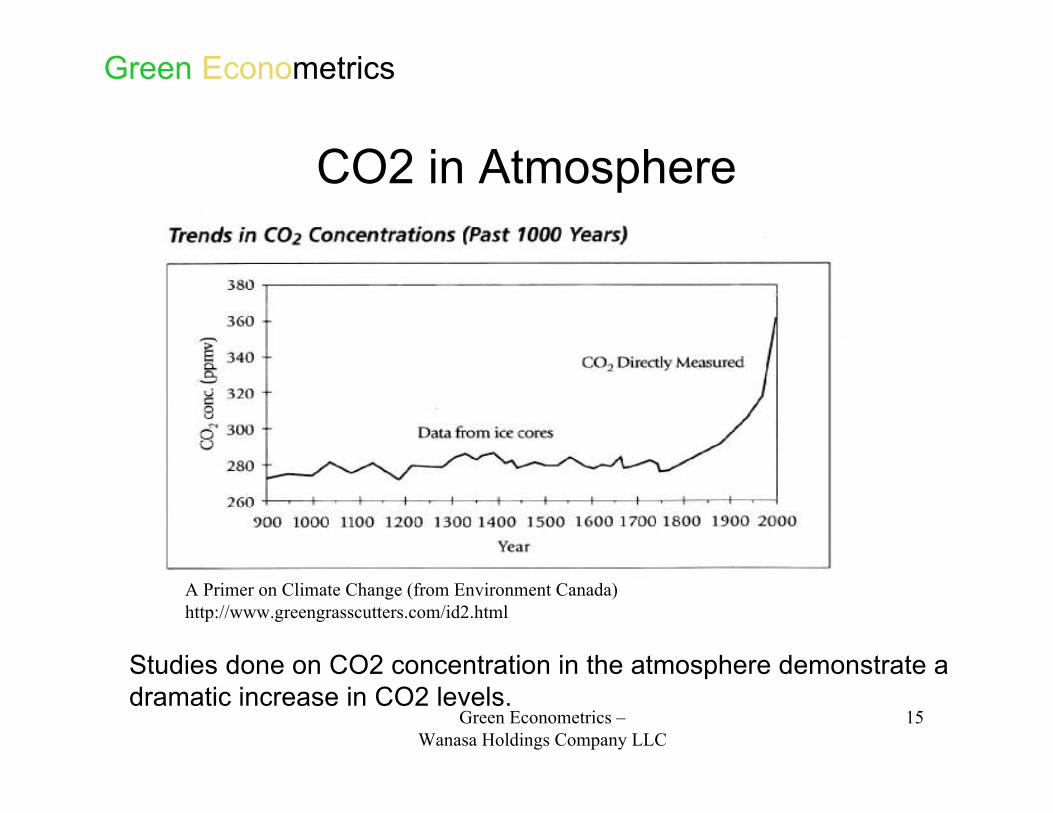
CO2 in Atmosphere
A Primer on Climate Change (from Environment Canada) http://www.greengrasscutters.com/id2.html
Studies done on CO2 concentration in the atmosphere demonstrate adramatic increase in CO2 levels.
Green Econometrics –Wanasa Holdings Company LLC
16
Green Econometrics
Historic Atmospheric CO2
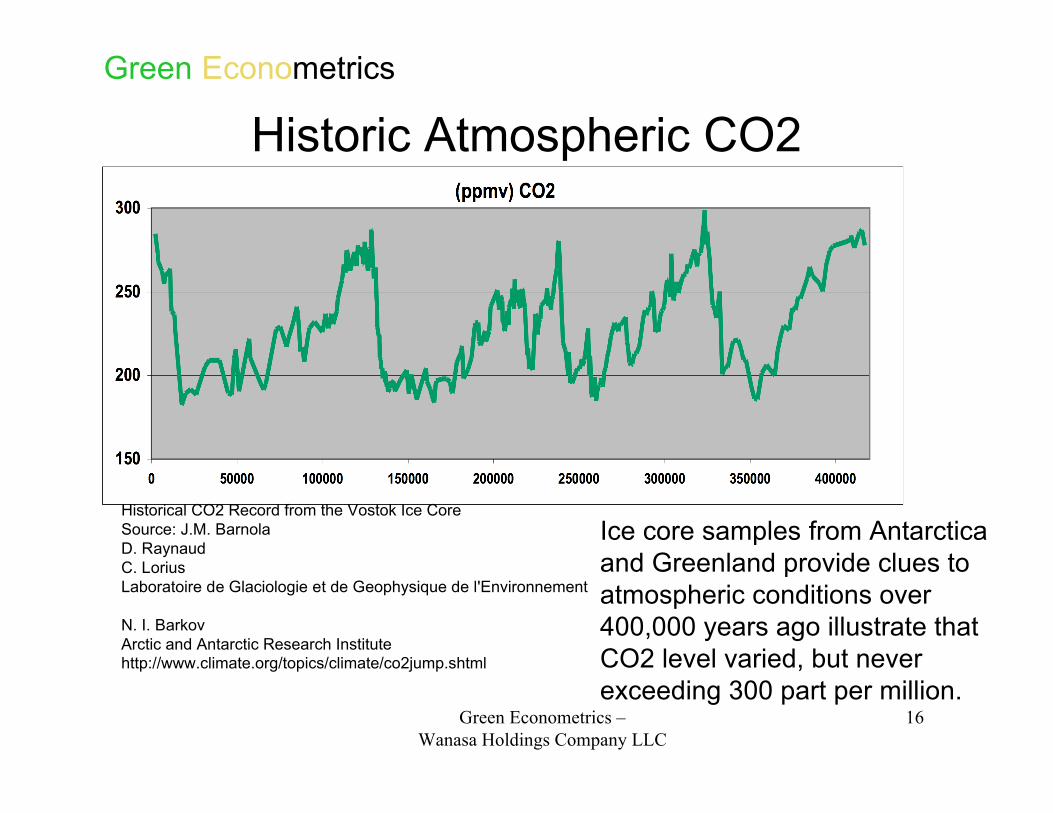
Historical CO2 Record from the Vostok Ice CoreSource: J.M. BarnolaD. RaynaudC. LoriusLaboratoire de Glaciologie et de Geophysique de l'Environnement
N. I. BarkovArctic and Antarctic Research Institutehttp://www.climate.org/topics/climate/co2jump.shtml
Ice core samples from Antarcticaand Greenland provide clues toatmospheric conditions over400,000 years ago illustrate thatCO2 level varied, but neverexceeding 300 part per million.
Green Econometrics –Wanasa Holdings Company LLC
17
Green Econometrics
Historic CO2 and Temperature
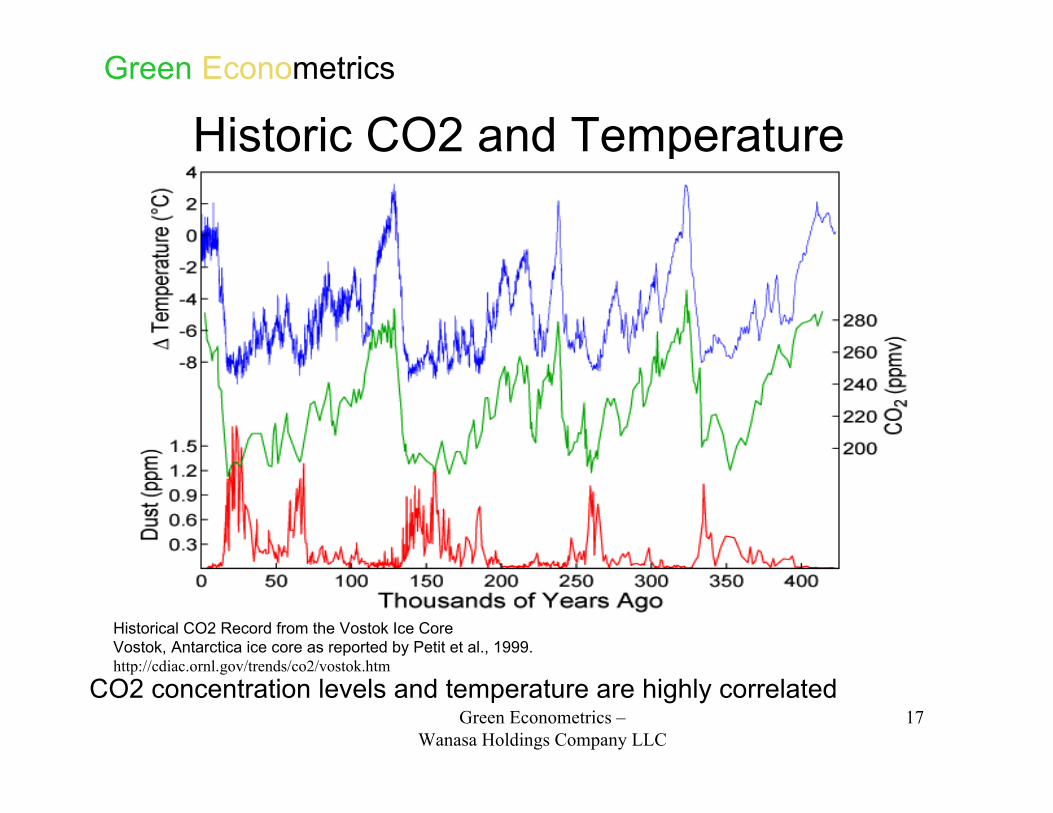
Historical CO2 Record from the Vostok Ice CoreVostok, Antarctica ice core as reported by Petit et al., 1999.http://cdiac.ornl.gov/trends/co2/vostok.htm
CO2 concentration levels and temperature are highly correlated
Green Econometrics –Wanasa Holdings Company LLC
18
Green Econometrics
Major Insurance Losses
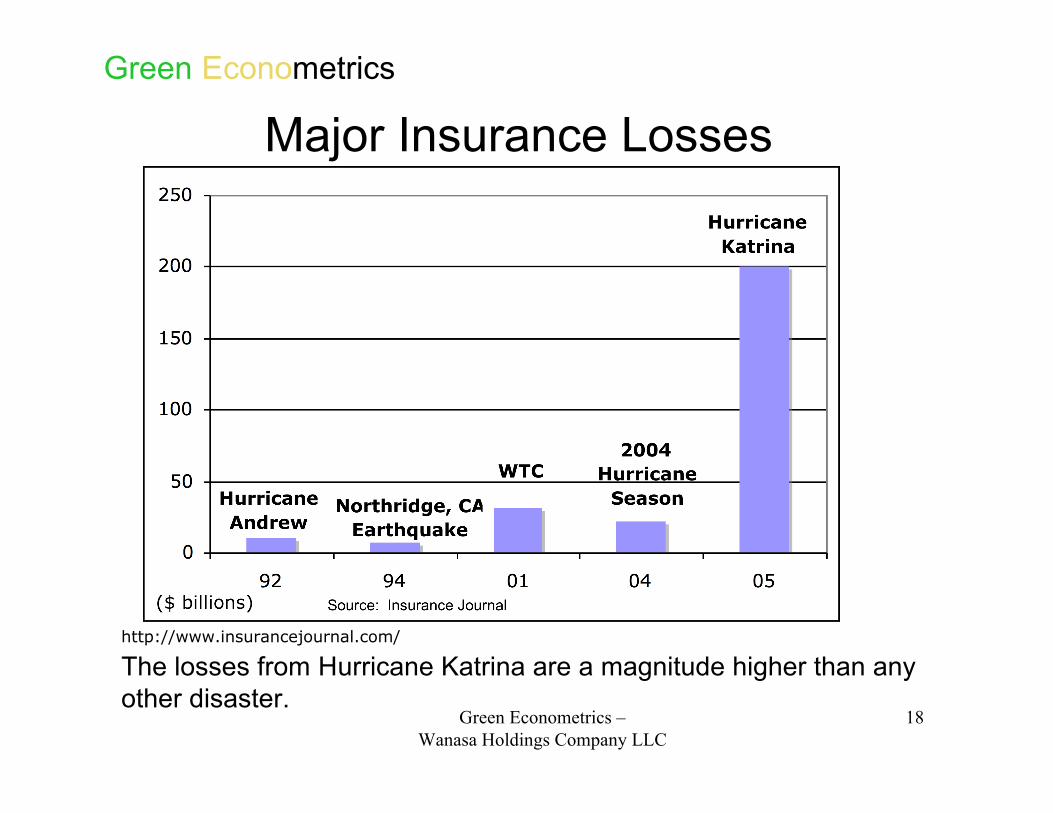
http://www.insurancejournal.com/
The losses from Hurricane Katrina are a magnitude higher than anyother disaster.
Green Econometrics –Wanasa Holdings Company LLC
19
Green Econometrics
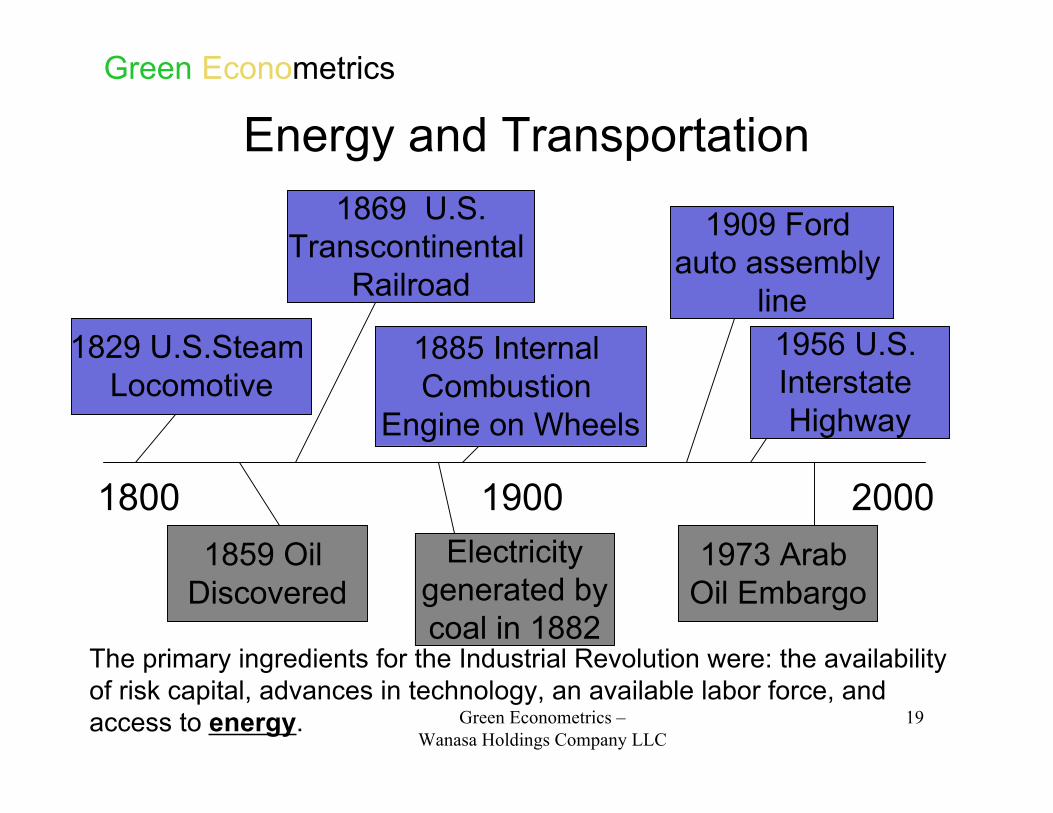
Energy and Transportation
1800 1900 2000
1829 U.S.Steam Locomotive
1859 Oil Discovered
1869 U.S.Transcontinental
Railroad
Electricitygenerated bycoal in 1882
1885 Internal Combustion
Engine on Wheels
1909 Ford auto assembly
line
1973 Arab Oil Embargo
1956 U.S. Interstate Highway
The primary ingredients for the Industrial Revolution were: the availabilityof risk capital, advances in technology, an available labor force, andaccess to energy.

Green Econometrics –Wanasa Holdings Company LLC
20
Green EconometricsEnergy and Economics
0
5
10
15
20
25
30
35
40
45
50
1872
1882
1892
1902
1912
1922
1932
1942
1952
1962
1972
1982
1992
2002
1
10
100
1000
10000
S&P 500
P/E ratio
Electricity,Telephone
RadioAutomobileAviation
Transistor Laser CopierJet AircraftTV
Motion Pictures
InternetDigitalHDTV
PCCellularDVD
Radio Broadcast
MicroprocessorSatellitesCable TVSpace Flights
WWIWWII’29
CrashOil
Embargo
Fall of Berlin Wall
9/11
Railroads,Telegraph
Prohibition
Source: Standard & Poors