Embed Size (px)
Citation preview

Óbuda University Power System Department
Energy consumptions of public sector,
Energy audits and the
Intelligent network Dr. Péter Kádár
Óbuda University, Power System Department, Hungary

Óbuda University Power System Department
Draft
• Curve analysis
• Audits
• Energy management
• Intelligent networks and customers
Energy consumption, audits and the intelligent network - Patra, 2012 2

Óbuda University Power System Department
Focus on the public consumption
• Residential area
• Flats
• Housing estates
• Hospital
• Library
• Local government office
• School
• Caretaking home for old people
• Kindergarten
• Industrial buildings
• Office towers
• Agricultural buildings
Energy consumption, audits and the intelligent network - Patra, 2012 3

Óbuda University Power System Department
The energy
• Electricity
• Gas
• Remote heating
• Water
• Canalisation
• Telecom
Everything that „come from the utility”
(and the bill comes)
Energy consumption, audits and the intelligent network - Patra, 2012 4

Óbuda University Power System Department
The sources of the data for further analysis
• Yearly invoices
• Monthly invoices
• Daily meter reading
• Automatic meter data for every 15 min
• Rough estimation based on nominal power
consumption and watch
• Measurement, etc.
Energy consumption, audits and the intelligent network - Patra, 2012 5

Óbuda University Power System Department
Energy consumption, audits and the intelligent network - Patra, 2012 6
Daily load curve of a primary school

Óbuda University Power System Department
Energy consumption, audits and the intelligent network - Patra, 2012 7
Daily load curve of a water well

Óbuda University Power System Department
Energy consumption, audits and the intelligent network - Patra, 2012 8
Aggregated load curve of 7 water pump in a week

Óbuda University Power System Department
Energy consumption, audits and the intelligent network - Patra, 2012 9
High school, building I. a March week

Óbuda University Power System Department
Energy consumption, audits and the intelligent network - Patra, 2012 10
High school building II., a March week

Óbuda University Power System Department
Energy consumption, audits and the intelligent network - Patra, 2012 11
Grammar school, a February week

Óbuda University Power System Department
Energy consumption, audits and the intelligent network - Patra, 2012 12
Grammar school, January weeks

Óbuda University Power System Department
Energy consumption, audits and the intelligent network - Patra, 2012 13
National feast

Óbuda University Power System Department
Energy consumption, audits and the intelligent network - Patra, 2012 14
0
1000
2000
3000
4000
5000
6000
7000
8000
9000
1 2 3 4 5 6 7 8 9 10 11
kW
h
Old people's home I.
Old people's home II.
Homeless hotel
Caretaking center for homeless people I.
Caretaking center for homeless people II.
Temporary family hotel
Monthly electricity consumption of social
institution (11 months)

Óbuda University Power System Department
Seasonal gas consumption in
social institution (12 months)
Energy consumption, audits and the intelligent network - Patra, 2012 15
0
2000
4000
6000
8000
10000
12000
14000
16000
18000
20000
1 2 3 4 5 6 7 8 9 10 11 12
m3
Homeless hotel
Temporary family hotel
Old people's home I.

Óbuda University Power System Department
Energy consumption, audits and the intelligent network - Patra, 2012 16
Monthly electricity consumption data of
a water utility
0
1.000
2.000
3.000
4.000
5.000
6.000
7.000
8.000
1 2 3 4 5 6 7 8 9 10 11 12
MW
h

Óbuda University Power System Department
Energy consumption, audits and the intelligent network - Patra, 2012 17
Daily gas consumption in a year
Naptípusok 2003
0
20000
40000
60000
80000
100000
120000
140000
160000
180000
2000001 5 9
13
17
21
25
29
33
37
41
45
49
Hetek
Fo
gy
as
ztá
s
H
K
Sz
Cs
P
Szo
V

Óbuda University Power System Department
Energy consumption audits

Óbuda University Power System Department
Energy consumption, audits and the intelligent network - Patra, 2012 19
The basic rules of the energy management
• How can you spare energy?
• How can you use with greater efficiency?
• How can you buy cheaper energy?

Óbuda University Power System Department
Energy consumption, audits and the intelligent network - Patra, 2012 20
Questions to answer
• Ratio of the energy consumption
• Assessment of the present energy purchase
• Assessment of the energy management person/system
• Is there any anomalies? – benchmarking
• Capability of the loadforecasting
• General status of the technical devices
• Thermal isolation (heating and cooling)
• Recommendation for the control of the heating/cooling. Shadowing – passive houses
• Alternative, direct energy usage (lighting, heating)

Óbuda University Power System Department
Energy consumption, audits and the intelligent network - Patra, 2012 21
Methodes of energy audit
• Walk and look
• Talk and hear
• Assessment of the building heating/cooling system
• Analysis of elecricity and gas consumption
• Investigation of the alternative sources
• Thermovision
• Project plan, etc.

Óbuda University Power System Department
Energy consumption, audits and the intelligent network - Patra, 2012 22
The way of the electricity
10/0.4 kV transformer
Meters
Current transformers

Óbuda University Power System Department
Energy consumption, audits and the intelligent network - Patra, 2012 23
Devices from different ages
10/0.4 kV transformer 0.4 kVmain supply Meter box

Óbuda University Power System Department
Energy consumption, audits and the intelligent network - Patra, 2012 24

Óbuda University Power System Department
Energy consumption, audits and the intelligent network - Patra, 2012 25
Electrical devices
10/0.4 kV transformer 0.4 kV distribution box
Aggregator

Óbuda University Power System Department
Energy consumption, audits and the intelligent network - Patra, 2012 26
Metering in Hungary

Óbuda University Power System Department
Metering in Greece
Energy consumption, audits and the intelligent network - Patra, 2012 27

Óbuda University Power System Department
Metering in Greece
Energy consumption, audits and the intelligent network - Patra, 2012 28

Óbuda University Power System Department
Energy consumption, audits and the intelligent network - Patra, 2012 29
Reactive power compensation and distr. boxes

Óbuda University Power System Department
Energy consumption, audits and the intelligent network - Patra, 2012 30
UPS and accumulators

Óbuda University Power System Department
Energy consumption, audits and the intelligent network - Patra, 2012 31
Problems of public energy management
• Costs occurre later (bill arrives months later
than the real consumption)
• Fixed prices, the consumption can not be
changed
• The public customer is a „ financially secure
customer”
• The technical and financial management is
distributed

Óbuda University Power System Department
Energy consumption, audits and the intelligent network - Patra, 2012 32
Present deals
Co-generation – tri-generation
Natural gas -> electricity + heat + cooling

Óbuda University Power System Department
Energy consumption, audits and the intelligent network - Patra, 2012 33
Gas engines
• 400 pcs in Hungary
• 600 MW biult in capacity
• State support
• Co-generation

Óbuda University Power System Department
Energy consumption, audits and the intelligent network - Patra, 2012 34
Electrical energy management: active
power and the tariffs
Wattos energia összes
0
50000
100000
150000
200000
250000
300000
350000
400000
20
04
. o
kt.
20
04
. sze
pt.
20
04
. a
ug
.
20
04
. jú
l.
20
04
. jú
n.
20
04
. m
áj.
20
04
. á
pr.
20
04
. m
árc
.
20
04
. fe
br.
20
04
. ja
n.
20
03
. d
ec.
20
03
. n
ov.
20
03
. o
kt.
20
03
. sze
pt.
20
03
. a
ug
.
20
03
. jú
l.
20
03
. jú
n.
20
03
. m
áj.
20
03
. á
pr.
20
03
. m
árc
.
20
03
. fe
br.
20
03
. ja
n.
kWh Csúcson kívül
Csúcs

Óbuda University Power System Department
Energy consumption, audits and the intelligent network - Patra, 2012 35
Electrical energy management: peak power
Maximal load
<900kW
Peak must be set/controlled by the tariffs

Óbuda University Power System Department
Energy consumption, audits and the intelligent network - Patra, 2012 36
Electrical energy management: prefixed peaks
June, July, August, September – lower consumption – higher costs
oversizing !

Óbuda University Power System Department
Energy consumption, audits and the intelligent network - Patra, 2012 37
Over- and undersizing of the prefixed peak
Teljesítmény díj és büntetés
1 000 000
1 100 000
1 200 000
1 300 000
1 400 000
1 500 000
1 600 000
750
770
790
810
830
850
870
890
910
Lekötött teljesítmény (kW)
Ár
(Ft) Büntetés
Teljesítmény díj
810 kW real plan
penalty or overcosts?
900 kW
fixed
765 kW
fixed

Óbuda University Power System Department
Energy consumption, audits and the intelligent network - Patra, 2012 38
Peak management
• The tariff structure must be known
• Strategy: less fixed + some penalties
• Lower consumption, lower peaks!
• Peak controlling, limiting
Óbuda University Power System Department
Energy consumption, audits and the intelligent network - Patra, 2012 39
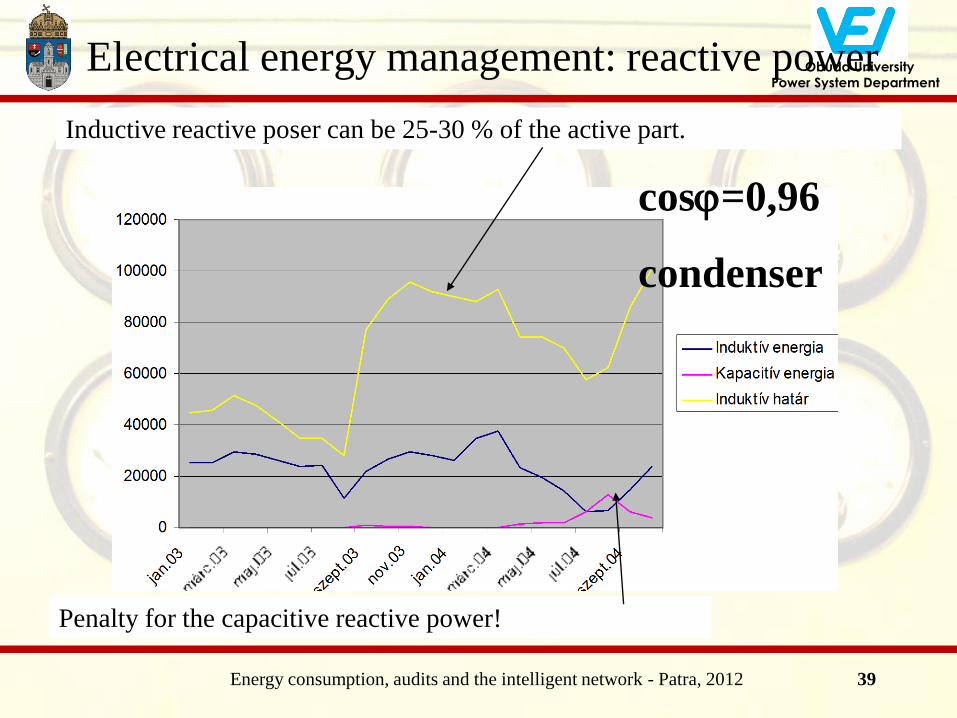
Electrical energy management: reactive power
Penalty for the capacitive reactive power!
Inductive reactive poser can be 25-30 % of the active part.
cos=0,96
condenser

Óbuda University Power System Department
Energy consumption, audits and the intelligent network - Patra, 2012 40
Walking – looking – listening

Óbuda University Power System Department
Energy consumption, audits and the intelligent network - Patra, 2012 41
Ratio analysis
Beépített teljesítmény arányok
52%
8%
4%
8%
18%
10%
Hőtechnika
Világítás
Pékség
Irodák
Mall
Egyéb
Built in power

Óbuda University Power System Department
Energy consumption, audits and the intelligent network - Patra, 2012 42
Measurement analysis
Havi negyedórás átlagértékek
1000
1200
1400
1600
1800
2000
2200
0:15
1:45
3:15
4:45
6:15
7:45
9:15
10:45
12:15
13:45
15:15
16:45
18:15
19:45
21:15
22:45
Idő
Január
Február
Március
Április
Május
Június
Július
Augusztus
Szeptember
Október
November
December
Average daily loads

Óbuda University Power System Department
Energy consumption, audits and the intelligent network - Patra, 2012 43
Measuring

Óbuda University Power System Department
Energy consumption, audits and the intelligent network - Patra, 2012 44
The relation of the electrical and heating energy
• Heating – cooling system
• Cooling with absorber machines
• Seasonality
• Building technology
• Drives (air, lifts)
• Cogeneration
• Air conditioners
• Electric heating

Óbuda University Power System Department
Energy consumption, audits and the intelligent network - Patra, 2012 45
Ratio of heating and cooling in a mall

Óbuda University Power System Department
Energy consumption, audits and the intelligent network - Patra, 2012 46
Gas consumption
Havi gázfogyasztás
0
20 000
40 000
60 000
80 000
100 000
120 000
140 000
160 000
180 000
I. II. III. IV. V. VI. VII VIII IX. X. XI. XII.
Hónap
m3

Óbuda University Power System Department
Energy consumption, audits and the intelligent network - Patra, 2012 47
Thermovision

Óbuda University Power System Department
Energy consumption, audits and the intelligent network - Patra, 2012 48
General recommendations for better
energy management
Lowering costs:
• Cheaper energy purchase
• Decrease of consumption
• Decrease of losses
How?
• Energetics audit
• Investment
• Change the present practice!

Óbuda University Power System Department
Energy consumption, audits and the intelligent network - Patra, 2012 49
Energy management in the organisation
• Personal competences
– Clearing the responsibilities
– Clearing the motivation
– Support for the work
– Responsibility
• Technical conditions
– Energy measurements
– Central control system
– Actors in the system (switches, controllers)
• Financing (short term ROI)

Óbuda University Power System Department
Energy consumption, audits and the intelligent network - Patra, 2012 50
Recommendations:
• Building an energy management system
• Building of energy manager team
• Environment and sustainability consciousness

Óbuda University Power System Department
Energy consumption, audits and the intelligent network - Patra, 2012 51
Specific recommendations - electricity
• Appropriate feeding point
• Better load forecast
• Better purchasing agreements
• Peak control (e.g. with meters Actaris SL7000)
• On-line SCADA control
• Reactive compensation
• Renovation of old devices, nets
• Phase balancing

Óbuda University Power System Department
Energy consumption, audits and the intelligent network - Patra, 2012 52
Specific recommendations - heat
• Measurements
• Independent measurement of the heating energy
and the hot water(‘s energy)
• Better isolation
• Temperature control
• Optimisation, etc.

Óbuda University Power System Department
What about the renewables?
• Small scale application, only on economy basis
• Wind – not really
• PV? – only if you combine with architectural
solutions, e.g. shadowing
• Geothermal – if the tempreature is high enogugh,
combined with heat pump
• Solar collector? – yes! Even try to use it for air
conditioning
Energy consumption, audits and the intelligent network - Patra, 2012 53

Óbuda University Power System Department
Shadowing by PV cells at University of
Cantabria, Santander, Spain
Energy consumption, audits and the intelligent network - Patra, 2012 54

Óbuda University Power System Department
Energy consumption, audits and the intelligent network - Patra, 2012 55
The process of energy management
Planned
schedule
Settling Continuous
control
Technology
Measurements Influences / actions / control

Óbuda University Power System Department
Energy consumption, audits and the intelligent network - Patra, 2012 56
Energy magement system
• „SCADA”
• Data acqiosition, visualisation, reporting, statistics
• Support for cost planning
• Forecast
• Portfolio management
• Risk management
• Control

Óbuda University Power System Department
Energy consumption, audits and the intelligent network - Patra, 2012 57
Continuous control of the usages

Óbuda University Power System Department
Energy consumption, audits and the intelligent network - Patra, 2012 58
Energy management functions
• limit investigation
• optimisation
•cost allocation
•settling

Óbuda University Power System Department
Energy consumption, audits and the intelligent network - Patra, 2012 59
Building control system

Óbuda University Power System Department
Energy consumption, audits and the intelligent network - Patra, 2012 60
Intelligent network?
Intelligent customer?
Future trends

Óbuda University Power System Department
Energy consumption, audits and the intelligent network - Patra, 2012 61
Intelligence in the power system – customer level
hair drier, TV set, radio,
telecommunication devices,
modems, lighting, iron, microwave
oven, coffee machine, computers,
cooking plate
spontaneous loads (based on
individual needs)
washing machine, tumble drier,
refrigerator, cooler, air
conditioners, electric bread baking
machine and the heat pump
Can be delayed, controlled
Electric heating devices
Existing ripple control (HKV /
RKV)

Óbuda University Power System Department
Energy consumption, audits and the intelligent network - Patra, 2012 62
Seeking for low level DSM sources
Is there DSM potential in the households?
The methodes:
• Monitoring of the household consumption
• Creating an aggregated schedule
• Identification of ripple control part
• Proposal for the better ripple control schedule
• Identification of the controllable part
• Proposal for new schedule

Óbuda University Power System Department
Energy consumption, audits and the intelligent network - Patra, 2012 63
„Stopwatch measurement” - Flat 1.
•Forrás: hallgatói projekt mérés Kun Viktor vezetésével

Óbuda University Power System Department
Energy consumption, audits and the intelligent network - Patra, 2012 64
„Stopwatch measurement” - Flat 2.
•Forrás: hallgatói projekt mérés Kun Viktor vezetésével

Óbuda University Power System Department
Energy consumption, audits and the intelligent network - Patra, 2012 65
„Stopwatch measurement” - Flat 3.
•Forrás: hallgatói projekt mérés Kun Viktor vezetésével

Óbuda University Power System Department
Energy consumption, audits and the intelligent network - Patra, 2012 66
„Stopwatch measurement” - Flat 4.
•Forrás: hallgatói projekt mérés Kun Viktor vezetésével

Óbuda University Power System Department
Energy consumption, audits and the intelligent network - Patra, 2012 67
Analysis of customers’ behaviour
Some remarks:
• Four flats was checked
• The actual load is replaced by the nominal load
• 5 min time blocks
• Weekday was measured
• Smoothing function was applied
• The load of the 4 flats was extended on 40 flats
• At the reschedule of the ripple control we calculated the same amount of the consumption

Óbuda University Power System Department
Energy consumption, audits and the intelligent network - Patra, 2012 68
Further development
• Measuring at more flats
• Detailed ratio analysis
• Raising the density of the meaasurements
• Identifying day-types
• Individual measurements

Óbuda University Power System Department
Energy consumption, audits and the intelligent network - Patra, 2012 69
40 households, present ripple control
40 db, különböző típusú háztartás
összfogyasztása (kék), illetve ebből a
HKVezérelt fogyasztás (bordó)
0
5000
10000
15000
20000
25000
30000
35000
40000
0:0
0
1:3
5
3:1
0
4:4
5
6:2
0
7:5
5
9:3
0
11
:05
12
:40
14
:15
15
:50
17
:25
19
:00
20
:35
22
:10
23
:45
óra:perc
P (
W)

Óbuda University Power System Department
Energy consumption, audits and the intelligent network - Patra, 2012 70
40 households, rescheduled ripple control
Az összfogysztás alakulása a HKV (bordó) -2 és
+3 órával történő eltolásakor
0
5000
10000
15000
20000
25000
30000
35000
0:0
0
1:3
0
3:0
0
4:3
0
6:0
0
7:3
0
9:0
0
10:3
0
12:0
0
13:3
0
15:0
0
16:3
0
18:0
0
19:3
0
21:0
0
22:3
0
óra:perc
P(W
)

Óbuda University Power System Department
Energy consumption, audits and the intelligent network - Patra, 2012 71
40 households, reschedule potential
Az összfogyasztás befolyásolható (bordó) és
nem befolyásolható része (kék) 40 lakásnál
05000
10000150002000025000300003500040000
0:0
0
1:5
5
3:5
0
5:4
5
7:4
0
9:3
5
11
:30
13
:25
15
:20
17
:15
19
:10
21
:05
23
:00
óra:perc
P(W
)

Óbuda University Power System Department
Energy consumption, audits and the intelligent network - Patra, 2012 72
40 households, after the reschedule of 50 %
Az összfogyasztás alakulása a kapcsolható rész
50%-nak (bordó) 6 órával való késleltesekor
0
5000
10000
15000
20000
25000
30000
0:0
0
1:3
0
3:0
0
4:3
0
6:0
0
7:3
0
9:0
0
10:3
0
12:0
0
13:3
0
15:0
0
16:3
0
18:0
0
19:3
0
21:0
0
22:3
0
óra:perc
P(W
)

Óbuda University Power System Department
Energy consumption, audits and the intelligent network - Patra, 2012 73
Foundings
• The greater parts of the consumers’ appliances can be
involved into the DSM
• This is only qualitative measurements
• The adaptive reschedule can be performed by differenf
optimisation methodes
This is the low level intelligence in the network

Óbuda University Power System Department
The need for the DSM
• Decreasing the peak / increasing the valley load
Energy consumption, audits and the intelligent network - Patra, 2012 74

Óbuda University Power System Department
Further data sources
• Measurements from the utility meters
• Special high density metering
• Metering based of social behaviours, statistics, etc.
Energy consumption, audits and the intelligent network - Patra, 2012 75

Óbuda University Power System Department
Traditional load curve analysis
Energy consumption, audits and the intelligent network - Patra, 2012 76

Óbuda University Power System Department
Energy consumption, audits and the intelligent network - Patra, 2012 77

Óbuda University Power System Department
Energy consumption, audits and the intelligent network - Patra, 2012 78

Óbuda University Power System Department
Remote measurement with special recorder
Energy consumption, audits and the intelligent network - Patra, 2012 79

Óbuda University Power System Department
Energy consumption, audits and the intelligent network - Patra, 2012 80
Peak hours
Deep valley hours

Óbuda University Power System Department
Energy consumption, audits and the intelligent network - Patra, 2012 81
Electric water
heating

Óbuda University Power System Department
Energy consumption, audits and the intelligent network - Patra, 2012 82

Óbuda University Power System Department
Energy consumption, audits and the intelligent network - Patra, 2012 83

Óbuda University Power System Department
Reschedule
Energy consumption, audits and the intelligent network - Patra, 2012 84
The controllable (brown) and non controllable
part (blue) of residential area load
05000
10000150002000025000300003500040000
0:0
0
1:5
5
3:5
0
5:4
5
7:4
0
9:3
5
11
:30
13
:25
15
:20
17
:15
19
:10
21
:05
23
:00
hh:mm
P(W
)
The total load after 6 hours delay of the 50% of
controllable load
0
5000
10000
15000
20000
25000
30000
0:0
0
1:3
0
3:0
0
4:3
0
6:0
0
7:3
0
9:0
0
10:3
0
12:0
0
13:3
0
15:0
0
16:3
0
18:0
0
19:3
0
21:0
0
22:3
0
hh:mm
P(W
)

Óbuda University Power System Department
Energy consumption, audits and the intelligent network - Patra, 2012 85
Functions of the intelligent VGRID elements
Schedule center
•Monitoring of
generation capabilities
•Monitoring of load
demand
•Global load forecast
•Generation optimisation
•Scheduling
•Load control
•Logging, evaluation
•Connection with the
system operator
Intelligent
generatorn
•Monitoring of
possible generation
capacity
•Cost calculation
•Generation control
•Connection with
the schedule centre
Intelligent loadi
•Load forecast
•Local load control
•Connection with
the schedule centre
•Cost dependency
Intelligent storagex
•Storage/generation
capability
•Local store control
•Connection with the
schedule centre
•Cost calculation

Óbuda University Power System Department
Energy consumption, audits and the intelligent network - Patra, 2012 86
Radial IP connections of the VGRID elements
Schedule center
Intelligent loadg
Intelligent generatoro
Intelligent storagey
Intelligent loadi
Intelligent loadj
Intelligent loadh
Intelligent loadk
Intelligent loadj
Intelligent generatorq
Intelligent generatorp
Intelligent generatorm
Intelligent storagex
Measurement and
control unit
High level control
(TSO)

Óbuda University Power System Department
Energy consumption, audits and the intelligent network - Patra, 2012 87
Local power surveillance
generators loads
households
Utility
trader
Energy controller
Óbuda University Power System Department
Energy consumption, audits and the intelligent network - Patra, 2012 88
Communication possibilities
• Inside the flat – LAN (ethernet)
– WiFi
– Bluetooth
– EIB (instabus)
– ZIGbee
– Other field buses (profibus, mobus), stb.
• Between the household and the utility – SMS
– GPRS
– Internet
– PLC (Power Line Carrier), etc.

Óbuda University Power System Department
Energy consumption, audits and the intelligent network - Patra, 2012 89
Conclusion
The basic rules of the Energy management:
• How can you spare energy?
• How can you use with greater efficiency?
• How can you buy cheaper energy?
The customer behaviour can be adjusted (DR, DSM)
• The local intelligence can find a lot of DSM resources
• The new IT systems makes it possible
• The network contains intelligent solution on different
levels
• The technical solution is possible

Óbuda University Power System Department
Energy consumption, audits and the intelligent network - Patra, 2012 90
Thanks for the attention!