Embed Size (px)
Citation preview
Seattle • New Orleans
ENERGY AUDITSGuidance for Small Alaska Fishing Vessels
Presented by Reg Wren, PE
Pacific Marine Expo November 18, 2011

Presentation Outline What are Energy Audits?
– Purpose, Steps, Terms, Outcomes – Levels 1, 2, and 3 – Feasibility of Each – Energy Conservation Opportunities (ECOs)
Energy Consumption vs. Energy Conservation – Bad News: Where Does the Energy Go? – Good News: ECOs and other NA/ME Stuff
Example EA Calculations & Potential ECOs – 47' Troller / Longliner
Financial Analysis Wrap-Up Questions??

Energy Audit Energy Audit – Purpose & Goal
– Identify operations, equipment, and systems that waste energy (fuel/electricity), during the course of a vessel performing its mission
– Identify opportunities to reduce energy consumption, and provide financial analyses of these opportunities
– Reduce Operating Costs by Reducing FO Consumed

Energy Audit Energy Audit Steps and Terms
– Level 1 • Gather Information
– Drawings, Equipment, E-1 line, Operations, and Mission – Operator Interview
• Walk through Audit - Discuss "Low Hanging Fruit" with crew
– No cost to implement – No significant inconvenience to implement – Provide immediate reductions in energy use
• Identify Potential Large Paybacks (ECOs / ECIs)
Energy Audit Steps, cont. Level 2 (Builds on Level 1)
– In Depth Vessel Survey – Energy Records & Measurements • Direct Observation During Vessel Operations • Fuel Meters, Fuel Logs, Utility Records • Power Logging Instruments and Software
– Establish Operational Profile & Energy Maps • Analyze Information and Data (Incl. Operations)
– FO burned – Amps / Voltage / kW; – GPM / PSIG – Temperatures, Pressures, Arrangements – Time
– Develop ECOs

Energy Audit Steps, cont. Energy Conservation Opportunities (ECOs)
– Quantifies Energy Saved (kWh and gallons FO)
– Quantifies Energy Savings ($'s)
– Economic Analysis Determines Priorities
Develop Energy Analysis Report/Present Findings – (Levels 2 and 3)
Level 3 (Builds on Level's 1 & 2) – Follow up and Support Implementation – Research / Evaluate ECIs – Future Design Changes

Feasibility of Energy Audits Walk through Energy Audit (Level 1)
– Provides immediate benefit – Determine cost/suitability of conducting a more complex
Energy Audit (Level 2 or 3)
For a single small vessel (fishing, tug, other..) – Cost of conducting Level 2 Energy Audit rarely provides
sufficient ROI if only conducted on a single vessel – Best ROI applied to a class
For a medium or larger sized vessel (>150') – Level 2 Energy Audit almost always provides sufficient
ROI to justify costs for a single vessel

Propulsion / Generator Engine Energy Consumption - The Bad News
Naval Architecture Stuff (More Bad News)
After the Heat, Where does it all go?
Propellers , Gears, Bearings – Good Propellers: 55% - 65% efficient – Gears: 97% - 98% efficient – Bearings: 98% - 99%
……..And Then…….

More Naval Architecture Stuff(Even More Bad News)
Resistance – Wave Making Resistance – (Bow and Stern)
– Frictional Resistance • Speed Component - (Goes up when you speed up) • Roughness Coefficient
– Hull Cleanliness
– Appendage Resistance (Struts, chocks, stabilizers, rudder, keel coolers, etc…)
• Frictional • Wave
Now for the Good News!

Energy Audit Each energy unit saved through efficiency
improvement saves 3 energy units of fuel use
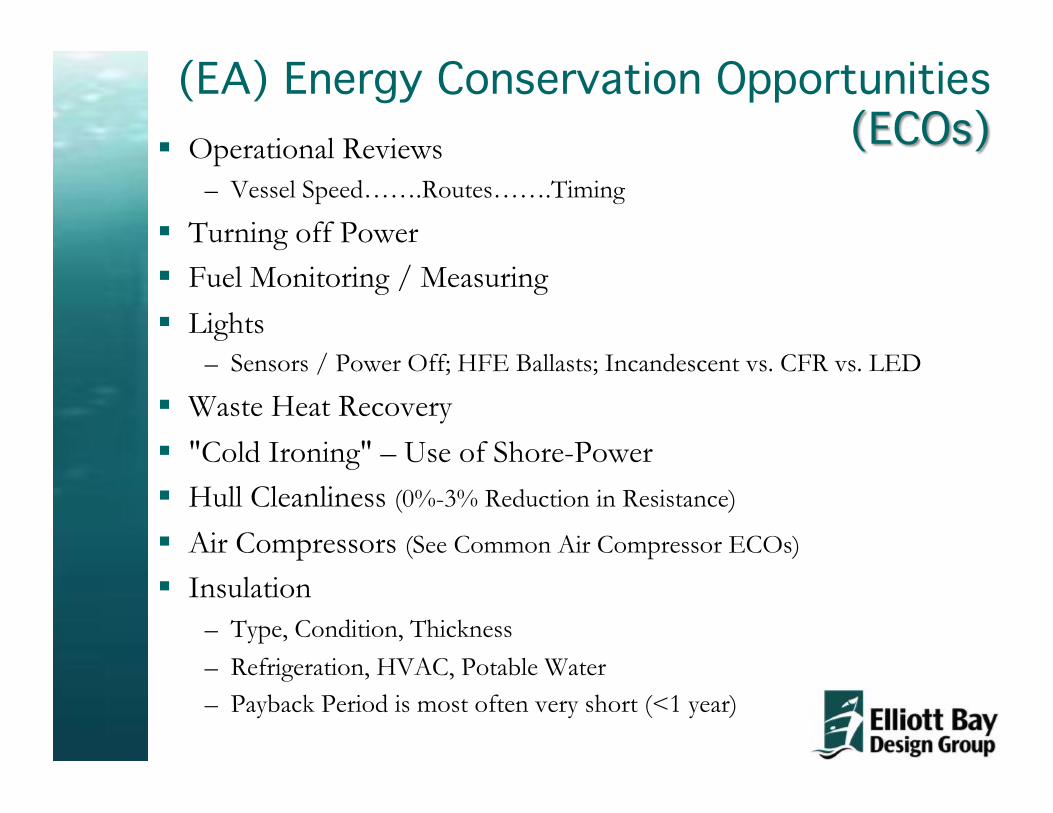
Operational Reviews – Vessel Speed…….Routes…….Timing
Turning off Power Fuel Monitoring / Measuring Lights
– Sensors / Power Off; HFE Ballasts; Incandescent vs. CFR vs. LED
Waste Heat Recovery "Cold Ironing" – Use of Shore-Power Hull Cleanliness (0%-3% Reduction in Resistance)
Air Compressors (See Common Air Compressor ECOs) Insulation
– Type, Condition, Thickness – Refrigeration, HVAC, Potable Water – Payback Period is most often very short (<1 year)
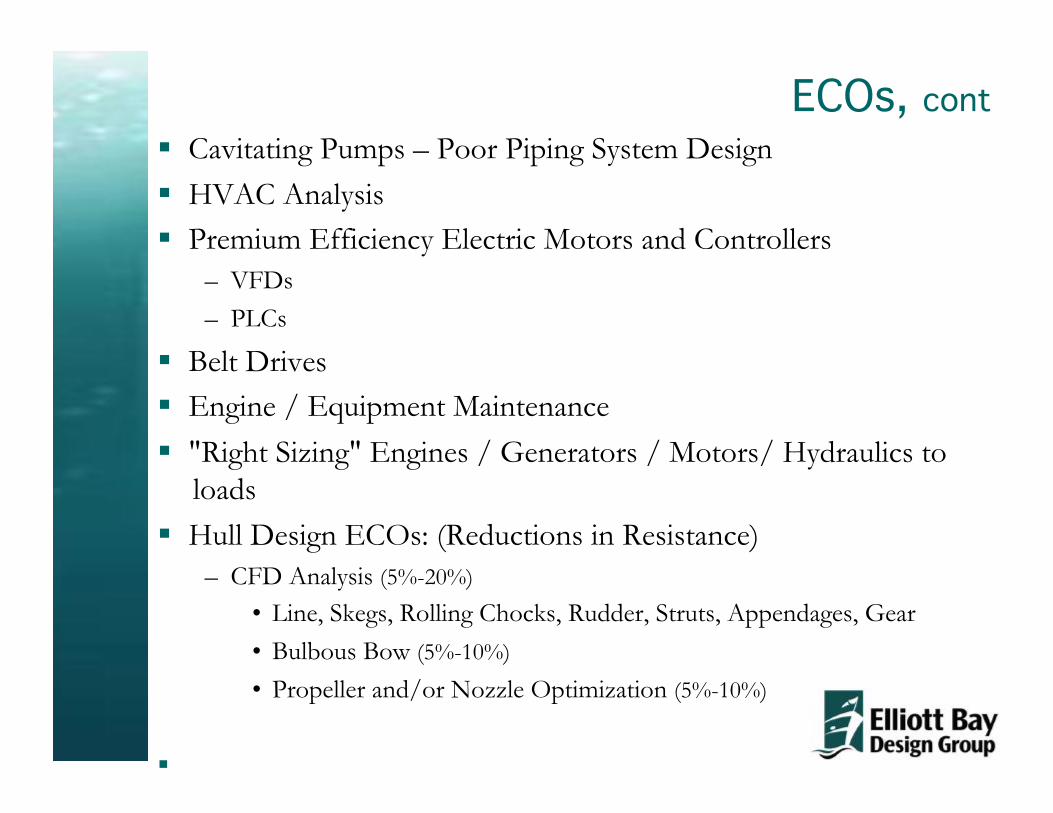
Cavitating Pumps – Poor Piping System Design HVAC Analysis Premium Efficiency Electric Motors and Controllers
– VFDs – PLCs
Belt Drives Engine / Equipment Maintenance "Right Sizing" Engines / Generators / Motors/ Hydraulics to
loads Hull Design ECOs: (Reductions in Resistance)
– CFD Analysis (5%-20%)
• Line, Skegs, Rolling Chocks, Rudder, Struts, Appendages, Gear • Bulbous Bow (5%-10%)
• Propeller and/or Nozzle Optimization (5%-10%)

(Common) Air Compressor ECOs Use Synthetic Lubricants in Air Compressors Check and Verify cut in / cut out Settings Reduce Air Pressure Eliminate / Reduce Air Leaks Recover Compressor Waste Heat Use Outside (cooler) Air for Compressor Intake Install Larger Header Line in Compressed Air System Switch to High Efficiency Belts
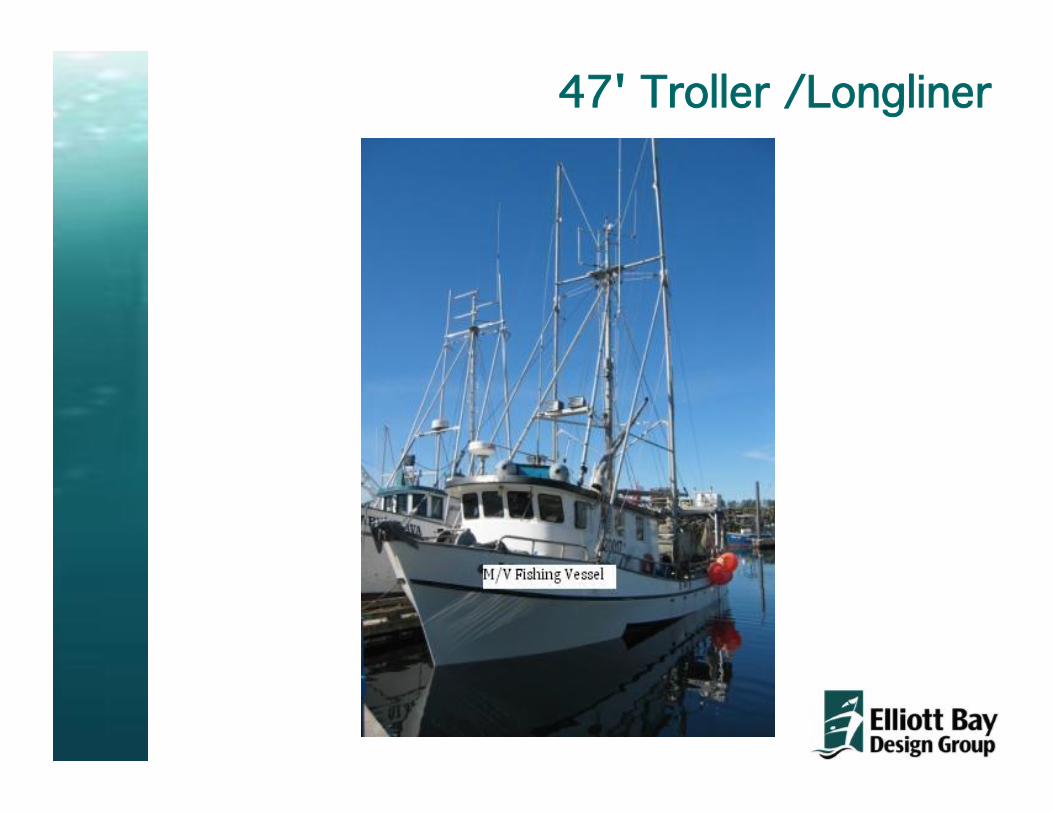
47' Troller /Longliner

47' Troller / Longliner Operational Profiles – 3 Fisheries
– Trolling for Salmon/Delivering Fresh Iced Product – Trolling for Salmon/Freezing Product Onboard – Longline for Sablefish and Halibut
– Equipment Size and Ratings/ Systems' Arrangements & Power Consumptions
– Transit Time, Speed, RPMs, FO Burned – Fishing Time, Speed, RPMs, FO Burned – Stand By Time – Equipment / Systems Power
Consumptions – Lay Up Time - Equipment / Systems Power Consumptions – ………and so on……

47' Troller / Longliner, cont. Vessel "Energy Map"
– High Propulsion, Refrigeration, and Hydraulic Loads • Hydraulic Loads drive Refrigeration Loads • No FO meters – Looking into it
– Very Light 110 v Electrical Loads (Hotel) – 12 and 24 volt Electrical Systems
• Belt Drives, Alternators, Inverters, Batteries
– Good Insulation (Holds and Exhaust) – No HVAC / AC – ER temp is 80°F - 85°F; 12V fans (Good temp) – Diesel Stove for Heat – 2 gal./day – Uses Waste Heat for Hot Water – Custom Propeller – Cupped Trailing edges – Rolling Chocks & Para Vane Stabilizers – And so on………………………
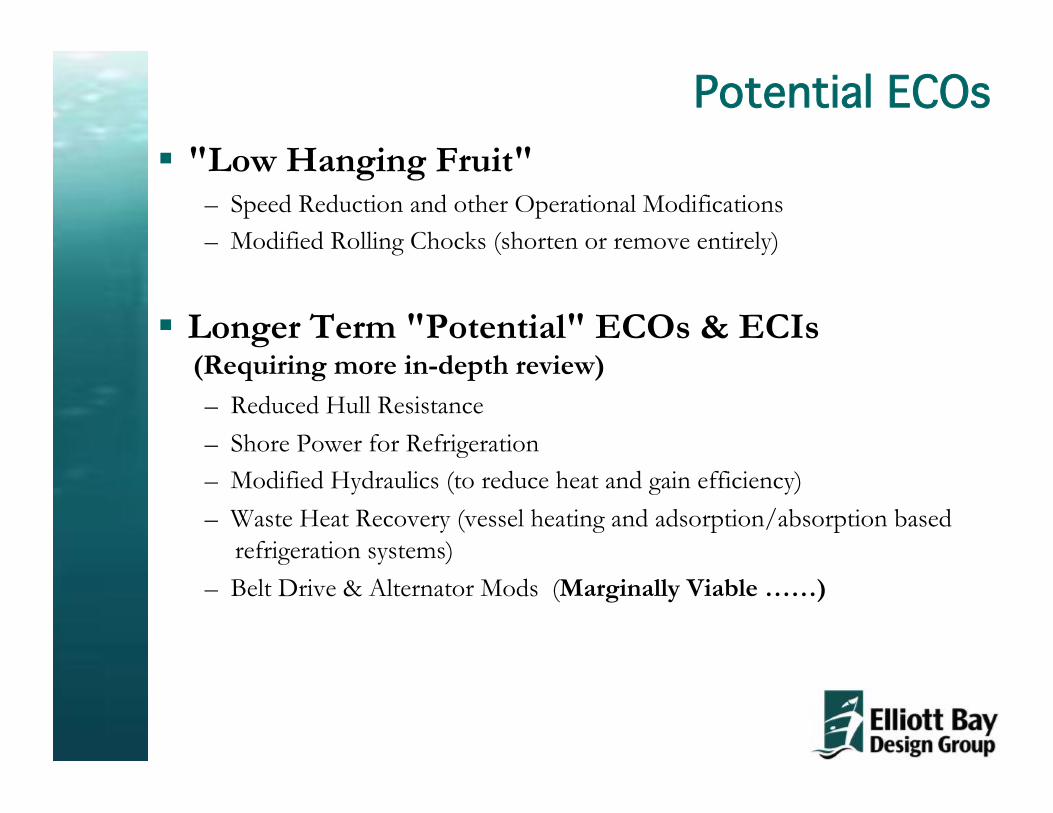
Potential ECOs "Low Hanging Fruit"
– Speed Reduction and other Operational Modifications – Modified Rolling Chocks (shorten or remove entirely)
Longer Term "Potential" ECOs & ECIs (Requiring more in-depth review) – Reduced Hull Resistance – Shore Power for Refrigeration – Modified Hydraulics (to reduce heat and gain efficiency) – Waste Heat Recovery (vessel heating and adsorption/absorption based
refrigeration systems) – Belt Drive & Alternator Mods (Marginally Viable ……)
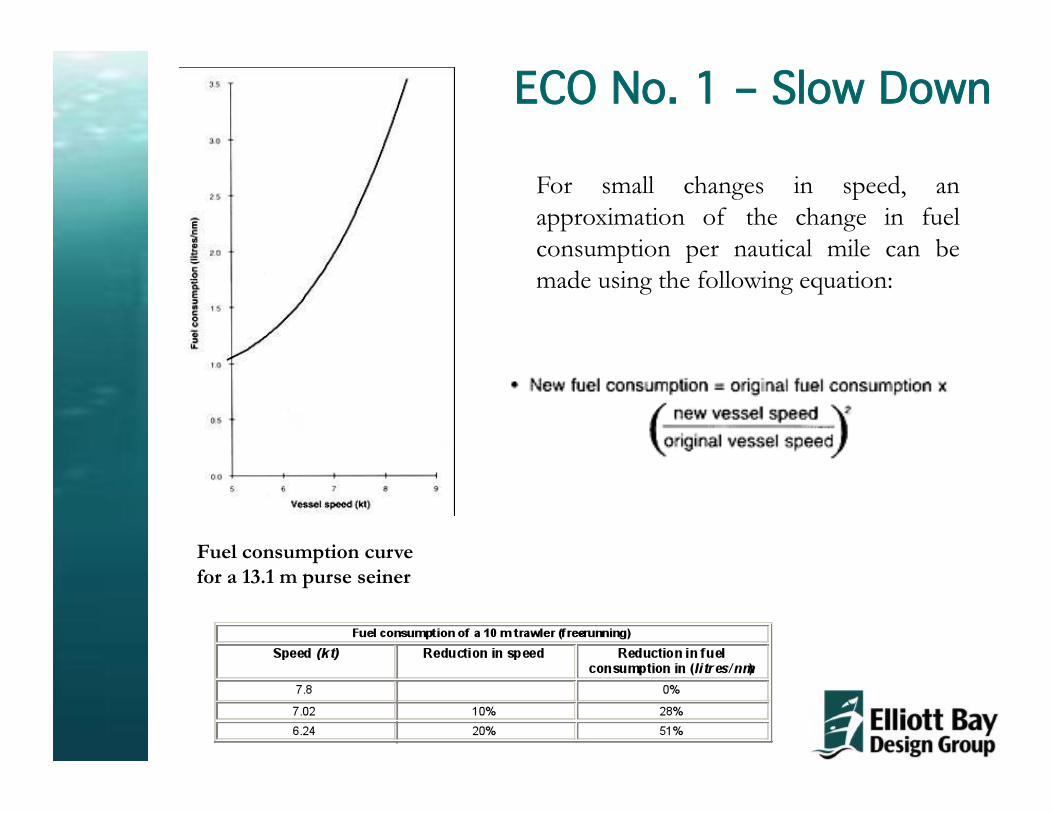
ECO No. 1 – Slow Down
Fuel consumption curve for a 13.1 m purse seiner
For small changes in speed, an approximation of the change in fuel consumption per nautical mile can be made using the following equation:

M/V Fishing Vessel ECO No. 2
More Efficient Belt & Alternator Savings, cont. – 3 Alternators and Belts: (3% Belts; 7% Alternators) – Amperages are Estimated – – Long Line Operational Profile:
• A#1 ME: {(12v x 160 amps) / 1000} x 140 hrs)= 269 kWh / yr • A#1 ME: {(12v x 80 amps) / 1000} x 260 hrs)= 250 kWh / yr • A#2 ME: {(24v x 100 amps) / 1000} x 140 hrs)= 336 kWh / yr • A#2 ME: {(24v x 50 amps) / 1000} x 260 hrs)= 312 kWh / yr • A#3 Aux: {(12v x 90 amps) / 1000} x 40 hrs) = 43 kWh / yr
1,210 kWh / yr • 1,210 kWh x $0.52/kWh = $629 • $629 x 0.10 = $63 / yr
To Be Continued…………………….
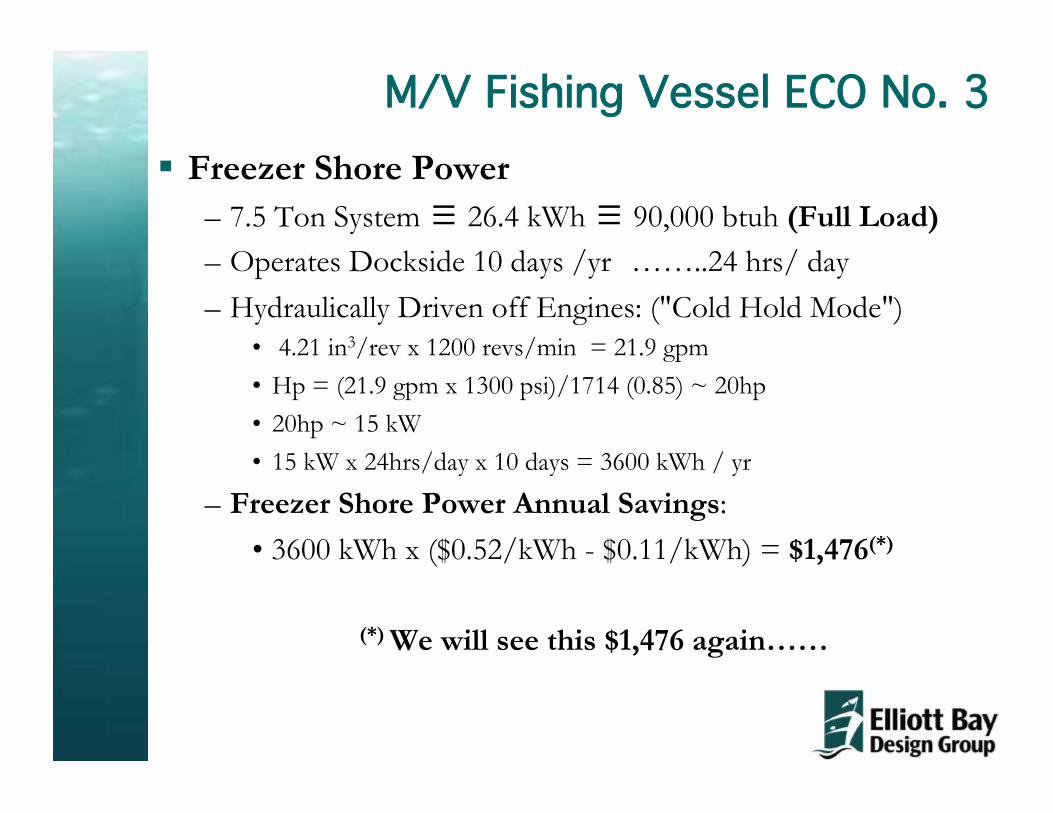
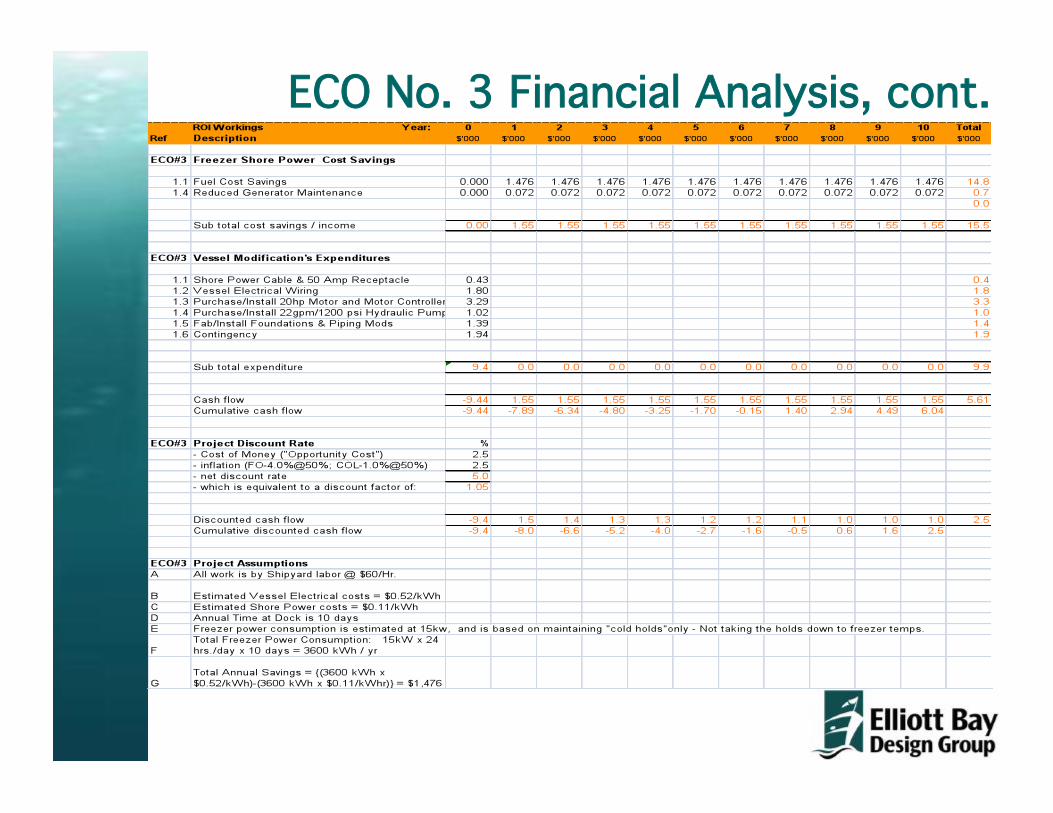
M/V Fishing Vessel ECO No. 3 Freezer Shore Power
– 7.5 Ton System ≡ 26.4 kWh ≡ 90,000 btuh (Full Load) – Operates Dockside 10 days /yr ……..24 hrs/ day – Hydraulically Driven off Engines: ("Cold Hold Mode")
• 4.21 in3/rev x 1200 revs/min = 21.9 gpm • Hp = (21.9 gpm x 1300 psi)/1714 (0.85) ~ 20hp • 20hp ~ 15 kW • 15 kW x 24hrs/day x 10 days = 3600 kWh / yr
– Freezer Shore Power Annual Savings: • 3600 kWh x ($0.52/kWh - $0.11/kWh) = $1,476(*)
(*) We will see this $1,476 again……

ECO Financial Analysis
"Bankers Approach to $'s" - Capital Loan
It boils down to an ….. "Analysis of a Discounted Series of Cash Flows"……. – ECO's initial cost to Implement? (Investment) – Anticipated annual "net returns" from that ECO? (Annual
Savings – Maintenance costs can be included) – What is your "cost of money"? (Discount Rate)
• FO Cost Escalation and General Inflation factors • Risk, History, and Basic Time Value of Money
– Time Frame?
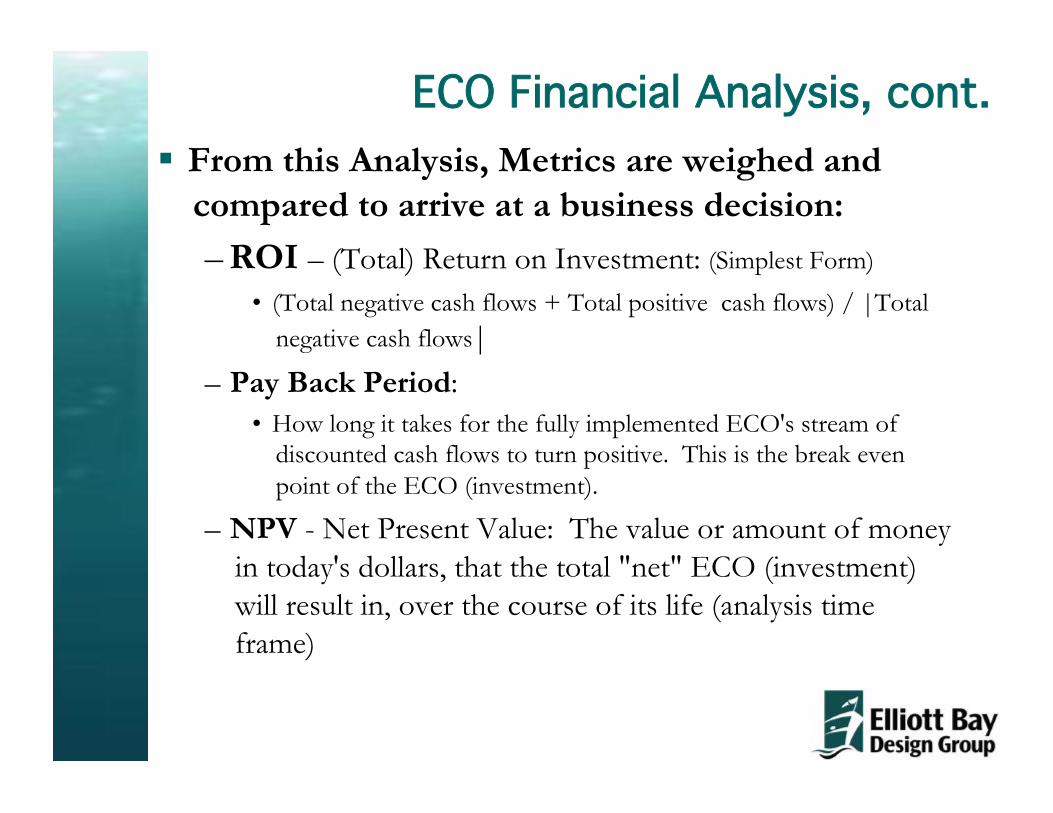
ECO Financial Analysis, cont. From this Analysis, Metrics are weighed and
compared to arrive at a business decision: – ROI – (Total) Return on Investment: (Simplest Form)
• (Total negative cash flows + Total positive cash flows) / |Total negative cash flows|
– Pay Back Period: • How long it takes for the fully implemented ECO's stream of
discounted cash flows to turn positive. This is the break even point of the ECO (investment).
– NPV - Net Present Value: The value or amount of money in today's dollars, that the total "net" ECO (investment) will result in, over the course of its life (analysis time frame)

ECO Financial Analysis, cont.
These (3) Financial Metrics are weighed and compared against the alternative costs of making no changes (leaving the status quo), and other operational and business considerations, to arrive at an action decision
Financial Analysis Software for Cash Flow Analysis – www.axia-consulting.co.uk (Freeware) – Multiple Dozens of ROI / Discounted Cash Flow Freeware – Any $50 Business Calculator

ECO No. 3 Financial Analysis, cont.
-10.00
-8.00
-6.00
-4.00
-2.00
0.00
2.00
4.00
6.00
8.00
1 2 3 4 5 6 7 8 9 10
$'00
0
Years
ECO No. 3: Freezer Shore Power Cash Flows
Cash flow
Cumulative cash flow
Results Summary
Total project cost savings/income $'000 15.5 Total project expenditures $'000 -9.9 Net project savings / income $'000 5.6
ROI (return on investment - after 10 years) 57%
NPV (net present value) $' 000 2.5 at a discount rate of: 5.0%
Payback year Year 7
ECO No. 3 Financial Analysis, cont.
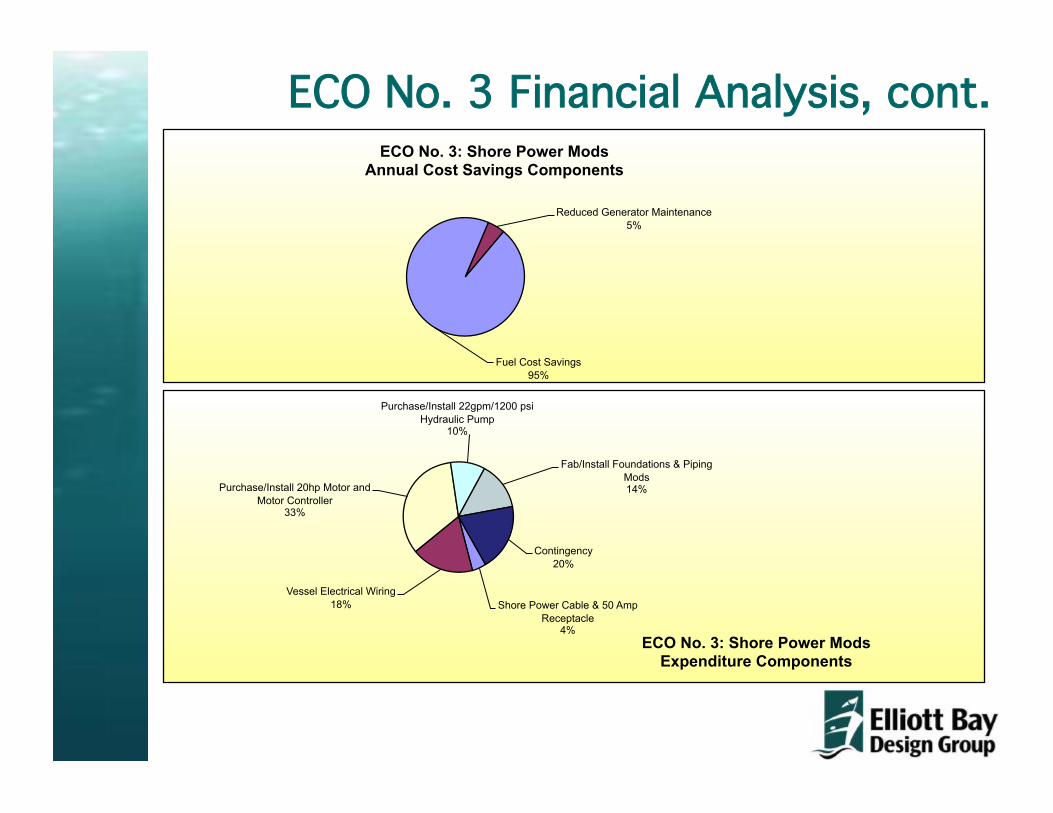
Fuel Cost Savings 95%
Reduced Generator Maintenance 5%
ECO No. 3: Shore Power Mods Annual Cost Savings Components
Shore Power Cable & 50 Amp Receptacle
4%
Vessel Electrical Wiring 18%
Purchase/Install 20hp Motor and Motor Controller
33%
Purchase/Install 22gpm/1200 psi Hydraulic Pump
10%
Fab/Install Foundations & Piping Mods 14%
Contingency 20%
ECO No. 3: Shore Power Mods Expenditure Components
ECO No. 3 Financial Analysis, cont.

Wrap Up – 7 Fundamental EA/EC Ideas 1) Measure and Monitor Fuel & Energy Consumption
– Fuel Meters; Utility Bills; Fuel Logs; Amps/Voltages;Time
2) Apply Common Sense 3) Progress and Savings can be Incremental 4) Pick the Low Hanging Fruit
– Operational Choices and Strategies – Clean Hull – Lights, Electric Motors, Air Compressors, Belts, Right Sizing
Equipment
5) Study and Evaluate the High Fruit • Waste Heat Recovery • Optimize Propulsion and Power Generating / Conversion
Equipment , and System Designs • Bulbous Bows and Other Hull / Appendage / Gear Improvements
6) Nothing is Free – Don't Take any Wooden Nickels 7) A Penny Saved = 3 Pennies Earned