Embed Size (px)
Citation preview

Copyright © TCD 2011
This document may be copied and distributed. Attribution should be given for extracts and references. TCD does not accept any
liability for the use of the information or opinions contained in this document.
ENERGY CONSERVATION
MEASURES IN JAPAN
Trinity College Dublin
JANUARY 2011
Authors : Patrick Shiel, Nick Jeffers, Mark Dyar

2
EXECUTIVE SUMMARY
In Japan, energy efficiency was once primarily a matter of energy security, initially it included only the
energy intensive industry. Today, energy efficiency is also a matter of mitigating climate change and
the Japanese government tries to make energy efficiency everyone’s business. The Japanese
government believes that energy efficiency policies for each sector should be complemented with
policies to promote lifestyle changes and that the general awareness about why energy efficiency is
necessary has to be increased. Japan has achieved a lot of success regarding nationwide energy
efficiency improvements over the last 30 years; however substantial improvements are still required.
Other nations use Japan’s effective energy conservation laws as examples or guidelines to form their
own.
The Energy Conservation Act (law concerning the rational use of energy) was enacted in 1979 and has
subsequently been revised several times. It has contributing to the sound development of Japan’s
economy by setting up necessary measures for the rational use of energy by factories, buildings,
transport, and machinery and equipment. It also strives to reduce Japan’s CO2 emissions and ensure
the effective use of fuel resources. These measures have successfully reduced Japan’s energy
consumption per GDP to just one while the EU consumes 1.8 times more energy per GDP in
comparison. However, between 1990 - 2005 Japan’s green house gas emissions have increased by
7.7% (1). This presents a substantial problem as Japan has committed to a 6% reduction in
greenhouse gas emissions by 2012 from the levels produced in 1990. As a result the government has
heightened efforts regarding green house gas emissions and energy conservation including: voluntary
action plans; public awareness programmes; promotion of energy service companies; and other
campaigns. . The 1979 Act should be seen as a landmark piece of legislation as it has guided energy
policy legislation in many countries since its introduction in Japan. The Act however has resulted in a
one-sided success from the Industrial sector while energy use has increased in the Building and
Transport sectors. Very sharp focus was placed on the Industrial sector from 1979 onward and the
excellent results of these efforts are evident today.
The Tokyo Metropolitan Government (TMG) has taken an even more aggressive stance towards
energy conservation compared to the National government. The TMG established an Environmental
master plan in January 2002. Since the formulation of the plan, the TMG has taken several measures
in addition to the national government to deal with energy conservation. These include: the cap and
trade program; green energy efficient buildings program; automobiles and transportation reduction
in CO2 emissions program; and other emissions reduction programs with a target of 25% reduction in
Green House Gases (GHG) from 2000 levels by 2020. In Sept. 2009, the Prime Minister announced a

3
commitment to reduce GHG by 25% for 1990 levels by 2020. The contrast could not be clearer
between the TMG and National Government targets.
Beyond the Kyoto protocol the Japanese government is looking to create a low carbon society by
2050. The proposed measures to achieve this low carbon society are guided by a scenarios team
whose primary objective is to transform the conventional technological society that depends on huge
resources and energy, into a society in which little energy and resources are used. With this in mind
twelve actions are presented that will enable Japan to reduce CO2 emissions by 70% by 2050 from the
level in 1990.

4
INTRODUCTION
Energy conservation measures have been implemented in Japan since 1947. Japan’s dependence on
oil in 1973 amounted to 80% of its total primary energy use (2). In 1973 and 1979 two global oil crises
resulted in detrimental effects to the Japanese economy. The oil crises revealed the fragility of
Japan’s energy supply and as a result the national government built a more robust supply and
demand structure. The supply side aimed to reduce the dependence on oil through the diversification
of energy sources between alternatives such as natural gas or nuclear power (3). These efforts
coupled with schemes aimed at reducing energy demand have resulted in a reduction in oil
dependence from 80% to just 48% between 1973 – 2007, during which Japan’s Gross Domestic
Product (GDP) has increased by 2.3 times (2). This is largely due to the energy conservation measures
employed in the industrial sector which have not shown any increase in energy consumption between
1973-2007, as shown in Figure 1 . However, both the Commercial/Residential and the Transportation
sectors have shown increases in energy consumption of 2.5 and 2.1 times respectively between these
dates.
Figure 1: Japan’s energy consumption separated into three sectors and compared to the national GDP
The energy use reduction within the Industrial sector has been achieved by sharp focus on that sector
within the 1979 Act. Specific policy actions were taken to ensure a deep understanding of energy use
within individual industries and factories with the mandatory appointment of an Energy Manager.
This level of intervention is not apparent within the other sectors, particularly within the residential
sector, where resident’s rational use of energy is encouraged rather than mandated as it is within the

5
Industrial sector. The Industrial sector has a very clear roadmap within the legislation whereas the
other sectors must rely on good cooperation from industry and business. The imbalance is clear from
the Figure 3.
Figure 2 shows the primary energy consumption per unit GDP for different countries around the
world. The graph was prepared by the international energy agency in 2009 and is normalized with
Japan’s energy consumption per unit GDP. This plot illustrates that Japan’s energy consumption per
unit GDP is approximately 80% and 110% less than the equivalent EU and US figures respectively. This
graph also demonstrates the success of existing energy efficient policies and schemes already in place
in Japan, relative to measures implemented by other countries. Japan’s energy consumption
curtailment is primarily as a result of the Energy Conservation Act 1979.
Figure 2: Primary energy consumption per unit of GDP of countries

6
In 1979 “The Energy Conservation Act” or “Law Concerning the Rational Use of Energy” was
established, as a result of the first and second oil crises (4). Various programmes and policies are
encapsulated within this act, through which the national government objective is to promote energy
conservation measures across all economic sectors. The act applies to four sectors: industry
(factories/workplaces); commercial/residential buildings; machinery/equipment; and transportation.
The act has been amended several times as of the end of April 2010. The primary objective of the Act
is to contribute to the development of Japan’s national economy through the implementation of
energy saving and CO2 reducing measures within these four sectors. The legislation from 1979 and the
subsequent amendments represent a substantial step forward in global energy policy and the
Japanese model has been duplicated in other countries particularly in Asia. However, the pace of
change has been slow, particularly within certain sectors such as Residential. As shown later in this
report, this slow pace has been picked up by the Tokyo Metropolitan Government (TMG) where more
stringent policy is being enacted to reduce energy use and GHG emissions. These actions seem to
have applied some policy pressure to the national Government to do likewise.
The energy conservation policies to date have achieved high levels of success relative to the global
community; however energy consumption rates in Japan still need to be decreased (2). Decreasing
national energy consumption costs coupled with a reduction of green house gas (GHG) emissions are
the key motivating factors behind Japan’s stringent energy conservation policies. In support of this,
the Japanese government ratified the Kyoto Protocol in June 2002 and commits to reduce GHG
emissions by 6% compared to the levels produced in 1990 (5). Japan’s national government provides
various financial support measures to promote and subsidise energy conservation measures including
laws and energy reform taxation systems.
The governmental organisations in charge of energy conservation matters are the: Ministry of
Economy, Trade and Industry (METI); Ministry of Land, Infrastructure and Transport (MLIT); and
Ministry of the Environment. To help support these governmental bodies the following organisations
have been set up to promote energy conservation: Energy Conservation Centre, JAPAN (ECCJ); Japan
Centre for Climate Change Action (JCCCA) and the Institute for Global Environmental Strategies
(IGES).
This report consists of four sections covering:
Japan’s energy conservation laws and policies
Kyoto achievement plan
Energy conservation measures in Tokyo
Japan’s roadmap towards a low carbon society by 2050

7
Japan’s energy conservation laws and policies
ENERGY CONSERVATION ACT
Following two oil crises during the 1970s, Japan introduced a ground-breaking piece of legislation
called the Energy Conservation Act in 1979. The Act was intended to regulate the Rational Use of
Energy in four major sectors – Industry (Factories/Workplaces), Buildings (Commercial/Residential),
Transportation and Machinery/Equipment. Six revisions of the Act have occurred in 1983, 1993,
1998, 2002, 2005 and 2008 as indicated in Figure 3 below.
Figure 3 : Time line of Energy Conservation Act with amendments up to 2009
(Japan Energy Conservation Handbook 2010, ECCJ publication, pp. 3)
Legislative Review
It is worthwhile reviewing the original legislation to determine how the regulatory framework was
intended to be imposed over the four major sectors. It is clear that a common approach was adopted
and each of the four sectors had Standards of Judgement assigned to them. Separating these
Standards of Judgement from the Act allowed a rolling review over time and ever more stringent
regulations to be applied, which is precisely what has happened. It is also worth noting that
application of the regulatory framework is very uneven when the Industrial sector is compared to the
Residential sector. This fact may go some way to explaining why the Industrial sector has performed
very much better than either Transportation or Buildings. The following tabulated summary of how

8
the Act applies to the four major sectors shows the initial imbalance of intense focus on the Industrial
sector versus lack of focus on the Residential sector.
Figure 4 : Summary of Energy Sector Regulations to April 2010
(Japan Energy Conservation Handbook 2010, ECCJ publication, pp. 8-9)

9
The Act of 1979 places obligations on Residential Construction Clients who are building more than
150 units per annum. Below this level of construction, the Act does not apply. Furthermore, it is only
in April 2010 that Orders may be found against these Residential Construction Clients where they are
not complying with the relevant Standards of Judgement. The thinking appears to be that by
imposing ever increasing efficiency standards on equipment and constructors, the residential home
owner would therefore lower energy use. This was purposely chosen as policy rather than placing
direct energy reduction obligations on homeowners of all sizes. There is nothing in the Act to
dissuade the rogue home-owner or occupier from wholesale waste of energy if that is the path
chosen.
The table below gives an overview of how the Act has evolved over the past 30 years and it is
interesting to note the success in the Industrial Sector where much more prescriptive controls were
put in place from the beginning particularly considering the very precisely described role of the
Energy Manager.
Promulgation
Date
Effective
Date
Summary of Legislation and Measure Revision Note
Legislation June 1979 Oct 1979 Provides specific criteria for energy conservation re.
factories, buildings, equipment
Obliges designated factories whose energy consumption
is very large to appoint energy managers and record
energy utilization
Establishes a new test scheme to qualify energy
managers
Thorough energy
conservation initiatives
were required after oil
crisis
Designated factories
count 3,000
Revision (1) Dec 1983 Dec 1983 Streamlines the process of license approval and license
issuance (transfer clerical work to private sector)
ECCJ starts the
examination and training
scheme for energy
managers in 1984
Revision (2) March 1993 Apr 1993 Guarantees the implementation of energy conservation
efforts
Adopts a mandatory periodic report to be made by the
designated energy management factories
The ’92 Earth Summit
raised concerns over
global environmental
issues
Revision (3) June 1998 Apr 1999 Adopts the Top Runner program (to strengthen
measures for the residential and commercial sector)
Obliges the Type I designated Factories to submit a
medium to long term energy plan
Creates a new category as to Type II designated
factories
The amendment of long-
term prospect on energy
supply and demand
(1994)
Revision (4) June 2002 Apr 2003 The category of Type I designated energy management
factory that had targeted five manufacturing industries
was expanded to all industries
Obliges the Type II designated factory to make periodic
reports
Obliges the designated buildings to report energy
conservation measures
Strengthens measures for
the commercial sector as
a result of remarkable
increases in energy
demand trends
Revision (5) August 2005 Apr 2006 The regulatory divisions of heat and electricity for
factories and offices are abolished and integrated into
one energy measure thus expanding the number of
Additional measures are
necessary to achieve the
GHG reduction target
10
designated factories
Strengthens energy conservation measures for
residential buildings and construction sector
Additional three products of the Top Runner program
were designated
New obligations were imposed on consigners and
carriers (both cargo and passengers) for the
transportation sector
Obliges energy suppliers and equipment retailers to
make efforts to promote and disseminate energy saving
information
required by the Kyoto
Protocol
Revision (6) May 2008 Apr 09/Apr 10 Industry and Commercial Sectors
Introduces a system for energy management obligation
per whole enterprise
Treats a franchise chain such as convenience stores as a
single enterprise
Buildings and House Sector
Strengthens measures for large residences and buildings
(introduction of orders in addition instructions and
notices)
Adopts a report on energy-saving methods by owners of
small to medium sized residences and buildings above a
certain size
Adopts energy-saving measures by businesses engaged
in the construction and sales of residences
(recommendations and Orders for those engaged in
construction and sales of a large number of residences)
Promotion of indication of the energy saving
performance of residences and buildings
Strengthens measures for
the commercial sector
including offices,
convenience stores, etc.
and household sector
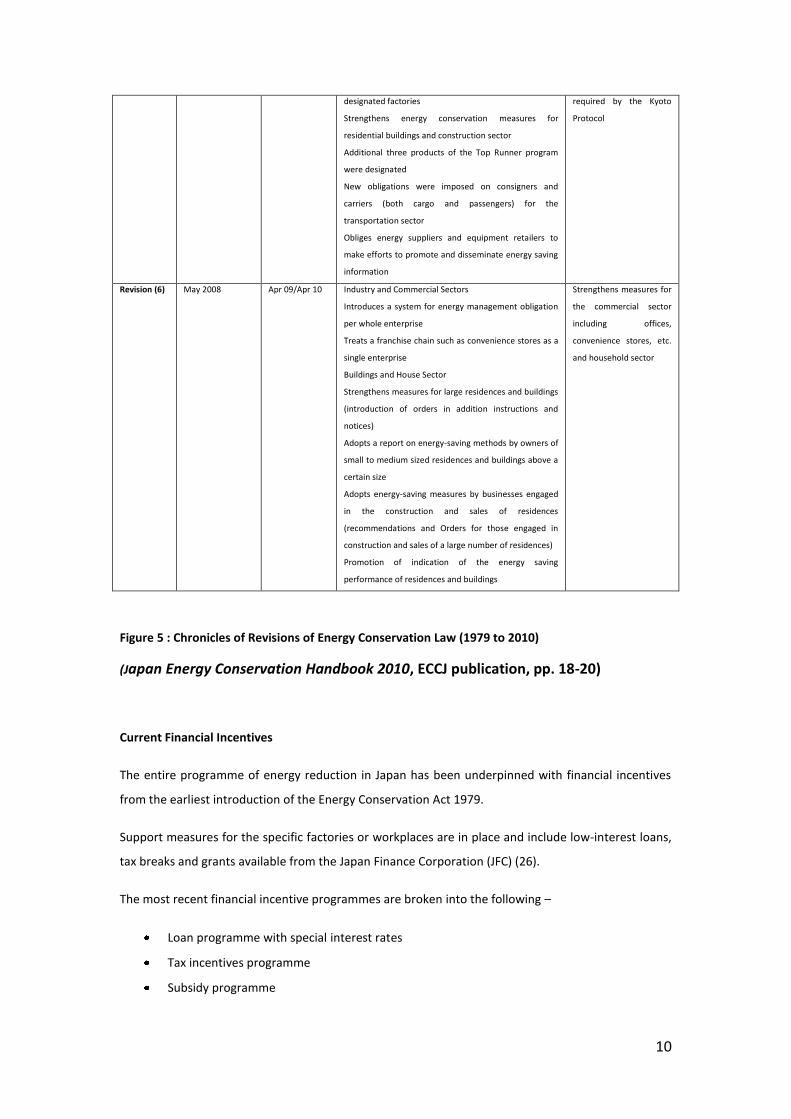
Figure 5 : Chronicles of Revisions of Energy Conservation Law (1979 to 2010)
(Japan Energy Conservation Handbook 2010, ECCJ publication, pp. 18-20)
Current Financial Incentives
The entire programme of energy reduction in Japan has been underpinned with financial incentives
from the earliest introduction of the Energy Conservation Act 1979.
Support measures for the specific factories or workplaces are in place and include low-interest loans,
tax breaks and grants available from the Japan Finance Corporation (JFC) (26).
The most recent financial incentive programmes are broken into the following –
Loan programme with special interest rates
Tax incentives programme
Subsidy programme

11
Loan programme with special interest rates (FY2010)
This programme is based on the “Law for Energy Conservation and Recycling Support 2008”.
Energy Conservation Facilities - Financing is available from the Japan Finance Corporation for
three categories including –
Enterprises installing energy conservation equipment (including the rental of this equipment)
– up to 270M yen (at special interest rate II) and over 270M yen – standard interest rate
Enterprises offering to lease energy conservation equipment by first purchasing such
equipment - – up to 270M yen (at special interest rate II) and over 270M yen – standard
interest rate
Enterprises planning to install specific high-performance energy consumption equipment
such as large furnaces or boilers – – up to 270M yen (at special energy conservation interest
rate B) and over 270M yen – standard interest rate
Interest rates are changed from time to time and applied by the Japan Finance Corp and are primarily
aimed at small and medium enterprises. Conditions apply to qualifying equipment which include
energy efficiency should improve by 25% over existing average equipment (26), replacement
equipment should increase efficiency by over 40% compared to the replaced equipment (26).
Finance Conditions (26) –
Financing Limit – Direct Loan 720M Yen, Alternate Loan 120M Yen
Financing Percentage is a predefined rate based on credit risk and loan period
Financing Period – Less than 15 years of which first 2 years are a grace period
Tax Incentive programme (FY2010)
This programme is based on the “Tax System Promoting Investment in the Reform of the Energy
Supply and Demand Structure”. When business operators purchase equipment which contributes to
efficient energy use and utilise it for business activities within that same year, they can choose one of
the following options –
(1) Tax exemption equivalent to 7% of the equipment acquisition cost (applies only to SMEs).
However, if the tax exemption is equivalent to 20% or more of the annual corporation tax,
the limit of exemption is 20% (26).
(2) Special depreciation of 30% of the equipment acquisition cost in the year of acquisition in
addition to ordinary depreciation rules. This applies to all companies (26).
12
Subsidy Programme (FY2010)
A very comprehensive range of subsidies exist to cover the spectrum of clients from large
corporations to individual householders. Five implementing organisations have been designated by
Government. These include –
New Energy and Industrial Technology Development Organisation (NEDO) – promoting projects for
energy efficiency by improved equipment installation for both industrial and households.
Japan Electro-Heat Centre – promoting energy efficiency in both water heating and air-conditioning
for all types of industry and households.
Toshi-gas Shinko Centre – promoting use of natural gas for energy intensive projects and the
installation of gas networks.
Conference of LP Gas Associated Organisations – promoting the installation of high efficiency water
heating in both industry and households.
Petroleum Association of Japan (PAJ) – promoting installation of high efficiency water heaters (Eco
Feel).

13
ENERGY CONSERVATION ACT RELATING TO INDUSTRY/COMMERCIAL SECTORS
Japan’s energy consumption in the industrial, commercial, and residential sector amounts to 75% of
the total national energy consumption (2). Figure 66 shows the energy consumed in the industrial
sector between 1973 and 2007. The energy used to produce ceramics, iron and steel; non ferrous
metals; paper/pulp; and textiles have continuously reduced since 1973. However the production of,
food, chemicals, machinery/metals and others has increased, and as a result the total energy
consumed in the industrial sector has increased since 1973.
Figure 6: 1016
Joules of energy consumed between 1973 and 2007
Under the Energy Conservation Act, if a factory or workplace in the industrial sector consumes over
1500kL of crude oil or equivalent within a year it is designated as a high energy consumer. According
to the Energy Conservation Act, business types above this threshold, are subjected to the Standards
of Judgment (6) and are assessed annually by the Minster for Enterprise, Trade and Industry.
Figure7 shows the energy consumed by commercial workplaces for 1973, 1982, and 2007. The total
energy consumed has decreased since the levels used in 1973. This was somewhat motivated by the
oil crises Japan experienced in 1973 and 1979 resulting in a 40% drop between 1973 and 1982.
However only a 4% drop in total energy consumption has occurred between 1982 and 2007, although
the energy consuming percentages are somewhat different. In 2007 the dominant energy consumer
was machinery/equipment within the building, for example: computer servers and lighting. Heating
and hot water supply are no longer the dominant energy consumer from modern commercial
buildings.
The following is stipulated for the Industrial sector within the Act –
Improvement in the methods for use of energy, and choice of machinery and equipment in light of
rational use of energy for office use as specified within the Standards of Judgements as mandated
from time to time by the Cabinet.
(a) Rationalisation of combustion of fuels
(b) Rationalisation of heating and cooling and heat transfer
(c) Recovery and utilisation of waste heat

14
(d) Rationalisation of conversion of heat into power
(e) Prevention of electrical heat loss
(f) Rationalisation of conversion of electricity into power and heat
METI shall provide advice on the rational use of energy. Factory sizes are discussed (Type I and II) and
provision is made for various categories of energy users depending on scale and scope of annual
energy use.
Provision is made for the appointment of an Energy Management Control Officer. Appointment or
removal of these individuals must be notified to the Minister (METI). The further appointment of an
Energy Management Planning Promoter along with a licensed Energy Manager in each Type I factory
is also required. The Act calls out specific duties of these individuals along with details of the
individual’s required training and qualifications. Type II Energy Managers are required in Type II
factories. Failure to comply with recommendations or orders arising from reports issued by METI may
result in adverse publicity. Compliance, training, standards for registration, investigative procedures
are all of a similar structure to the Commercial/Residential section below.
Figure 7: 106 Joules per m
2 of energy consumed between 1973 and 2007
The Energy Conservation Act refers to Standards of Judgment which are applicable to factories and
workplaces (25). They are targeted at all those who conduct business activities and consume energy
in their factories, offices, or other workplaces. They ensure that the use of energy is done so
effectively and efficiently. It states that all business operators should appropriately manage their
energy consumption and comply with the various standards for their specific factories/workplaces.
These Standards of Judgement related to factories and workplaces are monitored by the Minister of
Economy Trade and Industry (METI) (7).

15
Certain business types which have been designated high energy consumers are required to prepare
and submit periodic reports regarding the status of their energy consumption to the METI (25). The
factory/workplace can be split into two types depending on their energy consumption (2).
Type 1- factories or workplaces that consume a large quantity of energy (>3000kL). Type 1
designated energy management factories are required to hire a type 1 energy manager who
is fully qualified and certified to be an energy manager. Also in addition to the periodical
reports type 1 factories or workplaces are required to submit medium to long term energy
conservation plans (25).
Type 2 - factories or workplaces that consume a medium quantity of energy (>1500kL). The
law prescribes that a type 2 factory shall appoint a type 2 energy manager. A type 2 energy
manager must complete a designated energy management training course or be a fully
qualified energy manager.
Based on the periodical reports submitted by factories/workplaces and field inspections, the METI
decides the compliance status of the Standards of Judgment at the specific factory or workplace. The
METI evaluates the changes in energy consumption intensity to determine if guidance is necessary or
not. If the rational use of energy is significantly insufficient, instructions about
preparation/submission of rationalisation plans and implementation of the rationalisation plan are
given. If the instructions are not obeyed, a public announcement is made in relation to the companies
noncompliance and an order can be issued with a possible fine attached.
16
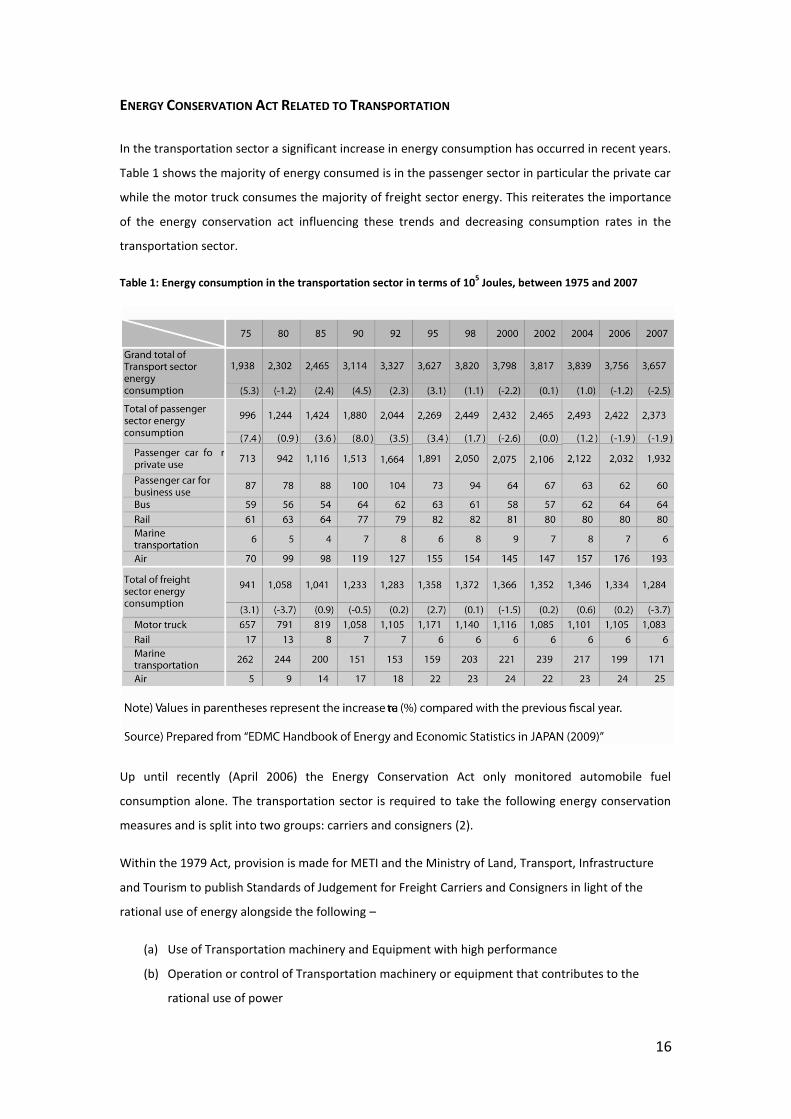
ENERGY CONSERVATION ACT RELATED TO TRANSPORTATION
In the transportation sector a significant increase in energy consumption has occurred in recent years.
Table 1 shows the majority of energy consumed is in the passenger sector in particular the private car
while the motor truck consumes the majority of freight sector energy. This reiterates the importance
of the energy conservation act influencing these trends and decreasing consumption rates in the
transportation sector.
Table 1: Energy consumption in the transportation sector in terms of 105 Joules, between 1975 and 2007
Up until recently (April 2006) the Energy Conservation Act only monitored automobile fuel
consumption alone. The transportation sector is required to take the following energy conservation
measures and is split into two groups: carriers and consigners (2).
Within the 1979 Act, provision is made for METI and the Ministry of Land, Transport, Infrastructure
and Tourism to publish Standards of Judgement for Freight Carriers and Consigners in light of the
rational use of energy alongside the following –
(a) Use of Transportation machinery and Equipment with high performance
(b) Operation or control of Transportation machinery or equipment that contributes to the
rational use of power

17
(c) Use of transportation equipment and machinery with high transportation capacity
(d) Efficient utilisation of transportation capacity of transportation equipment and machinery
Carriers including both freight and passenger
For a carrier business (including business operators having their own physical distribution) to be
designated under the regulations of the energy conservation act, its fleet must exceed 200
trucks/buses or 300 rolling stock cars (2). These specific carriers are obliged to submit the following
reports to the Minister of Land Infrastructure and Transportation: energy conservation plans; energy
consumption report; and the status of efforts related to energy conservation measures (25).
The non-binding energy conservation target for carrier operations as outlined by the energy
conservation act is a 1% annual reduction in energy consumption intensity (25). The following energy
conservations measures can be employed in order to achieve this reduction:
Introduction of fuel efficient cars
Promotion of eco-driving
Improvement of freight loading efficiency
Reduction of air transportation
As of the end of March 2008, 643 companies in the transport sector have been designated in Japan
and submit their annual reports by the end of June every year (2).
Consigners
Consigners who order freight transportation over 30 million ton-kilometres ([freight weight (ton)] x
[transportation distance (km)]) in a year also shall have obligations to prepare the following reports
and submit them annually to the Minister of Economy, Trade and Industry (2): energy conservation
plans; energy consumption report; status of efforts related to energy conservation measures. As of
the end of June 2008, 866 companies have been designated and submit annual reports by the end of
June every year (2).
Monitoring by the Minister of Economy Trade and Industry and Minster of Land Infrastructure and
Transportation
If efforts in energy conservation are deemed to be significantly insufficient, a recommendation,
publication, an order and a penalty (a fine not more than one million yen) are imposed. However the
following support measures are in place:

18
Minister of Land, Transport, Infrastructure and Tourism will provide advice on all aspects of the
rational use of energy.
Spreading and promotion of automobiles which use clean energy as fuel. Preferential tax
measures for purchasing low-fuel-consumption cars and low-air-pollution cars
Financial aid will be offered to help promote the purchase of clean-energy-automobiles and low-
air-pollution cars, and low-fuel-consumption cars, and for the development of the related
technology.
Improvement of energy efficiency of individual transportation equipment. Implementation of
investment and financing, etc. to introduce energy efficient equipment.

19
ENERGY CONSERVATION ACT RELATED TO BUILDINGS/RESIDENCES
Figure8 shows the energy consumed by the residential sector in 1979 and 2007. A marked increase in
consumption of approximately 44% is seen between 1979 and 2007. Lighting, electric appliances, and
others show the biggest increase in terms of energy consumed. This increasing trend reinforces the
importance to curtail the energy consumption rates in Japan.
Figure 8: 106 Joules per Household consumed between 1973 - 2007
According to the Energy Conservation Act construction clients and building owners are required to
take appropriate measures to reduce the heat loss through the building and effectively and efficiently
utilise energy for the operation of building facilities such as heating, ventilation, cooling, lighting and
various other building systems (8). Under the revision of the Energy Conservation Act in May 2008
two types of buildings were segregated:
Type 1 –specified buildings having a total floor area of >2000m2
Type 2 –specified buildings having a total floor area of between 300m2 < 2000m
2
Construction clients and owners who intend to construct or extensively modify “Type 1 Specified
Buildings” or “Type 2 Specified Buildings” shall submit notification of energy-saving measures to the
relevant governmental authorities before the start of construction. In addition, after the completion
of construction or modification, the construction clients or owners who submitted the above
mentioned notification shall submit periodical reports on buildings maintenance with respect to
energy-saving measures.
The energy conservation act related to building/residences is monitored by the Minister of Economy,
Trade and Industry and the Minister of Land, Infrastructure and Transportation. When the authorities
find energy-saving measures for “Type 1 Specified Buildings” to be significantly insufficient in
consideration of the criteria, the authority shall instruct them for improvement. If the construction
clients or owners do not follow the authority’s instruction for improvement on the measures
described in the notification, the authority shall announce to the public the name of the construction
client or owner in question and order them to follow the instructions; otherwise a fine will be issued.

20
Also, when the competent authority finds energy-saving measures for “Type 2 Specified Buildings” to
be significantly insufficient in consideration of the criteria, the authority shall advise them for
improvement, but not take the matter any further. Financial support is available in the form of low-
interest rate loans, tax breaks, and grants.
The following is stipulated for Buildings (Commercial/Residential) within the 1979 Act -
Commercial Buildings falling under this law are referred to “Specified Building”. Residential buildings
falling under this law are referred to “Specified Residence”.
Four categories of construction clients are listed (1) persons intending to construct a building, (2)
Building owners or managers, (3) Persons intending to repair/remodel the building envelope and (4)
Persons intending to install Air Conditioning equipment. The Standards of Judgements only apply to
(1), (3) and (4) and also to owners of buildings beyond a certain size as mandated by Cabinet. A
Special exclusion clause was inserted for home builders whose construction volume is below 150
units per annum (Energy Conservation Act 1979 - Art 73.1).
The Standards of Judgement (or Rational energy use levels) for Specified Buildings are issued from
time to time by the Minister of Energy, Trade and Industry and the Minister of Land, Transport,
Infrastructure and Tourism.
Jurisdiction for Specified Buildings (excluding residences) falls to the local Mayor or Governor and
specifically to the District Building Surveyor. Advice to the design team is available on design,
construction and maintenance from the District Building Surveyor.
The Minister of Land, Transport, Infrastructure and Tourism is specifically responsible for providing
guidelines on energy use in residential buildings.
Notification of any design, construction or changes to existing buildings must go to the relevant local
authority who may issue instructions if the Standards of Judgement are not being met for that
building type. If deemed necessary, the relevant authority may instruct changes to design,
construction or indeed maintenance. If failure to comply with these instructions results, publication
of this fact may ensue. This policy of naming and shaming would appear to be particularly effective in
Japan.
Commercial buildings are split into Type I and II depending on energy use as prescribed by the Cabinet
from time to time. Provision is made for the creation and existence of Registered Investigation bodies
whose function is to ensure examination, reporting and subsequent adherence to the Standards of
Judgements.

21
The Ministry of Land, Transport, Infrastructure and Tourism must provide advice on the design and
construction of new buildings regarding adherence to the Standards of Judgement while the Ministry
of Energy, Trade and Industry must provide advice to manufacturers, processors and importers of the
relevant thermal insulation building materials.
The Standards of Judgement (or Rational energy use levels) for new Specified Residential Buildings are
issued from time to time by the Minister of Energy, Trade and Industry and the Minister of Land,
Transport, Infrastructure and Tourism.
All notification, reporting, inspection and adherence procedures apply to the constructor rather
than the owner of the new residence.
The expert investigator and the experience required are both outlined in some detail within the Act.
Finally the Act places very substantial powers in the hands of the respective Ministries to co-ordinate,
change and revoke permissions to perform, permissions to practice, etc. as required.
Building Energy Regulations for Commercial and Residential Buildings in Japan
Japan has three building energy regulation codes, one covers commercial buildings and the other two
cover residential buildings (9).
Criteria for the Rationalisation of Energy Use for Buildings (CCREUB), is a mixture of
performance and prescriptive energy codes for commercial buildings. It covers insulation of
the building envelope as well as heating, ventilation and air conditioning (HVAC), lighting,
water heating, and vertical transport or lifting equipment
Japan has two building energy codes for residential buildings or houses:
o Firstly the Design and Construction Guidelines on the Rationalisation of Energy Use
for Houses (DCGREUH) includes: insulation of the building; HVAC; water heating; as
well as guidance on maintenance and operations.
o Secondly the Criteria for Clients on the Rationalisation of Energy Use for Houses
(CCREUH) is a mixture of performance and prescriptive based building energy codes.
It also provides performance-based annual heating and cooling loads by building
type.
In addition to the mandatory building standards, Japan also has implemented voluntary programmes
to stimulate building energy conservation. The first two of the following are directed at residential
buildings, while the last is directed at commercial buildings:
The Housing Quality Assurance Law is a voluntary housing performance labelling system for

22
the protection of consumers. It contains standardised criteria for evaluating a wide variety of
housing performance, including the building’s structural stability, fire safety, indoor air
quality, acoustics, lighting, and thermal performance.
Environmentally Symbiotic Housing Model Project, supports the installation of
“environmentally symbiotic facilities,” including permeable pavement or facilities that utilize
natural energy sources, and skeleton infill systems or those that use recycled materials. The
Minister of Land Infrastructure and Transportation subsidizes one third of the costs for
implementation of such products.
CASBEE (2001). CASBEE stands for “Comprehensive Assessment System for Building
Environmental Efficiency”, a green building rating system developed by the Japan
Sustainable Building Consortium to assess the “environmental efficiency” of buildings. The
CASBEE compares the environmental quality and performance delivered by the building
envelope, against its environmental loading in terms of energy used in construction, and the
resources/materials used. CASBEE is a voluntary program being implemented by local
governments, with training for the assessors and third party assessment.
As a brief means of comparison, the assessment methods used in the UK and US are summarised
below. These standards are being adopted in various forms worldwide.
Building energy regulations for Commercial and Residential Buildings in the UK
The UK established a building energy rating system for the commercial sector in 1990 known as
BREEAM (Building Research Establishment Environmental Assessment Method) (10). The method
produces a certificate based on a straightforward scoring system that maintains a robust technical
standard with rigorous quality assurance, which is easy to understand, transparent and supported by
actual performance data from the building. This results in a positive effect on the building design,
construction and lifecycle management. Today, BREEAM is the leading and most widely used building
energy rating system in the UK. It motivates developers and designers to find innovative solutions
that minimize the environmental impact to achieve a higher performance than the benchmark
regulation to give their specific buildings an advantage in a competitive marketplace. It also assures
clients and potential clients that the best environmental practices are incorporated into the building
including: energy savings, water efficiency, CO2 emissions reduction, improved indoor environmental
quality, and others.
EcoHomes is a version of BREEAM for domestic residences. It provides a performance rating for new,
converted or renovated homes, and covers houses, flats and apartments. It works on a similar
principle to the standard BREEAM method and it balances environmental performance with the need
for a high quality of life and a safe and healthy internal environment.

23
Building energy regulations for Commercial and Residential Buildings in the US
The U.S. Green Building Council developed a green building certificate system known as LEED
(Leadership in Energy and Environmental Design) (11). This methodology provides a framework for
identifying and implementing green building practices. It is an internationally recognized green
building certification system, and provides third-party verification that the best energy efficient and
environmental practices are incorporated into the building. LEED is flexible enough to apply to all
building types - commercial as well as residential. Its implementation carries through the entire life
cycle of the design and construction of the building.
Both BREEAM and LEED have been criticised for cost of implementation (both construction and
consultancy) but perhaps more telling, buildings not performing to low energy use post-occupancy.
This operational view of energy use in buildings is being addressed in revised versions of both
BREEAM and LEED but unlike Japan, there is no regulatory enforcement of energy efficiency once the
BREEAM or LEED rating has been applied to the building. There is nothing to stop an office worker
from running the local Air Conditioner with the windows open.

24
ENERGY CONSERVATION ACT RELATED TO ENERGY CONSUMPTION OF EQUIPMENT & MACHINERY
Large quantities of energy are required for the operation of automobiles, air-conditioners, and other
high energy consumption equipment. In order to reduce the energy consumption of these products
both the usage levels by the individual customer and the efficiency of the product itself needs to be
addressed.
Obligation of Manufacturers: Top Runner Program
According to the Energy Conservation Act those who produce or import high energy consuming
products are responsible for the efficiency of the equipment. The efficiency standards of the
equipment are dictated by the “Top Runner Program” (12). The “Top Runner Program” values are set
to exceed the efficiencies of the most efficient product of the same group on the market. The time
frame for these standards to be reached is usually 4-8 years. If a significant gap appears in efficiency
levels between products the Minister of Economy, Trade and Industry and the Minster of Land,
Infrastructure, and Transport will provide necessary advice and recommendations to reduce this gap.
If this advice is not followed, the company and recommendations will be made public and the
manufacturer may also be ordered to implement them.
As of July 2009, the number of target appliances and automobiles reached 23 which include:
passenger vehicles, freight vehicles, air conditioners, TV sets, video recorders, fluorescent lights,
copying machines, computers, magnetic disc units, electric refrigerators, electric freezers, space
heaters, gas cooking appliances, gas water heaters, oil water heaters, electric toilet seats, vending
machines, transformers, microwave oven, electric rice cookers, DVD recorders, routers and switches.
The table below shows the improvement already achieved by the top runner program. More details
regarding specific regulations for each of the target appliances can be found in the top runner
documentation (12).

25
Target
Fiscal Year
Base Fiscal
Year
Efficiency
Improvement
(Projected)
Efficiency
Improvement
(Actual)
Gasoline Passenger Vehicles 2010 1995 22.8% 26.0%
Diesel Freight Vehicles 2005 1995 6.5% 21.7%
Air Conditioners 2004 1997 66.1% 67.8%
Fluorescent Lamps 2005 1997 16.6% 35.6%
TV Sets (CRT) 2003 1997 16.4% 25.7%
Video Cassette Recorders 2003 1997 58.7% 73.6%
Copying Machines 2006 1997 30.0% 72.5%
Computers 2005 1997 83.0% 99.1%
Magnetic Disc Units 2005 1997 78.0% 98.2%
Electric Refrigerators 2004 1998 30.5% 55.2%
Electric Freezers 2004 1998 22.9% 29.6%
Vending Machines 2005 2000 33.9% 37.3%
Table 2: Presents the projected and actual efficiency improvements as a result of the Top Runner Program
Prepared from EDMC Handbook of Energy & Economic Statistics in Japan 2009
Labelling
Appliance Labelling: Equipment described above shall be labelled with a five-star rating system. This
label indicates the energy efficiency of the product and provides running cost information to
consumers to help them select highly efficient products (12). Figure 99 shows the energy saving label
used to display the energy efficiency of the product.

26
Figure 9: The energy efficient product labelling system with the different sections explained (12)
Retailer Assessment Program: This label is used to recognise retailers who provide energy saving
information to their customers and sells/stock high quantities of energy efficient equipment (12).
Figure10 shows the logo that selected retailers who excel at promoting energy efficient products are
allowed to display in their store.
Figure 10: Label given to retailers who excel at promoting and distributing energy efficient products

27
Error! Reference source not found.11 shows the flow chart for energy efficient products cycle.
The cycle is based on simple principles: by providing the consumer with the necessary information,
through advertising, it is possible to increase the popularity of energy efficient products which in-turn
will drive manufacturers to produce better more efficient product that the retailers can easily sell to
the customers.

28
Kyoto Achievement Plan
Since Japan ratified the Kyoto Protocol in June 2002, the country has been actively promoting the
implementation of measures to reduce green house gas (GHG) emissions, including measures for
energy conservation and new forms of energy. Japan pledged a 6% reduction in greenhouse gas
emissions from the 1990 levels by 2012. However Japan’s GHG emissions in 2005 totalled 1359
million tons of CO2 or equivalent, up 7.7% from the 1261 million tons of CO2 or equivalent in 1990 (1).
Moreover the 2005 emissions were 13.7% more than the Kyoto Protocol target at 1186 million tons of
CO2 or equivalent. Factors causing these increases in energy related CO2 emissions include:
The commercial sector, which accounts for more than 20% of Japan’s total energy-related
CO2 emissions, expanding by 45.4% from 1990 (1).
The residential sector, which accounts for some 10% of Japan’s total energy-related CO2
emissions, also expanded by 36.4% (1).
NIPPON KEIDANREN VOLUNTARY CO2 REDUCTION PLAN
The Keidanren Voluntary Action Plan was set up by the Japanese business federation in 1997 to
stabilise the CO2 emissions as a result of energy consumption by 2010. The plan aims to stabilise the
CO2 emissions from fuel combustion and industrial processes. It is an alternative to policies such as
emissions trading or carbon tax, however the impact of the plan is unknown as of yet. The expected
reduction is 21 million tons of CO2 or equivalent (1).
The plan consists of 35 industries including: energy; mining; manufacturing; and construction. These
industries select their own target indices such as gross CO2 emissions, CO2 per unit, energy
consumption; and energy efficiency. The CO2 reduction plan is part of the national Kyoto achievement
plan, however there is no agreement with the government to assure the targets are reached. The
voluntary CO2 reduction plan has the following substantial shortcomings (13):
Industries choose convenient indices (CO2 emissions, CO2 per unit, energy consumption; and
energy efficiency) to easily achieve their proposed targets. To date only 10% of the industries
in the voluntary program have achieved the enhanced efficiency required by the national
commitments to the Kyoto protocol.
Japan has shown an increase of 10% since 1990 in the utilization of coal fired power plants
and as a result the Japanese industry uses more coal than industries in Europe and US. The
Keidanren Voluntary CO2 Reduction Plan allows the practice of increased coal usage, which
could be avoided.
After the oil crises Japan became one of the most energy efficient countries in the world, in
1980 consuming 75% less energy per product unit compared to the UK and US, but have
shown little improvement in efficiencies since then, as shown in Figure3. However, in recent

29
years the UK and US have reached the same consumption levels as the Japanese. This lack of
improvement is not helped by the fact that the Keidanren Voluntary CO2 Reduction Plan
target is to increase efficiencies by 0%.
There is little chance that the Keidanren Voluntary CO2 Reduction Plan will achieve its targets
because no assurances for achieving them have been given. Yet the Japanese government’s
Kyoto Protocol Target Achievement Plan is predicting that 85% of the total CO2 reduction
from the industrial sector (factories and workplaces) will result from the implementation of it
and have suspended the implementation of more efficient policies such as carbon tax and
emission trading.
ENERGY CONSUMPTION REDUCTION MEASURES AIMED AT THE GENERAL PUBLIC
The Japanese government has implemented a series of national information campaigns to increase
public awareness regarding energy consumption. The objective of the campaigns are to somewhat
change the general public’s habits, lifestyle and opinion regarding energy use. These national
information campaigns were contained within the Team Minus 6 project which was launched in 2005
(14) (15). Some of the campaigns within this project are as follows:
Cool Biz: this campaign advises people to save energy by limiting air condition during
summer and instead adjust their clothes. This campaign is estimated to have reduced CO2
emissions by 1.14 million tons in the summer of 2006 (14).
Warm Biz: this is the winter counterpart to cool biz and encourages people to dress
appropriate instead of using too much heat and electricity and has an estimated emissions
saving of 1.41 million tons of CO2 in autumn/winter 2005 (14). These CO2 savings need to be
put into context as Japan produced 1.38 billion tons of CO2 in 2005 (Ministry of
Environment, 2007 a; Ministry of Environment, 2007 b)
Uchi-Eco (home-eco): This campaign was launched in 2006 and advises people to make daily
efforts to purchase and use environmentally friendly locally produced food products,
clothing, and housing (14).
Energy Conservation Promotion throughout the Year: The Japanese government has
declared the first day of every month as "Energy Conservation Day", and February as "Energy
Conservation Month" and the first day of August and December every year as "General
Check-up Day for Energy Conservation", in order to promote energy conservation efforts
across the nation and throughout the year.
In January 2010, the Minus 6 Project has evolved into the Challenge 25 Campaign.

30
ENERGY SERVICE COMPANY (ESCO)
ESCO companies assess existing buildings energy consumption levels and determines where savings
can be made. The company usually takes its payment as a percentage of the energy savings achieve
over a predefined period of time ultimately saving energy costs and/or reduced utility costs. ESCO’s
usually introduce various energy-saving equipment and systems, monitoring practices and efficient
operation controls. The purpose of the system is to achieve comprehensive energy saving for an
entire building by monitoring the energy supply and demand in the entire building in order to be able
to integrate efficient operation of equipment and facilities inside the building (15).
EXPECTED IMPROVEMENT OF ENERGY-SAVING PERFORMANCES
The energy-related CO2 emissions reduction measures for each sector given below and are
accompanied by the expected reduction of crude oil or equivalent by 2010 as of May 2007 (16).
Factories and Workplaces (Industry)
Implementation of the Keidanren Voluntary Action Plan on the Environment. - expected
reduction of 15000 million litres of crude oil or equivalent
Introduction of energy conservation equipment such as high performance furnaces, boilers -
expected reduction of 1080-1600 million litres of crude oil or equivalent
Energy conservation by coordination among adjacent factories - expected reduction of 450-
1000 million litres of crude oil or equivalent
Reinforcement of energy management - expected reduction of 400 million litres of crude oil
or equivalent
Dissemination of fuel-efficient construction machines - expected reduction of 100 million
litres of crude oil or equivalent
Buildings and Residences
Efficient improvement of equipment by top runner standards - expected reduction of 6100
million litres of crude oil or equivalent
Reduction of standby power consumption - expected reduction of 400 million litres of crude
oil or equivalent
Improvement of energy saving performance in building/houses - expected reduction of
11300 million litres of crude oil or equivalent
Dissemination of energy saving equipment such as high efficient water heater, lighting (LED),
air-conditioner, and refrigerator - expected reduction of 2600-3100 million litres of crude oil
or equivalent

31
Provision of energy information to consumers by energy supplier - expected reduction of
500-1000 million litres of crude oil or equivalent
Promotion of more efficient equipment - expected reduction of 1800 million litres of crude
oil or equivalent
Promotion of Building Management Systems - expected reduction of 1600-2200 million litres
of crude oil or equivalent
Reinforcement of energy management - expected reduction of 700 million litres of crude oil
or equivalent
Transportation
Improvement of fuel efficiency of vehicles by top runner standards - expected reduction of
8700 million litres of crude oil or equivalent
Dissemination of clean energy vehicles - expected reduction of 200-900 million litres of crude
oil or equivalent
Introduction of sulphur-free fuel and vehicles that can run on the fuel - expected reduction
of 0-100 million litres of crude oil or equivalent
Support the introduction of ideal stopping of vehicles - expected reduction of 10-20 million
litres of crude oil or equivalent
Energy saving measures concerning transportation systems such as promotion of use of
public transportation, modal shift to rail freight, and improvement of energy efficiency of rail
and air - expected reduction of 11200-12200 million litres of crude oil or equivalent
Energy Supply
Renewable energies - expected reduction of 1504-19100 million litres of crude oil or
equivalent
Promotion of introduction of cogeneration with natural gas - expected reduction of 4980-
5030 million litres of crude oil or equivalent
Promotion of introduction of fuel cells - expected reduction of 20-2200 million litres of crude
oil or equivalent
Reduction of CO2 emissions intensity in electricity sector by promoting Nuclear Power -
expected reduction of 20% compared to 1990

32
ENERGY CONSERVATION MEASURES IN TOKYO
The Tokyo Metropolitan Government (TMG) is seen as a pioneer regarding energy conservation
measures and has undertaken policies beyond that of the national government and other
municipalities (17). The TMG is seen to develop novel initiatives relating to energy efficient policies to
spearhead not just nationally but global schemes. As a result the TMG adopt far more aggressive
energy conservation measures compared to the national government.
The TMG has taken measures to deal with energy conservation and climate change across all sectors
including: industrial/commercial; buildings/residences; and transportation. The TMG is actively
tackling the environmental crises represented by climate change, and is taking effective measures,
aiming at the realisation of an advanced environmental city with the lowest possible environmental
burdens. The principle energy conservation initiatives implemented locally by the TMG are as follows:
the cap and trade program; green energy efficient buildings program; automobiles and transportation
reduction in CO2 emissions program; and other emissions reduction programmes. The following
energy conservation measures are currently implemented by the TMG.
THE CAP AND TRADE PROGRAM (INDUSTRIAL AND COMMERCIAL SECTORS)
In December 2006 the TMG announced its target of reducing Green House Gas (GHG) emissions by
25% below the 2000 levels by 2020. The TMG believes this is Asia’s first Urban scale Cap and Trade
scheme. It is estimated that over 50% of domestic GHG emissions will be covered by the scheme and
it is the TMG’s stated wish that this scheme be rolled out nationally throughout Japan (17). The
implementation of the programme is to start in 2010, and covers both the industrial and commercial
sectors. These sectors produce approximately 40% of the total GHG emissions of Tokyo (17). This 25%
reduction target applies to large-scale facilities (buildings / factories) that have total consumption of
fuels, heating and electricity of at least 1500kl per year of crude oil or equivalent (17).
About 1400 large CO2 emitting facilities such as specific office buildings and factories come under this
classification. Tokyo’s commercial sector comprises of many facilities, including office buildings. The
cap applies to slightly less than 80% of these facilities including almost all major skyscrapers in Tokyo.
The GHG emitted by the 1400 facilities (buildings/factories) are estimated to total approximately 13
million tons CO2 or equivalent annually.
The 25% reduction in GHG emissions is planned to be achieved over two five year compliance periods.
The first compliance period runs between 2010 until 2014 and the second will run from 2015 until
2019. The reductions for each facility will be compared to its base year’s emissions. This base year
figure is calculated from the average actual emissions of the facilities over the past three years (i.e.
average emissions between 2007 and 2009). The reduction target for the first compliance period

33
(2010 – 2014) has been set at a level of 6% below the base year emission and applies to factories and
buildings receiving energy from district heating and cooling plants. The reduction target for the other
relevant buildings has been set at 8% below the base year emissions. The reduction target for the
second compliance period is set at a level of approximately 17% below the base year emission. The
base year for the second compliance period is adjusted to the average emissions between 2012 and
2014. Facilities that make substantial progress with regard to measures against global warming are
recognised as top-level energy efficient facilities.
Allowances for the respective facilities (buildings/factories) are calculated by multiplying the base-
year emissions by the compliance factor by the compliance period. For example: base year emissions
equals 10,000 ton; compliance factor for first compliance period is 8%; and the compliance period is 5
years. As a result the allowance over the first compliance period is a reduction in emissions as follows:
4,000 ton = 10,000 x 8% (0.08) x 5. Basically, by the end of the first compliance period (end of 2014)
this specific facility must have reduced its emissions by 4000 tons.
These cap obligations are mandatory and penalties apply to any breach or non-compliance. The
penalties consist of fines (up to ¥500,000), publication of the breach, and a type of surcharge
collected in proportion to the failure to fulfil the obligation. The specific facility or company cannot
evade the obligation to reduce CO2 emissions even after the payment of fines. In addition to the fine
the facility must then reduce emissions by 1.3 times the original reduction target. There are two
methods of reducing emissions to abide by the first compliance period: Method 1, Self Reduction;
Method 2, Emission Trading.
Facilities whose GHG emissions reduction exceeds their yearly obligation may trade the surplus to
companies struggling to comply with their allocated emissions. Essentially this system allows facilities
that took excessive reduction measures to sell the reduced amount before the end of the compliance
period.
Proposal for Nationwide Introduction of Cap-and-Trade Program Japan
In September 2009, Japan’s Prime Minister committed to reduce the countries GHG emissions 25%
below the 1990 levels by 2020. In response to this the TMG proposed a nationwide cap-and-trade
program for the entire country of Japan. The following points were included in the proposal:
Introduction of a mandatory cap-and-trade program with an absolute cap not a voluntary
program like the Keidanren Voluntary Action Plan.
The proposed program corresponds to the global standards for future possible links with
other national carbon markets for international carbon trading.
The proposed nationwide cap-and trade program consisted of two sub programs that cover
at least 60% of the total domestic CO2 emissions. These sub programs are based on the

34
national law and are as follows: national cap-and-trade program (NLCTP); and regional cap
and trade programs (RLCTP).
o The NLCTP targets very large scale energy and resource suppliers such as power
plants and steel plants. There are approximately 500 of these types of industries in
Japan.
o The RLCTP targets large scale facilities such as factories, office buildings and public
facilities. There are approximately 14000 of these types of facilities and the
programmes will be managed locally by region.
GREEN BUILDING PROGRAM (BUILDING AND RESIDENTIAL SECTOR)
The TMG Green Building Program covers both new builds and expansion of existing buildings (18).
The program is designed to promote energy efficient building practises in the construction sector.
Building owners covered by the ordinance are those who intend to newly construct or expand
buildings with total floor space exceeding 10,000m2. The green building program can be split into two
subsections covering: the use of energy throughout the buildings existence; and the materials used to
construct the building.
Measures to reduce energy consumed by buildings are as follows:
Effective measures of reducing the buildings thermal loads as a result of solar and other heat
sources. These loads result in an increase in energy consumption by HVAC systems which
attempt to control the building’s internal environment. These effective measures include:
insulating the exterior of the building; installing pent roofs; verandas; louvers and blinds to
shield against sunlight; and the placement of non-air-conditioned room on the western side
of the building that is exposed to large solar thermal loads.
Use of natural energy in the form of solar, wind and natural light is an effective energy
conservation measure that does not rely on mechanical equipment.
Energy-saving mechanical systems and optimised energy management of: HVAC systems;
lighting equipment; hot water supply systems; and elevators.
Energy conservation measures in local communities including district heating and cooling
plants.
The optimum use of natural resources
The use of eco-friendly materials including: recycled aggregates and steel materials; mixed
cement; and other eco friendly materials.
Extension of building life through careful maintenance, management and modification
results in a reduction in the consumption of materials and supplies in the construction and
demolition of buildings.

35
The utilisation of rainwater for secondary water supply systems.
The implementation of the green building program helps mitigate the “heat island phenomenon” in
Tokyo. This phenomenon is caused by the waste heat of buildings facilities causing the temperature in
urban areas to be substantially higher than the surrounding rural areas.
Source) Tokyo Metropolitan Government – Outline of the Tokyo Green building program under the
Tokyo Metropolitan environmental security ordinance
TRANSPORT SECTOR ENERGY / CO2 REDUCTION PROGRAMS
The automobile and transport sector accounts for about 20% of the total CO2 emissions in Tokyo. In
an effort to reduce this environmental load the TMG have started to promote the widespread use of
electric (EV) and plug in hybrid vehicles (PHV). The TMG objective is to have 15000 electric and plug in
hybrid vehicles and 80 quick charge stations in widespread use within five years (19). The following
approaches are taken to create the movement:
Governmental financial subsidies promoting the introduction of both EV’s and PHV’s.
Table 3: Flow chart presenting the procedure associated with the Green building program
36
Promotion of installation of charging facilities through tax breaks and financial assistance
Encouraging activates in cooperation with companies to help promote the implementation
of both EV’s and PHV’s
Test ride events to show that both EV’s and PHV’s can be used as everyday cars.
In addition to the introduction of EV’s and PHV’s the TMG is currently regulating harmful emissions
from Diesel engines (20). Diesel engines represent a mobile pollution source that travel across
administrative boundaries of various local governments. It should therefore be the task of the
national government to introduce anti-pollution measures, such as controls on automotive
emissions. The TMG launched a campaign to raise awareness on the reality of air pollution and
actions against diesel powered vehicles. This is what was called the "Say No to Diesel Vehicles"
campaign. The tide of Tokyo-initiated reforms, which started with the "Say No to Diesel Vehicles"
campaign has progressed ahead of the somewhat reluctant national government, and achieved
significant results in various areas, thereby transforming the way Japan deals with automotive
pollution.
Six oversights regarding the CO2 emissions from diesel vehicles by the national government
1. The National Government’s regulation to control the particulate matter (PM) emitted from
diesel engines is lagging behind that of the U.S. and E.U.
2. Failure to ensure early distribution of low sulphur diesel fuel, essential for PM reduction.
3. Turning its back on in-use diesel vehicles, a primary source of air pollution.
4. Postponement of the finally revised automotive NOX and PM Law, letting off old diesel
vehicles.
5. Preferential excise on diesel fuel increasing diesel-powered vehicles.
6. Lack of action on "illicit diesel fuel", which threatens the health of Tokyo’s citizens.
Six achievements of the TMG regarding CO2 emissions from diesel vehicles
1. Partnership of eight major jurisdictions and cities to implement diesel vehicle control.
2. Partnership with the Petroleum Association of Japan for early distribution of low sulphur
diesel fuel.
3. Practical application particulate matter reduction devices.
4. Collaboration with the industrial circle to accelerate the "New Long-Term Regulation" by two
years.
5. Promoting of clean and low-pollution trucks.
6. Coordinating with local governments across the nation to implement the "Illicit Diesel fuel
Eradication" campaign.

37
OTHER ENERGY / CO2 REDUCTION MEASURES IN TOKYO
The TMG are pursuing additional avenues to reduce the cities CO2 emissions and help negate the hot
island phenomenon which is apparent within the city. The TMG are working on these problems with
the utilisation of renewable energies, and increasing the greenery in the city.
Renewable Energy Utilisation
The utilisation of renewable energies is a significant component of energy conservation and global
warming. TMG promotes the introduction of renewable energy through the installation of wind
power generation facilities in coastal areas and large-scale photovoltaic power generation plants (21).
In 2003 the amount of renewable energies used in Tokyo amounted to 2.7% of the total amount of
energy consumed by the city. However by 2020 the TMG is seeking to increase this ratio to
approximately 20% of the total energy consumed. This target is similar to other countries and cities
like Germany and Britain 20%; EU 20%; and the state of California 33%. TMG’s 20% increase is built
not only on the premise of increasing renewable energy production but also reducing current energy
consumption rated in Tokyo. In order to drive the increase in production of renewable energies the
TMG must also implement schemes and mechanisms to increase the demand for such energies. The
mechanisms used to enhance the utilisation of renewable include: the disclosure of data on the use of
renewable energies by different corporations; and the introduction of regulations dictating a certain
percentage of energy supplied to large scale development projects must be from a renewable source.
The TMG is embarking on a series of projects to help enhance the demand for renewable energy
utilization:
Setting of clear rules on green power purchasing and promotion of its use
Projects with participation of citizens and communities to be introduced, to help renewable
energy use.
Promote energy conservation in conjunction with other national and local policies and
schemes.
Measures to enhance the utilization of household power generation for example solar
powered photovoltaic panels on the roof, etc.
Greenery
The preservation of the natural environment is of great importance in Tokyo as it is experiencing a
continued decrease of its greeneries with the progress of urbanisation. Securing a large amount of
quality greeneries contributes to mitigation of the “heat island effect” as well as the purification of
the air quality and storage of rainwater.

38
The TMG aims at restoring Tokyo to a city of lush greenery by encouraging each resident to take an
active interest in nurturing and protecting its greenery (22). For this scheme to be successful the
maintenance of the greenery must be tended to by its residents and companies in order to generate a
sense of nostalgia and gratitude towards their area within the city. There are three projects currently
operating to help enhance the greenery levels in Tokyo. These are:
Enhancing the green network by doubling roadside trees throughout the city. The number of
roadside trees in 2005 was 480,000 this number will be increased to about 700,000 by the
end of 2010 and then 1,000,000 by the end of 2015 (22)
Establishing community green hubs by intensive use of the school ground grassing project.
The TMG will promote turfing the grounds of public elementary and secondary schools as
well as kindergarten, nursery schools and private schools to create greenery close to the
children. The top level objective is to add more than 150 hectares of parkland to the city by
the end of 2010 which will be designed to function as green hubs, and to increase this
parkland to more than 300 hectares by the end of 2015 (22).
Use the ingenuity of Tokyo’s citizens to create and conserve greenery. For citizens to
recognise greenery as part of their lives and to enjoy its benefits, it is necessary to increase
the number of well-designed green areas that people can be around on a daily basis
wherever possible. Two projects which have been proposed to help instigate this greenery
movement are: the establishment of new green fund-raising schemes that would foster a
“donation culture” in Tokyo; and voluntary greening activities by private businesses and
organizations.

39
JAPAN’S LOW CARBON SOCIETY BY 2050
In 2007 the Cool Earth 50 initiative was presented. The initiative strives to make Japan a low carbon
society by 2050. Subsequently a “2050 Japan Low-Carbon Society” scenario team was formed (23).
The scenario team undertook a low-carbon society feasibility study and found that a reduction of 70%
CO2 emissions by 2050 from the emission levels in 1990 was achievable. Both urban and rural
scenarios were considered in the study. To achieve the proposed 70% reduction in CO2 emissions
both energy demand and supply need to be reduced. A 40% energy demand reduction is proposed
with the use of efficient appliances, insulated buildings, compact cities etc. A 30% energy supply
reduction is proposed with the utilization of nuclear, renewable and carbon capture and storage (CCS)
systems. In order to achieve these reductions technological innovations and social reform
programmes will need to be developed and coupled with policies and financial measures used to
support them.
Strategies for achieving Japan’s low-carbon society require not only short-to-medium-term views but
also approaches based on long-term and broad perspective back-casting views, which may involve
thorough use of energy efficient and environmental-friendly technologies and structural changes such
as switching to low-carbon infrastructure. Early actions are more likely to achieve a low-carbon
society than delayed actions because of the learning-by-doing effects of spreading technologies, the
necessary lead time for switching from the current infrastructure to low-carbon one, and
uncertainties that may cause delays in technology, research, and development (24). To achieve a low-
carbon society with cost-minimization, investments should be focused first on those actions that have
large rooms for future improvements in energy efficiency and costs reduction, such as energy
efficient devices in homes and offices, well-insulated houses and next-generation automobiles in the
transportation sector. It is essential for achieving Japan’s low-carbon society in 2050, to draw up the
target vision and take the first step in the correct direction by political leadership based on
quantitative analyses and long-term broad-ranging scientific knowledge. The following twelve actions
have been proposed to achieve this 70% reduction and have been labelled as “A Dozen Actions
Towards Low-Carbon Societies” (23).
Building/Residential Sector (Expected reduction 48-56 million tons of carbon (MtC))
1. Comfortable and green built environment
Efficient use of sunlight and energy efficient built environment design
Intelligent Buildings
2. Anytime, anywhere appropriate appliances:
Use of Top-runner and Appropriate appliances
Initial cost reduction by rent and release system resulting in improved availability

40
Industrial Sector (Expected reduction 30-35MtC)
3. Promoting seasonal local food
Supply of seasonal and safe local foods for local cuisine
4. Sustainable building materials
Using local and renewable building materials, for example timber
5. Corporate social responsibility for people and earth
Businesses aiming at creating and operating in low carbon market
Supplying low carbon and high value-added goods and services through energy efficient
production systems
Transportation Sector (Expected reduction 44-45MtC)
6. Swift and smooth logistics
Networking seamless logistics systems with supply chain management, using both
transportation and information communication technologies infrastructure
7. Pedestrian friendly city design
City design requiring short trips
Pedestrian and bike friendly transportation
Efficient and effective public transport
Energy Conservation Sector (Expected reduction 81-95MtC)
8. Low-carbon electricity
Supplying low-carbon electricity by large scale renewable, nuclear energy, and thermal
power with carbon capture and storage.
9. Local renewable resources for local demand
Enhanced local renewable use, such as solar, wind, biomass and others.
10. Next generation fuels
Development of carbon free hydrogen and biomass based energy supply systems with the
required infrastructure
Cross-Sectional (Expected reduction included in above estimates)
11. Labelling to encourage smart and rational choices
Publicising of energy use and CO2 costs information for smart choices of low carbon goods
12. Low carbon society leadership
Human resource development for building “Low-Carbon Society”
41
Japan’s Low-Carbon scenario team have compiled cost predictions to achieve this 70% CO2 reduction
by 2050. They have found a large investment is needed at the initial stage to achieve a low-carbon
society in 2050 by taking early actions. Particularly, the residential and commercial sector needs
an annual investment of 2.5 trillion JPY (22 billion EUR) a year from 2010 to 2025, and the
transportation sector needs 2.5 trillion from 2010 to 2015 (24). To put these figures in
perspective Japan’s GDP for 2007 was approximately 550 trillion JPY. It is believed that prompt
investment now for a low carbon society in 2050 will promote technological innovations as a
result of increased domestic demand. This will enhance international competitiveness of
domestic industries, because a low-carbon society is a global trend. If actions are delayed, other
nations, not only developed countries but also developing countries like China and India, are
likely to invest in low-carbon technologies, which will mature there and could adversely affect
Japanese industries. By 2050 the initial investments will have expanded Japan’s market,
improved efficiency and reduced costs and CO2 emissions. Table 4 shows a Gantt chart of the
proposed timeline for the implementation of the “Dozen Actions Towards Low-Carbon Society”.

42
Table 4: Gantt chart displaying the implementation times for the various economic sectors
Source) Japan low carbon society 2050 (24)

43
SUMMARY
Japan’s energy consumption improvement has come from governmental measures that
support energy conservation through the development of regulatory frameworks that
provide guidelines and set standards as well as by promoting R&D. Japan’s industrial sector
to date has achieved improved energy efficiency by optimizing their energy use, developing
innovative technologies and by voluntary action plans.
Still, Japan has a serious problem in fulfilling their commitment within the Kyoto Protocol.
The government finds that improving energy efficiency can contribute substantially to
reductions of carbon dioxide emissions in the short term. In order to achieve further
improvements the government tries to involve everybody. Therefore Japan wants to
increase the general awareness level, for example through extensive use of labels and
national campaigns. This also means that the government is demanding more and more not
only from industry but the entire society. Political reality has however would suggest that
like many Western countries, setting energy efficiency standards for industry, transport and
commercial buildings is far easier than imposing energy use limits on individual
householders. Having said that however, Japan has moved very far forward from the
introduction of the first Energy Conservation Act in 1979 and many of the its policies and
schemes could be directly transposed to other countries in urgent need of energy efficiency
legislation.
Japanese environmental policy has always been technologically driven; the policies to date
have been based on agreements between industry and government and the focus has been
to make business out of R&D. Technology has thus been the key to the development of
Japan’s economy and will also form a corner stone for Japan’s future.

44
REFERENCES
1. Revised Kyoto Protocol Target Achievement Plan. Ogawa, Junko. s.l. : The Institute of Electrical Engineers Japan, 2008.
2. Japan Energy Conservation Handbook 2009. The Energy Conservation Centre Japan. 2009, ECCJ publication, pp. 1-139.
3. New National Energy Strategy. Minister of Economy, Trade and Industry. s.l. : METI, 2006.
4. Law Concerning the Rational Use of Energy. Minister of Economy, Trade and Industry. 2006.
5. Kyoto Protocol, Japan. United Nations Framework Convention on Climate Change. 2002.
6. Energy Conservation Policy and Measures in Japan. Minister of Economy, Trade and Industry (METI) and Agency for Natural Resources and Energy (ANRE). s.l. : ECCJ, 2007.
7. Standards of Judgement for Factories and Workplaces on the Rational Use of Energy. Minister of Economy, Trade and Industry. s.l. : ECCJ, 2009.
8. Standards of Judgement for Construction Clients and Owners of Specified Buildings on the Rational Use of Energy for Buildings. Minister of Economy, Trade and Industry and Minister of Land, Infrastructure and Transportation. s.l. : ECCJ, 2009.
9. Country Report on Building Energy Codes in Japan. M. Evans, B. Shui, T. Takagi. s.l. : U.S. Department of Energy, 2009.
10. BREEAM - The Environmental Assessment Method for Buildings Around the World. Building Research Establishment. s.l. : BREEAM (www.breeam.org), 2009.
11. An Introduction to LEED. U.S. Green Building Council. s.l. : U.S. Green Building Council (www.usgbc.org), 2009.
12. Top Runner Program. Ministry of Economy, Trade and Industry (METI) and Agency for Natural Resources and Energy. s.l. : ECCJ, 2010.
13. Fact sheet of the Keidanren Voluntary Action Plan. Kiko Network. s.l. : Kiko Network, 2007.

45
14. Annual Report on the Environment and the Sound Material-Cycle Society in Japan. Ministry of Environment. 2007.
15. Japan's National Climate Policies and Actions. Environment, Ministry of. 2007.
16. Japan’s Policies to Deal with GlobalWarming. The Energy Conservation Center Japan. 2008.
17. Tokyo Cap - and - Trade Program. Bureau of the Environment. s.l. : Tokyo Metropolitan Government, 2010.
18. Outlinr of the Tokyo Green Building Program Under the Tokyo Metropolitian Environmental Security Ordinance. Bureau of the Environment. s.l. : Tokyo Metropolitian Government, 2005.
19. Tokyo Metropolitan Government Starts the Project to Promote Widespread Use of EVs and pHVs. Bureau of the Environment. s.l. : Tokyo Metropolitan Government, 2009.
20. Introducing Diesel Vehicle Control. Bureau of Environment. s.l. : Tokyo Metropolitan Governmen.
21. Formulation of Tokyo Renewable Energy Strategy. Bureau of Environment. s.l. : Tokyo Metropolitan Government, 2006.
22. Basic Policies for the 10-Year Project for Green Tokyo. Bureau of Environment. s.l. : Tokyo Metropolitan Government, 2007.
23. Japan Scenarios and Actions towards Low-Carbon Societies. Japan Low Carbon Society 2050. 2008.
24. Japan Roadmaps towards Low-Carbon Societies. Japan Low Carbon Society 2050. 2009.
25. Energy Conservation Act, Japan, Act on the Rational Use of Energy, Act No. 49 of June 22nd, 1979.
26. Japan Energy Conservation Handbook 2010. The Energy Conservation Centre Japan. 2010, ECCJ publication, pp. 1-148.

![Towards optimum energy performance measures …...of the country’s budget [10]. 4 Energy efficiency and renewable energy measures One way to foster energy efficiency in the hotel](https://img.dokumen.tips/doc/110x75/5f3a07ad1347a60c1e2f4666/towards-optimum-energy-performance-measures-of-the-countryas-budget-10.jpg)